Corporate Update - Mellanox TechnologiesExadata (database in-memory appliance) Exalytics (Big Data)...
26
© 2012 MELLANOX TECHNOLOGIES 1 Corporate Update November 2012 Mellanox Interconnect Boosts Business Performance Eyal Waldman President, Chairman, and CEO Jacob Shulman Chief Financial Officer
Transcript of Corporate Update - Mellanox TechnologiesExadata (database in-memory appliance) Exalytics (Big Data)...

© 2012 MELLANOX TECHNOLOGIES 1
Corporate Update November 2012
Mellanox Interconnect Boosts Business Performance
Eyal Waldman
President, Chairman, and CEO
Jacob Shulman
Chief Financial Officer

© 2012 MELLANOX TECHNOLOGIES 2
Safe Harbor Statement
These slides and the accompanying oral presentation contain forward-looking statements and
information.
The use of words such as “may”, “might”, “will”, “should”, “expect”, “plan”, “anticipate”,
“believe”, “estimate”, “project”, “intend”, “future”, “potential” or “continued”, and other similar
expressions are intended to identify forward-looking statements.
All of these forward-looking statements are based on estimates and assumptions by our
management that, although we believe to be reasonable, are inherently uncertain. Forward-
looking statements involve risks and uncertainties, including, but not limited to, economic,
competitive, governmental and technological factors outside of our control, that may cause
our business, industry, strategy or actual results to differ materially from the forward-looking
statement.
These risks and uncertainties may include those discussed under the heading “Risk Factors”
in the Company’s most recent 10K and 10Q’s on file with the Securities and Exchange
Commission, and other factors which may not be known to us. Any forward-looking statement
speaks only as of its date. We undertake no obligation to publicly update or revise any
forward-looking statement, whether as a result of new information, future events or otherwise,
except as required by law.

© 2012 MELLANOX TECHNOLOGIES 3
Data Centers are built using compute and storage systems
Compute and storage systems are based on three building blocks • Central Processing Unit (CPU)
• Memory (both DRAM and Flash)
• Input / Output (I/O)
The CPU, memory and I/O must be balanced • Otherwise deficiencies are introduced
Intel Romley, flash storage, virtualization, and clustering require
low-latency interconnects with 40Gb/s or greater throughput
The Need for Fast Interconnect in Data Centers

© 2012 MELLANOX TECHNOLOGIES 4
CPU technology development demands high-performance interconnect
Low-performance interconnects limit your competitive advantage
Interconnect Impacts Data Center Business Value
Balanced System = Uncompromised Performance
VPI – Virtual Protocol Interconnect (Ethernet and InfiniBand)

© 2012 MELLANOX TECHNOLOGIES 5
Interconnect Impacts Data Center Business Value
Maximum Applications Performance, Highest ROI
10 Years Performance Improvement
CPU Virtual Protocol Interconnect Ethernet
100X 100X 10X
VPI – Virtual Protocol Interconnect (Ethernet and InfiniBand)

© 2012 MELLANOX TECHNOLOGIES 6
Mellanox Connects the Most Efficient Data Centers
Enables the best return-on-investment for compute and storage
platforms • By providing leading InfiniBand and Ethernet interconnects
- Lowest latency and highest bandwidth
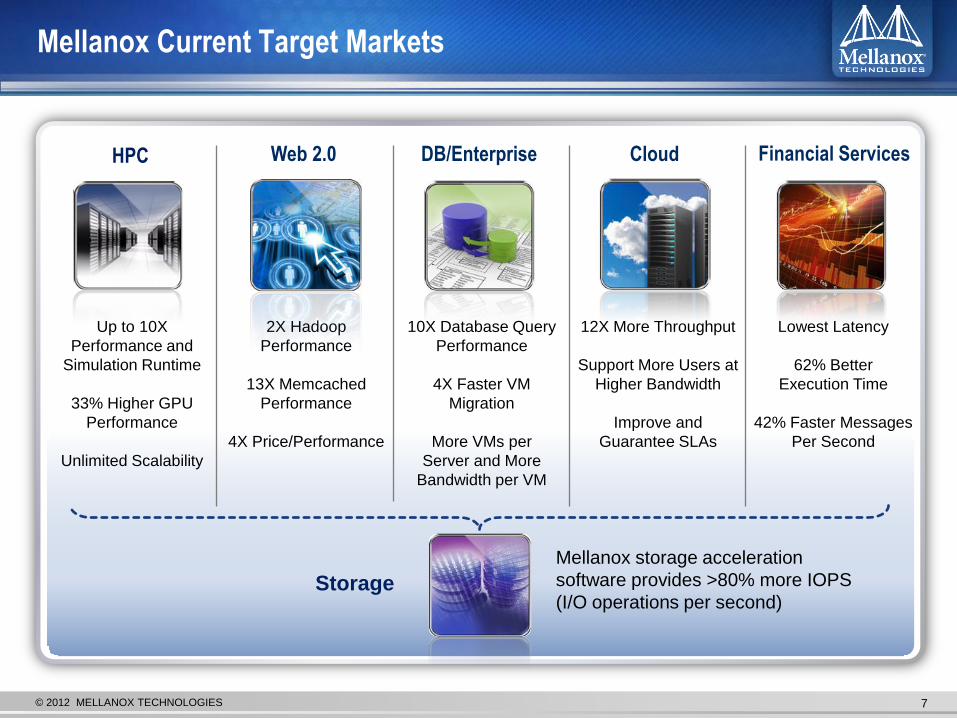
© 2012 MELLANOX TECHNOLOGIES 7
Mellanox Current Target Markets
Web 2.0 DB/Enterprise HPC
Up to 10X
Performance and
Simulation Runtime
33% Higher GPU
Performance
Unlimited Scalability
Lowest Latency
62% Better
Execution Time
42% Faster Messages
Per Second
Financial Services Cloud
12X More Throughput
Support More Users at
Higher Bandwidth
Improve and
Guarantee SLAs
10X Database Query
Performance
4X Faster VM
Migration
More VMs per
Server and More
Bandwidth per VM
Storage
2X Hadoop
Performance
13X Memcached
Performance
4X Price/Performance
Mellanox storage acceleration
software provides >80% more IOPS
(I/O operations per second)

© 2012 MELLANOX TECHNOLOGIES 8
InfiniBand is the most used interconnect
on the June 2012 TOP500 list
• Positioned to expand in Cloud and Web 2.0
• 210 systems, 42% of the TOP500 list
InfiniBand is the most used interconnect
for Petascale systems
• Mellanox InfiniBand is the only Petascale-
proven solution
High-Performance Computing Market Leadership
FDR InfiniBand Provides Extreme Performance
187 Teraflops with ONLY 648 Servers
Half the server count, double the performance
from prior cluster
FDR InfiniBand Maximizes Server and Storage System Potential
FDR InfiniBand connected systems
increased 10X on the June TOP500
compared to the November 2011 list
• From 2 systems to 21 systems
• FDR InfiniBand connects the fastest
InfiniBand system on the list : #4 LRZ
© 2012 MELLANOX TECHNOLOGIES 9
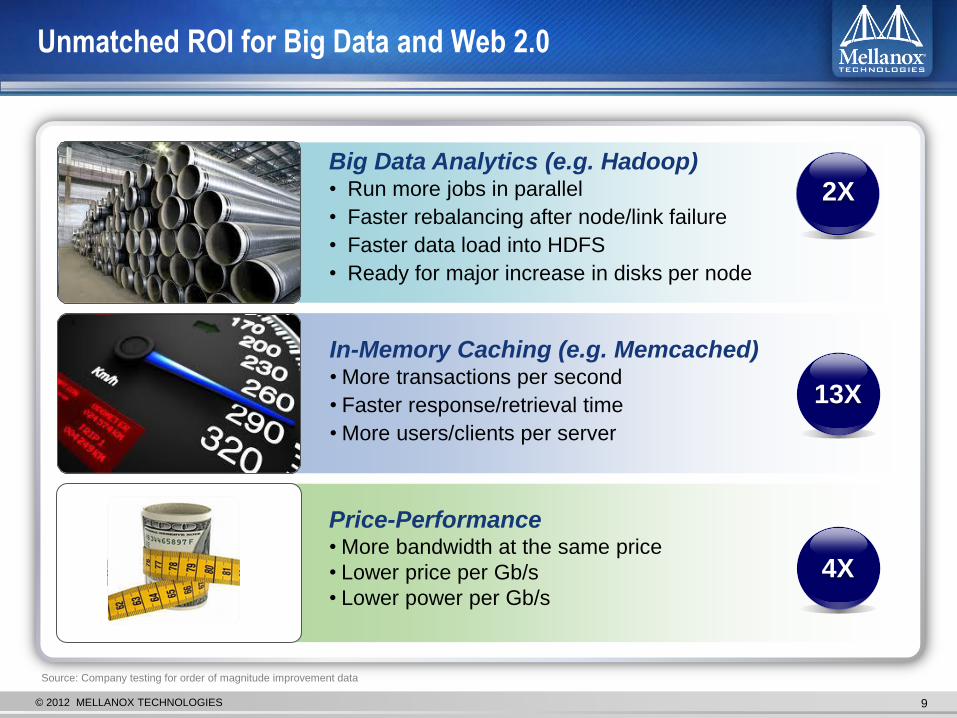
Unmatched ROI for Big Data and Web 2.0
Big Data Analytics (e.g. Hadoop) • Run more jobs in parallel
• Faster rebalancing after node/link failure
• Faster data load into HDFS
• Ready for major increase in disks per node
In-Memory Caching (e.g. Memcached) • More transactions per second
• Faster response/retrieval time
• More users/clients per server
Price-Performance
• More bandwidth at the same price
• Lower price per Gb/s
• Lower power per Gb/s
Source: Company testing for order of magnitude improvement data
2X
13X
4X

© 2012 MELLANOX TECHNOLOGIES 10
High-performance system to support
map image processing
10X performance improvement
compared to previous systems
Half the cost compared to 10GbE
Mellanox end-to-end InfiniBand
40Gb/s interconnect solutions
50% CAPEX Reduction for Bing Maps
Cost-Effective Accelerated Web 2.0 Services

© 2012 MELLANOX TECHNOLOGIES 11
Exadata (database in-memory appliance) Exalytics (Big Data)
Exalogic (cloud computing appliance) ZFS (storage over InfiniBand)
SuperCluster (Data Center in a box)
10X Performance with Mellanox for Oracle
Reduced hardware costs
by a factor of 5X
Improved performance
by a factor of 10X
Superior Database and Cloud Interconnect Performance
Accelerated and Connected by Mellanox End-to-End InfiniBand Solutions

© 2012 MELLANOX TECHNOLOGIES 12
Mellanox Interconnect, Standard for Storage and Database
Oracle ZFS
IBM XIV Storage System
Power to serve even more
applications from a single
system
95% Efficiency and Scalability
EMC Isilon
Scale out Network
Attached Storage

© 2012 MELLANOX TECHNOLOGIES 13
Multi-Billion Dollar Total Available Market
1.5M Virtualized 2.3M in 2014, 19% CAGR
0.7M in 2014, 5% CAGR
1.7M HPC 2.0M in 2014, 8% CAGR
2.8M Front End 3.0M in 2014 , 8% CAGR
1.2M Back End 1.8M in 2014, 18% CAGR
Servers
8.6M1
Storage
4.0M2
Embedded
0.6M3
13.2M+4 End Points = $5.3B TAM5 in 2012 15.1M4 end points available in 2014
2.3M Web2.0 & Cloud 3.4M in 2014, 16% CAGR
Source: 1 IDC, Gartner, and Company estimates.
Includes units for all server end-markets, including
HPC, Virtualized, Web 2.0, Cloud and other end
markets; 2 IDC, Gartner and Company estimates; 3
Company estimates; 4 Includes units for all server,
storage, and embedded end markets; 5 Assumes
$400 ASP per unit

© 2012 MELLANOX TECHNOLOGIES 14
Top Tier OEMs, ISVs and Distribution Channels
Hardware OEMs Software Partners Selected Channel Partners
Medical
Server
Storage
Embedded

© 2012 MELLANOX TECHNOLOGIES 15
Mellanox Interconnect Products Enable Customer Choice
10Gb/s, 40Gb/s, 56Gb/s
Ethernet and InfiniBand
10Gb/s, 40Gb/s, 56Gb/s
Ethernet and InfiniBand
Application
Acceleration
• Big Data
• Storage
• TCP/UDP
Adapters Switches Software
• Database
• Trading
• HPC
Virtual Protocol Interconnect (VPI) Provides High Performance over
any Converged Interconnect with Same Software Infrastructure
Cables
10Gb/s, 40Gb/s, 56Gb/s
Ethernet and InfiniBand

© 2012 MELLANOX TECHNOLOGIES 16
Virtual Protocol Interconnect (VPI) Technology
64 ports 10GbE
36 ports 40GbE
48 10GbE + 12 40GbE
36 ports IB up to 56Gb/s
8 VPI subnets
Switch OS Layer
Mezzanine Card
VPI Adapter VPI Switch
Ethernet: 10/40 Gb/s
InfiniBand:10/20/40/
56 Gb/s
Unified Fabric Manager
Networking Storage Clustering Management
Applications
Acceleration Engines
LOM Adapter Card
3.0
© 2012 MELLANOX TECHNOLOGIES 17
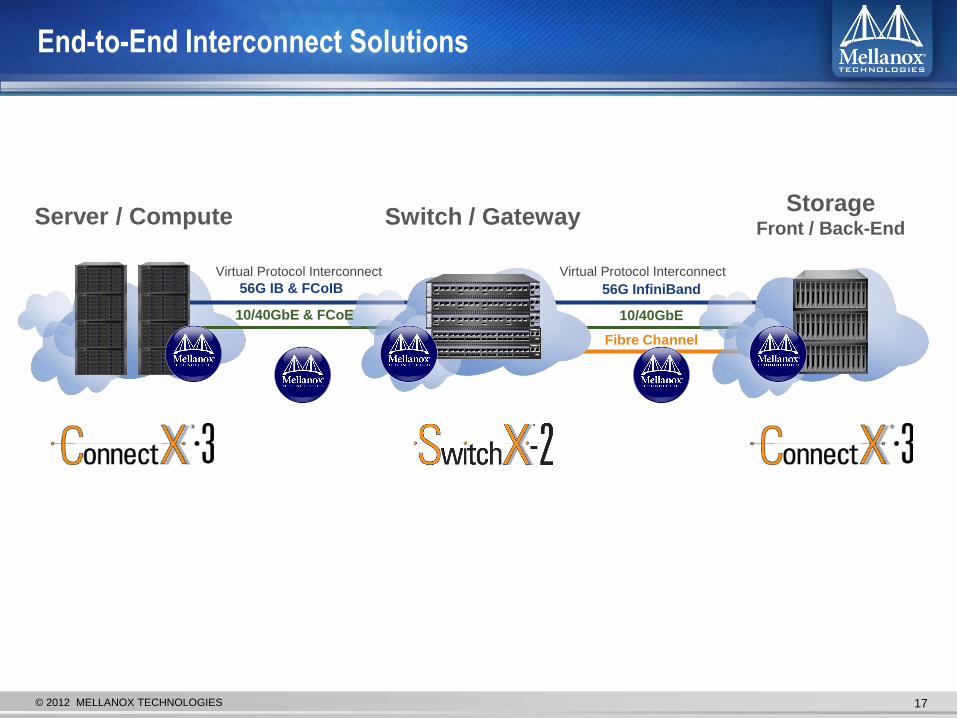
End-to-End Interconnect Solutions
Virtual Protocol Interconnect
Storage Front / Back-End
Server / Compute Switch / Gateway
56G IB & FCoIB 56G InfiniBand
10/40GbE & FCoE 10/40GbE
Fibre Channel
Virtual Protocol Interconnect

© 2012 MELLANOX TECHNOLOGIES 18
Leading Interconnect, Leading Performance
Latency
5usec
2.5usec 1.3usec
0.7usec
<0.5usec
160/200Gb/s
100Gb/s
56Gb/s
40Gb/s 20Gb/s
10Gb/s 2001 2002 2003 2004 2005 2006 2007 2008 2009 2010 2011 2012 2013 2014 2015 2016 2017
2001 2002 2003 2004 2005 2006 2007 2008 2009 2010 2011 2012 2013 2014 2015 2016 2017
Bandwidth
Same Software Interface
0.5usec
© 2012 MELLANOX TECHNOLOGIES 19
Financial Overview
Jacob Shulman
CFO
© 2012 MELLANOX TECHNOLOGIES 20
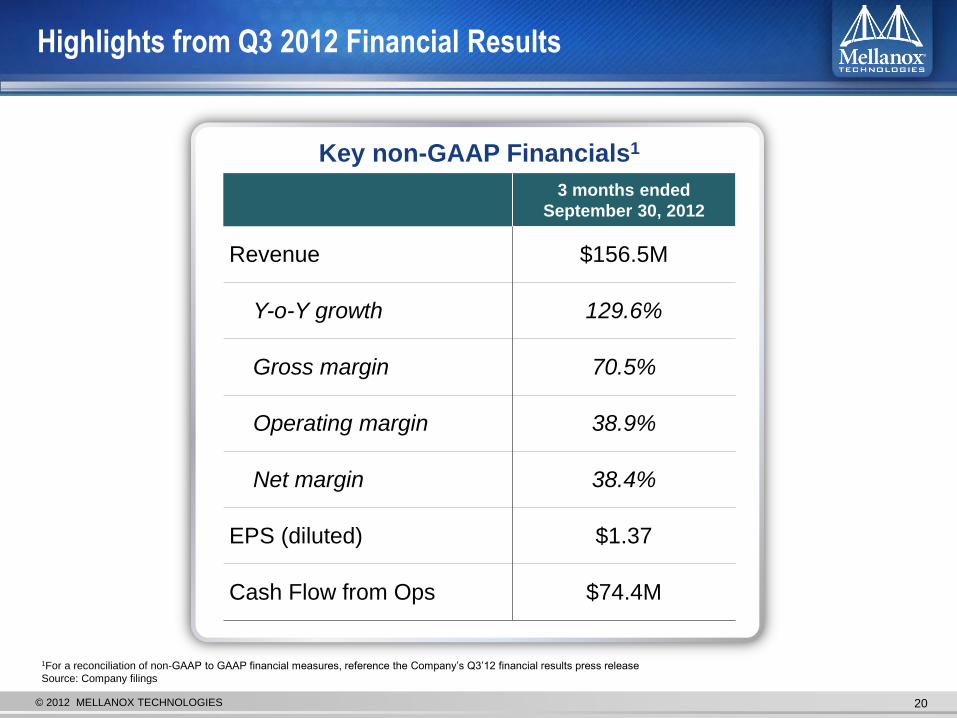
Highlights from Q3 2012 Financial Results
Key non-GAAP Financials1
3 months ended
September 30, 2012
Revenue $156.5M
Y-o-Y growth 129.6%
Gross margin 70.5%
Operating margin 38.9%
Net margin 38.4%
EPS (diluted) $1.37
Cash Flow from Ops $74.4M
1For a reconciliation of non-GAAP to GAAP financial measures, reference the Company’s Q3’12 financial results press release
Source: Company filings

© 2012 MELLANOX TECHNOLOGIES 21
Source: Company financial statements
Historical Annual Revenue Growth
CAGR over the past 5 years ~ 44%
28.1% 7.7% 33.3%
Annual Revenue ($M)
67.6% YoY%
2009 2010 2011 2008
8.1 107.7 116 154.6
259.3
103.0%E
2012E*
526.2*
*2012E includes YTD 2012 actuals through Q3 plus the midpoint of Q4 guidance

© 2012 MELLANOX TECHNOLOGIES 22
1Includes midpoint of 4Q12 guidance; Source: Company financial statements
Historical Quarterly Revenue Growth
Quarterly Revenue ($M)
72.7
Q1 Q2 Q3 Q4 Q1 Q2 Q3 Q4 Q1 Q2 Q3 Q4 Q1 Q2 Q3 Q4 Q1 Q2 Q3
2008 2009 2010 2011 2012
25.2 28.2 29.1
25.2 22.9
25.3
32.7 35.5 36.2
40.0 37.8
40.7
55.1
63.3
68.2
72.7
4Q’12 Guidance
88.7
133.5
145-150
Q41
156.5

© 2012 MELLANOX TECHNOLOGIES 23
Cash Flow from Ops ($M)
Positive Cash Flow from Operations
1Cash and investments include $7.6m in restricted cash
Cash and Investments @ September 30, 2012 = $405.4M1
31.0 32.8 41.2
63.1
2010 2011 2009 2008 YTD 2012
157.1

© 2012 MELLANOX TECHNOLOGIES 24
Percentage-Based Income Statement (Non-GAAP1)
1For a reconciliation of non-GAAP to GAAP financial measures, please reference the Company’s Q3’12 financial results press release
Source: Company financial statements
Q3’ 2012
Actual
Revenue 100%
Gross Margin 71%
R&D 20%
SG&A 12%
Operating Income 39%
Net Income 38%
Long term model
100%
65% - 69%
26% - 30%
15% - 18%
22% - 28%
21% - 27%
Attractive Margin Profile (Non-GAAP)
Strategy is to drive revenue and earnings growth rates with end-to-end solutions,
expanded distribution channels and enhanced product offerings

© 2012 MELLANOX TECHNOLOGIES 25
Interconnect technology is critical for business performance • Increases application productivity and ROI
Interconnect market has shown consistent growth • In HPC, Web 2.0, Storage, Database, Cloud and Big Data markets
Mellanox uniquely positioned to continue leading the market • Provider of fastest interconnect technology currently available
• Strong partnerships, channel relationships
• Providing compelling benefits to multiple, high growth markets
Demonstrated revenue growth, strong cash flow and increasing
profitability with attractive gross margins • Solid revenue growth (~44% CAGR) over the last 5 years
• Products address large $5.3 Billion TAM
Investment Highlights Summary

© 2012 MELLANOX TECHNOLOGIES 26
Thank You