Corporate Update January 21, 2016
34
TSX–NYSE MKT: RIC POSITIONING FOR SUSTAINABLE GROWTH Corporate Update January 2016
-
Upload
richmontir -
Category
Economy & Finance
-
view
7.521 -
download
3
Transcript of Corporate Update January 21, 2016

TSX–NYSE MKT: RIC
POSITIONING FOR SUSTAINABLE GROWTH
Corporate Update
January 2016
www.richmont-mines.com 2 RIC: TSX NYSE-MKT
FORWARD LOOKING STATEMENTS
Safe Harbor Statement & Cautionary Note to U.S. Investors Concerning
Resource Estimates
This presentation contains forward-looking statements that include risks and uncertainties. The factors that could
cause actual results to differ materially from those indicated in such forward-looking statements include changes in the
prevailing price of gold, the Canadian-U.S. exchange rate, grade of ore mined and unforeseen difficulties in mining
operations that could affect revenue and production costs. Other factors such as uncertainties regarding government
regulations could also affect the results. Other risks may be detailed from time to time in Richmont Mines Inc.’s
periodic reports and annual notice.
The resource estimates in this presentation were prepared in accordance with NI 43-101 adopted by the Canadian
Securities Administrators. The requirements of NI 43-101 differ significantly from the requirements of the United States
Securities and Exchange Commission (the “SEC”). In this presentation, we use the terms “Measured”, “Indicated” and
“Inferred” Resources. Although these terms are recognized and required to be used in Canada, the SEC does not
recognize them. The SEC permits U.S. mining corporations, in their filings with the SEC, to disclose only those mineral
deposits that constitute “Reserves”. Under United States standards, mineralization may not be classified as a Reserve
unless the determination has been made that the mineralization could be economically and legally extracted at the time
the determination is made. United States investors should not assume that all or any portion of a Measured or
Indicated Resource will ever be converted into “Reserves”. Furthermore, “Inferred Resources” have a great amount of
uncertainty as to their existence and whether they can be mined economically or legally, and United States investors
should not assume that “Inferred Resources” exist or can be legally or economically mined, or that they will ever be
upgraded to a more certain category.
U.S. Investors are urged to consider the disclosure in our annual report on Form 20-F, File No. 001-14598, which may
be obtained from us or from the SEC’s web site: http://sec.gov/edgar.shtml.
(All amounts are in Canadian dollars, unless otherwise indicated.)
www.richmont-mines.com 3 RIC: TSX NYSE-MKT
RICHMONT MINES OVERVIEW
Quality Asset Base in Canada
Growing Production Profile
Decreasing Cost Structure
Growing Cash Flow Streams
Significant Exploration Potential
Strong Balance Sheet
Favourable Canadian Dollar Exposure
Low Shares Outstanding (58M)

www.richmont-mines.com 4 RIC: TSX NYSE-MKT
CAPITAL STRUCTURE
Capital Structure(1)
Issued & Outstanding Shares 58.1M
Options 4.2M
Fully Diluted 62.5M
Cash(1) C$61
Total Debt(1)(2) C$6M
Ticker RIC:TSX–NYSE
Market Capital (Jan. 11/16) C$280M
(1) As of Sept. 30, 2015
(2) Long-term debt is comprised of capital lease obligations
$61M CASH
$6M DEBT
Analyst Coverage
CIBC Kevin Chiew
Macquarie Capital Markets Michael Gray
National Bank Financial Adam Melnyk
PI Financial Brian Szeto
TD Securities Daniel Earle
Paradigm Capital Don Blyth
Cormark Securities Kyle MacPhee
Mackie Research Ryan Hanley
RIC (as of Jan. 11, 2016)
TSX
C$
NYSE MKT
US$
Closing price $4.81 $3.41
52-week range $3.14-$5.27 $2.27-$3.75
Market Cap (M’s) $280M $199M
3-month daily trading avg. 86,315 195,657

www.richmont-mines.com 5 RIC: TSX NYSE-MKT
SOLID PERFORMANCE AND ORGANIC GROWTH
Q4
2015 2015
2015
Guidance
Gold produced (oz) 22,380 98,031 87,000-95,000
Gold sold (oz) 21,576 96,895 -
Q3
2015
9-months
2015
2015
Guidance
Cash cost per oz. (CAN$)(1)(2) $926 $961 $935-$1,035
AISC (CAN$)(1)(2) $1,311 $1,290 $1,335-$1,490
Cash cost per oz. (US$)(1)(2) $707 $763 $750-$825
AISC (US$)(1)(2) $1,001 $1,024 $1,075-$1,190
(1) Fourth quarter and annual cash cost per ounce and AISC will be reported as part of the Corporation’s fourth
quarter and annual financial results on Feb. 22, 2016.
(2) Refer to the Non-GAAP performance measures contained in the Q3 MD&A.
-
200
400
600
800
1,000
1,200
40,000
50,000
60,000
70,000
80,000
90,000
100,000
FY-15 FY-16 FY-17 FY-18
Ca
sh
co
sts
pe
r o
z. (C
AD
$)
Go
ld P
rod
uctio
n (o
z)
Source: ThomsonOne Consensus Data
Production (oz) Cash Costs (CAD$/oz)
Growing Production - Decreasing Cash Costs
0.00
0.20
0.40
0.60
0.80
1.00
1.20
FY-15 FY-16 FY-17 FY-18
Ca
sh
Flo
w p
er
sh
are
(C
$)
Source: ThomsonOne Consensus Data (Dec. 31/15)
OCF/PS
Growing Cash Flow Streams
www.richmont-mines.com 6 RIC: TSX NYSE-MKT
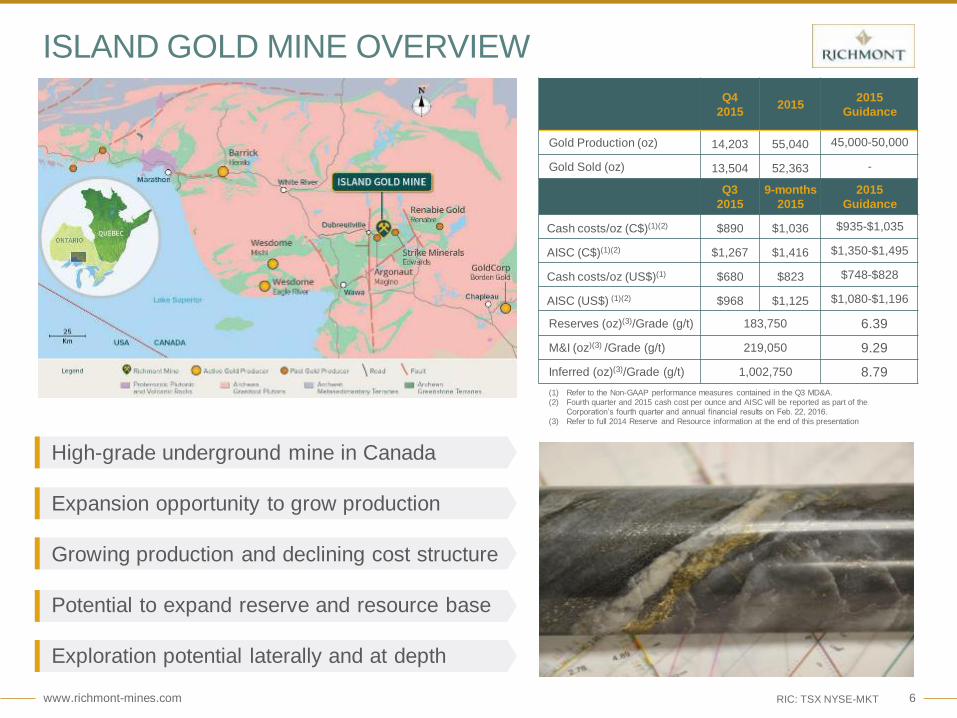
ISLAND GOLD MINE OVERVIEW
High-grade underground mine in Canada
Expansion opportunity to grow production
Growing production and declining cost structure
Potential to expand reserve and resource base
Exploration potential laterally and at depth
Q4
2015 2015
2015
Guidance
Gold Production (oz) 14,203 55,040 45,000-50,000
Gold Sold (oz) 13,504 52,363 -
Q3
2015
9-months
2015
2015
Guidance
Cash costs/oz (C$)(1)(2) $890 $1,036 $935-$1,035
AISC (C$)(1)(2) $1,267 $1,416 $1,350-$1,495
Cash costs/oz (US$)(1) $680 $823 $748-$828
AISC (US$) (1)(2) $968 $1,125 $1,080-$1,196
Reserves (oz)(3)/Grade (g/t) 183,750 6.39
M&I (oz)(3) /Grade (g/t) 219,050 9.29
Inferred (oz)(3)/Grade (g/t) 1,002,750 8.79
(1) Refer to the Non-GAAP performance measures contained in the Q3 MD&A. (2) Fourth quarter and 2015 cash cost per ounce and AISC will be reported as part of the
Corporation’s fourth quarter and annual financial results on Feb. 22, 2016.
(3) Refer to full 2014 Reserve and Resource information at the end of this presentation
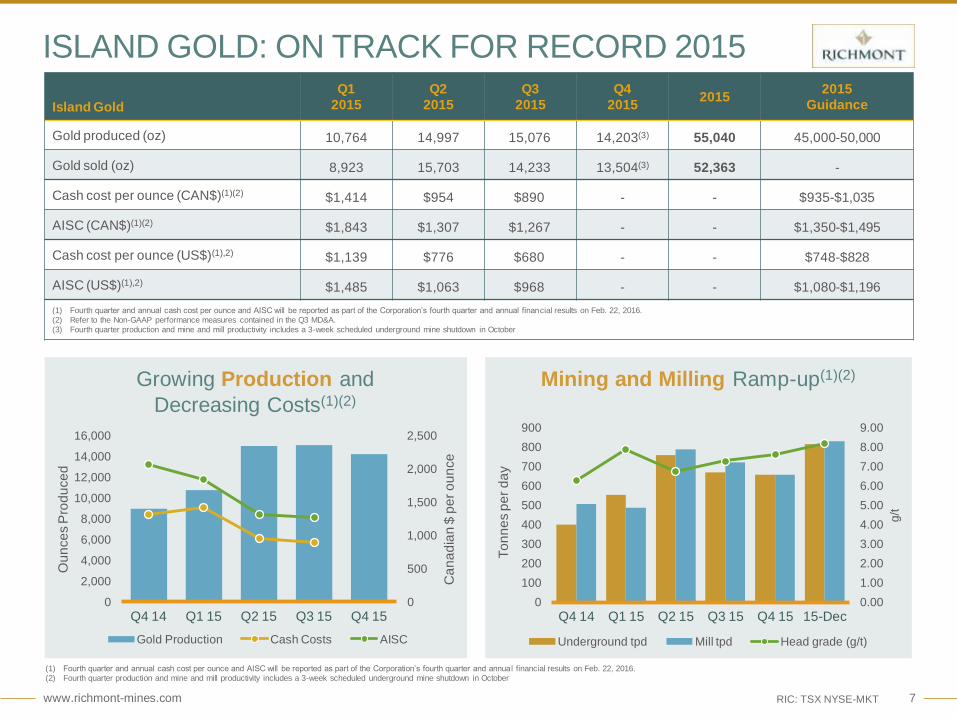
www.richmont-mines.com 7 RIC: TSX NYSE-MKT
Growing Production and
Decreasing Costs(1)(2)
Mining and Milling Ramp-up(1)(2)
ISLAND GOLD: ON TRACK FOR RECORD 2015
0
500
1,000
1,500
2,000
2,500
0
2,000
4,000
6,000
8,000
10,000
12,000
14,000
16,000
Q4 14 Q1 15 Q2 15 Q3 15 Q4 15
Ca
na
dia
n $
pe
r o
un
ce
Ou
nce
s P
rod
uce
d
Gold Production Cash Costs AISC
0.00
1.00
2.00
3.00
4.00
5.00
6.00
7.00
8.00
9.00
0
100
200
300
400
500
600
700
800
900
Q4 14 Q1 15 Q2 15 Q3 15 Q4 15 15-Dec
g/t
To
nn
es p
er
da
y
Underground tpd Mill tpd Head grade (g/t)
Island Gold
Q1
2015
Q2
2015
Q3
2015
Q4
2015 2015
2015
Guidance
Gold produced (oz) 10,764 14,997 15,076 14,203(3) 55,040 45,000-50,000
Gold sold (oz) 8,923 15,703 14,233 13,504(3) 52,363 -
Cash cost per ounce (CAN$)(1)(2) $1,414 $954 $890 - - $935-$1,035
AISC (CAN$)(1)(2) $1,843 $1,307 $1,267 - - $1,350-$1,495
Cash cost per ounce (US$)(1),2) $1,139 $776 $680 - - $748-$828
AISC (US$)(1),2) $1,485 $1,063 $968 - - $1,080-$1,196
(1) Fourth quarter and annual cash cost per ounce and AISC will be reported as part of the Corporation’s fourth quarter and annual financial results on Feb. 22, 2016.
(2) Refer to the Non-GAAP performance measures contained in the Q3 MD&A.
(3) Fourth quarter production and mine and mill productivity includes a 3-week scheduled underground mine shutdown in October
(1) Fourth quarter and annual cash cost per ounce and AISC will be reported as part of the Corporation’s fourth quarter and annua l financial results on Feb. 22, 2016.
(2) Fourth quarter production and mine and mill productivity includes a 3-week scheduled underground mine shutdown in October

www.richmont-mines.com 8 RIC: TSX NYSE-MKT
Underground Mine Productivity Mill Productivity
ISLAND GOLD: POSITIONING FOR GROWTH
0.0
1.0
2.0
3.0
4.0
5.0
6.0
7.0
8.0
9.0
10.0
0
100
200
300
400
500
600
700
800
900
Q4 14 Q1 15 Q2 15 Q3 15 Q4 15 15-Dec PEA
Base Case
Gra
ms p
er
ton
ne
To
nn
es p
er
da
y
Underground tpd Head grade (g/t)
0.0%
20.0%
40.0%
60.0%
80.0%
100.0%
120.0%
0
100
200
300
400
500
600
700
800
900
Q4 14 Q1 15 Q2 15 Q3 15 Q4 15 15-Dec PEA
Base Case
Re
co
verie
s (%
)
To
nn
es p
er
Da
y
Mill tpd Recoveries (%)
Island Gold
Q1
2015
Q2
2015
Q3
2015
Q4
2015 2015
Underground tpd 552 759 669 657(2) 659
Mill tonnes 43,785 71,584 66,416 60,352 242,137
Mill tpd 487 787 722 656(2) 663
Head grade (g/t) 7.87 6.73 7.27 7.62 7.31
Recoveries (%) 97.19 96.78 97.12 96.00 96.80
Sustaining Costs ($000’S)(1) 3,828 5,555 5,371 - -
Project and non-sustaining exploration costs ($000’s)(1) 4,739 5,151 8,234 - -
(1) Fourth quarter and annual capital investment will be reported as part of the Corporation’s fourth quarter and annual financia l results on Feb. 22, 2016.
(2) Fourth quarter production and mine and mill productivity includes a 3-week scheduled underground mine shutdown in October
Fourth quarter production and mine and mill productivity includes a 3-week scheduled underground mine shutdown in October
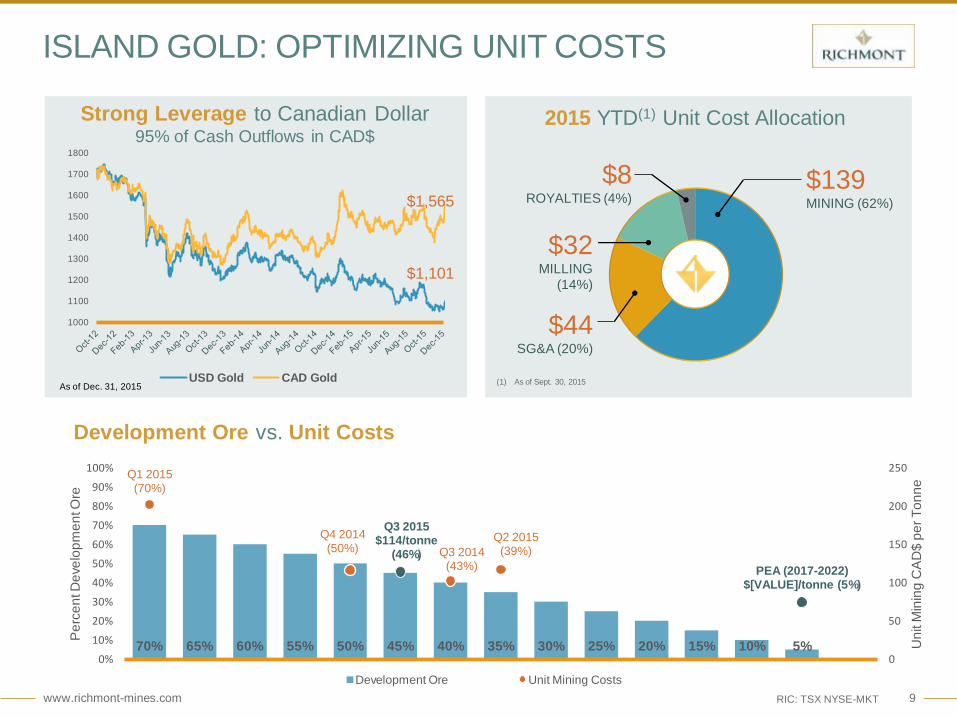
www.richmont-mines.com 9 RIC: TSX NYSE-MKT
Development Ore vs. Unit Costs
$1,101
$1,565
1000
1100
1200
1300
1400
1500
1600
1700
1800
As of Dec. 31, 2015 USD Gold CAD Gold
ISLAND GOLD: OPTIMIZING UNIT COSTS
$44 SG&A (20%)
2015 YTD(1) Unit Cost Allocation
$139 MINING (62%)
$32 MILLING
(14%)
$8 ROYALTIES (4%)
Strong Leverage to Canadian Dollar 95% of Cash Outflows in CAD$
70% 65% 60% 55% 50% 45% 40% 35% 30% 25% 20% 15% 10% 5%
Q1 2015 (70%)
Q4 2014 (50%)
Q3 2015 $114/tonne
(46%) Q3 2014 (43%)
Q2 2015 (39%)
PEA (2017-2022) $[VALUE]/tonne (5%)
0
50
100
150
200
250
0%
10%
20%
30%
40%
50%
60%
70%
80%
90%
100%
Un
it M
inin
g C
AD
$ p
er
To
nn
e
Pe
rce
nt D
eve
lop
me
nt O
re
Development Ore Unit Mining Costs
(1) As of Sept. 30, 2015
www.richmont-mines.com 10 RIC: TSX NYSE-MKT
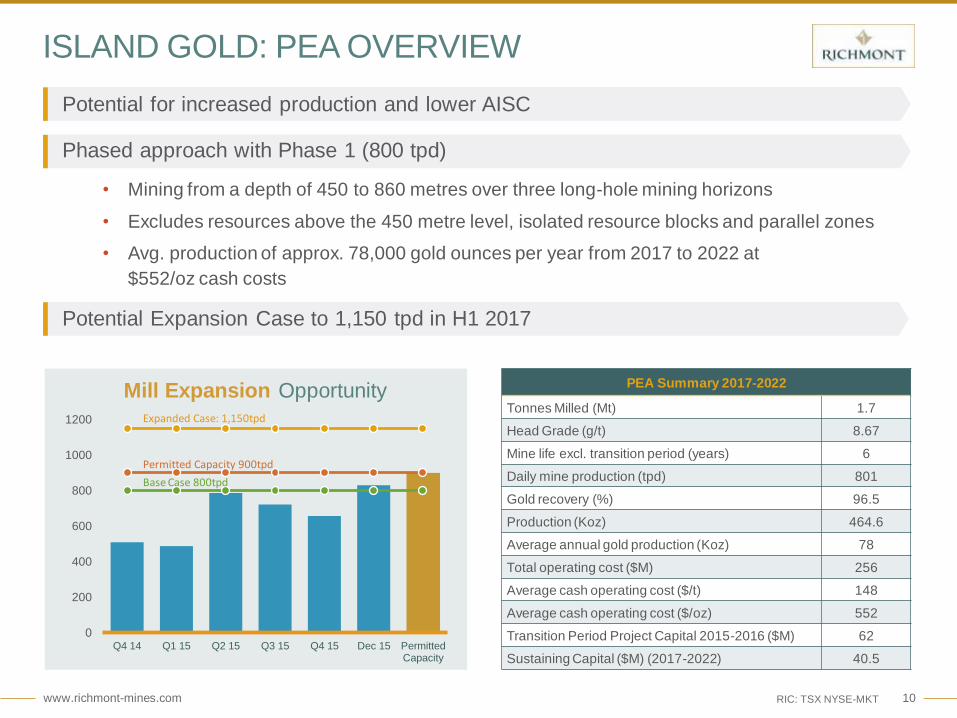
ISLAND GOLD: PEA OVERVIEW
• Potential for increased production and lower AISC
0
200
400
600
800
1000
1200
Q4 14 Q1 15 Q2 15 Q3 15 Q4 15 Dec 15 Permitted Capacity
Permitted Capacity 900tpd
Base Case 800tpd
• Phased approach with Phase 1 (800 tpd)
• Mining from a depth of 450 to 860 metres over three long-hole mining horizons
• Excludes resources above the 450 metre level, isolated resource blocks and parallel zones
• Avg. production of approx. 78,000 gold ounces per year from 2017 to 2022 at
$552/oz cash costs
• Potential Expansion Case to 1,150 tpd in H1 2017
PEA Summary 2017-2022
Tonnes Milled (Mt) 1.7
Head Grade (g/t) 8.67
Mine life excl. transition period (years) 6
Daily mine production (tpd) 801
Gold recovery (%) 96.5
Production (Koz) 464.6
Average annual gold production (Koz) 78
Total operating cost ($M) 256
Average cash operating cost ($/t) 148
Average cash operating cost ($/oz) 552
Transition Period Project Capital 2015-2016 ($M) 62
Sustaining Capital ($M) (2017-2022) 40.5
Mill Expansion Opportunity Expanded Case: 1,150tpd

www.richmont-mines.com 11 RIC: TSX NYSE-MKT
ISLAND GOLD MINE: PEA BASE CASE (800TPD)
Developing deeper resource to create substantial long-term growth.

www.richmont-mines.com 12 RIC: TSX NYSE-MKT
ISLAND GOLD MINE: PEA BASE CASE (800TPD)
www.richmont-mines.com 13 RIC: TSX NYSE-MKT
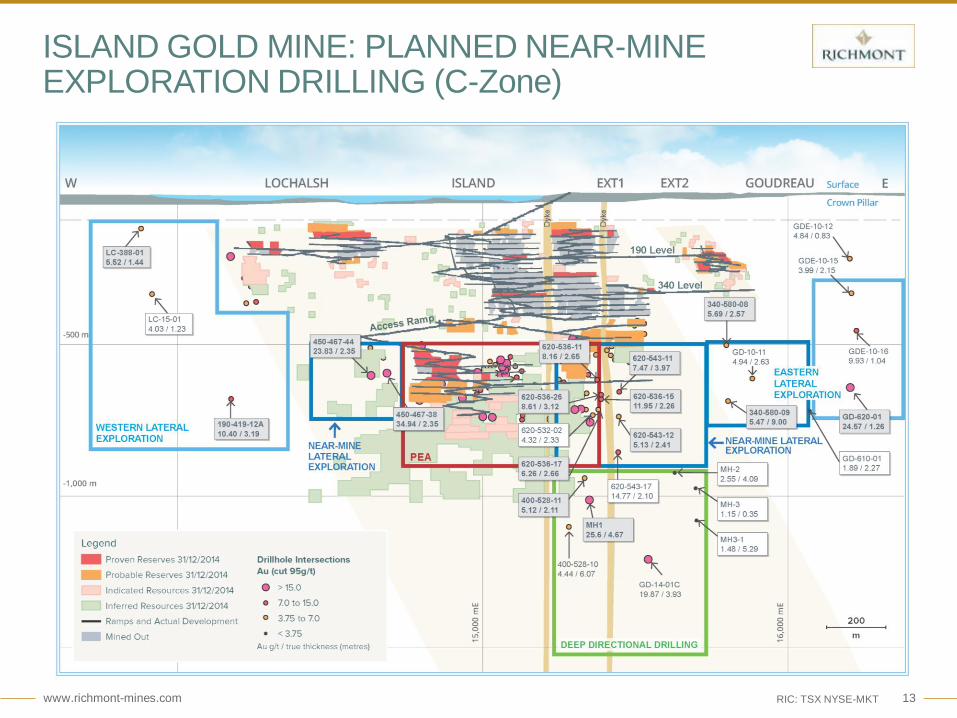
ISLAND GOLD MINE: PLANNED NEAR-MINE EXPLORATION DRILLING (C-Zone)
www.richmont-mines.com 14 RIC: TSX NYSE-MKT
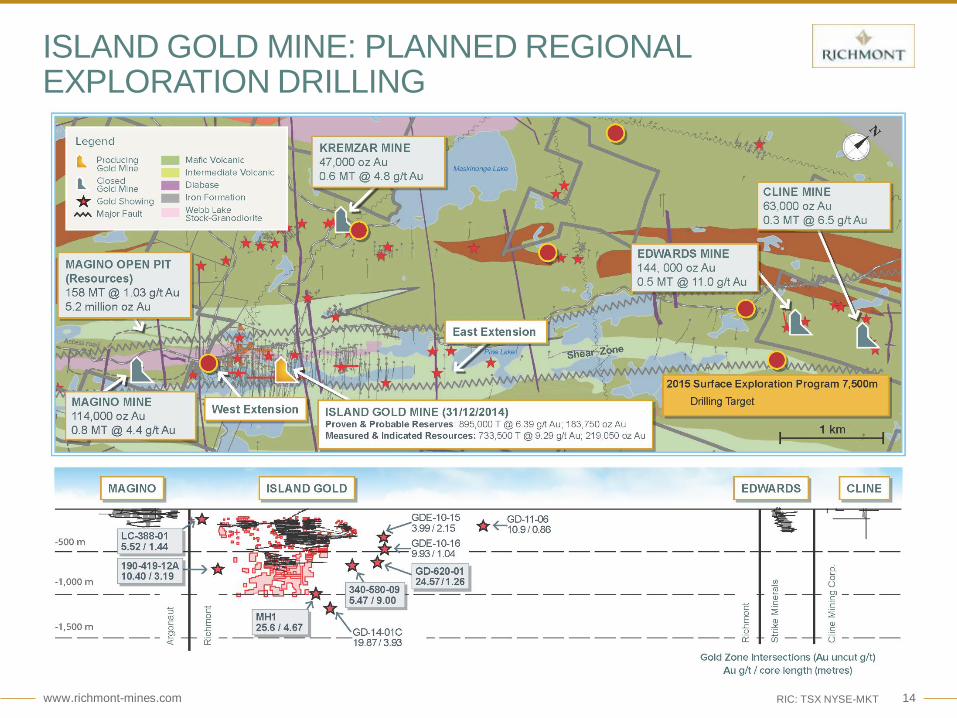
ISLAND GOLD MINE: PLANNED REGIONAL EXPLORATION DRILLING

www.richmont-mines.com 15 RIC: TSX NYSE-MKT
BEAUFOR MINE OVERVIEW
Q4
2015 2015
Gold Production (oz) 5,652 26,411
Gold Sold (oz) 5,237 26,875
Q3
2015
9-months
2015
Cash costs/oz (C$)(1)(2) $974 $974
AISC (C$) (1)(2) $1,225 $1,144
Cash costs/oz (US$)(1)(2) $744 $773
AISC (US$) (1)(2) $936 $908
Reserves (oz)(3) 32,750
Gold Grade (g/t)(3) 7.06
M&I Resources (oz)(3) 189,850
Gold Grade (g/t)(3) 6.44
(1) Refer to the Non-GAAP performance measures contained in the Q3 MD&A.
(2) Fourth quarter and annual cash cost per ounce and AISC will be reported as part of the
Corporation’s fourth quarter and annual financial results on Feb. 22, 2016.
(3) Refer to full 2014 Reserve and Resource information at the end of this presentation
Development of the Q Zone extends mine life
Target of reaching the mineralized structure by early 2016
28,000m of exploration drilling and 8,000m of definition drilling year to date

www.richmont-mines.com 16 RIC: TSX NYSE-MKT
MONIQUE MINE & CAMFLO MILL OVERVIEW
Camflo Mill
Monique Mine Q4
2015 2015
Gold Production (oz) 2,525 16,580
Gold Sold (oz) 2,835 17,657
Q3
2015
9-months
2015
Cash costs/oz (C$)(1)(2) $1,005 $745
AISC (C$)(1)(2) $1,020 $762
Cash costs/oz (US$)(1)(2) $768 $592
AISC (US$)(1)(2) $779 $605
(1) Refer to the Non-GAAP performance measures contained in the Q3 MD&A
(2) Fourth quarter and annual cash cost per ounce and AISC will be reported as part of the
Corporation’s fourth quarter and annual financial results on Feb. 22, 2016.
Milling of the lower-grade cash-flow accretive stockpiled ore during Q3
Processing of the lower grade stockpile essentially completed by the end of 2015
Cash margin on processing stockpiled ore of approx. $746 per ounce in Q3
Toll milling opportunities at the 1,200 tpd Camflo Mill

www.richmont-mines.com 17 RIC: TSX NYSE-MKT
SOLID PERFORMANCE AND ORGANIC GROWTH
Q4
2015 2015
2015
Guidance
Gold produced (oz) 22,380 98,031 87,000-95,000
Gold sold (oz) 21,576 96,895 -
Q3
2015
9-months
2015
2015
Guidance
Cash cost per oz. (CAN$)(1)(2) $926 $961 $935-$1,035
AISC (CAN$)(1)(2) $1,311 $1,290 $1,335-$1,490
Cash cost per oz. (US$)(1)(2) $707 $763 $750-$825
AISC (US$)(1)(2) $1,001 $1,024 $1,075-$1,190
(1) Fourth quarter and annual cash cost per ounce and AISC will be reported as part of the Corporation’s fourth
quarter and annual financial results on Feb. 22, 2016.
(2) Refer to the Non-GAAP performance measures contained in the Q3 MD&A.
-
200
400
600
800
1,000
1,200
40,000
50,000
60,000
70,000
80,000
90,000
100,000
FY-15 FY-16 FY-17 FY-18
Ca
sh
co
sts
pe
r o
z. (C
AD
$)
Go
ld P
rod
uctio
n (o
z)
Source: ThomsonOne Consensus Data
Production (oz) Cash Costs (CAD$/oz)
Growing Production - Decreasing Cash Costs
0.00
0.20
0.40
0.60
0.80
1.00
1.20
FY-15 FY-16 FY-17 FY-18
Ca
sh
Flo
w p
er
sh
are
(C
$)
Source: ThomsonOne Consensus Data (Dec. 31/15)
OCF/PS
Growing Cash Flow Streams
www.richmont-mines.com 18 RIC: TSX NYSE-MKT
APPENDIX

www.richmont-mines.com 19 RIC: TSX NYSE-MKT
RICHMONT MINES: MANAGEMENT TEAM
RENAUD ADAMS
President and
Chief Executive Officer
NICOLE VEILLEUX
Vice-President
Finance
STEVE BURLETON
Vice-President,
Business Development
DANIEL ADAM
Vice-President
Exploration
GEO PHD CPA, CA CFA, MBA
ANNE DAY
Vice-President,
Investor Relations
MBA
MAXIME GRONDIN
Director, Human Resources
and Health & Safety
MIGUEL MENDOZA
Director,
Business Performance
Management and Infrastructure
JEAN BASTIEN
Island Gold Mine
General Manager
MARC-ANDRÉ LAVERGNE
Beaufor and Monique
Division General Manager
BSC ISE P. ENG, MBA P. ENG CIRC
P. ENG
Legal Counsel &
Corporate Secretary
MÉLISSA TARDIF

www.richmont-mines.com 20 RIC: TSX NYSE-MKT
RICHMONT MINES: BOARD OF DIRECTORS
GREG CHAMANDY
Director
RENAUD ADAMS
Director, President
and Chief Executive Officer
ELAINE ELLINGHAM
Director
MICHAEL PESNER
Director and Chairman of
the Audit Committee
RENÉ MARION
Chairman of the Board
P. Geo., MBA CA P. ENG P. ENG
Co-Founder and Former
CEO of Gildan Activewear
Previously TSX,
IAMGOLD, Campbell
Resources, Rio Algom
President of Hermitage
Canada Finance,
previously KPMG
Former CEO AuRico Gold CEO of Richmont Mines
www.richmont-mines.com 21 RIC: TSX NYSE-MKT
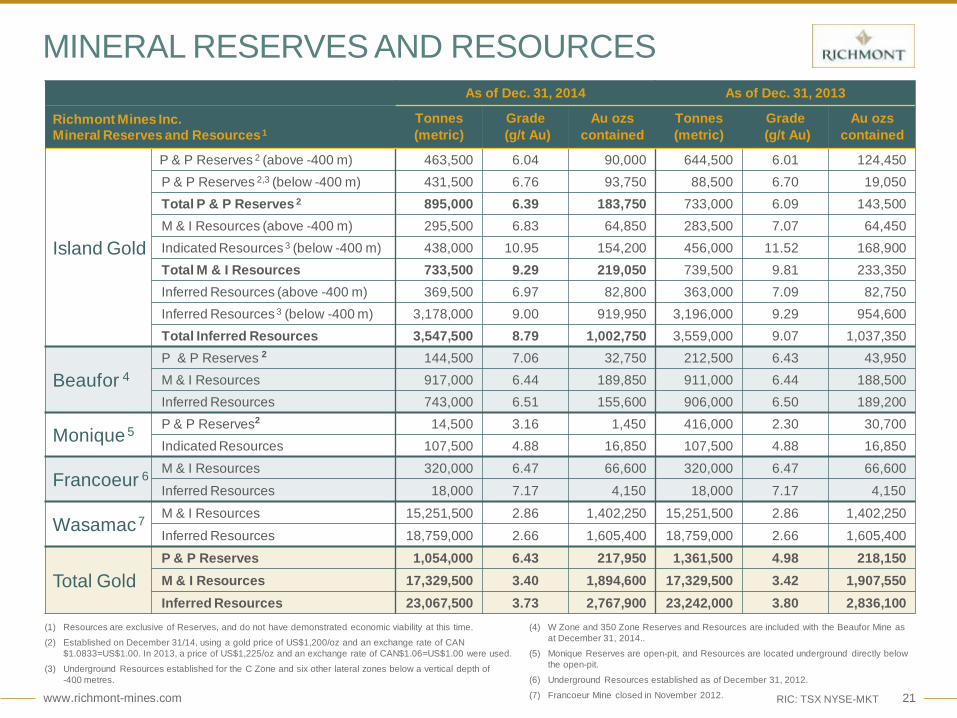
49,196 oz
(1) Resources are exclusive of Reserves, and do not have demonstrated economic viability at this time.
(2) Established on December 31/14, using a gold price of US$1,200/oz and an exchange rate of CAN
$1.0833=US$1.00. In 2013, a price of US$1,225/oz and an exchange rate of CAN$1.06=US$1.00 were used.
(3) Underground Resources established for the C Zone and six other lateral zones below a vertical depth of
-400 metres.
As of Dec. 31, 2014 As of Dec. 31, 2013
Richmont Mines Inc.
Mineral Reserves and Resources 1
Tonnes
(metric)
Grade
(g/t Au)
Au ozs
contained
Tonnes
(metric)
Grade
(g/t Au)
Au ozs
contained
Island Gold
P & P Reserves 2 (above -400 m) 463,500 6.04 90,000 644,500 6.01 124,450
P & P Reserves 2,3 (below -400 m) 431,500 6.76 93,750 88,500 6.70 19,050
Total P & P Reserves 2 895,000 6.39 183,750 733,000 6.09 143,500
M & I Resources (above -400 m) 295,500 6.83 64,850 283,500 7.07 64,450
Indicated Resources 3 (below -400 m) 438,000 10.95 154,200 456,000 11.52 168,900
Total M & I Resources 733,500 9.29 219,050 739,500 9.81 233,350
Inferred Resources (above -400 m) 369,500 6.97 82,800 363,000 7.09 82,750
Inferred Resources 3 (below -400 m) 3,178,000 9.00 919,950 3,196,000 9.29 954,600
Total Inferred Resources 3,547,500 8.79 1,002,750 3,559,000 9.07 1,037,350
Beaufor 4
P & P Reserves 2 144,500 7.06 32,750 212,500 6.43 43,950
M & I Resources 917,000 6.44 189,850 911,000 6.44 188,500
Inferred Resources 743,000 6.51 155,600 906,000 6.50 189,200
Monique 5 P & P Reserves2 14,500 3.16 1,450 416,000 2.30 30,700
Indicated Resources 107,500 4.88 16,850 107,500 4.88 16,850
Francoeur 6 M & I Resources 320,000 6.47 66,600 320,000 6.47 66,600
Inferred Resources 18,000 7.17 4,150 18,000 7.17 4,150
Wasamac 7 M & I Resources 15,251,500 2.86 1,402,250 15,251,500 2.86 1,402,250
Inferred Resources 18,759,000 2.66 1,605,400 18,759,000 2.66 1,605,400
Total Gold
P & P Reserves 1,054,000 6.43 217,950 1,361,500 4.98 218,150
M & I Resources 17,329,500 3.40 1,894,600 17,329,500 3.42 1,907,550
Inferred Resources 23,067,500 3.73 2,767,900 23,242,000 3.80 2,836,100
MINERAL RESERVES AND RESOURCES
(4) W Zone and 350 Zone Reserves and Resources are included with the Beaufor Mine as
at December 31, 2014..
(5) Monique Reserves are open-pit, and Resources are located underground directly below
the open-pit.
(6) Underground Resources established as of December 31, 2012.
(7) Francoeur Mine closed in November 2012.
www.richmont-mines.com 22 RIC: TSX NYSE-MKT
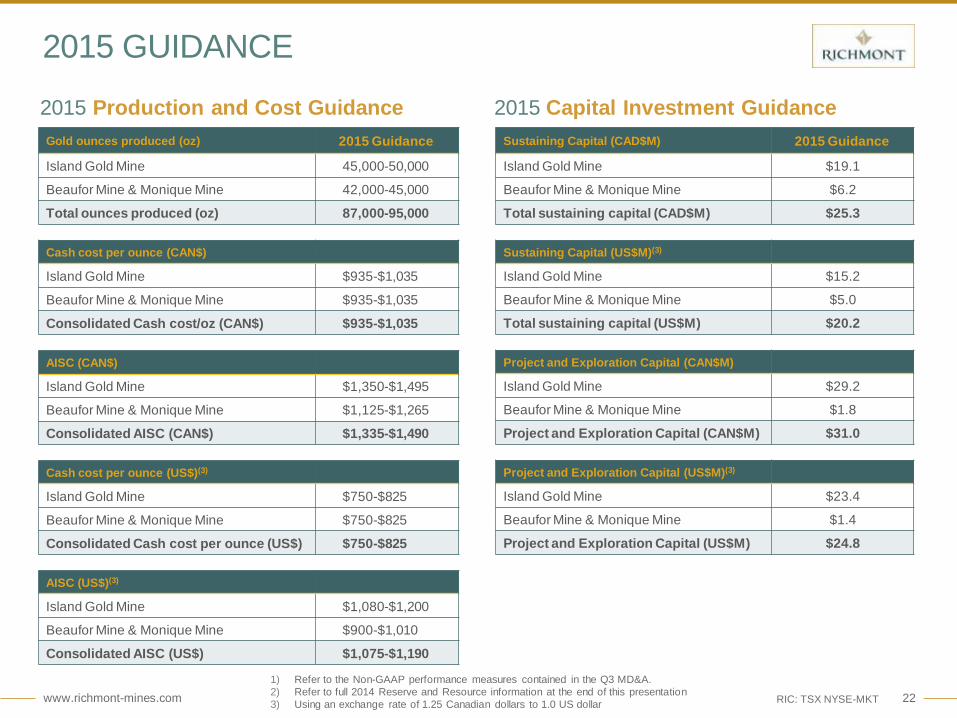
2015 GUIDANCE
Gold ounces produced (oz) 2015 Guidance
Island Gold Mine 45,000-50,000
Beaufor Mine & Monique Mine 42,000-45,000
Total ounces produced (oz) 87,000-95,000
Cash cost per ounce (CAN$)
Island Gold Mine $935-$1,035
Beaufor Mine & Monique Mine $935-$1,035
Consolidated Cash cost/oz (CAN$) $935-$1,035
AISC (CAN$)
Island Gold Mine $1,350-$1,495
Beaufor Mine & Monique Mine $1,125-$1,265
Consolidated AISC (CAN$) $1,335-$1,490
Cash cost per ounce (US$)(3)
Island Gold Mine $750-$825
Beaufor Mine & Monique Mine $750-$825
Consolidated Cash cost per ounce (US$) $750-$825
AISC (US$)(3)
Island Gold Mine $1,080-$1,200
Beaufor Mine & Monique Mine $900-$1,010
Consolidated AISC (US$) $1,075-$1,190
2015 Production and Cost Guidance
Sustaining Capital (CAD$M) 2015 Guidance
Island Gold Mine $19.1
Beaufor Mine & Monique Mine $6.2
Total sustaining capital (CAD$M) $25.3
Sustaining Capital (US$M)(3)
Island Gold Mine $15.2
Beaufor Mine & Monique Mine $5.0
Total sustaining capital (US$M) $20.2
Project and Exploration Capital (CAN$M)
Island Gold Mine $29.2
Beaufor Mine & Monique Mine $1.8
Project and Exploration Capital (CAN$M) $31.0
Project and Exploration Capital (US$M)(3)
Island Gold Mine $23.4
Beaufor Mine & Monique Mine $1.4
Project and Exploration Capital (US$M) $24.8
2015 Capital Investment Guidance
1) Refer to the Non-GAAP performance measures contained in the Q3 MD&A.
2) Refer to full 2014 Reserve and Resource information at the end of this presentation
3) Using an exchange rate of 1.25 Canadian dollars to 1.0 US dollar
www.richmont-mines.com 23
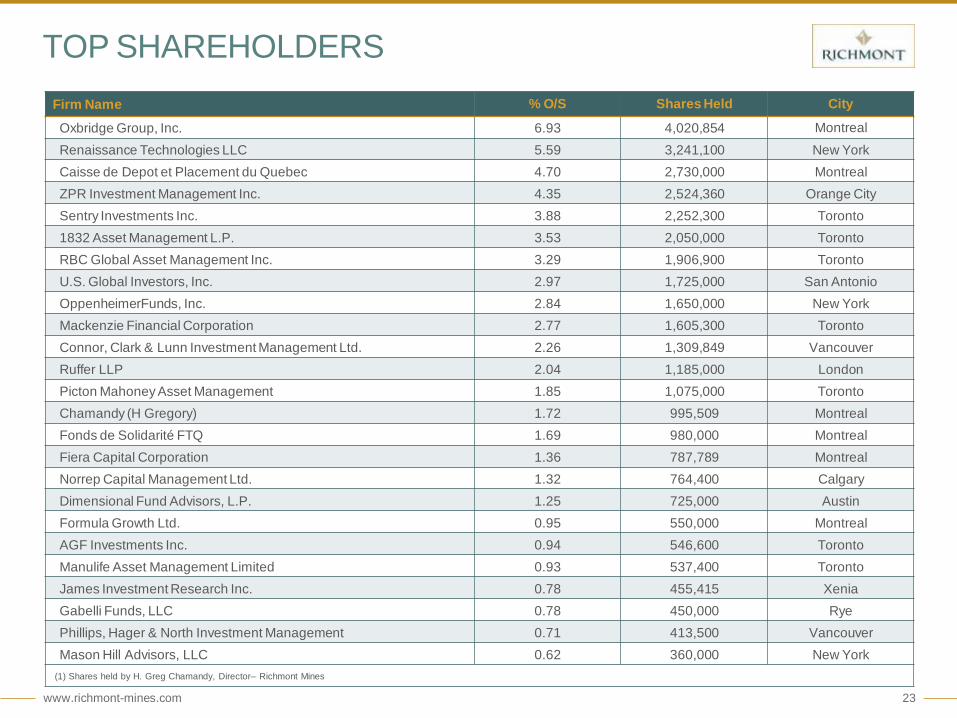
TOP SHAREHOLDERS
Firm Name % O/S Shares Held City
Oxbridge Group, Inc. 6.93 4,020,854 Montreal
Renaissance Technologies LLC 5.59 3,241,100 New York
Caisse de Depot et Placement du Quebec 4.70 2,730,000 Montreal
ZPR Investment Management Inc. 4.35 2,524,360 Orange City
Sentry Investments Inc. 3.88 2,252,300 Toronto
1832 Asset Management L.P. 3.53 2,050,000 Toronto
RBC Global Asset Management Inc. 3.29 1,906,900 Toronto
U.S. Global Investors, Inc. 2.97 1,725,000 San Antonio
OppenheimerFunds, Inc. 2.84 1,650,000 New York
Mackenzie Financial Corporation 2.77 1,605,300 Toronto
Connor, Clark & Lunn Investment Management Ltd. 2.26 1,309,849 Vancouver
Ruffer LLP 2.04 1,185,000 London
Picton Mahoney Asset Management 1.85 1,075,000 Toronto
Chamandy (H Gregory) 1.72 995,509 Montreal
Fonds de Solidarité FTQ 1.69 980,000 Montreal
Fiera Capital Corporation 1.36 787,789 Montreal
Norrep Capital Management Ltd. 1.32 764,400 Calgary
Dimensional Fund Advisors, L.P. 1.25 725,000 Austin
Formula Growth Ltd. 0.95 550,000 Montreal
AGF Investments Inc. 0.94 546,600 Toronto
Manulife Asset Management Limited 0.93 537,400 Toronto
James Investment Research Inc. 0.78 455,415 Xenia
Gabelli Funds, LLC 0.78 450,000 Rye
Phillips, Hager & North Investment Management 0.71 413,500 Vancouver
Mason Hill Advisors, LLC 0.62 360,000 New York
(1) Shares held by H. Greg Chamandy, Director– Richmont Mines

www.richmont-mines.com 24
ISLAND GOLD MINE Near-Mine Lateral Exploration
www.richmont-mines.com 25
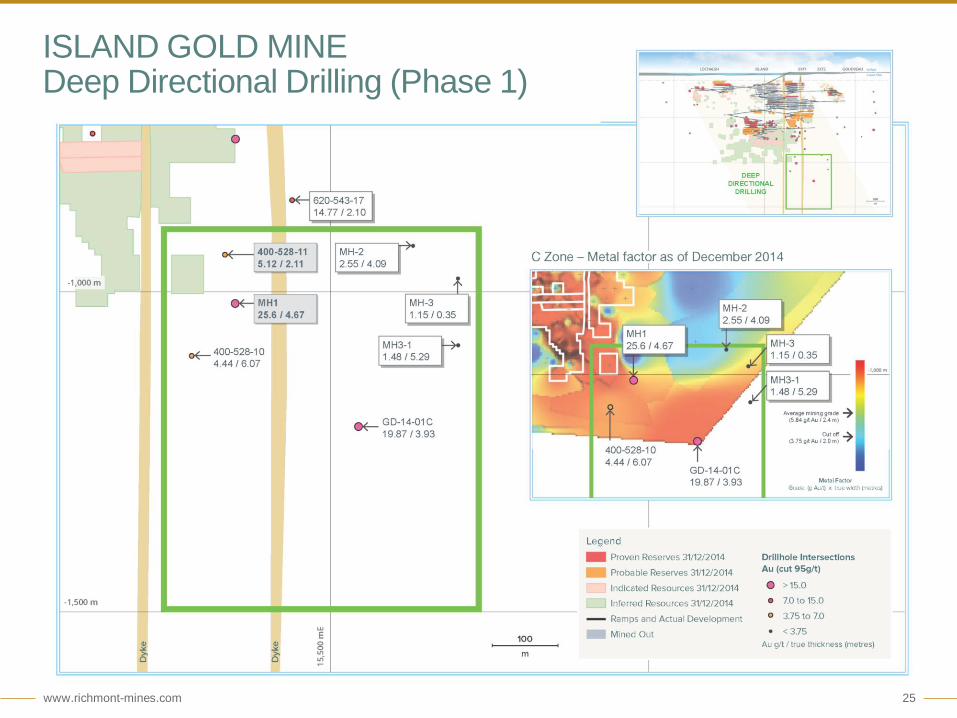
ISLAND GOLD MINE Deep Directional Drilling (Phase 1)

www.richmont-mines.com 26
z ISLAND GOLD MINE Eastern Lateral Exploration

www.richmont-mines.com 27
ISLAND GOLD MINES Western Lateral Exploration

www.richmont-mines.com 28 RIC: TSX NYSE-MKT
WASAMAC: ADVANCED DEVELOPMENT PROJECT
Resources Tonnes Grade
(g/t Au)
Gold
Ounces
Measured Resources 3,124,500 2.75 276,550
Indicated Resources 12,127,000 2.89 1,125,700
Inferred Resources 18,759,000 2.66 1,605,400
(1) Refer to full 2014 Reserve and Resource information at the end of this presentation
15km west of Rouyn-Noranda, Quebec
100% owned, no royalties
Close proximity to existing infrastructure
Located in the Abitibi gold mining district
Significant exploration potential
NI 43-101 PEA released in March 2012

www.richmont-mines.com 29 RIC: TSX NYSE-MKT
RICHMONT MINES ASSETS VALD’OR AREA – EXPLORATION PROPERTIES
www.richmont-mines.com 30 RIC: TSX NYSE-MKT
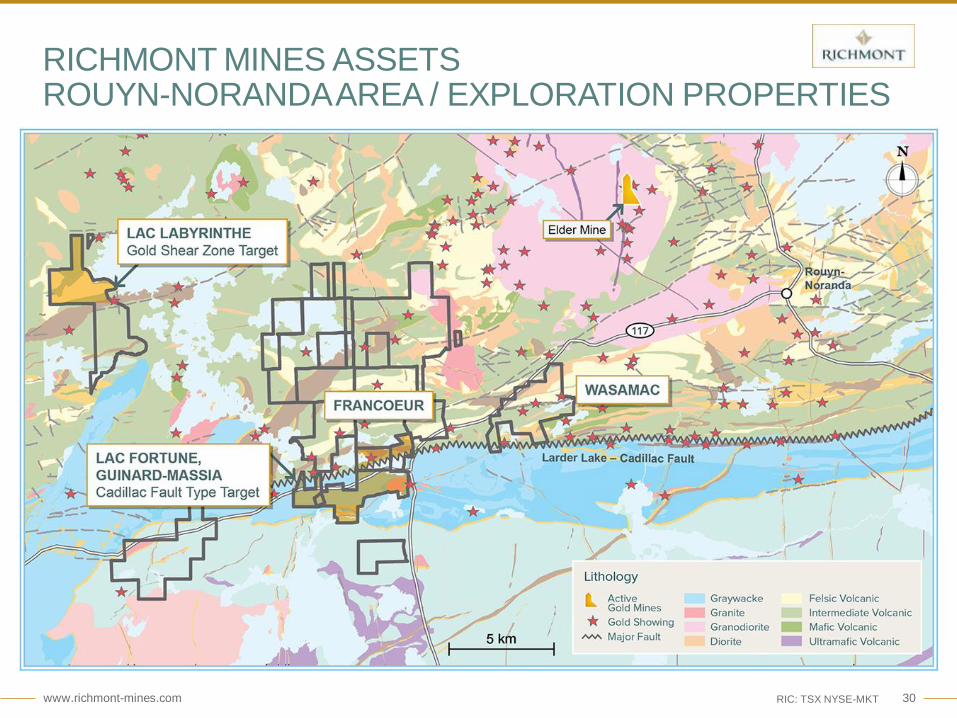
RICHMONT MINES ASSETS ROUYN-NORANDA AREA / EXPLORATION PROPERTIES

www.richmont-mines.com 31 RIC: TSX NYSE-MKT
RICHMONT MINES ASSETS TIMMINS AREA / EXPLORATION PROPERTIES

www.richmont-mines.com 32 RIC: TSX NYSE-MKT
OUR VISION and STRATEGY
Our vision is to become a leading intermediate gold producer focused on
the Americas generating superior per share valuation. We are committed to a
Sustainable Business Model and a strategy of long-term growth, and will fully
utilize the Corporation’s strong balance sheet, assets, cash flow, capital
structure and the extensive experience of the Corporations’ Board of
Directors and Management Team to build the next leading Canadian based
intermediate gold company.
Our strategy, in the short term, will focus on becoming a leading junior
gold producer by maintaining at all times a superior per share position on
operational & financial metrics while maintaining a sustainable and risk
adverse approach under a ‘Sustainable Business Model’.
We are guided by our core corporate values to achieve long term value
for all of our stakeholders. By cultivating a culture of responsible
performance, we are focused on operating in a sustainable manner while
holding ourselves accountable to all of our stakeholders.
www.richmont-mines.com 33 RIC: TSX NYSE-MKT
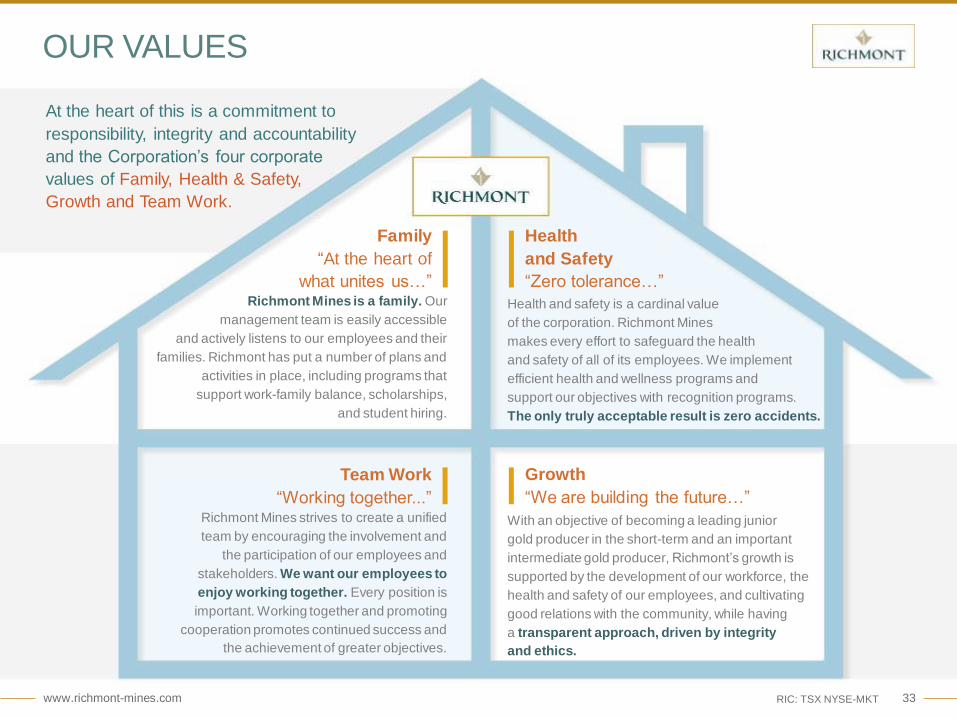
OUR VALUES
At the heart of this is a commitment to
responsibility, integrity and accountability
and the Corporation’s four corporate
values of Family, Health & Safety,
Growth and Team Work.
Health
and Safety
“Zero tolerance…”
Family
“At the heart of
what unites us…” Richmont Mines is a family. Our
management team is easily accessible
and actively listens to our employees and their
families. Richmont has put a number of plans and
activities in place, including programs that
support work-family balance, scholarships,
and student hiring.
Health and safety is a cardinal value
of the corporation. Richmont Mines
makes every effort to safeguard the health
and safety of all of its employees. We implement
efficient health and wellness programs and
support our objectives with recognition programs.
The only truly acceptable result is zero accidents.
Team Work
“Working together...” Richmont Mines strives to create a unified
team by encouraging the involvement and
the participation of our employees and
stakeholders. We want our employees to
enjoy working together. Every position is
important. Working together and promoting
cooperation promotes continued success and
the achievement of greater objectives.
With an objective of becoming a leading junior
gold producer in the short-term and an important
intermediate gold producer, Richmont’s growth is
supported by the development of our workforce, the
health and safety of our employees, and cultivating
good relations with the community, while having
a transparent approach, driven by integrity
and ethics.
Growth
“We are building the future…”

www.richmont-mines.com 34 RIC: TSX NYSE-MKT
SUSTAINABLE BUSINESS MODEL
We believe in developing Richmont based
on the principles of sustainability,
in order to deliver sustainable and
superior value for all stakeholders
with low risk exposure
to precious metals. Sustainable
Human Resources
Sustainable
Community Development
Sustainable
Process Improvement
Sustainable
Growth Principles
Making work life sustainable through
employee health & safety and wellness
programs, improved supervisory & operational
planning/implementation practices and skills
through training programs. Develop potential
leadership abilities through leadership program.
Promote Life in Balance; family, work and
personal development.
Reducing inefficiency and waste
through quality & performance
management by implementation of
“Lean” methods and balanced score
card approach. Advanced knowledge
and experience with energy efficiency,
sustainable waste systems & construction/
building practices.
Leadership and consulting skills for
promoting comprehensive change
toward sustainability in communities and
developing world-class relationships
with Aboriginal communities.
Developing sustainable exploration,
development, operational and financial
practices in order to deliver superior per share
value, mitigation/management of risk exposure
and discipline approach toward preserving best-
in-class balance sheet and capital structure.