CORPORATE SALE-LEASEBACK - LoopNetimages3.loopnet.com/d2/uCKa3q75u4ZrUdsQ37MJVXhf2xS... ·...
34
CORPORATE SALE-LEASEBACK FOR ADDITIONAL INFORMATION, PLEASE CONTACT: INVESTMENT PROPERTY OPPORTUNITY 7319 NE 37TH AVE, VANCOUVER, WA 98665 STUART SKAUG, SIOR | +1 503 221 4822 | [email protected] | LICENSED IN OR & WA JAKE BIGBY | +1 503 221 4832 | [email protected] | LICENSED IN OR & WA
Transcript of CORPORATE SALE-LEASEBACK - LoopNetimages3.loopnet.com/d2/uCKa3q75u4ZrUdsQ37MJVXhf2xS... ·...

CORPORATE SALE-LEASEBACK
FOR ADDITIONAL INFORMATION, PLEASE CONTACT:
INVESTMENT PROPERTY OPPORTUNITY 7319 NE 37TH AVE, VANCOUVER, WA 98665
STUART SKAUG, SIOR | +1 503 221 4822 | [email protected] | LICENSED IN OR & WAJAKE BIGBY | +1 503 221 4832 | [email protected] | LICENSED IN OR & WA

AFFILIATED BUSINESS DISCLOSURECBRE, Inc. operates within a global family of companies with many subsidiaries and related entities (each an “Affiliate”) engaging in a broad range of commercial real estate businesses including, but not limited to, brokerage services, property and facilities management, valuation, investment fund management and development. At times different Affiliates, including CBRE Global Investors, Inc. or Trammell Crow Company, may have or represent clients who have competing interests in the same transaction. For example, Affiliates or their clients may have or express an interest in the property described in this Memorandum (the “Property”), and may be the successful bidder for the Property. Your receipt of this Memorandum constitutes your acknowledgment of that possibility and your agreement that neither CBRE, Inc. nor any Affiliate has an obligation to disclose to you such Affiliates’ interest or involvement in the sale or purchase of the Property. In all instances, however, CBRE, Inc. and its Affiliates will act in the best interest of their respective client(s), at arms’ length, not in concert, or in a manner detrimental to any third party. CBRE, Inc. and its Affiliates will conduct their respective businesses in a manner consistent with the law and all fiduciary duties owed to their respective client(s).
CONFIDENTIALITY AGREEMENTYour receipt of this Memorandum constitutes your acknowledgment that (i) it is a confidential Memorandum solely for your limited use and benefit in determining whether you desire to express further interest in the acquisition of the Property, (ii) you will hold it in the strictest confidence, (iii) you will not disclose it or its contents to any third party without the prior written authorization of the owner of the Property (“Owner”) or CBRE, Inc., and (iv) you will not use any part of this Memorandum in any manner detrimental to the Owner or CBRE, Inc.
If after reviewing this Memorandum, you have no further interest in purchasing the Property, kindly return it to CBRE, Inc.
DISCLAIMERThis Memorandum contains select information pertaining to the Property and the Owner, and does not purport to be all-inclusive or contain all or part of the information which prospective investors may require to evaluate a purchase of the Property. The information contained in this Memorandum has been obtained from sources believed to be reliable, but has not been verified for accuracy, completeness, or fitness for any particular purpose. All information is presented “as is” without representation or warranty of any kind. Such information includes estimates based on forward-looking assumptions relating to the general economy, market conditions, competition and other factors which are subject to uncertainty and may not represent the current or future performance of the Property. All references to acreages, square footages, and other measurements are approximations. This Memorandum describes certain documents, including leases and other materials, in summary form. These summaries may not be complete nor accurate descriptions of the full agreements referenced. Additional information and an opportunity to inspect the Property may be made available to qualified prospective purchasers. You are advised to independently verify the accuracy and completeness of all summaries and information contained herein, to consult with independent legal and financial advisors, and carefully investigate the economics of this transaction and Property’s suitability for your needs. ANY RELIANCE ON THE CONTENT OF THIS MEMORANDUM IS SOLELY AT YOUR OWN RISK.
The Owner expressly reserves the right, at its sole discretion, to reject any or all expressions of interest or offers to purchase the Property, and/or to terminate discussions at any time with or without notice to you. All offers, counteroffers, and negotiations shall be non-binding and neither CBRE, Inc. nor the Owner shall have any legal commitment or obligation except as set forth in a fully executed, definitive purchase and sale agreement delivered by the Owner.
© 2017 CBRE, Inc. All Rights Reserved.
17319 NE 37TH AVE, VANCOUVER, WA 98665

CONTENTS
2
TABLE OF
01 02 03 04 05EXECUTIVE SUMMARY PROPERTY SUMMARY AREA OVERVIEW TENANT SUMMARY FINANCIAL OVERVIEW
INVESTMENT HIGHLIGHTS
CORE CHARACTERISTICS
PROPERTY DESCRIPTION
TAX LOT AERIAL
CLOSE VICINITY AERIALCLARK COUNTY TENANT PROFILE SUMMARY • FINANCIAL ASSUMPTIONS
CASH FLOW • PRICING MATRIX
NOI SUMMARY • MARKET COMPARISONS
LEASE EXPIRATIONS • RENT ROLL
TABLE OF CONTENTS

3
01 EXECUTIVE SUMMARY
7319 NE 37TH AVE, VANCOUVER, WA 98665

4EXECUTIVE SUMMARY

57319 NE 37TH AVE, VANCOUVER, WA 98665

6
INVESTMENT HIGHLIGHTS
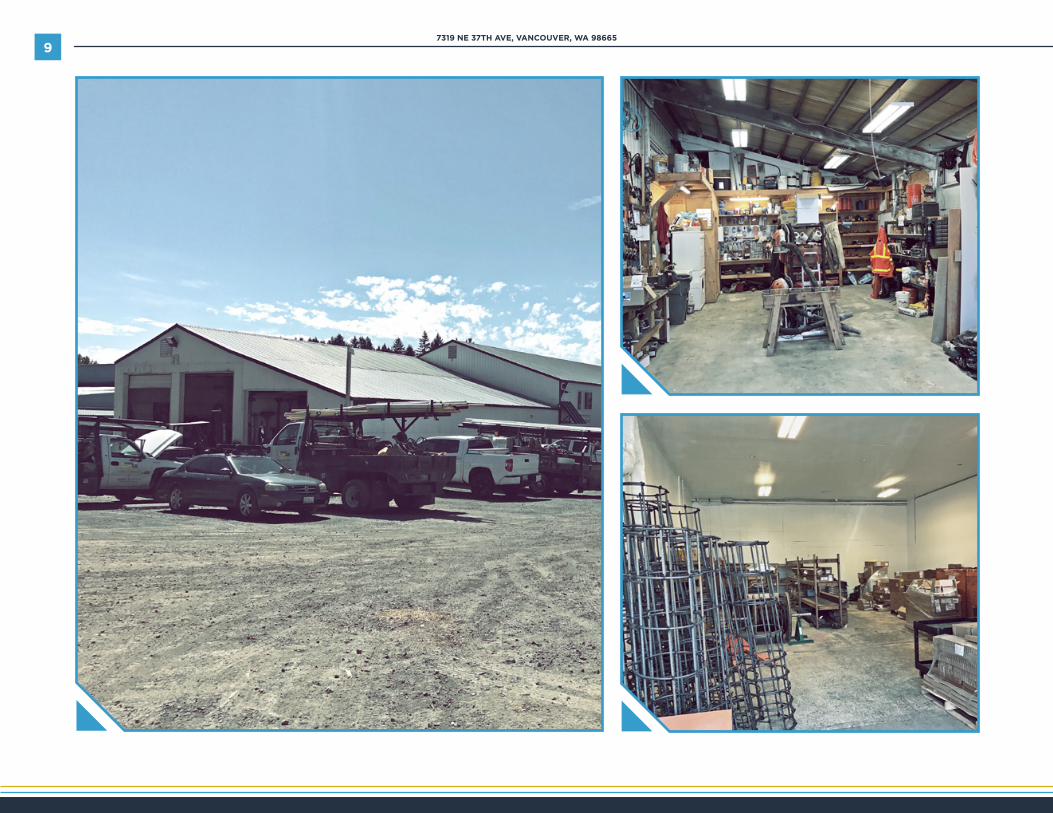
Lindberg Pipe & Grade’s Vancouver property represents a rare opportunity to acquire fee-simple interest in an industrial facility with a long-term leaseback from a strong regional entity. The property consists of approximately 8,420 total square feet on a 2.5-acre site, 100% leased by Lindberg Pipe & Grade (“Lindberg”). Lindberg works for some of the biggest builders in the Southwest Washington and Portland Metro area. Clients include DR Horton, New Tradition Homes, Pahlisch Homes, Summerplace Homes, GPB Construction, and Pulte Homes. The property is located in Clark County, less than 2.5 miles from I-5 and less than 3 miles from I-205. The site is strategic for Lindberg’s network to specialty contractors in the building and remodeling industry.
EXECUTIVE SUMMARY ASKING PRICE $1,760,000
CAP RATE 7.5%
RENTABLE SF 8,420
LAND AREA 2.5 acres
PRICE PER BUILDING SF $209
OCCUPANCY 100%
INITIAL LEASEBACK TERM 10 years
YEAR BUILT 1973 with major renovations in 2013/2014
ADDRESS 7319 NE 37th Ave, Vancouver, WA 98665
EXECUTIVE SUMMARY

7
CORE CHARACTERISTICS
POTENTIAL NEW DEVELOPMENT OR REDEVELOPMENT UPSIDE
RARE INDUSTRIAL PROPERTY WITH YARD
Long-Term Stable Triple Net Lease
The owner of Lindberg Pipe & Grade is also the owner of the building. They would like to focus on continuing to grow the business through capital investments and acquisitions and a sale of the property with a 10-year leaseback would allow them to make those investments and focus on the continued growth of Lindberg Pipe & Grade.
With approximately 2.5 acres of the land area and only 8,420 SF of improvements, there is always a chance for additional improvements down the road. Whether it be expansion for an existing tenant or adding another building on the site.
Difficult-to-find industrial property with only 7.8% coverage and ample yard area.
EXECUTIVE SUMMARY
7319 NE 37TH AVE, VANCOUVER, WA 98665
8
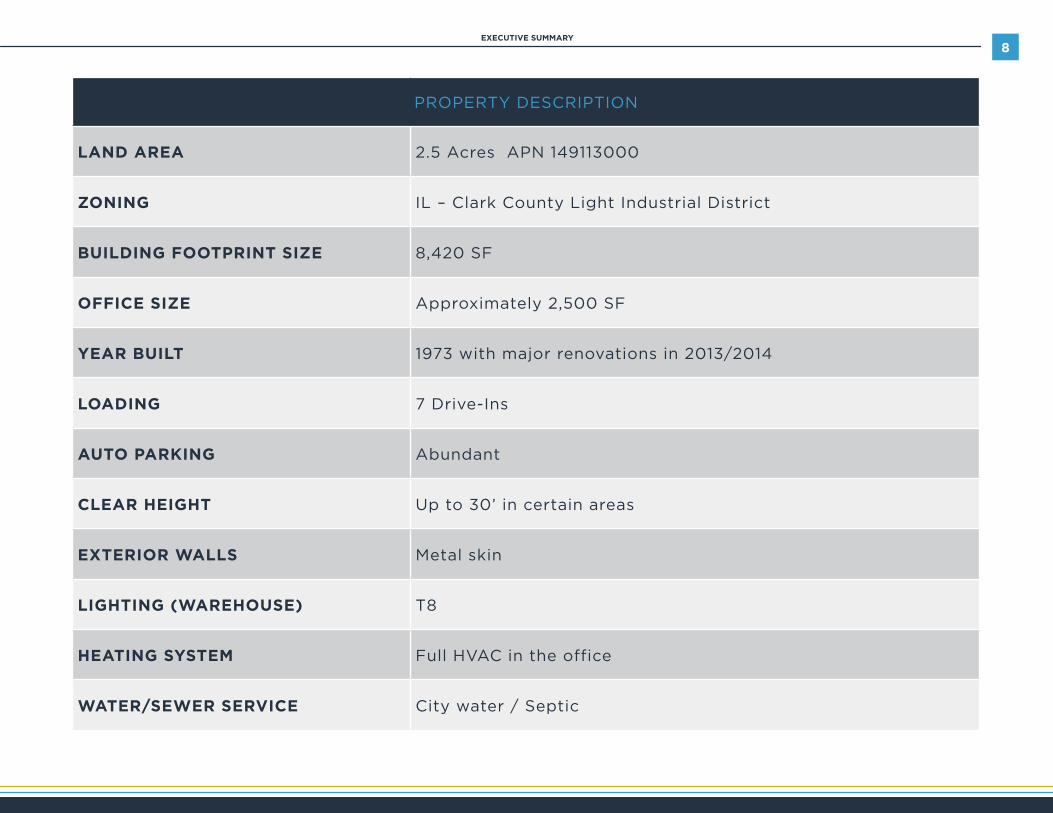
EXECUTIVE SUMMARYPROPERTY DESCRIPTION
LAND AREA 2.5 Acres APN 149113000
ZONING IL – Clark County Light Industrial District
BUILDING FOOTPRINT SIZE 8,420 SF
OFFICE SIZE Approximately 2,500 SF
YEAR BUILT 1973 with major renovations in 2013/2014
LOADING 7 Drive-Ins
AUTO PARKING Abundant
CLEAR HEIGHT Up to 30’ in certain areas
EXTERIOR WALLS Metal skin
LIGHTING (WAREHOUSE) T8
HEATING SYSTEM Full HVAC in the office
WATER/SEWER SERVICE City water / Septic
EXECUTIVE SUMMARY
97319 NE 37TH AVE, VANCOUVER, WA 98665

10EXECUTIVE SUMMARY
11
02 PROPERTY SUMMARY
7319 NE 37TH AVE, VANCOUVER, WA 98665

12 PROPERTY SUMMARY

13
TAX LOT AERIAL
PROPERTY L O C AT I O N
BUILDING 8,420 SF
APN 149113000 | 2.5 ACRES
7319 NE 37TH AVE, VANCOUVER, WA 98665
14
NE ST JOHNS RD
NE 47TH
AV
E
NE 78TH ST
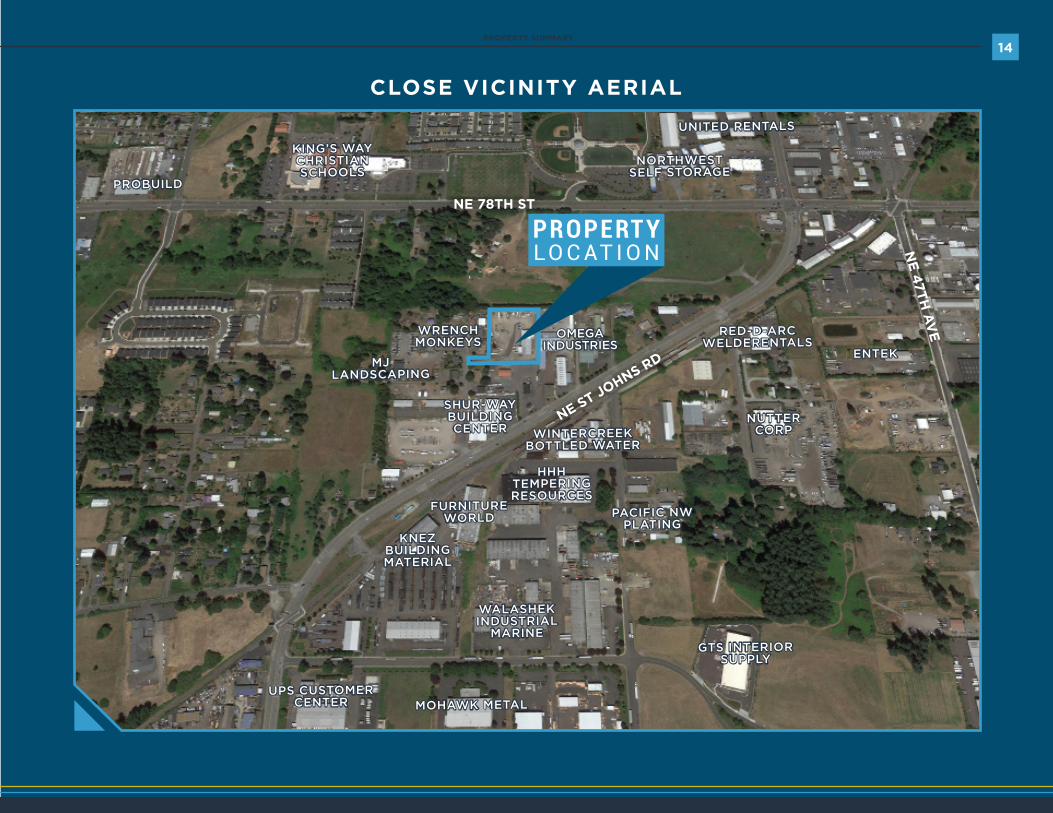
CLOSE VICINITY AERIAL
PROPERTY L O C AT I O N
SHUR-WAY BUILDING CENTER
FURNITUREWORLD
NUTTER CORP
ENTEK
RED-D-ARC WELDERENTALS
PACIFIC NW PLATING
WINTERCREEK BOTTLED WATER
HHH TEMPERING RESOURCES
KNEZBUILDING MATERIAL
WALASHEKINDUSTRIAL
MARINE
MOHAWK METAL
GTS INTERIOR SUPPLY
UPS CUSTOMER CENTER
MJLANDSCAPING
OMEGAINDUSTRIES
WRENCHMONKEYS
KING’S WAYCHRISTIAN SCHOOLS
NORTHWESTSELF STORAGE
UNITED RENTALS
PROBUILD
PROPERTY SUMMARY
15
03 AREA OVERVIEW
7319 NE 37TH AVE, VANCOUVER, WA 98665

16AREA OVERVIEW

177319 NE 37TH AVE, VANCOUVER, WA 98665

18
CLARK COUNTY
Clark County is located in southwest Washington on the Columbia River, roughly 100 miles upstream from the Pacific Ocean. It is the fifth most populous county in the state.
Clark County is part of the Portland Metropolitan Area. Its economy can be understood only in that context: one-third of the county’s labor force, over 50,000 workers, commutes to Portland on a daily basis, while only 11,000 commute in the opposite direction. The lack of a sales tax in Oregon has led to significant leakage of retail sales, lowering both retail investment and tax revenues for local governments. Clark County has excellent transportation linkages, including proximity to Portland International Airport, location on east-west and north-south rail lines and immediate access to Interstate 5 north-south and Interstate 84 heading east.
In the 1970s, the county began to attract investment in electronics, which became its most important industry in the 1990s and remains so today. Wafertech, Hewlett Packard, SEH America and Linear Semiconductor are important employers.
Major industry sectors in Clark County include healthcare and social assistance, professional and business services, retail trade, leisure and hospitality, and manufacturing. In addition, government employed 24,000, over half of which were in public education.
AREA OVERVIEW
AREA OVERVIEW

19
04 TENANT SUMMARY
7319 NE 37TH AVE, VANCOUVER, WA 98665

20TENANT SUMMARY
21
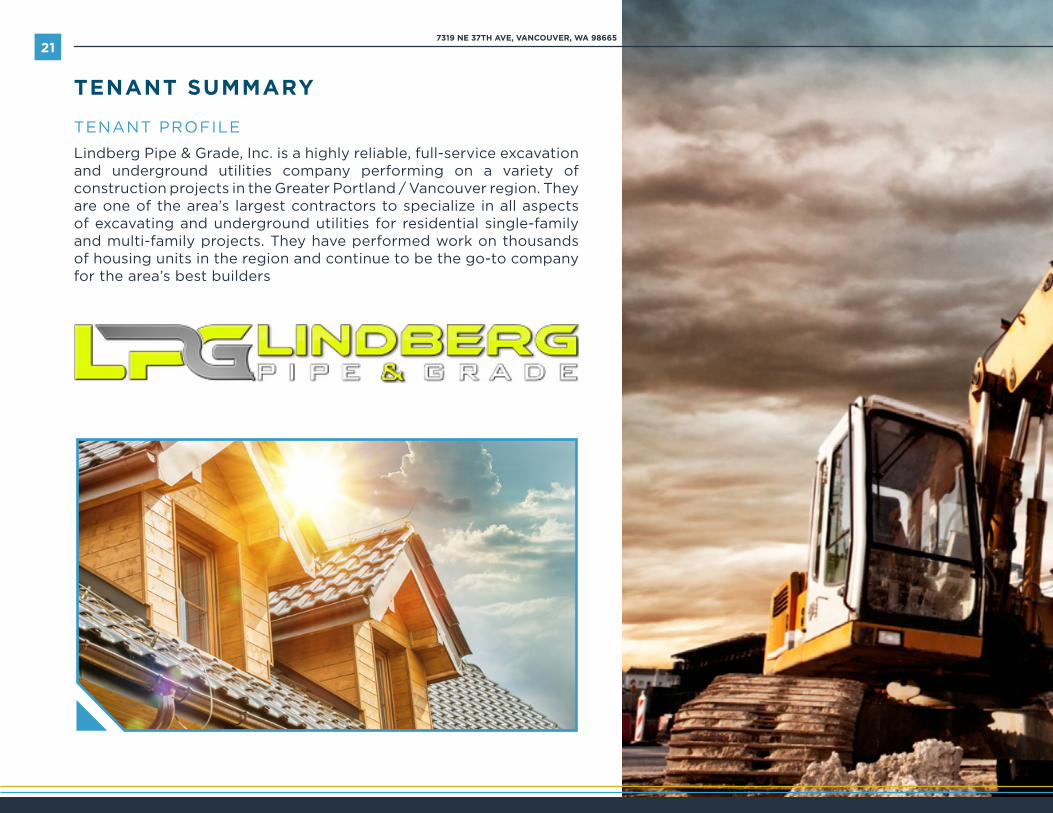
TENANT PROFILE
Lindberg Pipe & Grade, Inc. is a highly reliable, full-service excavation and underground utilities company performing on a variety of construction projects in the Greater Portland / Vancouver region. They are one of the area’s largest contractors to specialize in all aspects of excavating and underground utilities for residential single-family and multi-family projects. They have performed work on thousands of housing units in the region and continue to be the go-to company for the area’s best builders
TENANT SUMMARY
7319 NE 37TH AVE, VANCOUVER, WA 98665

22TENANT SUMMARY
23
05 FINANCIAL OVERVIEW
7319 NE 37TH AVE, VANCOUVER, WA 98665

24FINANCIAL OVERVIEW
25
FINANCIAL OVERVIEW
You are solely responsible for independently verifying the information in this confidential memorandum. ANY RELIANCE ON IT IS SOLELY AT YOUR OWN RISK.
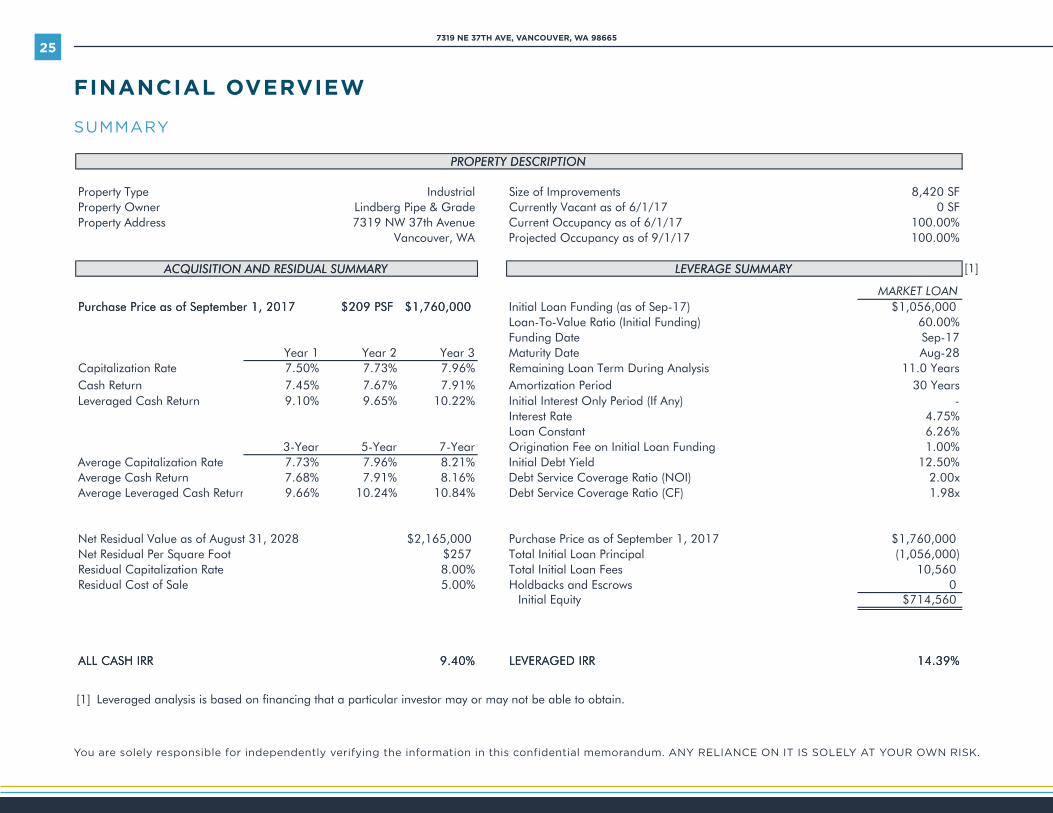
SUMMARY
LLiinnddbbeerrgg PPiippee && GGrraaddee11-Year Hold Period
EEXXEECCUUTTIIVVEE SSUUMMMMAARRYY
PPRROOPPEERRTTYY DDEESSCCRRIIPPTTIIOONN
FS 024,8stnemevorpmI fo eziSlairtsudnIepyT ytreporPFS 071/1/6 fo sa tnacaV yltnerruCedarG & epiP grebdniLrenwO ytreporP%00.00171/1/6 fo sa ycnapuccO tnerruCeunevA ht73 WN 9137sserddA ytreporP%00.00171/1/9 fo sa ycnapuccO detcejorPAW ,revuocnaV
AACCQQUUIISSIITTIIOONN AANNDD RREESSIIDDUUAALL SSUUMMMMAARRYY LLEEVVEERRAAGGEE SSUUMMMMAARRYY [1]
MARKET LOANPPuurrcchhaassee PPrriiccee aass ooff SSeepptteemmbbeerr 11,, 22001177 $$220099 PPSSFF $$11,,776600,,000000 000,650,1$)71-peS fo sa( gnidnuF naoL laitinI
%00.06)gnidnuF laitinI( oitaR eulaV-oT-naoL71-peSetaD gnidnuF82-guAetaD ytirutaM3 raeY2 raeY1 raeYsraeY 0.11sisylanA gniruD mreT naoL gniniameR%69.7%37.7%05.7etaR noitazilatipaCsraeY 03doireP noitazitromA%19.7%76.7%54.7nruteR hsaC-)ynA fI( doireP ylnO tseretnI laitinI%22.01%56.9%01.9nruteR hsaC degareveL
%57.4etaR tseretnI%62.6tnatsnoC naoL%00.1gnidnuF naoL laitinI no eeF noitanigirOraeY-7raeY-5raeY-3%05.21dleiY tbeD laitinI%12.8%69.7%37.7etaR noitazilatipaC egarevA00.2)ION( oitaR egarevoC ecivreS tbeD%61.8%19.7%86.7nruteR hsaC egarevA x
Average Leveraged Cash Return 89.1)FC( oitaR egarevoC ecivreS tbeD%48.01%42.01%66.9 x
000,067,1$7102 ,1 rebmetpeS fo sa ecirP esahcruP000,561,2$8202 ,13 tsuguA fo sa eulaV laudiseR teN)000,650,1(lapicnirP naoL laitinI latoT752$tooF erauqS reP laudiseR teN
065,01seeF naoL laitinI latoT%00.8etaR noitazilatipaC laudiseR0sworcsE dna skcabdloH%00.5elaS fo tsoC laudiseR065,417$ytiuqE laitinI
AALLLL CCAASSHH IIRRRR 99..4400%% LLEEVVEERRAAGGEEDD IIRRRR 1144..3399%%
[1] Leveraged analysis is based on financing that a particular investor may or may not be able to obtain.
© 2016 CBRE, Inc. The information contained in this document has been obtained from sources believed reliable. While CBRE, Inc. does not doubt its accuracy, CBRE, Inc. has not verified it and makes no guarantee, warranty or representation about it. It is your responsibility to independently confirm its accuracy and completeness. Any projections, opinions, assumptions or estimates used are for example only and do not represent the current or future performance of the property. The value of this transaction to you depends on tax and other factors which should be evaluated by your tax, financial and legal advisors. You and your advisors should conduct a careful, independent
investigation of the property to determine to your satisfaction the suitability of the property for your needs. CBRE and the CBRE logo are service marks of CBRE, Inc. and/or its affiliated or related companies in the United States and other countries.This is an opinion of value or comparative market analysis and should not be considered an appraisal.In making any decisions that rely upon this analysis, it should be noted that we have not followed the guidelines for
development of an appraisal or analysis contained in the Uniform Standards of Professional Appraisal Practice of The Appraisal Foundation.
5/26/2017 1:59 PM 2CBRE Financial Consulting Group
7319 NE 37TH AVE, VANCOUVER, WA 98665
26
FINANCIAL OVERVIEW
You are solely responsible for independently verifying the information in this confidential memorandum. ANY RELIANCE ON IT IS SOLELY AT YOUR OWN RISK.
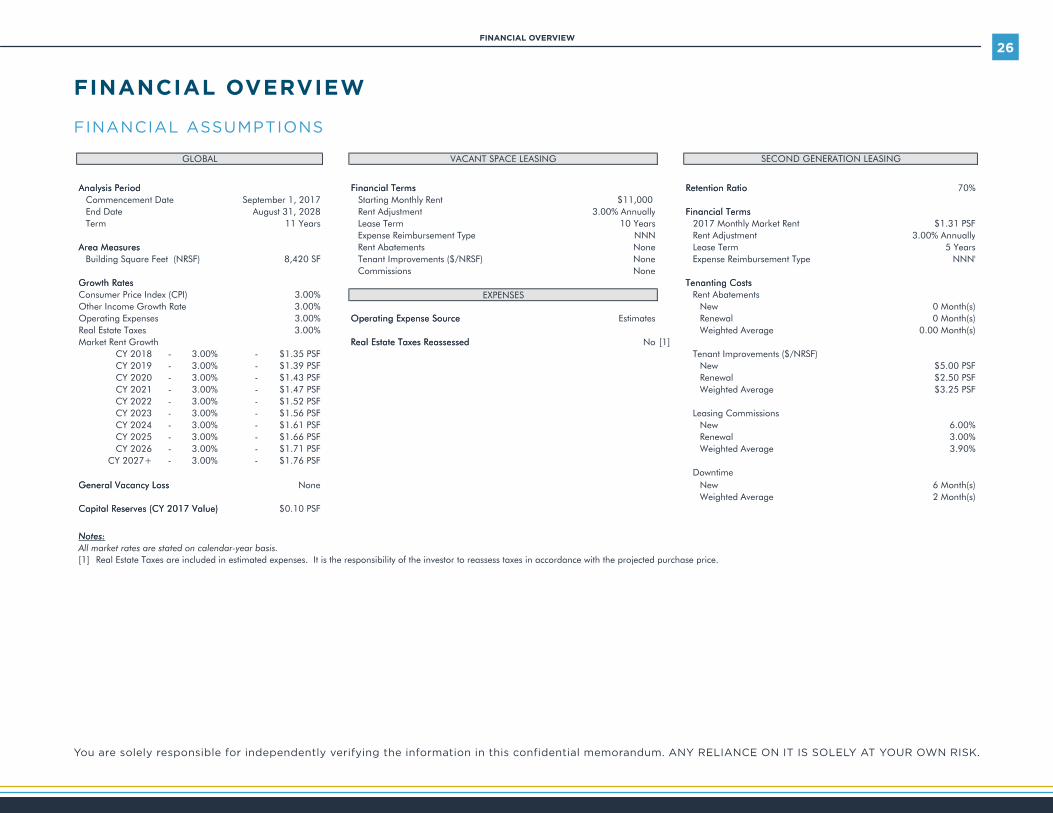
FINANCIAL ASSUMPTIONS
LLiinnddbbeerrgg PPiippee && GGrraaddee11-Year Hold Period
SSUUMMMMAARRYY OOFF FFIINNAANNCCIIAALL AASSSSUUMMPPTTIIOONNSS
GLOBAL VACANT SPACE LEASING SECOND GENERATION LEASING
AAnnaallyyssiiss PPeerriioodd FFiinnaanncciiaall TTeerrmmss RReetteennttiioonn RRaattiioo 70%000,11$tneR ylhtnoM gnitratS7102 ,1 rebmetpeSetaD tnemecnemmoCllaunnA %00.3tnemtsujdA tneR8202 ,13 tsuguAetaD dnE y FFiinnaanncciiaall TTeerrmmss
FSP 13.1$tneR tekraM ylhtnoM 7102sraeY 01 mreT esaeLsraeY 11mreTllaunnA %00.3tnemtsujdA tneRNNNepyT tnemesrubmieR esnepxE y
AArreeaa MMeeaassuurreess sraeY 5mreT esaeLenoNstnemetabA tneRBuilding Square Feet (NRSF) 8,420 SF Tenant Improv epxEenoN)FSRN/$( stneme 'NNNepyT tnemesrubmieR esn
enoNsnoissimmoCGGrroowwtthh RRaatteess TTeennaannttiinngg CCoossttss
%00.3)IPC( xednI ecirP remusnoC EXPENSES Rent Abatements%00.3etaR htworG emocnI rehtO )s(htnoM 0weN%00.3sesnepxE gnitarepO OOppeerraattiinngg EExxppeennssee SSoouurrccee )s(htnoM 0laweneRsetamitsE%00.3sexaT etatsE laeR W )s(htnoM 00.0egarevA dethgie
Market Rent Growth RReeaall EEssttaattee TTaaxxeess RReeaasssseesssseedd No [1]CY 2018 - 3.00% - $1.35 PSF Tenant Improvements ($/NRSF)CY 2019 - 3.00% - $1.39 PSF FSP 00.5$ weNCY 2020 - 3.00% - $1.43 PSF FSP 05.2$ laweneRCY 2021 - 3.00% - $1.47 PSF W FSP 52.3$ egarevA dethgieCY 2022 - 3.00% - $1.52 PSFCY 2023 - 3.00% - $1.56 PSF Leasing CommissionsCY 2024 - 3.00% - $1.61 PSF %00.6 weNCY 2025 - 3.00% - $1.66 PSF %00.3 laweneRCY 2026 - 3.00% - $1.71 PSF W %09.3 egarevA dethgie
CY 2027+ - 3.00% - $1.76 PSFDowntime
GGeenneerraall VVaaccaannccyy LLoossss None )s(htnoM 6 weN5.00% W )s(htnoM 2 egarevA dethgie
CCaappiittaall RReesseerrvveess ((CCYY 22001177 VVaalluuee)) $0.10 PSF
NNootteess::All market rates are stated on calendar-year basis.[1] Real Estate Taxes are included in estimated expenses. It is the responsibility of the investor to reassess taxes in accordance with the projected purchase price.
5/26/2017 1:59 PM 3
This page is part of a package and is subject to the disclaimer on the Executive Summary.CBRE Financial Consulting Group
FINANCIAL OVERVIEW
27
FINANCIAL OVERVIEW
You are solely responsible for independently verifying the information in this confidential memorandum. ANY RELIANCE ON IT IS SOLELY AT YOUR OWN RISK.
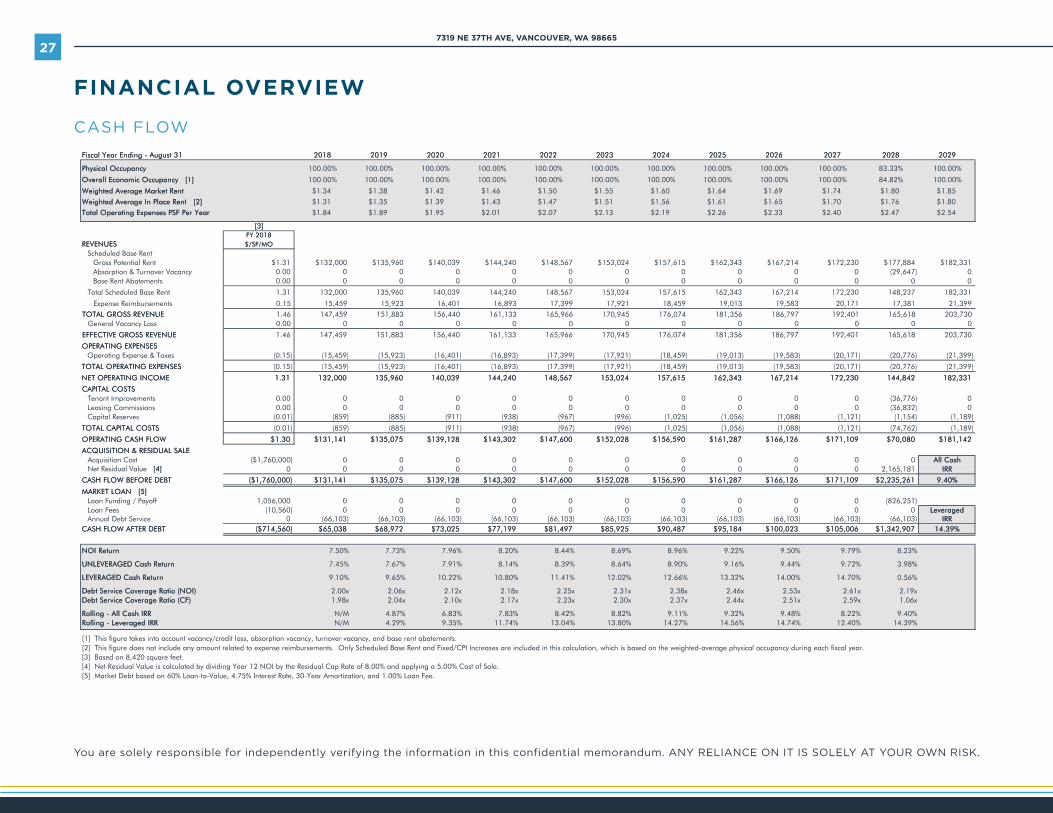
CASH FLOW
LLiinnddbbeerrgg PPiippee && GGrraaddee11-Year Hold Period
CCAASSHH FFLLOOWW PPRROOJJEECCTTIIOONNSS
FFiissccaall YYeeaarr EEnnddiinngg -- AAuugguusstt 3311 22001188 22001199 22002200 22002211 22002222 22002233 22002244 22002255 22002266 22002277 22002288 22002299
PPhhyyssiiccaall OOccccuuppaannccyy 100.00% 100.00% 100.00% 100.00% 100.00% 100.00% 100.00% 100.00% 100.00% 100.00% 83.33% 100.00%
OOvveerraallll EEccoonnoommiicc OOccccuuppaannccyy [[11]] 100.00% 100.00% 100.00% 100.00% 100.00% 100.00% 100.00% 100.00% 100.00% 100.00% 84.82% 100.00%
WWeeiigghhtteedd AAvveerraaggee MMaarrkkeett RReenntt $1.34 $1.38 $1.42 $1.46 $1.50 $1.55 $1.60 $1.64 $1.69 $1.74 $1.80 $1.85
WWeeiigghhtteedd AAvveerraaggee IInn PPllaaccee RReenntt [[22]] $1.31 $1.35 $1.39 $1.43 $1.47 $1.51 $1.56 $1.61 $1.65 $1.70 $1.76 $1.80
TToottaall OOppeerraattiinngg EExxppeennsseess PPSSFF PPeerr YYeeaarr $1.84 $1.89 $1.95 $2.01 $2.07 $2.13 $2.19 $2.26 $2.33 $2.40 $2.47 $2.54
[[33]]FFYY 22001188
RREEVVEENNUUEESS $$//SSFF//MMOOScheduled Base Rent
133,281$488,771$032,271$412,761$343,261$516,751$420,351$765,841$042,441$930,041$069,531$000,231$13.1$tneR laitnetoP ssorGAbsorption & Turnover Vacancy 0.00 0 0 0 0 0 0 0 0 0 0 (29,647) 0
00000000000000.0stnemetabA tneR esaB
133,281732,841032,271412,761343,261516,751420,351765,841042,441930,041069,531000,23113.1tneR esaB deludehcS latoT
993,12183,71171,02385,91310,91954,81129,71993,71398,61104,61329,51954,5151.0stnemesrubmieR esnepxE
TTOOTTAALL GGRROOSSSS RREEVVEENNUUEE 1.46 147,459 151,883 156,440 161,133 165,966 170,945 176,074 181,356 186,797 192,401 165,618 203,73000000000000000.0ssoL ycnacaV lareneG
EEFFFFEECCTTIIVVEE GGRROOSSSS RREEVVEENNUUEE 1.46 147,459 151,883 156,440 161,133 165,966 170,945 176,074 181,356 186,797 192,401 165,618 203,730
OOPPEERRAATTIINNGG EEXXPPEENNSSEESS)993,12()677,02()171,02()385,91()310,91()954,81()129,71()993,71()398,61()104,61()329,51()954,51()51.0(sexaT & esnepxE gnitarepO
TTOOTTAALL OOPPEERRAATTIINNGG EEXXPPEENNSSEESS (0.15) (15,459) (15,923) (16,401) (16,893) (17,399) (17,921) (18,459) (19,013) (19,583) (20,171) (20,776) (21,399)
NNEETT OOPPEERRAATTIINNGG IINNCCOOMMEE 11..3311 113322,,000000 113355,,996600 114400,,003399 114444,,224400 114488,,556677 115533,,002244 115577,,661155 116622,,334433 116677,,221144 117722,,223300 114444,,884422 118822,,333311
CCAAPPIITTAALL CCOOSSTTSS,63(000000000000.0stnemevorpmI tnaneT 776) 0,63(000000000000.0snoissimmoC gnisaeL 832) 0
)981,1()451,1()121,1()880,1()650,1()520,1()699()769()839()119()588()958()10.0(sevreseR latipaC
TTOOTTAALL CCAAPPIITTAALL CCOOSSTTSS (0.01) (859) (885) (911) (938) (967) (996) (1,025) (1,056) (1,088) (1,121) (74,762) (1,189)
OOPPEERRAATTIINNGG CCAASSHH FFLLOOWW $$11..3300 $$113311,,114411 $$113355,,007755 $$113399,,112288 $$114433,,330022 $$114477,,660000 $$115522,,002288 $$115566,,559900 $$116611,,228877 $$116666,,112266 $$117711,,110099 $$7700,,008800 $$118811,,114422
AACCQQUUIISSIITTIIOONN && RREESSIIDDUUAALL SSAALLEE)000,067,1$(tsoC noitisiuqcA 0 0 0 0 0 0 0 0 0 0 0 AAllll CCaasshh
Net Residual Value [[44]] 0 0 0 0 0 0 0 0 0 0 0 2,165,181 IIRRRR
CCAASSHH FFLLOOWW BBEEFFOORREE DDEEBBTT (($$11,,776600,,000000)) $$113311,,114411 $$113355,,007755 $$113399,,112288 $$114433,,330022 $$114477,,660000 $$115522,,002288 $$115566,,559900 $$116611,,228877 $$116666,,112266 $$117711,,110099 $$22,,223355,,226611 99..4400%%
MMAARRKKEETT LLOOAANN [[55]]00,650,1ffoyaP / gnidnuF naoL 0 0 0 0 0 0 0 0 0 0 0 (826,251)
)065,01(seeF naoL 0 0 0 0 0 0 0 0 0 0 0 LLeevveerraaggeedd)301,66()301,66()301,66()301,66()301,66()301,66()301,66()301,66()301,66()301,66()301,66(0ecivreS tbeD launnA IIRRRR
CCAASSHH FFLLOOWW AAFFTTEERR DDEEBBTT (($$771144,,556600)) $$6655,,003388 $$6688,,997722 $$7733,,002255 $$7777,,119999 $$8811,,449977 $$8855,,992255 $$9900,,448877 $$9955,,118844 $$110000,,002233 $$110055,,000066 $$11,,334422,,990077 1144..3399%%
NNOOII RReettuurrnn 7.50% 7.73% 7.96% 8.20% 8.44% 8.69% 8.96% 9.22% 9.50% 9.79% 8.23%
UUNNLLEEVVEERRAAGGEEDD CCaasshh RReettuurrnn 7.45% 7.67% 7.91% 8.14% 8.39% 8.64% 8.90% 9.16% 9.44% 9.72% 3.98%
LLEEVVEERRAAGGEEDD CCaasshh RReettuurrnn 9.10% 9.65% 10.22% 10.80% 11.41% 12.02% 12.66% 13.32% 14.00% 14.70% 0.56%
DDeebbtt SSeerrvviiccee CCoovveerraaggee RRaattiioo ((NNOOII)) 2.00x 2.06x 2.12x 2.18x 2.25x 2.31x 2.38x 2.46x 2.53x 2.61x 2.19xDDeebbtt SSeerrvviiccee CCoovveerraaggee RRaattiioo ((CCFF)) 1.98x 2.04x 2.10x 2.17x 2.23x 2.30x 2.37x 2.44x 2.51x 2.59x 1.06x
RRoolllliinngg -- AAllll CCaasshh IIRRRR N/M 4.87% 6.83% 7.83% 8.42% 8.82% 9.11% 9.32% 9.48% 8.22% 9.40%RRoolllliinngg -- LLeevveerraaggeedd IIRRRR N/M 4.29% 9.35% 11.74% 13.04% 13.80% 14.27% 14.56% 14.74% 12.40% 14.39%
[1] This figure takes into account vacancy/credit loss, absorption vacancy, turnover vacancy, and base rent abatements.[2] This figure does not include any amount related to expense reimbursements. Only Scheduled Base Rent and Fixed/CPI Increases are included in this calculation, which is based on the weighted-average physical occupancy during each fiscal year.[3] Based on 8,420 square feet.[4] Net Residual Value is calculated by dividing Year 12 NOI by the Residual Cap Rate of 8.00% and applying a 5.00% Cost of Sale.[5] Market Debt based on 60% Loan-to-Value, 4.75% Interest Rate, 30-Year Amortization, and 1.00% Loan Fee.
5/26/2017 1:59 PM 4
This page is part of a package and is subject to the disclaimer on the Executive Summary.CBRE Financial Consulting Group
7319 NE 37TH AVE, VANCOUVER, WA 98665

28
FINANCIAL OVERVIEW
You are solely responsible for independently verifying the information in this confidential memorandum. ANY RELIANCE ON IT IS SOLELY AT YOUR OWN RISK.
PRICING MATRIX
LLiinnddbbeerrgg PPiippee && GGrraaddee11-Year Hold Period
PPRRIICCIINNGG MMAATTRRIIXX((VVAARRIIAABBLLEE ''IINNIITTIIAALL CCAAPPIITTAALLIIZZAATTIIOONN RRAATTEE''))
ALL CASH
DiscountC-no-hsaCsetaR noitazilatipaCetaReulaV .tsEdetamitsE ash Returns Components of Value Percentage of Value
Value [1] PSF [2] (IRR) In-Place YYeeaarr 11 Year 2 5-Year Avg Year 1 5-Year Average Cash Flow Residual [3] % Cash Flow % Residual
$1,956,000 $232.25 7.95% 6.75% 66..7755%% 6.95% 7.17% 6.71% 7.12% $1,023,000 $933,000 52.31% 47.71%$1,886,000 $223.96 8.45% 7.00% 77..0000%% 7.21% 7.43% 6.95% 7.38% $999,000 $887,000 52.98% 47.04%$1,821,000 $216.23 8.93% 7.25% 77..2255%% 7.47% 7.70% 7.20% 7.65% $976,000 $845,000 53.61% 46.41%$$11,,776600,,000000 $$220099..0033 99..4400%% 77..5500%% 77..5500%% 77..7733%% 77..9966%% 77..4455%% 77..9911%% $$995544,,000000 $$880066,,000000 5544..2200%% 4455..8800%%$1,703,000 $202.28 9.86% 7.75% 77..7755%% 7.98% 8.23% 7.70% 8.18% $933,000 $770,000 54.78% 45.21%$1,650,000 $195.96 10.31% 8.00% 88..0000%% 8.24% 8.49% 7.95% 8.44% $914,000 $736,000 55.39% 44.61%$1,600,000 $190.02 10.75% 8.25% 88..2255%% 8.50% 8.76% 8.20% 8.70% $896,000 $704,000 56.00% 44.00%
LEVERAGED
DiscountitinIsnruteR hsaC-no-hsaC degareveLetaReulaV .tsEdetamitsE al Initial Equity Components of Equity Percentage of Equity
Value [1] PSF [2] (IRR) Year 1 Year 2 Year 3 5-Year Avg Loan Amount [4] (with Loan Fees) Cash Flow Residual % Cash Flow % Residual
$1,956,000 $232.25 11.55% 7.27% 7.76% 8.27% 8.29% $1,173,000 $794,000 $419,000 $375,000 52.77% 47.23%$1,886,000 $223.96 12.53% 7.88% 8.39% 8.92% 8.94% $1,131,000 $766,000 $417,000 $349,000 54.44% 45.56%$1,821,000 $216.23 13.47% 8.49% 9.02% 9.57% 9.59% $1,092,000 $739,000 $413,000 $326,000 55.89% 44.11%$$11,,776600,,000000 $$220099..0033 1144..3399%% 99..1100%% 99..6655%% 1100..2222%% 1100..2244%% $$11,,005566,,000000 $$771155,,000000 $$441100,,000000 $$330055,,000000 5577..3344%% 4422..6666%%$1,703,000 $202.28 15.27% 9.71% 10.28% 10.87% 10.89% $1,022,000 $692,000 $406,000 $286,000 58.67% 41.33%$1,650,000 $195.96 16.13% 10.33% 10.91% 11.52% 11.54% $990,000 $670,000 $402,000 $268,000 60.00% 40.00%$1,600,000 $190.02 16.96% 10.94% 11.54% 12.17% 12.19% $960,000 $650,000 $398,000 $252,000 61.23% 38.77%
[1] Real Estate Taxes have not been reassessed in this analysis.[2] Based on 8,420 Square Feet.[3] Residual Value is calculated using a residual cap rate of 8.00% with a 5.00% cost of sale.[4] Market Debt based on 60% Loan-to-Value, 4.75% Interest Rate, 30-Year Amortization, and a 1.00% Loan Fee.
5/26/2017 1:59 PM 5
This page is part of a package and is subject to the disclaimer on the Executive Summary.CBRE Financial Consulting Group
FINANCIAL OVERVIEW
29
FINANCIAL OVERVIEW
You are solely responsible for independently verifying the information in this confidential memorandum. ANY RELIANCE ON IT IS SOLELY AT YOUR OWN RISK.
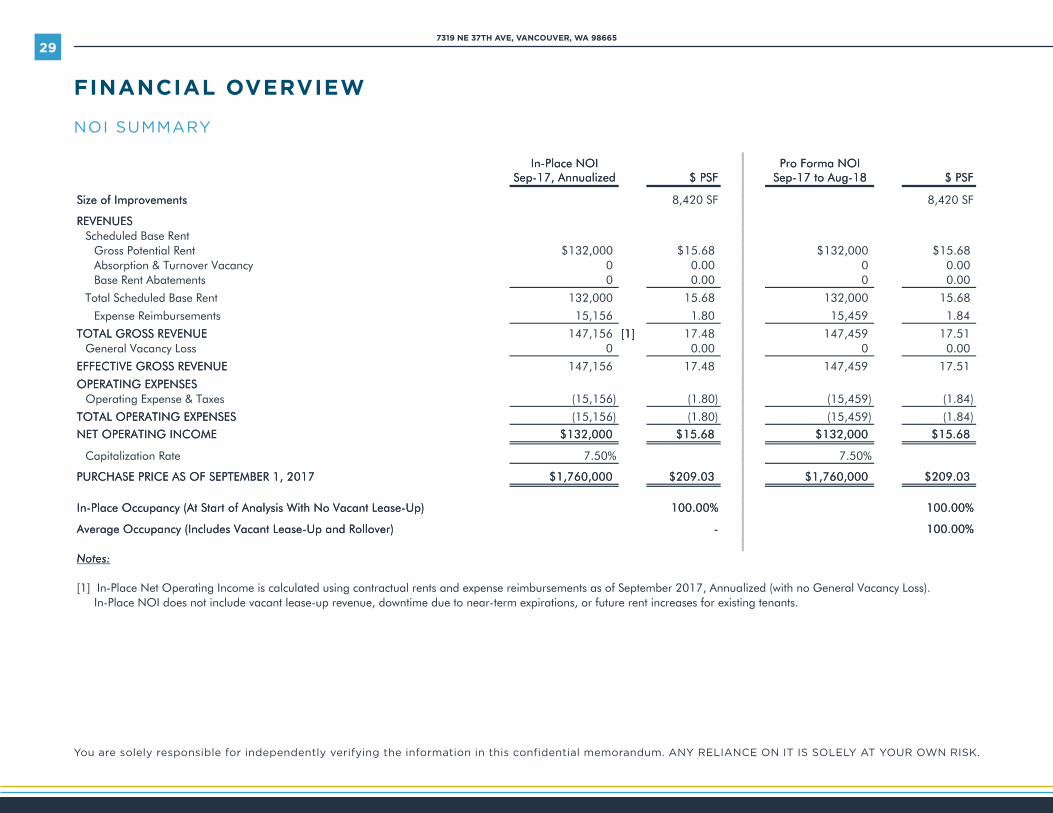
NOI SUMMARY
LLiinnddbbeerrgg PPiippee && GGrraaddee11-Year Hold Period
IINN--PPLLAACCEE AANNDD PPRROOJJEECCTTEEDD NNOOII SSUUMMMMAARRYY
IInn--PPllaaccee NNOOII PPrroo FFoorrmmaa NNOOIISSeepp--1177,, AAnnnnuuaalliizzeedd $$ PPSSFF SSeepp--1177 ttoo AAuugg--1188 $$ PPSSFF
SSiizzee ooff IImmpprroovveemmeennttss FS 024,8FS 024,8
RREEVVEENNUUEESSScheduled Base Rent
86.51$000,231$86.51$000,231$tneR laitnetoP ssorGAbsorption & Turnover Vacancy 00.0000.00Base Rent Abatements 00.0000.00
86.51000,23186.51000,231tneR esaB deludehcS latoT
48.1954,5108.1651,51stnemesrubmieR esnepxE
TTOOTTAALL GGRROOSSSS RREEVVEENNUUEE 147,156 [[11]] 17.48 147,459 17.51General Vacancy Loss 00.0000.00
EEFFFFEECCTTIIVVEE GGRROOSSSS RREEVVEENNUUEE 147,156 17.48 147,459 17.51
OOPPEERRAATTIINNGG EEXXPPEENNSSEESS)48.1()954,51()08.1()651,51(sexaT & esnepxE gnitarepO
TTOOTTAALL OOPPEERRAATTIINNGG EEXXPPEENNSSEESS (15,156) (1.80) (15,459) (1.84)
NNEETT OOPPEERRAATTIINNGG IINNCCOOMMEE $$113322,,000000 $$1155..6688 $$113322,,000000 $$1155..6688
Capitalization Rate %05.7%05.7
PPUURRCCHHAASSEE PPRRIICCEE AASS OOFF SSEEPPTTEEMMBBEERR 11,, 22001177 $$11,,776600,,000000 $$220099..0033 $$11,,776600,,000000 $$220099..0033
IInn--PPllaaccee OOccccuuppaannccyy ((AAtt SSttaarrtt ooff AAnnaallyyssiiss WWiitthh NNoo VVaaccaanntt LLeeaassee--UUpp)) 110000..0000%% 110000..0000%%
AAvveerraaggee OOccccuuppaannccyy ((IInncclluuddeess VVaaccaanntt LLeeaassee--UUpp aanndd RRoolllloovveerr)) -- 110000..0000%%
NNootteess::
[1] In-Place Net Operating Income is calculated using contractual rents and expense reimbursements as of September 2017, Annualized (with no General Vacancy Loss).In-Place NOI does not include vacant lease-up revenue, downtime due to near-term expirations, or future rent increases for existing tenants.
5/26/2017 1:59 PM 6
This page is part of a package and is subject to the disclaimer on the Executive Summary.CBRE Financial Consulting Group
7319 NE 37TH AVE, VANCOUVER, WA 98665

30
FINANCIAL OVERVIEW
You are solely responsible for independently verifying the information in this confidential memorandum. ANY RELIANCE ON IT IS SOLELY AT YOUR OWN RISK.
MARKET COMPARISON
LLiinnddbbeerrgg PPiippee && GGrraaddee11-Year Hold Period
EEXXIISSTTIINNGG VVEERRSSUUSS MMAARRKKEETT CCOOMMPPAARRIISSOONN
PPeerrcceennttaaggeeSSqquuaarree LLeeaassee LLeeaassee EExxiissttiinngg RReenntt MMaarrkkeett RReenntt AAbboovvee//((BBeellooww))
SSuuiittee TTeennaanntt aatt SSeepptteemmbbeerr 11,, 22001177 FFeeeett SSttaarrtt EEnndd aass ooff SSeepp 11,, 22001177 aass ooff SSeepp 11,, 22001177 MMaarrkkeett RReenntt [[11]]
EExxiissttiinngg TTeennaannttss
Lindberg Pipe & Grade 8,420 Sep-17 Aug-27 $1.31 PSF NNN $1.31 PSF NNN -0.27%
Total Existing Square Feet 88,,442200 $1.31 $1.31 -0.27%
WWeeiigghhtteedd--AAvveerraaggee LLeeaassee TTeerrmm RReemmaaiinniinngg:: 1100..0000 YYeeaarrss
[1] The calculation of total "Percentage Above/(Below) Market Rent" only includes existing tenants as noted in this schedule.
5/26/2017 1:59 PM 7
This page is part of a package and is subject to the disclaimer on the Executive Summary.CBRE Financial Consulting Group
FINANCIAL OVERVIEW

31
FINANCIAL OVERVIEW
You are solely responsible for independently verifying the information in this confidential memorandum. ANY RELIANCE ON IT IS SOLELY AT YOUR OWN RISK.
LEASE EXPIRATIONS
LLiinnddbbeerrgg PPiippee && GGrraaddee11-Year Hold Period
EEXXIISSTTIINNGG LLEEAASSEE EEXXPPIIRRAATTIIOONNSS
CCoonnttrraacctt PPrroojjeecctteeddTToottaall AAnnnnuuaall CCuummuullaattiivvee RReenntt MMkktt.. RReenntt $$ %%
DDaattee TTeennaanntt SSuuiitteess SSFF ((%% ooff SSFF)) [[11]] ((%% ooff SSFF)) [[11]] AAtt EExxppiirraattiioonn AAtt EExxppiirraattiioonn VVaarriiaannccee VVaarriiaannccee
%02.3-)60.0$(67.1$07.1$%00.001024,8edarG & epiP grebdniL72-guA
FYE 2027 Totals 8,420 100.00% 100.00% $1.70 $1.76 ($0.06) -3.20%
SSuubbttoottaall 8,420 100.00%%00.001%00.00tnacaV
TTOOTTAALL 8,420 100.00%
[1] Based on 8,420 total building square feet.
5/26/2017 1:59 PM 8
This page is part of a package and is subject to the disclaimer on the Executive Summary.CBRE Financial Consulting Group
Lindberg Pipe & Grade11-Year Hold Period
EEXXIISSTTIINNGG LLEEAASSEE EEXXPPIIRRAATTIIOONNSS[[11]]
FFiissccaall NNeett RReennttaabbllee PPeerrcceennttaaggee CCuummuullaattiivvee WWeeiigghhtteedd.. AAvveerraaggee PPrroojjeecctteeddYYeeaarr EEnnddiinngg NNuummbbeerr SSqquuaarree FFeeeett SSqquuaarree FFeeeett SSqquuaarree FFeeeett CCoonnttrraacctt RReenntt MMaarrkkeett RReenntt $$ %%
AAuugguusstt ooff SSuuiitteess EExxppiirriinngg EExxppiirriinngg EExxppiirriinngg AAtt EExxppiirraattiioonn AAtt EExxppiirraattiioonn VVaarriiaannccee VVaarriiaannccee
Currently Vacant 0 0 0.00%2027 1 8,420 100.00% 100.00% $1.70 $1.76 ($0.06) -3.20%
MMaarrkkeett RReenntt AAtt EExxppiirraattiioonn vvss.. WWeeiigghhtteedd AAvveerraaggee CCoonnttrraacctt RReenntt AAtt EExxppiirraattiioonn [[11]]
[1] The years in which no existing tenants expire are not reflected on this graph.
$1.67
$1.68
$1.69
$1.70
$1.71
$1.72
$1.73
$1.74
$1.75
$1.76
$1.77
0.00%
10.00%
20.00%
30.00%
40.00%
50.00%
60.00%
70.00%
80.00%
90.00%
100.00%
7202tnacaV yltnerruC
MMiinn
iimmuumm
RReenn
tt PPeerr
SSqquu
aarree
FFoooott
% of Building Expiring Proj. Market Rent at Expiration Wtd. Avg. Expiring Contract Rent
PPeerrcc
eenntt EE
xxppiirrii
nngg
5/26/2017 1:59 PM 9
This page is part of a package and is subject to the disclaimer on the Executive Summary.CBRE Financial Consulting Group
Lindberg Pipe & Grade11-Year Hold Period
EEXXIISSTTIINNGG LLEEAASSEE EEXXPPIIRRAATTIIOONNSS[[11]]
FFiissccaall NNeett RReennttaabbllee PPeerrcceennttaaggee CCuummuullaattiivvee WWeeiigghhtteedd.. AAvveerraaggee PPrroojjeecctteeddYYeeaarr EEnnddiinngg NNuummbbeerr SSqquuaarree FFeeeett SSqquuaarree FFeeeett SSqquuaarree FFeeeett CCoonnttrraacctt RReenntt MMaarrkkeett RReenntt $$ %%
AAuugguusstt ooff SSuuiitteess EExxppiirriinngg EExxppiirriinngg EExxppiirriinngg AAtt EExxppiirraattiioonn AAtt EExxppiirraattiioonn VVaarriiaannccee VVaarriiaannccee
Currently Vacant 0 0 0.00%2027 1 8,420 100.00% 100.00% $1.70 $1.76 ($0.06) -3.20%
MMaarrkkeett RReenntt AAtt EExxppiirraattiioonn vvss.. WWeeiigghhtteedd AAvveerraaggee CCoonnttrraacctt RReenntt AAtt EExxppiirraattiioonn [[11]]
[1] The years in which no existing tenants expire are not reflected on this graph.
$1.67
$1.68
$1.69
$1.70
$1.71
$1.72
$1.73
$1.74
$1.75
$1.76
$1.77
0.00%
10.00%
20.00%
30.00%
40.00%
50.00%
60.00%
70.00%
80.00%
90.00%
100.00%
7202tnacaV yltnerruCMM
iinniimm
uumm RR
eenntt PP
eerr SS
qquuaarr
ee FFoo
oott
% of Building Expiring Proj. Market Rent at Expiration Wtd. Avg. Expiring Contract Rent
PPeerrcc
eenntt EE
xxppiirrii
nngg
5/26/2017 1:59 PM 9
This page is part of a package and is subject to the disclaimer on the Executive Summary.CBRE Financial Consulting Group
7319 NE 37TH AVE, VANCOUVER, WA 98665
32
FINANCIAL OVERVIEW
You are solely responsible for independently verifying the information in this confidential memorandum. ANY RELIANCE ON IT IS SOLELY AT YOUR OWN RISK.
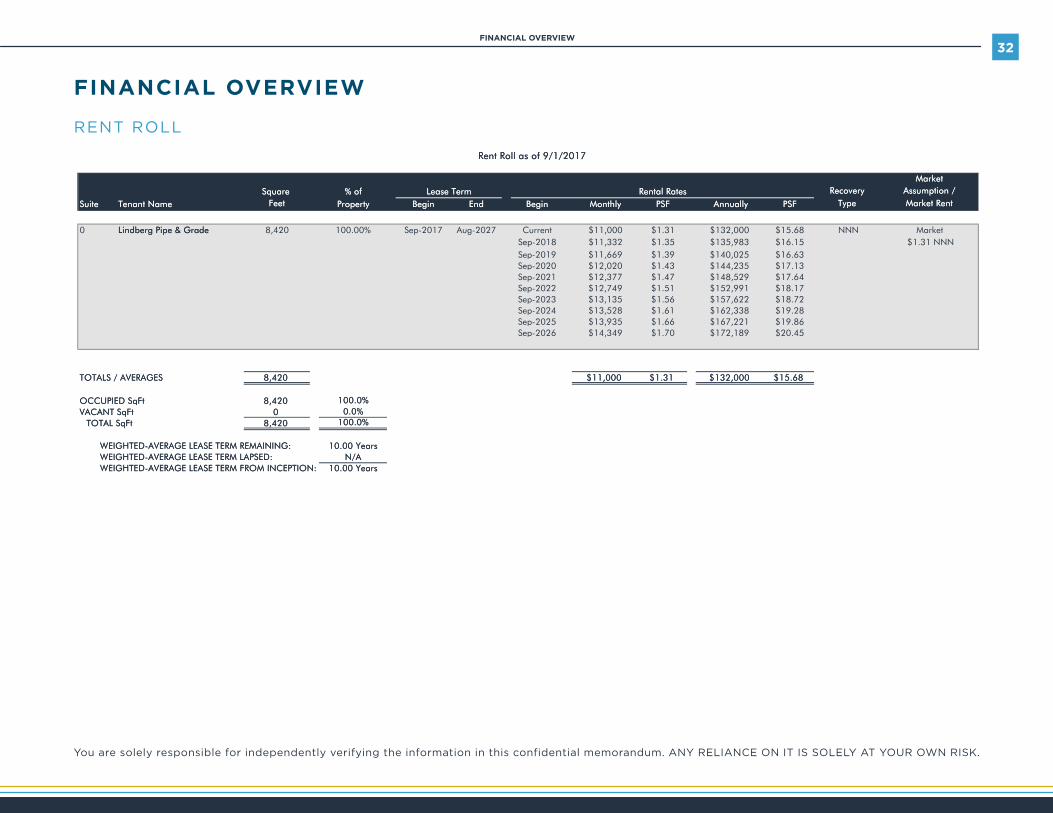
RENT ROLL Lindberg Pipe & Grade
11-Year Hold Period
RReenntt RRoollll aass ooff 99//11//22001177
MMaarrkkeettSSqquuaarree %% ooff LLeeaassee TTeerrmm RReennttaall RRaatteess RReeccoovveerryy AAssssuummppttiioonn //
SSuuiittee TTeennaanntt NNaammee FFeeeett PPrrooppeerrttyy BBeeggiinn EEnndd BBeeggiinn MMoonntthhllyy PPSSFF AAnnnnuuaallllyy PPSSFF TTyyppee MMaarrkkeett RReenntt
0 LLiinnddbbeerrgg PPiippee && GGrraaddee 8,420 tekraM86.51$000,231$13.1$000,11$tnerruC7202-guA7102-peS%00.001Sep-2018 $11,332 $1.35 $135,983 $16.15Sep-2019 $11,669 $1.39 $140,025 $16.63Sep-2020 $12,020 $1.43 $144,235 $17.13Sep-2021 $12,377 $1.47 $148,529 $17.64Sep-2022 $12,749 $1.51 $152,991 $18.17Sep-2023 $13,135 $1.56 $157,622 $18.72Sep-2024 $13,528 $1.61 $162,338 $19.28Sep-2025 $13,935 $1.66 $167,221 $19.86Sep-2026 $14,349 $1.70 $172,189 $20.45
TTOOTTAALLSS // AAVVEERRAAGGEESS 88,,442200 $$1111,,000000 $$11..3311 $$113322,,000000 $$1155..6688
OOCCCCUUPPIIEEDD SSqqFFtt 88,,442200 110000..00%%VVAACCAANNTT SSqqFFtt 00 00..00%%
TTOOTTAALL SSqqFFtt 88,,442200 110000..00%%
WWEEIIGGHHTTEEDD--AAVVEERRAAGGEE LLEEAASSEE TTEERRMM RREEMMAAIINNIINNGG:: 1100..0000 YYeeaarrssWWEEIIGGHHTTEEDD--AAVVEERRAAGGEE LLEEAASSEE TTEERRMM LLAAPPSSEEDD:: NN//AAWWEEIIGGHHTTEEDD--AAVVEERRAAGGEE LLEEAASSEE TTEERRMM FFRROOMM IINNCCEEPPTTIIOONN:: 1100..0000 YYeeaarrss
NNN $1.31 NNN
5/26/2017 1:59 PM 10
This page is part of a package and is subject to the disclaimer on the Executive Summary.CBRE Financial Consulting Group
FINANCIAL OVERVIEW

FOR ADDITIONAL INFORMATION PLEASE CONTACT:
STUART SKAUG, SIOR+1 503 221 [email protected] IN OR & WACBRE.COM/STUART.SKAUG
JAKE BIGBY+1 503 221 [email protected] IN OR & WACBRE.COM/JAKE.BIGBY
CBRE, INC.1300 SW 5TH AVE.SUITE 3000PORTLAND, OR 97201CBRE.COM/PORTLAND
© 2017 CBRE, Inc. The information contained in this document has been obtained from sources believed reliable. While CBRE, Inc. does not doubt its accuracy, CBRE, Inc. has not verified it and makes no guarantee, warranty or representation about it. It is your responsibility to independently confirm its accuracy and completeness. Any projections, opinions, assumptions or estimates used are for example only and do not represent the current or future performance of the property. The value of this transaction to you depends on tax and other factors which should be evaluated by your tax, financial and legal advisors. You and your advisors should conduct a careful, independent investigation of the property to determine to your satisfaction the suitability of the property for your needs. CBRE and the CBRE logo are service marks of CBRE, Inc. and/or its affiliated or related companies in the United States and other countries. All other marks displayed on this document are the property of their respective owners. Photos herein are the property of their respective owners and use of these images without the express written consent of the owner is prohibited. JW_7_3_17
CORPORATE SALE-LEASEBACKINVESTMENT PROPERTY OPPORTUNITY 7319 NE 37TH AVE, VANCOUVER, WA 98665
7319 NE 37TH AVEVANCOUVER, WA 98665