Corporate profile 2 Alfalah Limited MCB Bank Limited Bank Islami Pakistan Limited Meezan Bank...
34
Transcript of Corporate profile 2 Alfalah Limited MCB Bank Limited Bank Islami Pakistan Limited Meezan Bank...


Corporate profile ......................................................................................................................... 2
Directors’ Report to the Shareholders........................................................................................ 3
Auditors Report to the Members ................................................................................................ 5
Financial Statements .................................................................................................................. 6
Directors’ Report on the Consolidated Financial Statements .................................................... 18
Consolidated Financial Statements ........................................................................................... 19
CONTENTS
012013 HALF YEAR

CORPORATE PROFILE
02 2013HALF YEAR
Board of Directors Mrs. Naz Mansha Chairperson Mian Raza Mansha Chief Executive Mr. Khalid Qadeer Qureshi Dr. Arif Bashir Mr. Farid Noor Ali Fazal Mr. Inayat Ullah Niazi Chief Financial Officer Ms. Nabiha Shahnawaz Cheema
Audit Committee Mr. Khalid Qadeer Qureshi Member/Chairman Mr. Farid Noor Ali Fazal Member Ms. Nabiha Shahnawaz Cheema Member
Human Resource & Mian Raza Mansha Member Remuneration Committee Mr. Khalid Qadeer Qureshi Member/Chairman Ms. Nabiha Shahnawaz Cheema Member
Company Secretary Mr. Khalid Mahmood Chohan
Bankers Allied Bank Limited Habib Bank Limited Askari Bank Limited Habib Metropolitan Bank Bank Alfalah Limited MCB Bank Limited Bank Islami Pakistan Limited Meezan Bank Limited Barclays Bank Plc National Bank of Pakistan Citibank N.A. NIB Bank Limited Deutsche Bank AG Samba Bank Limited Dubai Islamic Bank Standard Chartered Bank Faysal Bank Limited (Pakistan) Limited HSBC Bank Middle East Limited Silk Bank Limited United Bank Limited The Bank of Punjab
External Auditors A.F. Ferguson & Co, Chartered Accountants
Cost Auditors Avais Hyder Liaquat Nauman, Chartered Accountants
Legal Advisors Mr. Shahid Hamid, Bar-at-Law
Registered Office Nishat House, 53-A, Lawrence Road, Lahore-Pakistan Phone: 92-42-36367812-20 UAN: 111 11 33 33 Fax: 92-42-36367414 Email: [email protected] web site: www.dgcement.com
Factory 1. Khofli Sattai, Distt. Dera Ghazi Khan-Pakistan Phone: 92-641-460025-7 Fax: 92-641-462392 Email: [email protected]
2. 12, K.M. Choa Saidan Shah Road, Khairpur, Tehsil Kallar Kahar, Distt. Chakwal-Pakistan Phone: 92-543-650215-8 Fax: 92-543-650231

DIRECTORS’ REPORT
032013 HALF YEAR
The board of directors is pleased to submit its report along with the condensed interim financial information for the first half of the financial year 2013.
Business Outlook The trend of fragility in economic recovery is expected to be continued yet for another year – FY13. Global growth remained historically low for the second consecutive year.
The United States is experiencing a weak recovery with an uncertain future while emerging econo-mies are growing somewhat less than they did in 2011-12. Debt crises in euro zone remained unresolved. Recent developments, such as the danger of a property bubble in China, a decline in world trade, and volatility of capital flows in emerg-ing markets could derail the recovery and have a lasting impact on the global economy.
All these developments are highly interrelated and demand timely, decisive, and coordinated action by policymakers. In light of these uncertain global ramifications, sustained structural reforms aimed at improving transparency, population welfare and enhancing competitiveness will be necessary for countries to stabilize economic growth and ensure the rising prosperity of their populations going into the future.
Economy of Pakistan is still clutching at straws and so we saw same trend in first six months of FY13. Mismanagement of economic resources and poor law and order situation in Karachi, Balochistan and Khyber Pakhtoonkhaw smashed down the economy’s potential during last four years. Domestic investments hit the 60 years lowest and foreign direct investment also hit the lowest. The policy of reckless borrowing and ruthless spending by the government also quivered the boat already in storm. Serious efforts in respect of broadening tax base and tackling energy crisis are invisible. Decrease in discount rate by SBP was an effort by the government to revive business activities. However, devaluation of Pak rupee deteriorated our balance of payment.
Cement industry in Pakistan is witnessing a mixed trend due to government spending on major infrastructure projects in election year and revival of construction sector, local volumes increased by 0.8 million metric tons showing growth of 7.6% compared to same period of last financial year. While export volumes decreased by 5.2% over the same period of last year due to various non tariff barriers being imposed by India, increase in export of Iranian cement to Afghanistan market and sluggish growth in African market. Overall there is a marginal growth of 3.8% on YoY basis.
Our production remained static over the periods however local sales showed a volumetric growth of around 6%.
Export sales volume decreased by more than 16% due to cut throat price competition in international Market.
Company’s Performance
Production and Sales Statistics
Financial performancePeriod ended December 31
FY 2012 VarianceYOY %
Sales 11,825,821 10,701,409 1,124,412 10.51
Cost of sales 7,209,221 7,224,535 (15,314) 0.21
Gross profit 4,616,600 3,476,874 1,139,726 32.78
Other income 772,566 650,192 122,374 18.82
Profit from operations 4,031,988 2,528,699 1,503,289 59.45
Finance cost 577,396 885,823 (308,426) 34.82
Profit before taxation 3,454,592 1,642,876 1,811,716 110.27
Taxation 541,292 363,436 170,856 48.93
Profit after taxation 2,913,300 1,279,440 1,633,860 127.70
FY 2013(Rupees in thousand)
Five years production and sales statics YOY
2,500,000
2,000,000
1,500,000
1,000,000
500,000
Clinker production Cement productionlocal sales Cement exports Clinker Sales
2013Matric tons
2012 2011 2010 2009
First HalfFY 2013
MT
First HalfFY 2012
MT
Clinker production 2,060,491 2,044,491
Capacity Utilization (%) 103% 102%
Cement production 1,905,193 1,927,129
Cement sales (Local) 1,364,454 1,289,525
Cement Sales (Export) 557,145 664,850
Clinker Sales (Export) 6,000 -

04 2013HALF YEAR
Increase in exports sales is factored by devaluation in Pak Rupee despite volumetric decline.
The company’s early adaptation of cost cutting measures like Waste Heat recovery and using Refused Derived fuel resulted in marginal decrease in company’s cost of sales despite increase in prices of fuel and imported raw materials.
Selling and Distribution expenses decreased due to shrinkage of exports through sea.
Other income includes dividend Income of Rs. 713.048 Million received during the year from Investment.
Taxation is calculated at estimated annualized tax rate applicable to expected annual earning. Deferred Tax provision increased to Rs 465.178 Millions due to expected capitalization of Plant and Machinery in second half of the financial year and change in sales ratio between normal and final tax regime.
Following is the composition of total cost
Carbon CreditsThe company’s Waste Heat Recovery and utilization for Power Generation project at DG site and projects for substitution of coal with alternative fuels at both sites are registered with UNFCCC for the qualification of Carbon Emission Reduction (CER) credits. While Waste Heat Recovery and utilization for Power generation Project at Khairpur site will be registered within this month. The expected CER credits available with the company are more than 350,000.
Future ProspectsKeeping in view growth in sales volumes and stable cement prices, our company is expecting reasonable profit to add value to shareholder’s wealth in post election scenario. IMF loan repayment has put an immense pressure on Pak Rupee for devaluation as a result our cost of imports is expected to increase.Cost cutting measures already implemented and stable coal prices in international market will have impact on profitability. However, severe energy crises may affect company’s operations and profitability.
SBP discount rate is expected to remain stable for some period thus finance cost is expected to drop off.Our Waste Heat Recovery project at Khairpur plant will start its operations in March 13 and will help to further reduce our energy cost. Delayed start of project opera-tions was due to delay in delivery of equipment from USA due to Sandy Storm.Our company has acquired sites near Lahore and Multan for installation of plant to process Refused Derived Fuel (RDF). This effort would help our company to bring efficiency and economy to our process.
Company's Staff and CustomersWe wish to record our appreciation of continued commitment of our employees and patronage of our customers.
For and on behalf of the Board
Mian Raza ManshaChief Executive Officer
Lahore: 11 February 2013
Cost of sales57.22%
Selling anddistribution
expenses 7.05%Other operatingexpenses 2.24%
Retained in Business22.23%
Taxation 5.19%
Administrativeexpenses 1.49% Finance cost 4.58%
Composition of Total Cost
Raw and PackingMaterial 10%
Others 3%Freight 9%
Depreciation 8%
Repair and Stores& spares 9%
finance cost 6%Salaries, wages
and other benefits7%
power andfuel cost 49%
Following is the composition of cost as percentageof revenue

052013 HALF YEAR
AUDITORS’ REPORT TO THE MEMBERS ON REVIEW OFINTERIM FINANCIAL INFORMATION
Introduction
We have reviewed the accompanying condensed interim balance sheet of D.G. Khan Cement Company Limited as at December 31, 2012 and the related condensed interim profit and loss account, condensed interim statement of comprehensive income, condensed interim cash flow statement and condensed interim statement of changes in equity for the half year then ended (here-in-after referred to as the “interim financial information”). Management is responsible for the preparation and presentation of this interim financial information in accordance with approved accounting standards as applicable in Pakistan. Our responsibility is to express a conclusion on this interim financial information based on our review. The figures of the condensed interim profit and loss account for the quarters ended December 31, 2012 and 2011 have not been reviewed, as we are required to review only the cumulative figures for the half year ended December 31, 2012.
Scope of Review
We conducted our review in accordance with International Standard on Review Engagements 2410, “Review of Interim Financial Information Performed by the Independent Auditor of the Entity.” A review of interim financial information consists of making inquiries, primarily of persons responsible for financial and accounting matters, and applying analytical and other review procedures. A review is substantially less in scope than an audit conducted in accordance with, International Standards on Auditing and consequently does not enable us to obtain assurance that we would become aware of all significant matters that might be identified in an audit. Accordingly, we do not express an audit opinion.
Conclusion
Based on our review nothing has come to our attention that causes us to believe that the accompanying interim financial information as of and for the half year ended December 31, 2012 is not prepared, in all material respects, in accordance with approved accounting standards as applicable in Pakistan.
Chartered Accountants
Lahore
Name of engagement partner: Muhammad Masood
A. F. FERGUSON & CO.
A. F. FERGUSON & CO., Chartered Accountants, a member firm of the PwC network23-C, Aziz Avenue, Canal Bank, Gulberg V, P.O. Box 39, Lahore-54660; Pakistan.Tel: +92 (42) 3571 5864-71; Fax: +92 (42) 3571 5872Karachi: State Life Building No. 1-C, I.I. Chundrigar Road, P.O. Box 4716, Karachi-74000, Pakistan.Tel: +92 (21) 3242 6682-6/3242 6711-5; Fax: +92 (21) 3241 5007/3242 7938; <www.pwc.com/pk>Islamabad; PIA Building, 3rd Floor, 49 Blue Area, Fazl-ul-Haq Road, P.O. Box 3021, Islamabad-44000; Tel: +92 (51) 2273 457-60; Fax: +92 (51) 227 7924Kabul: House No. 1916, Street No. 1, Behind Cinema Bariqot, Nahar-e-Darsan, Karte-4, Kobul, Afghanistan; Tel: +92 (779) 315 320

Chief Executive Director
CONDENSED INTERIM BALANCE SHEETAs at December 31, 2012 (Un-audited)
Rupees in thousands Note 31 December2012
un-audited
30 June2012
audited
EQUITY AND LIABILITIESCapital and ReservesAuthorised capital- 950,000,000 (30 June 2012: 950,000,000)ordinary shares of Rs 10 each 9,500,000 9,500,000- 50,000,000 (30 June 2012: 50,000,000) preference shares of Rs 10 each 500,000 500,000 10,000,000 10,000,000Issued, subscribed and paid up capital 438,119,119 (June 30, 2012: 438,119,119)Ordinary shares of Rs 10 each 4,381,191 4,381,191Reserves 27,875,427 23,562,612Accumulated profit 7,242,950 4,986,829Shareholders’ equlty 39,499,568 32,930,632Long term finances 5 4,208,304 4,629,083Long term deposits 63,631 68,355Retirement and other benefits 201,846 185,116Deferred taxation 2,131,247 1,666,069Non-current liabilities 6,605,028 6,548,623Trade and other payables 1,894,252 2,108,894Accrued markup 171,092 162,931Short term borrowing-secured 7,259,217 6,733,467Current portion of non-current liabilities 1,952,739 2,165,561Provision for taxation 35,090 35,090Current liabilities 11,312,390 11,205,943CONTINGENCIES AND COMMITMENTS 6Total equity and liabilities 57,416,986 50,685,198
ASSETSProperty, plant and equipment 7 28,154,140 27,185,726Intangible assets 8 64,582 73,808Investments 9 6,457,689 4,864,945Long term loans, advances and deposits 121,633 120,342Non-current assets 34,798,044 32,244,821Stores, spares and loose tools 3,661,412 4,137,262Stock-in-trade 1,728,269 954,645Trade debts 292,838 317,970Investments 9 14,040,122 11,126,051Advances, deposits, prepayments and other receivables 1,566,498 1,476,008Cash and bank balances 1,329,803 428,441Current assets 22,618,942 18,440,377Total assets 57,416,986 50,685,198The annexed notes 1 to 15 form an integral part of this condensed interim financial information.
06 2013HALF YEAR

072013 HALF YEAR
Chief Executive Director
CONDENSED INTERIM PROFIT AND LOSS ACCOUNTQuarter and half year ended December 31, 2012 (Un-audited)
Rupees in thousands Note
July to December
October to December
July to December
October to December
Sales 11,825,821 5,951,783 10,701,409 5,613,396
Cost of sales 10 (7,209,221) (3,548,063) (7,224,535) (3,667,719)
Gross profit 4,616,600 2,403,720 3,476,874 1,945,677
Administrative expenses (187,849) (113,905) (120,193) (68,823)
Selling and distribution expenses (887,710) (312,699) (1,237,888) (602,200)
Other operating expenses (281,619) (178,605) (240,286) (144,861)
Other income 772,566 416,823 650,192 388,762
Profit from operations 4,031,988 2,215,334 2,528,699 1,518,555
Finance cost (577,396) (274,545) (885,823) (436,960)
Profit before taxation 3,454,592 1,940,789 1,642,876 1,081,595
Taxation (541,292) (466,387) (363,436) (119,904)
Profit after taxation 2,913,300 1,474,402 1,279,440 961,691
Earning per share
(basic and diluted) Rupees 6.65 3.37 2.92 2.20
The annexed notes 1 to 15 form an integral part of this condensed interim financial information.
20112012

Chief Executive Director
CONDENSED INTERIM STATEMENT OF COMPREHENSIVE INCOMEQuarter and half year ended December 31, 2012 (Un-audited)
Income for the period 2,913,300 1,474,402 1,279,440 961,691
Other comprehensive income
Available for sale financial assets - Change in fair value 4,312,815 2,316,664 (5,358,861) 3,473,514
Other comprehensive income / (loss) for the period 4,312,815 2,316,664 (5,358,861) 3,473,514
Total comprehensive income / (loss) for the period 7,226,115 3,791,066 (4,079,421) 4,435,205
The annexed notes 1 to 15 form an integral part of this condensed interim financial information.
Rupees in thousands
July to December
October to December
July to December
October to December
20112012
08 2013HALF YEAR

092013 HALF YEAR
Chief Executive Director
CONDENSED INTERIM CASH FLOW STATEMENTFor the half year ended December 31, 2012 (Un-audited)
Rupees in thousands Note July toDecember
2012
July toDecember
2011
Cash flows from operating activitiesCash generated from operations 12 3,535,558 1,430,684Financial cost paid (569,234) (909,810)Retirement and other benefits paid (14,334) (11,787)Taxes paid (182,464) (146,635)Long term deposits - net (4,724) (1,338)Net cash generated from operating activities 2,764,802 361,114
Cash flows from investing activitiesFixed capital expenditure (1,771,582) (542,944)Proceeds from sale of property, plant and equipment 46,047 20,678Investments made (194,000) -Long term loans, advances and deposits - net 105,058 (427)Interest received 72,072 81,644Dividend received 713,048 574,581Net cash (used in) / generated from investing activities (1,029,357) 133,532
Cash flows from financing activitiesProceeds from long term finances 800,000 -Repayment of long term finances (1,508,930) (1,298,734)Dividend Paid (650,903) -Net cash used in financing activities (1,359,833) (1,298,734)
Net increase / (decrease) in cash and cash equivalents 375,612 (804,088)
Cash and cash equivalents at the beginning of the period (6,305,026) (8,524,340)
Cash and cash equivalents at the end of the period 13 (5,929,414) (9,328,428)
The annexed notes 1 to 15 form an integral part of this condensed interim financial information.

10 2013HALF YEAR
CONDENSED INTERIM STATEMENT OF CHANGES IN EQUITYFor the half year ended December 31, 2012 (Un-audited)
Chi
ef E
xecu
tive
Dire
ctor
Cap
ital r
eser
veR
even
ue r
eser
ve
Bal
ance
as
at 3
0 Ju
ne 2
012
- A
udite
d
4,38
1,19
1 4,
557,
163
13,5
80,1
12
353
,510
5
,071
,827
4,
986,
829
32,9
30,6
32
Tota
l com
preh
ensi
ve in
com
e fo
r th
e pe
riod
- P
rofit
for
the
perio
d -
- -
- -
2,91
3,30
0 2,
913,
300
- O
ther
com
preh
ensi
ve p
rofit
for
the
perio
d -
- 4,
312,
815
- -
- 4,
312,
815
Tota
l con
trib
utio
ns b
y an
d di
stri
butio
ns to
ow
ners
of
the
com
pan
y re
cog
nize
d d
irec
tly in
eq
uity
- F
inal
div
iden
d fo
r th
e ye
ar e
nded
Ju
ne 3
0, 2
012
(Rs
1.5
per
shar
e)
- -
- -
- (6
57,1
79)
(657
,179
)
Bal
ance
as
at 3
1 D
ecem
ber
201
2 -
Una
udite
d
4,38
1,19
1 4,
557,
163
17,8
92,9
27
353,
510
5,07
1,82
7 7,
242,
950
39,4
99,5
68
Bal
ance
as
at 3
0 Ju
ne 2
011
- Aud
ited
4,38
1,19
1 4,
557,
163
14,9
74,8
81
353,
510
5,07
1,82
7 87
8,71
1 30
,217
,283
Tota
l com
preh
ensi
ve in
com
e fo
r th
e pe
riod
- P
rofit
for
the
perio
d -
- -
- -
1,27
9,44
0 1,
279,
440
- O
ther
com
preh
ensi
ve lo
ss fo
r th
e pe
riod
- -
(5,3
58,8
61)
- -
- (5
,358
,861
)
Bal
ance
as
at 3
1 D
ecem
ber
201
1 -
Una
udite
d
4,38
1,19
1 4,
557,
163
9,61
6,02
0 35
3,51
0 5,
071,
827
2,15
8,15
1 26
,137
,862
The
anne
xed
note
s 1
to 1
5 fo
rm a
n in
tegr
al p
art o
f thi
s co
nden
sed
inte
rim fi
nanc
ial i
nfor
mat
ion.
Fair
Valu
eR
eser
ve
Sh
are
Pre
miu
mS
har
eC
apita
l
Cap
ital
Red
empt
ion
Res
erve
Fund
Gen
eral
Res
erve
Acc
umul
ated
Pro
fitTo
tal
Rup
ees
in th
ousa
nds

NOTES TO AND FORMING PART OF THECONDENSED INTERIM FINANCIAL INFORMATION
Quarter and half year ended December 31, 2012 (Un-audited)
1 Status and nature of business
D. G. Khan Cement Company Limited ("the Company") is a public limited company incorporated in
Pakistan and is listed on Karachi, Lahore and Islamabad Stock Exchanges. It is principally engaged in
production and sale of Clinker, Ordinary Portland and Sulphate Resistant Cement. The registered office of
the company is situated at 53-A Lawrence Road, Lahore.
2 Statement of compliance
This condensed interim financial information is un-audited and is being submitted to the members as
required by section 245 of the Companies Ordinance, 1984. The condensed interim financial information
has been prepared in accordance with the requirements of the International Accounting Standard (IAS)
34 'Interim Financial Reporting' and have been reviewed by the auditors as required by the Code of
Corporate Governance. The condensed interim financial information should be read in conjunction with
the the annual financial statements for the year ended June 30, 2012.
3 Significant accounting policies
3.1 The accounting policies and the methods of computation adopted in the preparation of this
condensed interim f inancial information are the same as those applied in the preparation of
preceding annual published financial statements of the company for the year ended June 30, 2012.
Certain standards, amendments and interpretations to approved accounting standards are effective
for accounting periods beginning on July 1, 2012 but are considered not to be relevant or to have
any significant effect on the company's operations and are, therefore, not detailed in this condensed
interim financial information.
3.2 Standards, amendments and interpretations to existing standards that are not yet effective and
have not been early adopted by the company.
Standards or Interpretation Effective date (accounting
periods beginning on or
after)
- IAS 19 ‘Employee Benefits-IAS 1 (amendments) July 01, 2013
4 Taxation
The provision for taxation for the six months ended December 31, 2012 has been made on an estimated
basis.
112013 HALF YEAR

Rupees in thousands 31 December2012
un-audited
30 June2012
audited
5 Long term finances
Long term loans - note 5.1 6,152,249 6,785,851
Less: Current portion shown under current liabilities 1,943,945 2,156,768
4,208,304 4,629,083
5.1 Long term loans
Opening balance 6,785,851 6,875,127
Add: Disbursements during the period 800,000 1,906,382
Exchange loss during the period 75,328 136,390
7,661,179 8,917,899
Less: Repayment during the period 1,508,930 2,132,048
Closing balance 6,152,249 6,785,851
6 Contingencies and commitments
6.1 Contingencies
During the period 1994 to 1996, the Company imported plant and machinery relating to expansion
unit, for which exemption was claimed under various SROs from the levy of custom duty and other
duties including sales tax. As per the provisions of SRO 484 (I)/92, 978 (I)/95 and 569 (I)/95, the
exemption from the statutory duty would be available only if the said plant and machinery was not
manufactured locally. However, the Custom Authorities rejected the claim of the Company by arguing
that the said machinery was on the list of locally manufactured machinery, published by the Federal
Board of Revenue. Consequently, the Company appealed before the Lahore High Court, Multan
Bench, which allowed the Company to release the machinery on furnishing indemnity bonds with the
Custom Authorities.
Collector of Customs and Central Excise, Multan has passed an order dated November 26, 1999,
against the Company on the grounds that the said machinery was being manufactured locally during
the time when it was imported.
An appeal against the order was filed with the Lahore High Court, which has been decided in favour of
the Company. However, the Custom Authorities have filed an appeal with the Supreme Court of
Pakistan against the orders of the Lahore High Court. The Honorable court remanded back the
case to Customs authorities to reassess the liability of the company. The matter is pending with the
Apellate Tribunal. No provision for the outstanding balance of Rs 634.388 million has been made in
the financial statements as according to the management of the company there are meritorious
grounds that the ultimate decision would be in its favour.
6.2 There is no signi f icant change in cont ingencies f rom the annual f inancial statements of the
Company for the year ended June 30, 2012 except for as mentioned above.
12 2013HALF YEAR

132013 HALF YEAR
6.3 Commitments in respect of (i) Contracts for capital expenditure Rs 525.991 million (June 30 2012: Rs 156.17 million). (ii) Letters of credit for capital expenditure Rs 455.84 million (June 30 2012: Rs 760.127 million). (iii) Letters of credit other than capital expenditure Rs 252.157 million (June 30 2012: Rs 952.872 million).
7 Property, plant and equipment Operating assets - note 7.1 25,282,587 25,192,214 Capital work-in-progress - note 7.2 2,871,553 1,993,512 28,154,140 27,185,726 7.1 Operating assets Opening book value 25,192,214 24,611,565 Add: Additions during the period - note 7.1.1 893,541 2,039,499 893,541 2,039,499 Less: Disposals during the period 37,886 26,633 Depreciation charged during the period 765,282 1,432,217 803,168 1,458,850 Closing book value 25,282,587 25,192,214 7.1.1 Additions during the period Freehold land 53,642 168,117 Building on freehold land 139,150 317,485 Office building and housing colony 8,341 8,424 Roads - 107,271 Plant and machinery 300,137 1,265,789 Quarry equipment - 40,106 Furniture, fixtures and office equipment 20,489 52,018 Aircraft 328,751 - Motor vehicles 42,648 79,828 Power and water supply lines 383 461 893,541 2,039,499 7.2 Capital work-in-progress Civil works 331,072 334,490 Plant and machinery 2,376,578 1,549,765 Advances 84,723 31,108 Others 14,075 16,206 Expansion project: -Civil works 18,992 18,992 -Others 46,113 42,951 65,105 61,943 2,871,553 1,993,5128 Intangible assets Opening book value 73,808 - Add: Additions during the period - 92,260 - 92,260 Less: Amortization charged during the period 9,226 18,452 9,226 18,452 Closing book value 64,582 73,808
Rupees in thousands 31 December2012
un-audited
30 June2012
audited

10 Cost of sales Raw and packing materials consumed 955,293 480,779 932,144 480,184 Salaries, wages and other benefits 536,662 282,826 445,753 234,661 Electricity and gas 1,194,057 586,183 1,026,239 553,419 Furnace oil and coal 3,525,692 1,754,419 4,008,740 2,054,547 Stores and spares consumed 742,403 338,086 573,744 330,808 Repair and maintenance 112,988 57,259 89,740 42,996 Insurance 30,274 15,886 28,953 15,120 Depreciation on property, plant and equipment 727,009 366,395 692,903 348,571 Amortization on intangibles 6,458 3,229 6,458 6,458 Royalty 80,002 39,918 79,283 41,618 Excise duty 7,466 3,722 7,403 3,914 Vehicle running 14,568 7,989 10,990 5,620 Postage, telephone and telegram 1,530 713 1,696 1,000 Printing and stationery 2,650 944 2,318 1,459 Legal and professional charges 867 302 679 427 Travelling and conveyance 12,853 7,099 9,545 6,333 Estate development 6,332 3,835 8,988 4,721 Rent, rates and taxes 11,901 6,094 9,453 3,893 Freight charges 3,747 2,392 2,773 1,423 Other expenses 17,378 8,090 13,590 7,649 Total manufacturing cost 7,990,130 3,966,160 7,951,392 4,144,821 Opening work-in-process 322,049 647,372 169,612 443,002 Closing work-in-process (1,163,509) (1,163,509) (962,514) (962,514) (841,460) (516,137) (792,902) (519,512) Cost of goods manufactured 7,148,670 3,450,023 7,158,490 3,625,309 Opening stock of finished goods 254,990 287,251 294,737 261,514 Closing stock of finished goods (185,018) (185,018) (212,944) (212,944) 69,972 102,233 81,793 48,570 Less: Own consumption capitalized (9,421) (4,193) (15,748) (6,160)
7,209,221 3,548,063 7,224,535 3,667,719
Rupees in thousands
July to December
October to December
July to December
October to December
20112012
9 Investments Cost of investments 2,781,150 2,781,150 Add : Cumulative fair value gain 17,892,927 13,580,112 Add : Purchase of new investment 194,000 - Less: Cumulative impairment losses recognized (370,266) (370,266) Fair value gain 17,716,661 13,209,846 Total investments 20,497,811 15,990,996 Less: Investments classified in current assets 14,040,122 11,126,051 Closing balance 6,457,689 4,864,945
Rupees in thousands 31 December2012
un-audited
30 June2012
audited
14 2013HALF YEAR

152013 HALF YEAR
Relationship with the company Nature of transaction Subsidiary company Purchase of goods and services 418,810 461,022 Rental income 406 406 Interest income 20,637 27,734 Other related parties Purchase of goods and services 675,756 465,262 Insurance premium 48,090 49,555 Sale of goods 73,897 37,862 Purchase of asset 328,751 - Mark-up income on balances with related parties 799 966 Insurance claim received - 65 Dividend income 703,012 564,551 Key management Salaries and other employment personnel benefits 54,799 54,521 Post employment Expense charged in respect of staff benefit plans retirement benefits plans 43,714 35,862
All transactions with related parties have been carried out on commercial terms and conditions.
Rupees in thousands July to December
2012
July to December
2011
Rupees in thousands July to December
2012
July to December
2011
11 Transactions with related parties
The related parties comprise subsidiary company, associated companies, other related companies, directors
of the company, key management personnel and post employment benefit plans. Significant transactions with related parties are as follows:
12 Cash flow from operating activities Profit before tax 3,454,592 1,642,876 Adjustment for : - Depreciation on property, plant and equipment 765,282 701,011 - Profit on disposal of property, plant and equipment (8,161) (13,269) - Profit on bank deposits (1,308) (1,787) - Amortization on intangibles 9,226 9,226 - Dividend income (713,048) (574,581) - Provision of WPPF 181,821 86,467 - Retirement and other benefits accrued 31,064 24,767 - Markup income (21,436) (28,700) - Exchange loss - net 94,932 51,412 - Finance cost 577,396 885,823 Profit before working capital changes 4,370,360 2,783,245 Effect on cash flow due to working capital changes: - (Increase)/decrease in stores, spares and loose tools 475,850 (536,795) - increase in stock-in-trade (773,624) (538,724) - decrease in trade debts 37,800 207,871 - increase in advances, deposits, prepayments and other receivables (139,818) (169,381) - decrease in trade and other payables (435,010) (315,532) (834,802) (1,352,561) Cash generated from operations 3,535,558 1,430,684

16 2013HALF YEAR
Chief Executive Director
13 Cash and cash equivalents
Short term borrowings - secured (7,259,217) (9,529,703)
Cash and bank balances 1,329,803 201,275
(5,929,414) (9,328,428)
14 Date of authorization for issue
This interim financial information was authorized for issue on 11 February 2013 by the Board of Directors of the
Company.
15 Corresponding figures
Corresponding figures have been re-arranged wherever necessary for the purposes of comparison, however, no
significant re-arrangements have been made.
Rupees in thousands July to December
2012
July to December
2011
CONSOLIDATED FINANCIAL STATEMENTS
172013 HALF YEAR

18 2013HALF YEAR
DIRECTORS’ REPORT
The Board of Directors is pleased to submit their report along with the condensed interim consolidated
financial statements for the first half of the financial year 2013. Our discussion of affairs of the holding
company has been separately presented
Consolidated net sales increase by more than 10 % compared to same period of Last Financial year.
While, consolidated gross profit increased by more than 30 % even after absorbing losses incurred by
paper segment. Higher production cost of paper segment mainly due to increase in prices of Kraft paper.
Profit after Taxation increased by 121% due to better performance of cement segment.
Future Prospects The group foresees reduction in losses of Nishat Paper due to decrease in prices of Kraft paper and
better sales prices of paper bags.
Staff and customersWe wish to record our appreciation of continued commitment of our employees and patronage of our
customers.
For and on behalf of the Board
Mian Raza Mansha
Chief Executive Officer
Lahore: 11 February 2013
Consolidated Financial Performance
Rupees in thousands First Half First Half Variance
FY 2013 FY 2012
Sales 12,241,034 11,099,224 1,141,810
Cost of sales (7,602,374) (7,549,205) (53,169)
Gross profit 4,638,660 3,550,019 1,088,641
Profit from operations 4,016,119 2,571,566 1,444,553
Finance cost (624,366) (938,733) 314,367
Profit before taxation 3,391,753 1,632,833 1,758,920
Taxation (565,292) (358,836) (206,456)
Profit/ (loss) after taxation 2,826,461 1,273,997 1,552,464

192013 HALF YEAR
Chief Executive Director
CONDENSED INTERIM CONSOLIDATEDBALANCE SHEET
As at December 31, 2012 (Un-audited)Rupees in thousands Note 31 December
2012un-audited
30 June2012
audited
EQUITY AND LIABILITIESCapital and ReservesAuthorised capital- 950,000,000 (30 June 2012: 950,000,000) ordinary shares of Rs 10 each 9,500,000 9,500,000- 50,000,000 (30 June 2012: 50,000,000) preference shares of Rs 10 each 500,000 500,000 10,000,000 10,000,000Issued, subscribed and paid up capital 4,381,191 4,381,191Reserves 27,914,451 23,601,636Accumulated profit 7,249,593 5,036,891 39,545,235 33,019,718Non-controlling interest 286,845 330,265 39,832,080 33,349,983Long term finances 5 4,468,304 4,649,083Long term deposits 63,631 68,355Retirement and other benefits 201,846 185,116Deferred taxation 2,091,927 1,602,750Non-Current Liabilities 6,825,708 6,505,304Trade and other payables 2,027,295 2,231,863Accrued markup 171,092 178,652Short term borrowing-secured 8,192,486 7,559,348Current portion of non-current liabilities 2,012,739 2,245,561Provision for taxation 35,090 35,090Current Liabilities 12,438,702 12,250,514Contingencies and Commitments 6 59,096,490 52,105,801
ASSETSProperty, plant and equipment 7 29,191,354 28,073,573Intangible assets 8 64,582 73,808Investments 9 6,254,059 4,661,314Long term loans, advances and deposits 122,539 138,748Non-current assets 35,632,534 32,947,443Stores, spares and loose tools 3,722,374 4,198,477Stock-in-trade 2,288,800 1,596,784Trade debts 450,613 486,597Investments 9 14,040,141 11,126,071Advances, deposits, prepayments and other receivables 1,513,793 1,288,036Cash and bank balances 1,448,235 462,393Current assets 23,463,956 19,158,358 59,096,490 52,105,801The annexed notes form an integral part of this condensed interim consolidated financial information.

20 2013HALF YEAR
Chief Executive Director
CONDENSED INTERIM CONSOLIDATEDPROFIT AND LOSS ACCOUNTQuarter and half year ended December 31, 2012 (Un-audited)
Rupees in thousands Note
July to December
October to December
July to December
October to December
Sales 12,241,034 6,168,524 11,099,224 5,802,775
Cost of sales 10 (7,602,374) (3,755,422) (7,549,205) (3,866,979)
Gross profit 4,638,660 2,413,102 3,550,019 1,935,796
Administrative expenses (190,323) (115,138) (122,221) (69,738)
Selling and distribution expenses (894,455) (315,855) (1,243,811) (604,432)
Other operating expenses (290,743) (178,402) (243,408) (147,983)
Other income 752,980 406,094 630,987 381,984
Profit from operations 4,016,119 2,209,801 2,571,566 1,495,627
Finance cost (624,366) (301,407) (938,733) (463,918)
Profit before taxation 3,391,753 1,908,394 1,632,833 1,031,709
Taxation (565,292) (498,187) (358,836) (113,240)
Profit after taxation 2,826,461 1,410,207 1,273,997 918,469
Attributable to:
Equity holders of the parent 2,869,881 1,442,305 1,276,719 940,081
Non-controlling interest (43,420) (32,098) (2,722) (21,612)
2,826,461 1,410,207 1,273,997 918,469
Combined earnings per share
(basic and diluted) Rupees 6.45 3.22 2.91 2.10
The annexed notes form an integral part of this condensed interim consolidated financial information.
20112012
212013 HALF YEAR
Chief Executive Director
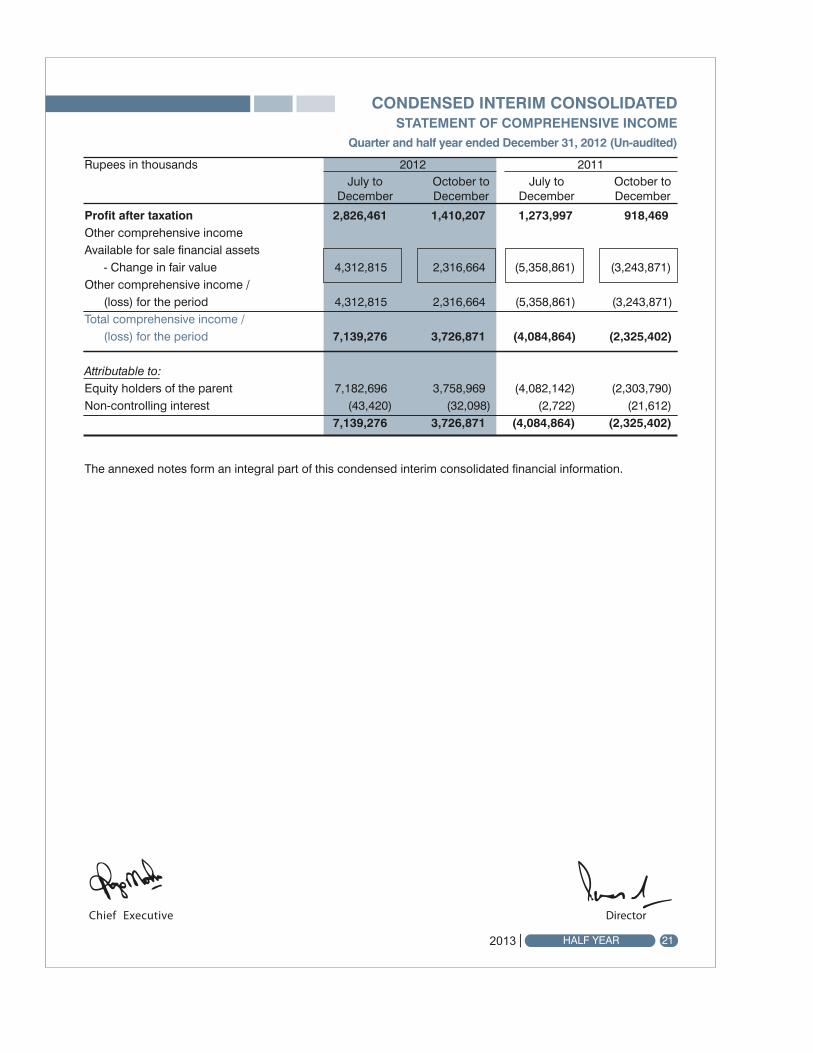
CONDENSED INTERIM CONSOLIDATEDSTATEMENT OF COMPREHENSIVE INCOME
Quarter and half year ended December 31, 2012 (Un-audited)
Profit after taxation 2,826,461 1,410,207 1,273,997 918,469Other comprehensive income Available for sale financial assets - Change in fair value 4,312,815 2,316,664 (5,358,861) (3,243,871)Other comprehensive income / (loss) for the period 4,312,815 2,316,664 (5,358,861) (3,243,871)Total comprehensive income / (loss) for the period 7,139,276 3,726,871 (4,084,864) (2,325,402)
Attributable to:Equity holders of the parent 7,182,696 3,758,969 (4,082,142) (2,303,790)Non-controlling interest (43,420) (32,098) (2,722) (21,612) 7,139,276 3,726,871 (4,084,864) (2,325,402)
The annexed notes form an integral part of this condensed interim consolidated financial information.
Rupees in thousands
July to December
October to December
July to December
October to December
20112012

Chief Executive Director
CONDENSED INTERIM CONSOLIDATEDCASH FLOW STATEMENTFor the half year ended December 31, 2012 (Un-audited)
Rupees in thousands Note July toDecember
2012
July toDecember
2011
Cash flows from operating activitiesCash generated from operations 12 3,696,065 1,405,294Financial cost paid (631,926) (953,157)Retirement and other benefits paid (14,345) (11,787)Taxes paid (256,647) (199,463)long term deposits - net (4,724) (1,338)Net cash generated from operating activities 2,788,423 239,549Cash flows from investing activitiesFixed capital expenditure (1,939,780) (547,558)Proceeds from sale of property, plant and equipment 46,047 184,558 Investment made (194,000) -Long term loans and deposits - Net 16,209 (17,927)Interest received 68,855 29,681Dividend received 713,048 505,931Net cash (used in) / generated from investing activities (1,289,621) 154,685
Cash flows from financing activitiesProceeds from long term finances 1,050,000 -Repayment of long term finances (1,538,930) (1,367,616)Dividend paid (657,168) -Net cash used in financing activities (1,146,098) (1,367,616)
Net increase / (decrease) in cash and cash equivalents 352,704 (973,382)
Cash and cash equivalents at the beginning of period (7,096,955) (9,152,752)
Cash and cash equivalents at the end of period 13 (6,744,251) (10,126,134)
The annexed notes form an integral part of this condensed interim consolidated financial information.
22 2013HALF YEAR

232013 HALF YEAR
CONDENSED INTERIM CONSOLIDATEDSTATEMENT OF CHANGES IN EQUITY
For the half year ended December 31, 2012 (Un-audited)
Chi
ef E
xecu
tive
Dire
ctor
Cap
ital r
eser
veR
even
ue r
eser
veR
upee
s in
thou
sand
s
Bal
ance
as
at 3
0 Ju
ne 2
012
- A
udite
d
4,38
1,19
1 4,
557,
163
13,5
80,1
12
353,
510
5,11
0,85
1 5,
036,
891
33,0
19,7
18
330,
265
33,3
49,9
83
Tota
l com
preh
ensi
ve in
com
e fo
r th
e pe
riod
- P
rofit
for
the
perio
d -
- -
- -
2,86
9,88
1 2,
869,
881
(43,
420)
2,
826,
461
- O
ther
com
preh
ensi
ve in
com
e fo
r th
e pe
riod
- -
4,31
2,81
5 -
- -
4,31
2,81
5 -
4,31
2,81
5
Tota
l Con
trib
utio
ns b
y an
d di
strib
utio
ns to
ow
ners
of
the
Com
pany
reco
gniz
ed d
irect
ly in
equ
ity
- F
inal
div
iden
d fo
r th
e ye
ar e
nded
J
une
30, 2
012
(Rs
1.5
per
shar
e)
- -
- -
- (6
57,1
79)
(657
,179
) -
(657
,179
)
Bal
ance
as
at 3
1 D
ecem
ber
2012
- U
n-au
dite
d 4
,381
,191
4,
557,
163
17,8
92,9
27
353,
510
5,11
0,85
1 7,
249,
593
39,5
45,2
35
286,
845
39,8
32,0
80
Bal
ance
as
at 3
0 Ju
ne 2
011
- Aud
ited
4,38
1,19
1 4,
557,
163
14,9
74,8
81
353,
510
5,11
0,85
1 93
9,91
6 30
,317
,512
34
1,40
9 30
,658
,921
Tota
l com
preh
ensi
ve in
com
e fo
r th
e pe
riod
- P
rofit
for
the
perio
d -
- -
- -
1,27
6,71
9 1,
276,
719
(2,7
22)
1,27
3,99
7
- O
ther
com
preh
ensi
ve in
com
e fo
r the
per
iod
- -
(5,3
58,8
61)
- -
- (5
,358
,861
) -
(5,3
58,8
61)
Bal
ance
as
at 3
1 D
ecem
ber
2011
- U
n-au
dite
d 4,
381,
191
4,55
7,16
3 9,
616,
020
353,
510
5,11
0,85
1 2,
216,
635
26,2
35,3
70
338,
687
26,5
74,0
57
The
anne
xed
note
s fo
rm a
n in
tegr
al p
art o
f thi
s co
nden
sed
inte
rim c
onso
lidat
ed fi
nanc
ial i
nfor
mat
ion.
Sh
are
Pre
miu
mFa
irVa
lue
Res
erve
Cap
ital
Red
empt
ion
Res
erve
Fund
Gen
eral
Res
erve
Acc
umul
ated
Pro
fit
Tota
l sh
are
ho
lder
s eq
uity
Sh
are
Cap
ital
Tota
l eq
uity
attr
ibut
able
to
shar
eho
lder
s o
fp
aren
t co
mp
any
No
n-C
ont
rolli
ngin
tere
st

NOTES TO AND FORMING PART OF THE CONDENSED INTERIM CONSOLIDATED FINANCIAL INFORMATIONQuarter and half year ended December 31, 2012 (Un-audited)
1. Status and nature of business
The group comprises of: - D. G. Khan Cement Company Limited, the parent company; and - Nishat Paper Products Company Limited, the subsidiary company.
The parent company is a public limited company incorporated in Pakistan and is listed on Karachi, Lahore and Islamabad Stock Exchanges. It is principally engaged in production and sale of Clinker, Ordinary Portland and Sulphate Resistant Cement. The registered office of the Company is situated at 53-A Lawrence Road, Lahore.
The subsidiary company is an unlisted public limited company incorporated in Pakistan under the Companies Ordinance 1984 on July 23, 2004. It is principally engaged in manufacture and sale of paper products and packaging material.
2. Statement of compliance
This condensed interim financial information is un-audited and is being submitted to the members as requi red by sect ion 245 of the Companies Ordinance, 1984. The condensed inter im f inancia l information has been prepared in accordance with the requirements of the International Accounting Standard (IAS) 34 'Interim Financial Reporting' and have been reviewed by the auditors as required by the Code of Corporate Governance. The condensed interim financial information should be read in conjunction with the the annual financial statements for the year ended June 30, 2012.
3. Significant accounting policies
3.1 The accounting policies and the methods of computation adopted in the preparation of this condensed interim f inancial information are the same as those applied in the preparation of preceding annual published financial statements of the company for the year ended June 30, 2012. Certain standards, amendments and interpretations to approved accounting standards are effective for accounting periods beginning on July 1, 2012 but are considered not to be relevant or to have any significant effect on the company's operations and are, therefore, not detailed in this condensed interim financial information.
3.2 Standards, amendments and interpretations to existing standards that are not yet effective and have not been early adopted by the company
Standards or Interpretation Effective date (accounting periods beginning on or after)
- IAS 19, 'Employee Benefits''- IAS 1 (amendments) January 01, 2013
4 Taxation
The provision for taxation for the six months ended 31 December 2012 has been made on an estimated basis. 24 2013HALF YEAR
252013 HALF YEAR
Rupees in thousands 31 December2012
un-audited
30 June2012
audited
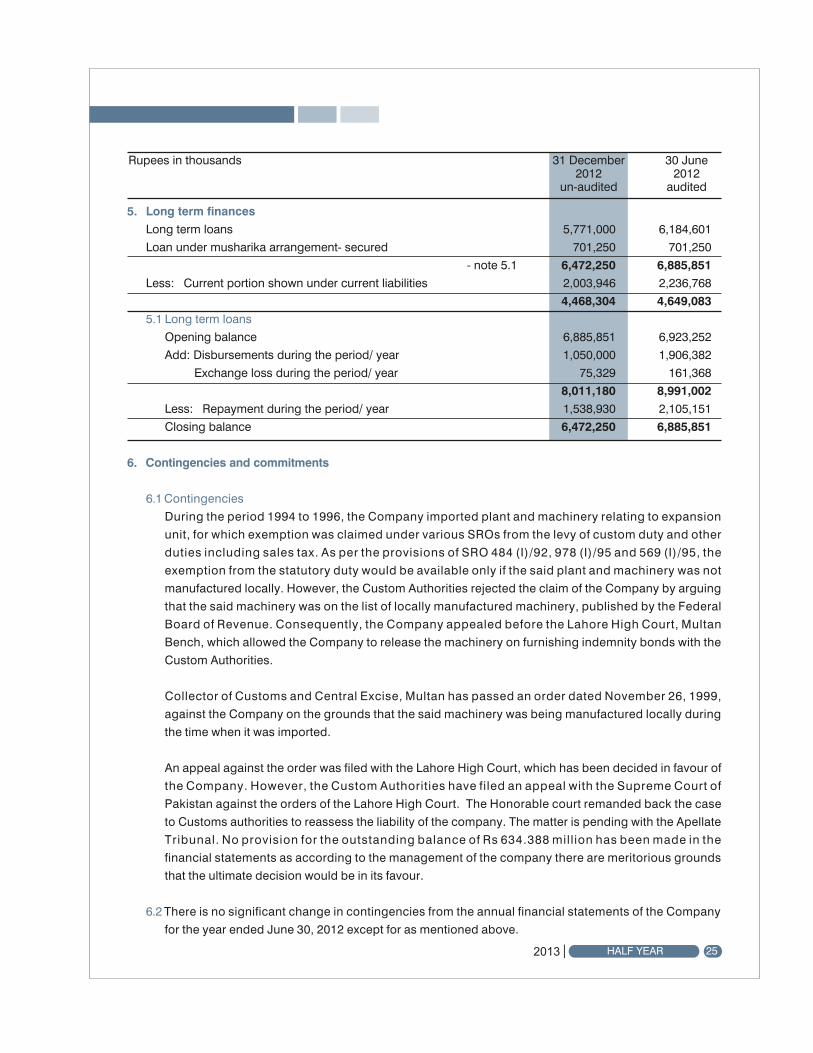
5. Long term finances
Long term loans 5,771,000 6,184,601
Loan under musharika arrangement- secured 701,250 701,250
- note 5.1 6,472,250 6,885,851
Less: Current portion shown under current liabilities 2,003,946 2,236,768
4,468,304 4,649,083
5.1 Long term loans
Opening balance 6,885,851 6,923,252
Add: Disbursements during the period/ year 1,050,000 1,906,382
Exchange loss during the period/ year 75,329 161,368
8,011,180 8,991,002
Less: Repayment during the period/ year 1,538,930 2,105,151
Closing balance 6,472,250 6,885,851
6. Contingencies and commitments
6.1 Contingencies
During the period 1994 to 1996, the Company imported plant and machinery relating to expansion
unit, for which exemption was claimed under various SROs from the levy of custom duty and other
duties including sales tax. As per the provisions of SRO 484 (I)/92, 978 (I)/95 and 569 (I)/95, the
exemption from the statutory duty would be available only if the said plant and machinery was not
manufactured locally. However, the Custom Authorities rejected the claim of the Company by arguing
that the said machinery was on the list of locally manufactured machinery, published by the Federal
Board of Revenue. Consequently, the Company appealed before the Lahore High Court, Multan
Bench, which allowed the Company to release the machinery on furnishing indemnity bonds with the
Custom Authorities.
Collector of Customs and Central Excise, Multan has passed an order dated November 26, 1999,
against the Company on the grounds that the said machinery was being manufactured locally during
the time when it was imported.
An appeal against the order was filed with the Lahore High Court, which has been decided in favour of
the Company. However, the Custom Authorities have filed an appeal with the Supreme Court of
Pakistan against the orders of the Lahore High Court. The Honorable court remanded back the case
to Customs authorities to reassess the liability of the company. The matter is pending with the Apellate
Tribunal. No provision for the outstanding balance of Rs 634.388 mill ion has been made in the
financial statements as according to the management of the company there are meritorious grounds
that the ultimate decision would be in its favour.
6.2 There is no significant change in contingencies from the annual financial statements of the Company
for the year ended June 30, 2012 except for as mentioned above.

6.3 Commitments in respect of (i) Contracts for capital expenditure Rs 525.991 million (June 30 2012: Rs 156.17 million). (ii) Letters of credit for capital expenditure Rs 455.84 million (June 30 2012: Rs 760.127 million). (iii) Letters of credit other than capital expenditure Rs 455.497 million (June 30 2012: Rs 1,035.213 million).
7 Property, Plant and Equipment Operating assets - note 7.1 26,316,369 26,076,700 Capital work -in-progress - note 7.2 2,874,985 1,996,873 29,191,354 28,073,573 7.1 Operating Assets Opening book value 26,076,700 25,707,179 Add: Additions during the period/ year - note 7.1.1 1,061,668 2,046,180 27,138,368 27,753,359 Less: Disposals during the period/ year - net book value 37,886 189,260 Depreciation charged during the period/ year 784,113 1,487,399 821,999 1,676,659 Closing book value 26,316,369 26,076,700 7.1.1 Additions during the period Freehold land 53,642 168,117 Building on freehold land 139,150 327,592 Office building and housing colony 8,342 - Roads - 107,271 Plant and machinery 468,239 1,269,366 Quarry equipment - 40,106 Furniture, fixtures and office equipment 20,514 52,435 Motor vehicles 42,648 80,832 Power and water supply lines 382 461 Aircraft 328,751 - 1,061,668 2,046,180 7.2 Capital Work-in-progress Civil Works 334,504 337,851 Plant and machinery 2,376,578 1,549,765 Advances 84,723 31,108 Others 14,075 16,206 Expansion project: -Civil works 18,992 18,992 -Others 46,113 42,951 65,105 61,943 2,874,985 1,996,8738. Intangible assets Opening book value 73,808 - Add: Additions during the period - 92,260 - 92,260 Less: Amortization charged during the period 9,226 18,452 9,226 18,452 Closing book value 64,582 73,808
Rupees in thousands 31 December2012
un-audited
30 June2012
audited
26 2013HALF YEAR

272013 HALF YEAR
9. Investments Cost of investments 2,207,273 2,207,273 Add: Fair value adjustments 17,892,927 13,580,112 Add: Purchase of new investment 194,000 - 18,086,927 13,580,112 Total investments 20,294,200 15,787,385 Less: Investments classified in current assets 14,040,141 11,126,071 Closing balance 6,254,059 4,661,314
Rupees in thousands 31 December2012
un-audited
30 June2012
audited
10. Cost of sales Raw and packing materials consumed 1,307,935 660,959 1,246,166 687,228 Salaries, wages and other benefits 548,704 288,869 455,912 240,121 Electricity and gas 1,194,545 581,877 1,025,765 548,356 Furnace oil and coal 3,525,692 1,754,419 4,008,740 2,054,547 Stores and spares consumed 758,608 341,390 578,340 333,830 Repair and maintenance 113,526 57,485 89,972 43,098 Insurance 32,857 17,170 31,535 16,401 Depreciation on property, plant and equipment 741,255 371,550 708,899 356,311 Lease rentals - Ijara financing 15,919 7,962 545 545 Amortization on intangibles 6,458 3,229 6,458 6,458 Royalty 80,002 39,918 79,283 41,618 Excise duty 7,466 3,722 7,403 3,914 Vehicle running 14,753 8,074 11,542 5,885 Postage, telephone and telegram 1,542 723 1,709 1,004 Printing and stationery 2,652 944 2,324 1,459 Legal and professional charges 967 402 877 625 Travelling and conveyance 12,853 7,099 9,545 6,333 Estate development 6,332 3,835 8,988 4,722 Rent, rates and taxes 12,639 6,629 10,028 4,121 Freight charges 3,847 2,407 2,861 1,465 Other expenses 17,592 8,149 13,782 7,748 Total manufacturing cost 8,406,144 4,166,812 8,300,674 4,365,789 Opening work-in-process 322,049 647,372 169,612 443,002 Closing work-in-process (1,163,509) (1,163,509) (962,514) (962,514) (841,460) (516,137) (792,902) (519,512) Cost of goods manufactured 7,564,684 3,650,675 7,507,772 3,846,277 Opening stock of finished goods 300,619 362,448 330,242 299,923 Closing stock of finished goods (253,508) (253,508) (273,061) (273,061) 47,111 108,940 57,181 26,862 Less: Own consumption capitalized (9,421) (4,193) (15,748) (6,160) 7,602,374 3,755,422 7,549,205 3,866,979
Rupees in thousands
July to December
October to December
July to December
October to December
20112012

28 2013HALF YEAR
12. Cash flow from operating activities Profit before tax 3,391,753 1,632,833 Adjustment for : - Depreciation on property, plant and equipment 784,113 722,165 - Depreciation on assets subject to finance lease - 545 - Amortization on intangibles 9,226 9,226 - Profit on disposal of property, plant and equipment (8,161) (10,147) - Dividend income (713,048) (505,931) - Retirement and other benefits accrued 31,064 24,767 - Markup income (21,436) (28,700) - Exchange loss - net 75,329 51,412 - Finance cost 624,366 938,733 Profit before working capital changes 4,173,206 2,834,903 Effect on cash flow due to working capital changes: - Stores, spares and loose tools 476,103 (536,683) - Stock-in-trade (692,016) (938,987) - Trade debts 35,984 221,041 - Advances, deposits, prepayments and other receivables (92,644) (27,102) - Trade and other payables (204,568) (147,878) (477,141) (1,429,609) Cash generated from operations 3,696,065 1,405,294
Rupees in thousands July to December
2012
July to December
2011
Rupees in thousands July to December
2012
July to December
2011
Relationship with the group Nature of transaction
Associated companies/ other related parties Purchase of goods and services 675,756 465,262 Insurance premium 48,090 53,031 Sale of goods 73,897 37,862 Purchase of Assets 328,751 - Mark-up income on balances with related parties 799 966 Insurance claim received - 65 Dividend income 703,012 564,551 Key management personnel Salaries and other employment benefits 54,799 54,521 Post employment Expense charged in benefit plans respect of staff retirement benefits plans 43,714 35,862
All transactions with related parties have been carried out on commercial terms and conditions.
11. Transactions with related parties
The related parties comprise associated companies, other related companies, directors of the company, key management personnel and post employment benefit plans. Significant transactions with related parties are as follows:

13. Cash and cash equivalents Short term borrowings - secured (8,192,486) (10,397,097) Cash and bank balances 1,448,235 270,963 (6,744,251) (10,126,134)
14. Operating segments Segment information is presented in respect of the group's business. The primary format, business segment, is based on the group's management reporting structure. The group's operations comprise of the following main business segment types: Type of segments Nature of business Cement Production and sale of clinker, Ordinary Portland and Sulphate Resistant Cements. Paper Manufacture and supply of paper products and packing material.
14.1Segment analysis and reconciliation - condensed
The information by operating segment is based on internal reporting to the Group executive committee,
identified as the 'Chief Operating Decision Maker' as defined by IFRS 8. This information is prepared
under the IFRS's applicable to the consolidated financial statements. All group financial data are assigned
to the operating segments.
Rupees in thousands July to December
2012
July to December
2011
Rupees in thousands
Cement
Paper
Elimination - net
Consolidated
July toDecember
2012
July toDecember
2011
December2012
unaudited
June2012
audited
July toDecember
2012
July toDecember
2011
July toDecember
2012
July toDecember
2011
July toDecember
2012
July toDecember
2011
Revenue from
- External Customers 11,825,821 10,701,409 415,213 397,815 - - 12,241,034 11,099,224
- Inter-group - - 365,784 348,629 (365,784) (348,629) - -
11,825,821 10,701,409 780,997 746,444 (365,784) (348,629) 12,241,034 11,099,224
Segment gross profit 4,616,600 3,476,874 22,197 46,600 (137) 26,545 4,638,660 3,550,019
Segment expenses (1,357,178) (1,598,367) (9,218) (11,478) (9,125) 405 (1,375,521) (1,609,440)
Other income 772,566 650,192 1,863 8,935 (21,449) (28,140) 752,980 630,987
Financial charges (577,396) (885,823) (77,137) (80,644) 30,167 27,734 (624,366) (938,733)
Taxation (541,292) (363,436) (24,000) 4,600 112,293 - (565,292) (358,836)
Profit after taxation 2,913,300 1,279,440 (86,295) (31,987) 111,749 26,544 2,826,461 1,273,997
Depreciation 765,282 701,011 18,831 21,154 - - 784,113 722,710
Capital expenditure (1,771,582) (328,605) (168,198) (218,953) - - (1,939,780) (547,558)
Cash to operations 2,764,802 361,114 53,788 (93,831) (30,167) (27,734) 2,788,423 239,549
Cash from investing (1,029,357) 133,532 (281,713) (6,987) 21,449 28,140 (1,289,621) 154,685
Segment assets 57,416,986 45,182,732 1,919,072 2,295,550 (239,569) (361,462) 59,096,490 52,105,801
Segment liabilities 17,917,418 19,044,868 1,634,004 1,910,949 (287,012) (413,056) 19,264,410 18,755,818
December2012
unaudited
June2012
audited
December2012
unaudited
June2012
audited
December2012
unaudited
June2012
audited
292013 HALF YEAR

Chief Executive Director
14.2 Geographical segments
All segments of the group are managed on nation-wide basis and operate manufacturing facilities and
sales offices in Pakistan only.
15. Date of authorization
This interim financial information was authorized for issue by the Board of Directors of the parent company
on 11 February 2013.
16. Corresponding figures
Corresponding figures have been re-arranged wherever necessary for the purposes of comparison, however,
no significant re-arrangements have been made.
30 2013HALF YEAR

Notes

Notes


![Untitled-1 [] · Habib Bank Limited MCB Bank Limited National Bank of Pakistan Standard Chartered Bank (Pakistan) Limited ... HR staffing, compensation and benefits are market driven](https://static.fdocuments.us/doc/165x107/5f84954442f94948067096e4/untitled-1-habib-bank-limited-mcb-bank-limited-national-bank-of-pakistan-standard.jpg)