
Corporate Presentation Template Internal Use Only · · 2018-02-10Used the latest WECC-approved...
168
Opening 2014-2015 Transmission Planning Process Stakeholder Meeting Tom Cuccia Lead Stakeholder Engagement and Policy Specialist November 19-20, 2014
Transcript of Corporate Presentation Template Internal Use Only · · 2018-02-10Used the latest WECC-approved...
Opening
2014-2015 Transmission Planning Process Stakeholder Meeting
Tom Cuccia
Lead Stakeholder Engagement and Policy Specialist
November 19-20, 2014

Today’s Agenda – November 19th
Topic Presenter
Opening Tom Cuccia
Introduction & Overview Neil Millar
San Francisco Peninsula Extreme
Event Reliability Assessment
Jeff Billinton
Over Generation Assessment Irina Green
Recommendations for Management
Approval of Reliability Projects less
than $50 Million
ISO Regional Transmission Engineers
Long-Term Local Capacity Need
Analysis
Catalin Micsa and David Le
Locational Effectiveness Factors David Le
Page 2

Page 3
Tomorrow’s Agenda – November 20st
Topic Presenter
Opening Tom Cuccia
RPS Portfolio Assessment ISO Regional Transmission
Engineers
Summary of LA Basin/San Diego and
Imperial Area Interaction
Robert Sparks
2013-2014 CAISO Transmission
Planning Process Harry Allen – El
Dorado 500 kV Project Economic
Analysis
Robert Sparks
Economic Study Assessment Yi Zhang
Long-Term CRR Assessment Chris Mensah-Bonsu

Introduction and Overview
Policy-Driven and Economic Assessment
Neil Millar
Executive Director, Infrastructure Development
2014-2015 Transmission Planning Process Stakeholder Meeting
November 19-20, 2014

2014-2015 Transmission Planning Cycle
Slide 2
Phase 1
Development of ISO unified
planning assumptions and
study plan
• Incorporates State and
Federal policy
requirements and
directives
• Demand forecasts, energy
efficiency, demand
response
• Renewable and
conventional generation
additions and retirements
• Input from stakeholders
• Ongoing stakeholder
meetings
Phase 3
Receive proposals to build
identified reliability, policy
and economic transmission
projects.
Technical Studies and Board Approval
• Reliability analysis
• Renewable delivery analysis
• Economic analysis
• Wrap up of studies continued from
previous cycle
• Publish comprehensive transmission plan
• ISO Board approval
Continued regional and sub-regional coordination
October 2015
Coordination of Conceptual
Statewide Plan
April 2014
Phase 2
March 2015
ISO Board Approval
of Transmission Plan

Slide 3
Development of 2014-2015 Annual Transmission Plan
Reliability Analysis (NERC Compliance)
33% RPS Portfolio Analysis - Incorporate GIP network upgrades
- Identify policy transmission needs
Economic Analysis - Congestion studies
- Identify economic
transmission needs
Other Analysis (LCR, SPS review, etc.)
Results

2014-2015 Ten Year Plan Milestones
Preliminary reliability study results were posted on
August 15
Stakeholder session September 24th and 25th
Comments received October 9
Today’s session - preliminary policy and economic
study results
Comments due by December 4
Draft plan to be posted January, 2015
Page 4

Issues
• Updates related to 2014-2015 TPP reliability analysis:
– San Francisco Peninsula
– “Over Generation” frequency response assessment
– Management approval of certain reliability projects
less than $50 million
• Standalone issues:
– Harry Allen –Eldorado (2013-2014 further study)
– Locational effectiveness factors
• Interaction between Imperial area policy-driven analysis
and LA Basin/San Diego reliability needs.
Page 5

Management is considering approving a number of
reliability transmission projects less than $50 million
• Approving these projects allows streamlining the review and
approval process of the annual transmission plan in March
• Only those projects less than $50 million are considered for
management approval that:
– Can reasonably be addressed on a standalone basis
– Are not impacted by policy or economic issues that are still being
assessed.
– Are not impacted by the approval of the transmission plan (and
reliability projects over $50 million) by the Board of Governors in
March, 2015
• Management will only approve these projects after the
December Board of Governors meeting
• Other projects less than $50 million will be dealt with in the
approval of the comprehensive plan in March.
Page 6

Renewable Portfolio Standard Policy Assumptions
Portfolios received from the CPUC and CEC on February 27,
2014
Posted to ISO website March 5
As in previous cycles, a “commercial interest” portfolio was
the base – focusing on the mid-AAEE scenario as the current
trajectory.
A sensitivity focusing on a high Imperial Valley (2500 MW
instead of 1000 MW incremental renewable resources).
Page 7

Page 8
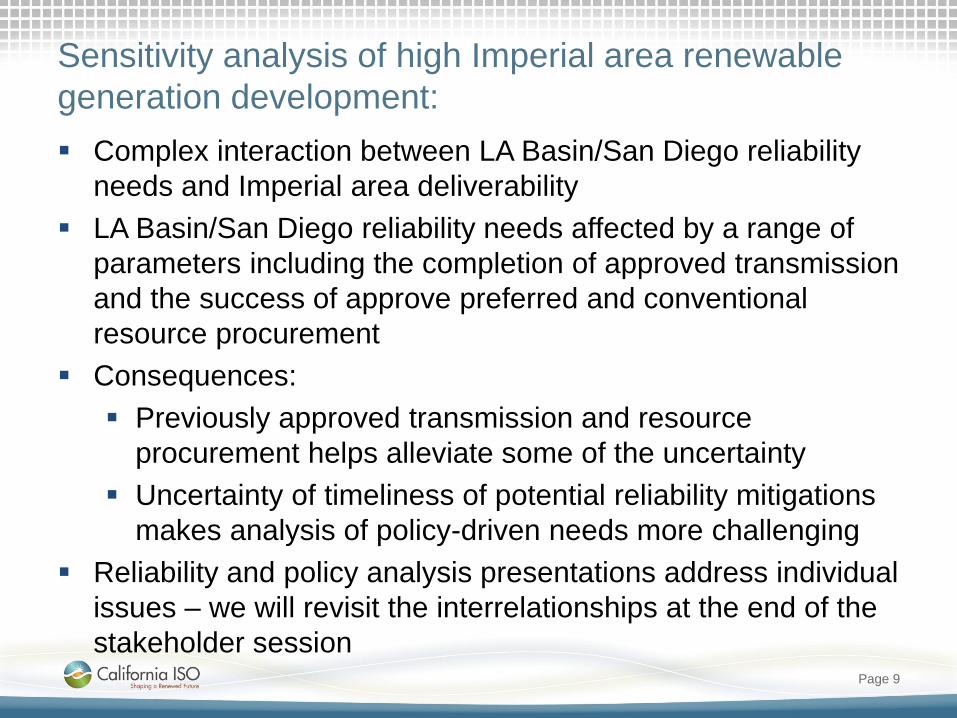
Sensitivity analysis of high Imperial area renewable
generation development:
Complex interaction between LA Basin/San Diego reliability
needs and Imperial area deliverability
LA Basin/San Diego reliability needs affected by a range of
parameters including the completion of approved transmission
and the success of approve preferred and conventional
resource procurement
Consequences:
Previously approved transmission and resource
procurement helps alleviate some of the uncertainty
Uncertainty of timeliness of potential reliability mitigations
makes analysis of policy-driven needs more challenging
Reliability and policy analysis presentations address individual
issues – we will revisit the interrelationships at the end of the
stakeholder session
Page 9

San Francisco Extreme Event Analysis
2014-2015 Transmission Planning Process Stakeholder Meeting
Jeff Billinton
Manager, Regional Transmission - North
November 19-20, 2014
Available on Market Participant Portal
Confidential – Subject to Transmission Planning NDA

Assessment of Frequency Response during Over
Generation Conditions
2014-2015 Transmission Planning Process Stakeholder Meeting
Irina Green
Engineer Lead, Regional Transmission North
November 19-20, 2014
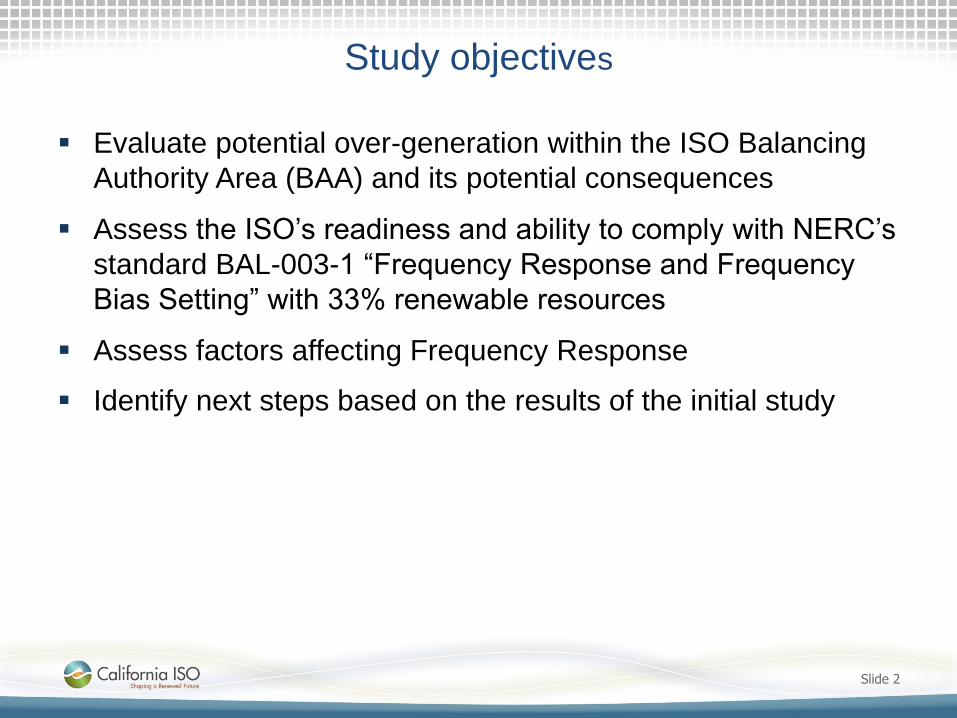
Study objectives
Evaluate potential over-generation within the ISO Balancing
Authority Area (BAA) and its potential consequences
Assess the ISO’s readiness and ability to comply with NERC’s
standard BAL-003-1 “Frequency Response and Frequency
Bias Setting” with 33% renewable resources
Assess factors affecting Frequency Response
Identify next steps based on the results of the initial study
Slide 2

Production Simulation Analysis
Started with production simulation in Grid View for 2024
Used the latest WECC Database for the year 2024
Base case included CPUC Renewable Generation Portfolios
with 33% renewable resources in California
Slide 3

Power Flow and Dynamic
Base Case Development
Selected hour of the year to study
light spring, low load, high renewable generation
The hour selected from production simulation case was April 7, 2024 at
11 a.m.
Prepared power flow cases and dynamic stability models
Power flow case closely matched the case from the production
simulation
Slide 4

Power Flow and Dynamic
Base Case Development
Power flow case – exported from Grid View for the selected hour
Adjusted reactive support: turned off capacitors, turned on reactors;
high voltage was an issue
Dynamic stability models – from the latest WECC Master Dynamic File
Added missing dynamic stability models for renewables using typical
models according to the type and capacity of the projects
Used the latest WECC-approved dynamic stability models for inverter-
based generation: wind – type 3 (double-fed induction generator) and
type 4 (full converter), solar: large PV plant, small PV plant, distributed
PV
Adjusted power flow case to better match the case from production
simulation and to ensure that all generation is dispatched within the
units’ capability
Slide 5
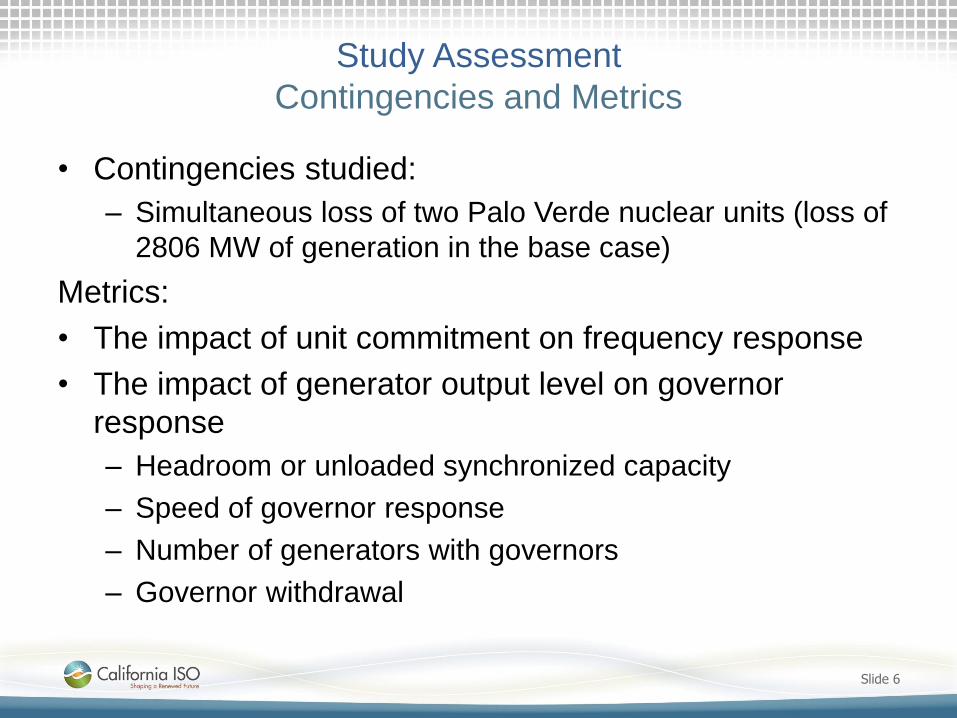
Study Assessment
Contingencies and Metrics
• Contingencies studied:
– Simultaneous loss of two Palo Verde nuclear units (loss of
2806 MW of generation in the base case)
Metrics:
• The impact of unit commitment on frequency response
• The impact of generator output level on governor
response
– Headroom or unloaded synchronized capacity
– Speed of governor response
– Number of generators with governors
– Governor withdrawal
Slide 6

Power Flow Base Case Assumptions, April 7 2024 11am
Load, WECC - 100,410 MW, 53.6% of the summer peak load
Load, ISO - 24,117 MW, 39.4% of the summer peak load
Losses, WECC – 3,162 MW
Losses, ISO – 510 MW
Generation, WECC – 103,580 MW
Generation, ISO – 22,650 MW
COI flow – 1170 MW North-to-South
Path 15 flow – 2800 MW South-to-North
Path 26 flow – 760 MW South-to-North
PDCI schedule - 620 MW North-to-South
Import to ISO – 1977 MW
Wind and solar output WECC, 25.8% of total dispatch
Wind and solar output, ISO, 48.6% of total dispatch
Slide 7
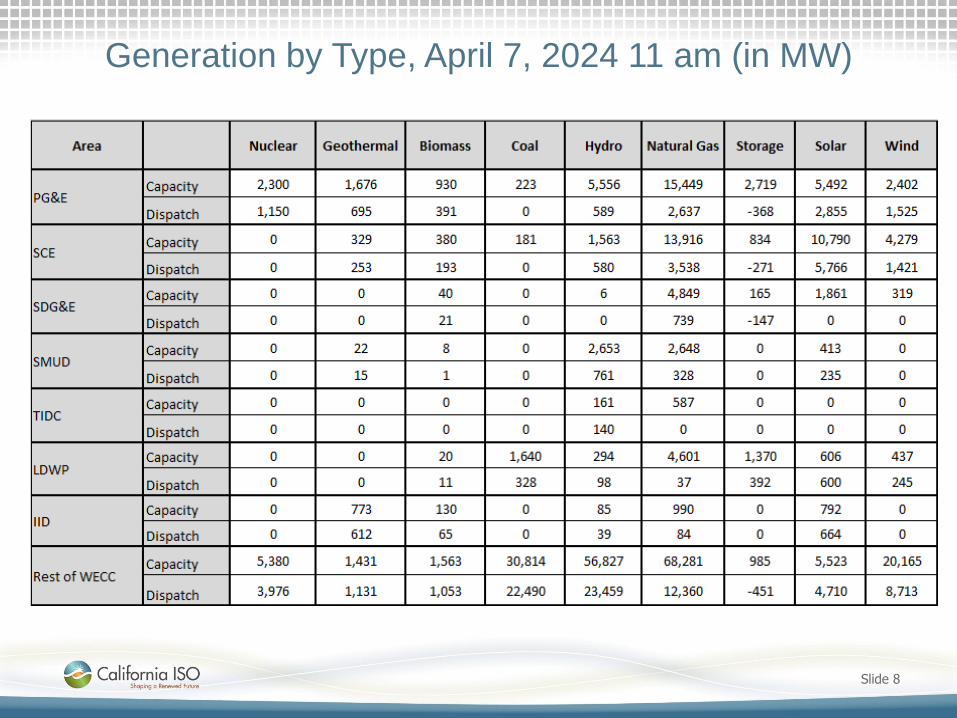
Generation by Type, April 7, 2024 11 am (in MW)
Slide 8

Non-summer months – net load pattern changes
significantly starting in 2014
Slide 9
Production Simulation for April 7, 2024, 11 am ISO load 24,117 MW Wind & Solar Generation 11,802 MW Net load 12,315 MW
Illustration of ISO Duck Curve

Study Results for an Outage of Two Palo Verde Units
Frequency on 500 kV buses
Slide 10
59.882 HZ
Nadir 59.708 Hz at
6.5 seconds
Settling frequency
59.882 Hz
Change in frequency
0.118 Hz

Study Results for an Outage of Two Palo Verde Units
Voltage on 500 kV buses
Slide 11
Voltage within the
limits

Governor Response
Generators with the highest response (WECC)
Slide 12
Coulee #23, 24 - 45
MW, 6%, 805 MW
capacity
Coulee#21 – 42 MW,
7%, 600 MW capacity
Coulee#19 – 34 MW,
6%, 600 MW capacity
Dry Fork – 28 MW, 6%,
440 MW capacity
San Juan # 4 – 28 MW,
5%, 553 MW capacity
Grand Coulee – hydro plant
in Washington state,
Dry Fork – coal plant in
Wyoming,
San Juan - coal plant in
New Mexico

Governor Response
Generators with the highest response (CAISO)
Slide 13
PG&E Project, unit # 3 –
11 MW, 4%, 290 MW
capacity
Units # 1 and 2, 9 MW,
5%, 189 MW capacity
Haas unit # 2, 11 MW,
14%, 72 MW capacity
Lodi gas unit # 1, 10
MW, 6%, 185 MW
capacity
Ivanpah, 10 MW, 8%,
133 MW capacity
PG&E project and Lodi –
natural gas,
Haas – hydro,
Ivanpah – solar thermal

Frequency Response Obligation (FRO)
Slide 14
Frequency Response (FR)
FRO for the Interconnection is established in BAL-003-1
Frequency Response & Frequency Bias Setting Standard
For WECC FRO is 949 MW/0.1Hz
Balancing Authority FRO allocation
For the CAISO, FRO is approximately 30% of WECC FRO
(285 MW/0.1HZ)

Study Results, Frequency Response Measure and
Headroom
Slide 15
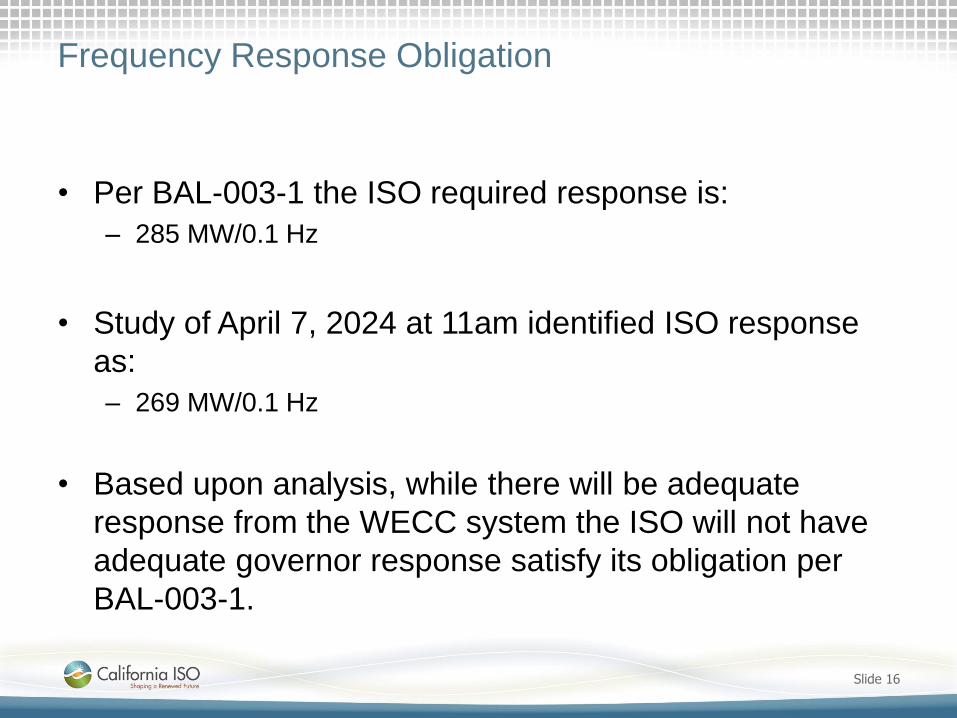
Frequency Response Obligation
• Per BAL-003-1 the ISO required response is:
– 285 MW/0.1 Hz
• Study of April 7, 2024 at 11am identified ISO response
as:
– 269 MW/0.1 Hz
• Based upon analysis, while there will be adequate
response from the WECC system the ISO will not have
adequate governor response satisfy its obligation per
BAL-003-1.
Slide 16
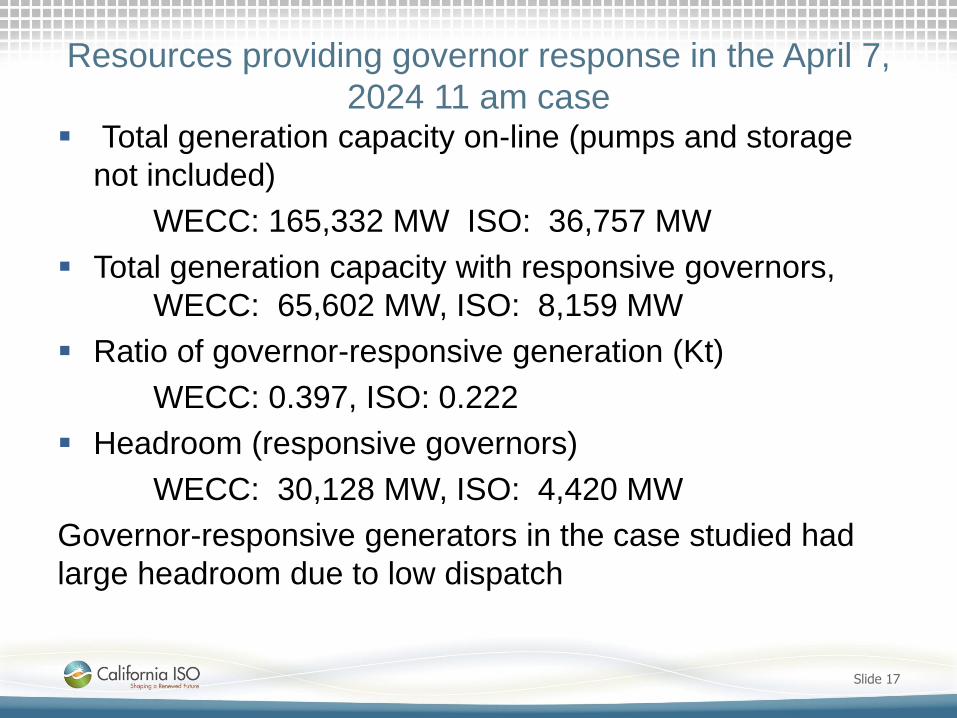
Resources providing governor response in the April 7,
2024 11 am case Total generation capacity on-line (pumps and storage
not included)
WECC: 165,332 MW ISO: 36,757 MW
Total generation capacity with responsive governors,
WECC: 65,602 MW, ISO: 8,159 MW
Ratio of governor-responsive generation (Kt)
WECC: 0.397, ISO: 0.222
Headroom (responsive governors)
WECC: 30,128 MW, ISO: 4,420 MW
Governor-responsive generators in the case studied had
large headroom due to low dispatch
Slide 17

Sensitivity Study with Reduced Headroom in the ISO
Slide 18
Reduced headroom of the
units with responsive
governors from 4420 MW
to 1430 MW by turning off
some units and re-
dispatching generation
Did not change dispatch in
the rest of WECC
System performance still
acceptable, but close to
the margin
WECC response 2137
MW/0.1Hz
ISO response 141
MW/0.1Hz
27 MW of load in British
Columbia tripped by
under-frequency relays
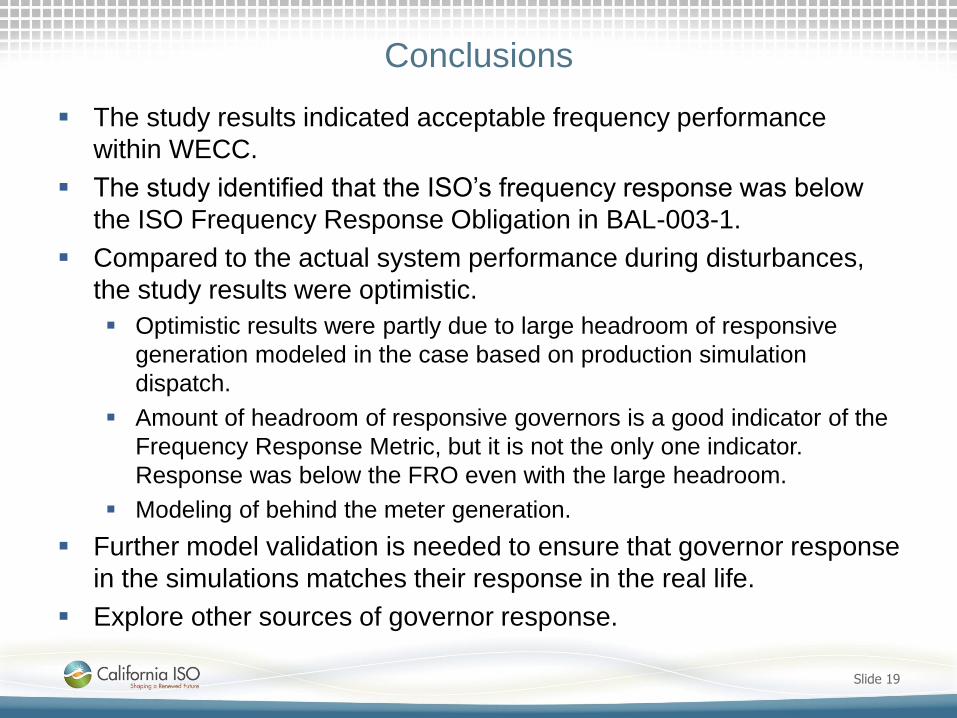
Conclusions
The study results indicated acceptable frequency performance
within WECC.
The study identified that the ISO’s frequency response was below
the ISO Frequency Response Obligation in BAL-003-1.
Compared to the actual system performance during disturbances,
the study results were optimistic.
Optimistic results were partly due to large headroom of responsive
generation modeled in the case based on production simulation
dispatch.
Amount of headroom of responsive governors is a good indicator of the
Frequency Response Metric, but it is not the only one indicator.
Response was below the FRO even with the large headroom.
Modeling of behind the meter generation.
Further model validation is needed to ensure that governor response
in the simulations matches their response in the real life.
Explore other sources of governor response.
Slide 19

Further Assessment
Investigate measures to improve ISO frequency
response:
load response,
response from storage; and/or
inverter-based generation
Study more cases with reduced headroom
Study other contingencies
Future work – validate models
Slide 20

California ISO – Internal Use Only
Recommendations for Management Approval of
Reliability Projects less than $50 Million
PG&E Area
2014-2015 ISO Transmission Planning Process
Chris Mensah-Bonsu, PhD
Sr. Regional Transmission Engineer
November 19-20, 2014

California ISO – Internal Use Only
PG&E Reliability Projects
Less than $50 Million
• At this time no projects are being requested for
Management Approval in PG&E area.
• Currently reviewing projects submitted to Request
Window
– Due to estimated In-service Date of projects and
current action plans to address reliability concerns in
areas, ISO may continue to monitor in future cycles
and if required approve projects closer to when
projects would be initiated.
Page 2

California ISO – Internal Use Only
ISO Recommendations on Proposed Projects
Kern Area
Slide 3
Project Name Type of
Project
Submitted By Is Project
Found Needed
Lathrop 60 kV Load
Interconnection
Load
Interconnection PG&E Concur
Aera Energy-East Cat
Canyon Load
Interconnection
Load
Interconnection
PG&E Concur
Southeast Surface Water
Treatment Facility
(SESWTF)
Load
Interconnection
PG&E Concur

California ISO – Internal Use Only
Slide 4
Three (3) Project Recommended for
Concurrence (Load Interconnection)

California ISO – Internal Use Only
Central Valley Area Load Interconnection
Slide 5
Need: 14 MW load interconnection.
Project Scope:
New customer owned 60kV substation and a 60 kV transmission line tapped into PG&E’s Kasson-Louise 60kV Line. • Interconnection will be designed to be transferred to 115
kV system to accommodate forecast load at new substation with interim connection to 60 kV to meet customer interconnection requirements.
Cost:
$1M - $2M (PG&E)
Other Considered Alternatives:
Permanent interconnection on the Kasson-Louise 60 kV Line was considered; however forecasted load at station would require rebuild of 60 kV system in area.
Expected In-Service: 2015

California ISO – Internal Use Only
Kern Area Load Interconnection
Slide 6
Need: 12 MW load interconnection
Project Scope: Proposes to connect a new customer
owned 115 kV tap line on the PG&E’s Santa Ynez-Sisquoc
115 kV Line to a new customer owned substation
Cost: $1.8M
Other Considered Alternatives: Directly interconnect to
the to the Palmer Substation 115 kV. Results in expensive
conversion of Palmer substation into a 4-breaker ring bus.
Expected In-Service: 1/2017
Customer Owned
Substation
California ISO – Internal Use Only
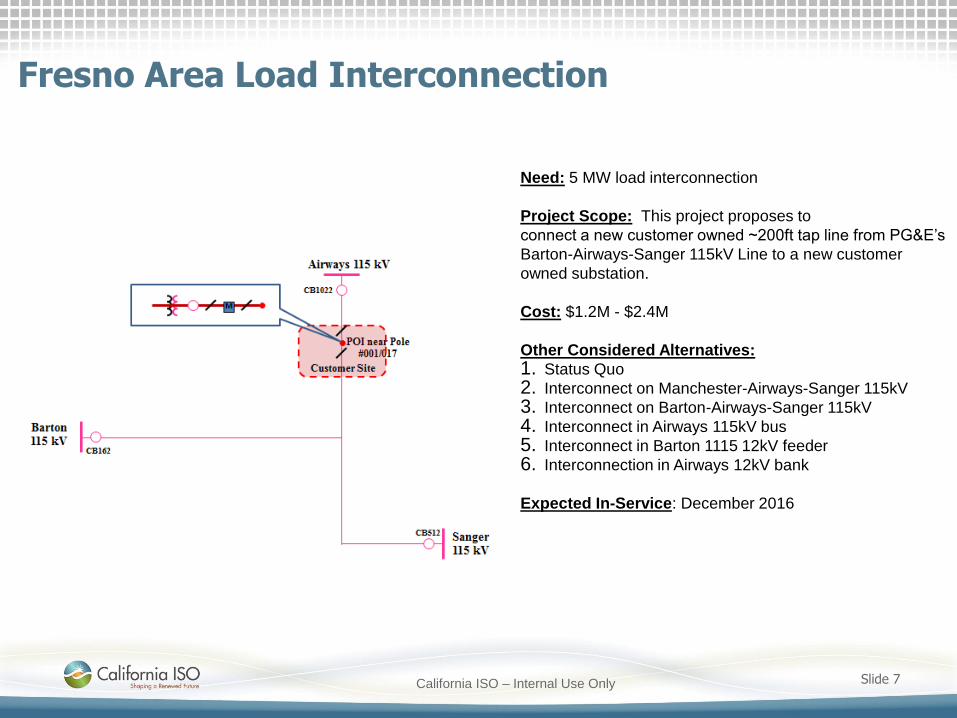
Fresno Area Load Interconnection
Slide 7
Need: 5 MW load interconnection
Project Scope: This project proposes to
connect a new customer owned ~200ft tap line from PG&E’s
Barton-Airways-Sanger 115kV Line to a new customer
owned substation.
Cost: $1.2M - $2.4M
Other Considered Alternatives:
1. Status Quo
2. Interconnect on Manchester-Airways-Sanger 115kV
3. Interconnect on Barton-Airways-Sanger 115kV
4. Interconnect in Airways 115kV bus
5. Interconnect in Barton 1115 12kV feeder
6. Interconnection in Airways 12kV bank
Expected In-Service: December 2016

California ISO – Internal Use Only
Recommendations for Management Approval of
Reliability Projects less than $50 Million
SCE Metro Area
2014-2015 ISO Transmission Planning Process
Nebiyu Yimer
Regional Transmission - South
November 19-20, 2014

California ISO – Internal Use Only
Slide 2
One (1) Project Recommended for
Management Approval (under $50 Million)
California ISO – Internal Use Only
Laguna Bell Corridor Upgrades
Slide 3
Need: NERC Category B & C overloads (2020)
Project Scope: The project will increase the
emergency ratings of three (3) 230 kV lines (shown in
green) by 32-35% by
• replacing terminal equipment at Laguna Bell and
Lighthipe and
• Removing clearance limitations on a total of two
spans
Cost: $5 million
Other Considered Alternatives: Utilize available
preferred resources
Expected In-Service: December 31, 2020
Interim Plan: N/A

California ISO – Internal Use Only
Laguna Bell Corridor Upgrades – Cont’d
Slide 4
Transmission line
Contingency
type
2024 summer peak loading (%)
Pre-
project
Post-
project
Post-project with
available
preferred
resources
Mesa–Laguna Bell #1 230 kV
B(L-1) 102% 76% N/A
B(G-1/L-1) 111% 82% N/A
C(L-2) 128% 95% N/A
C(L-1/L-1) 137% 102% <100%
Mesa–Laguna Bell #2 230 kV
B(G-1/L-1) 101% 75% N/A
C(L-2) 106% 79% N/A
C(L-1/L-1) 110% 81% N/A
Mesa–Lighthipe 230 kV C(L-2) 107% 81% N/A
Pre-project and post-project maximum line loadings

California ISO – Internal Use Only
Recommendations for Management Approval of
Reliability Projects less than $50 Million
San Diego Gas & Electric Area
Executive Review of the 2014-2015 ISO Transmission Plan
Reliability Project Recommendations
Frank Chen Sr. Regional Transmission Engineer
November 11, 2014

California ISO – Internal Use Only
ISO Recommendations on Proposed Projects
San Diego Gas & Electric Area
Slide 2
Project Name Type of
Project
Submitted
By
Is Project Found
Needed
TL692 Line Reconductor Reliability SDG&E Yes
2nd Pomerado–Poway 69kV Circuit Reliability SDG&E Yes
Mission-Penasquitos 230 kV Circuit Reliability ISO Yes
TL632 Granite Loop-In and TL6914
Reconfiguration
Reliability SDG&E Yes
Salt Creek 69 kV Load Substation Distribution SDG&E Concur
Vine 69 kV Load Substation Distribution SDG&E Concur

California ISO – Internal Use Only
1. TL692 69 kV Circuit Reconductor
Slide 3
Need: NERC Category C overload (2016)
Project Scope: Re-conductor TL692 69 kV
line to archive normal rating of 102 MVA from
32 MVA
Cost: Minimal incremental cost to advance
the wood-to-steel project by two years which
costs $25.9~$28.5 M to replace wood with
steel poles and reconductor for TL692
Other Considered Alternatives:
New SPS to protect TL692 ($3 millions)
Expected In-Service: June 2016
Interim Plan: NA

California ISO – Internal Use Only
2. 2nd Pomerado–Poway 69kV Circuit
Slide 4
Need: CAISO Planning Standards G-1/L-1 and
various NERC Category C3/C5 overloads (2015~)
Project Scope: Build 2nd Pomerado-Poway 69kV
circuit rated at 174 MVA (2.6 miles) with Poway 69
kV sub and TL6913 right-of-way expansion
Cost: $17~$19 millions
Other Considered Alternatives:
Re-conductor TL6913 again will be less cost-
effective and can’t eliminate the Category C
overloads associated to the TL6913 outage
Expected In-Service: June 2016
Interim Plan: Operation Procedure to shed up to
80 MW loads in the Poway area
California ISO – Internal Use Only
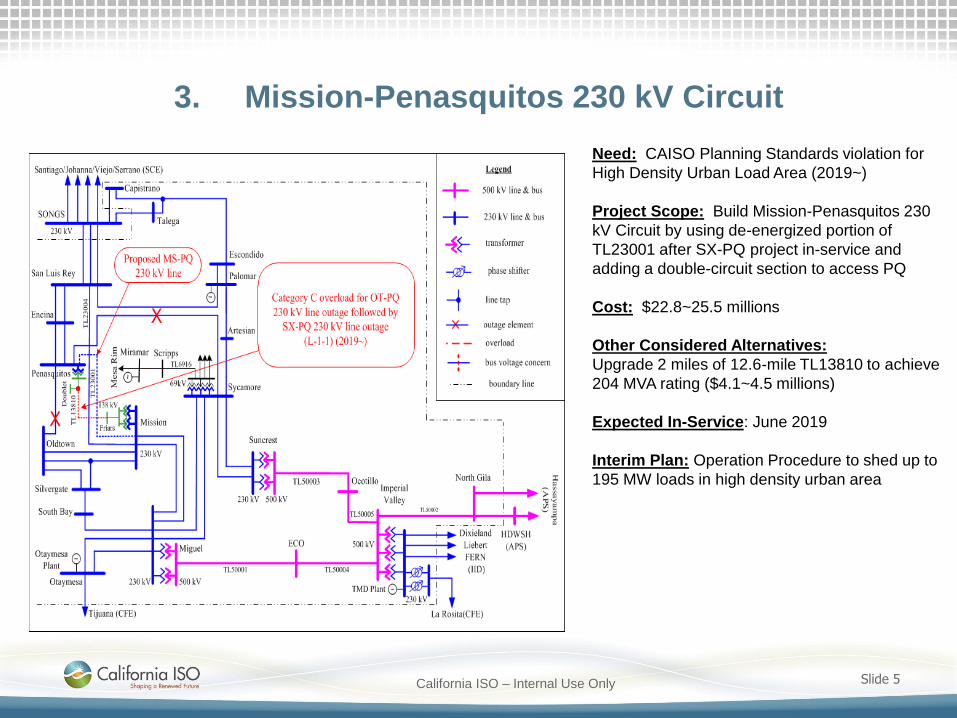
3. Mission-Penasquitos 230 kV Circuit
Slide 5
Need: CAISO Planning Standards violation for
High Density Urban Load Area (2019~)
Project Scope: Build Mission-Penasquitos 230
kV Circuit by using de-energized portion of
TL23001 after SX-PQ project in-service and
adding a double-circuit section to access PQ
Cost: $22.8~25.5 millions
Other Considered Alternatives:
Upgrade 2 miles of 12.6-mile TL13810 to achieve
204 MVA rating ($4.1~4.5 millions)
Expected In-Service: June 2019
Interim Plan: Operation Procedure to shed up to
195 MW loads in high density urban area

California ISO – Internal Use Only
4. TL632 Granite Loop-In and TL6914 reconfiguration
Slide 6
Need: Providing superior mitigation than
previously approved TL631 re-conductor project
Project Scope: Remove Granite Tap by Loop-in
TL632 to Granite Sub with OH-UG in and out,
and reconfigure TL6914 to terminate between
Miguel and Loveland
Cost: $15.2~$19.8 millions
Other Considered Alternatives:
Similar plan with TL632 Granite Loop-In in
double-circuit lines from GraniteTap to Granite
Expected In-Service: June 2017
Interim Plan: NA

California ISO – Internal Use Only
5. Salt Creek 69 kV Load Sub
6. Vine 69 kV Load Sub
Slide 7
Need: Distribution load growth at Salt Creek
and Vine
Project Scope: 2-in/1-out 69 kV sources at
Salt Creek; 1-in/1-out 69 kV sources at Vine,
Cost: TBD; it costs extra $16.7~18.5 M to
build new Miguel-Salt Creek 69 kV line
Other Considered Alternatives:
two 69 kV transmission sources (1-in/1-out)
to serve initial Salt Creek sub
Expected In-Service: Salt Creek:2016,
Vine: 2017

2024 Long-Term LCR Study Results -
Northern Local Areas
Catalin Micsa
Lead Regional Transmission Engineer
2014-2015 Transmission Planning Process Stakeholder Meeting
November 19-20, 2014

Assessment of LCR needs done by:
Slide 2
Humboldt Rajeev Annaluru
North Coast/North Bay Rajeev Annaluru
Sierra Catalin Micsa
Stockton Catalin Micsa
Bay Area Bryan Fong
Fresno Abhishek Singh
Kern Chris Mensah-Bonsu
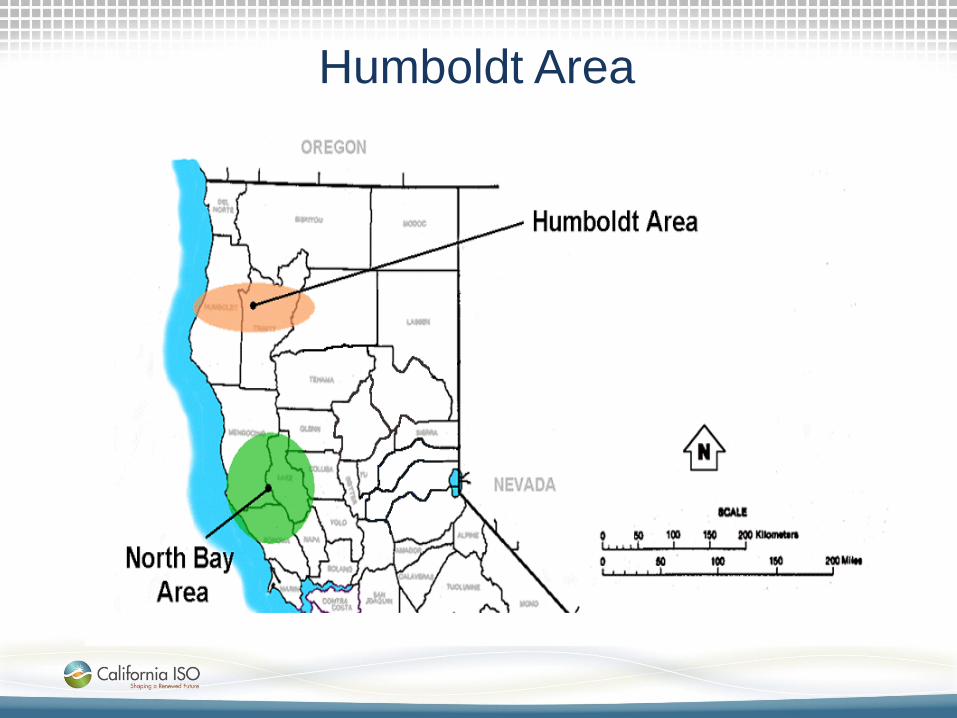
Humboldt Area

Humboldt Load and Resources (MW)
2019
Slide 4
Load = 194 196
Transmission Losses = 10 7
Total Load = 204 203
Market Generation = 184 184
QF/Self-Gen Generation = 55 55
Total Qualifying Capacity = 239 239
2024

New transmission projects modeled:
1. Laytonville 60 kV Circuit Breaker Installation Project (2016)
2. Maple Creek Reactive Support (2017)
3. Humboldt - Eureka 60 kV Line Capacity Increase (2017)
4. New Bridgeville - Garberville No.2 115 kV Line (2022)
Slide 5

Critical Contingencies
Humboldt Area
Wildwood
Trinity
Humboldt
Ridge
Cabin
60 kV
60 kV
60 kV
115 kV
115 kV 115 kV
Maple
Creek
Bridgeville
115 kV
115 kV
Cottonwood115 kV
Low Gap
Garberville
Kekawaka
Laytonville
60 kV
60 kV
60 kV
60 kV60 kV
~~~
~~~
~~~
Humboldt
Bay
~ ~ ~
60 kV
System
Pacific
Lumber
~
Slide 6
overload
X
X
X outage

Critical Contingencies Humboldt Area
Humboldt Overall – Category B
Contingency: Cottonwood-Bridgeville 115 kV line + one Humboldt PP units out
of service
Limiting component: Thermal overload on Humboldt -Trinity 115 kV line
2019 LCR Need: 123 MW (including 36 MW of QF/Self generation)
2024 LCR Need: 127 MW (including 36 MW of QF/Self generation)
Humboldt Overall – Category C
Contingency: Cottonwood – Bridgeville 115 kV line + 115 kV Gen tie to the
Humboldt Bay Units
Limiting component: Thermal overload on the Humboldt - Trinity 115kV Line
2019 LCR need: 173 MW (including 36 MW of QF/Self generation)
2024 LCR need: 178 MW (including 36 MW of QF/Self generation)
Slide 7

Changes
Compared to 2019 LCR study:
1) New Bridgeville-Garberville 115 kV line
2) Load went down slightly by 1 MW
3) LCR increased slightly by 5 MW
Slide 8
Please send written comments to:
Your comments and questions are welcomed

North Coast/North Bay Load and
Resources (MW)
2019 2024
Slide 9
Load = 1447 1511
Transmission Losses = 37 39
Total Load = 1484 1550
Market Generation = 771 771
Wind Generation = 0 0
Muni Generation = 113 113
QF Generation = 17 17
Total Qualifying Capacity = 901 901

New transmission projects modeled:
1. Mendocino Coast Reactive Support (2015)
2. Laytonville 60 kV Circuit Breaker Installation Project (2016)
3. Fulton - Fitch Mountain 60 kV Line Reconductor (2016)
4. Tulucay 230/60 kV Transformer No. 1 Capacity Increase (2016)
5. Napa - Tulucay No. 1 60 kV Line Upgrades (2017)
6. Vaca Dixon - Lakeville 230 kV Reconductoring (2018)
7. Clear Lake 60 kV System Reinforcement (2020)
8. Mare Island - Ignacio 115 kV Reconductoring Project (2020)
9. Fulton 230/115 kV Transformer (2021)
10. Ignacio - Alto 60 kV Line Voltage Conversion (2021)
Slide 10

North Coast and North Bay
Slide 11

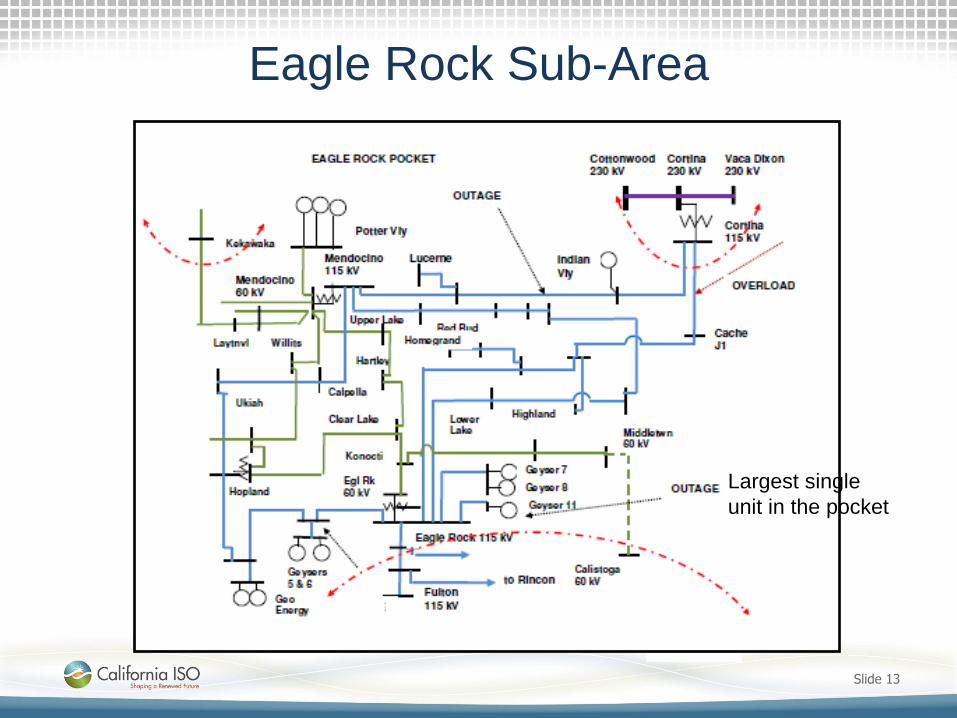
Eagle Rock Sub-Area
Eagle Rock Sub-area – Category B
Contingency: Cortina-Mendocino 115 kV line, with Geyser #11 unit out
2019 LCR need: 201 MW (includes 3 MW of QF/Muni generation)
2024 LCR need: 219 MW (includes 3 MW of QF/Muni generation)
Limiting component: Thermal overload on Eagle Rock-Cortina 115 kV line
Eagle Rock Sub-area – Category C
Same as Category B
Slide 12
Eagle Rock Sub-Area
Slide 13
Largest single
unit in the pocket

Fulton Sub-area
Fulton Sub-area – Category C
Contingency: Fulton-Lakeville and Fulton-Ignacio 230 kV lines
2019 LCR need: 310 MW (includes 70 MW of QF/Muni generation)
2024 LCR need: 312 MW (includes 70 MW of QF/Muni generation)
Limiting component: Thermal overload on Santa Rosa-Corona 115 kV line
Fulton Sub-area – Category B
No requirement.
Slide 14

Fulton Sub-area
Slide 15
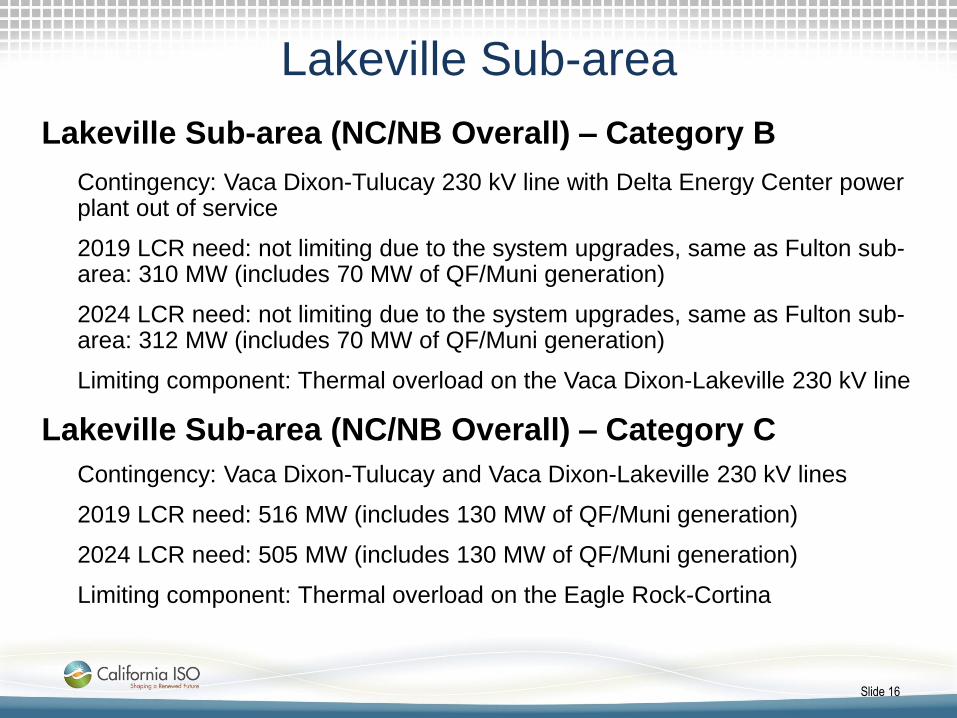
Lakeville Sub-area
Slide 16
Lakeville Sub-area (NC/NB Overall) – Category B
Contingency: Vaca Dixon-Tulucay 230 kV line with Delta Energy Center power plant out of service
2019 LCR need: not limiting due to the system upgrades, same as Fulton sub-area: 310 MW (includes 70 MW of QF/Muni generation)
2024 LCR need: not limiting due to the system upgrades, same as Fulton sub-area: 312 MW (includes 70 MW of QF/Muni generation)
Limiting component: Thermal overload on the Vaca Dixon-Lakeville 230 kV line
Lakeville Sub-area (NC/NB Overall) – Category C
Contingency: Vaca Dixon-Tulucay and Vaca Dixon-Lakeville 230 kV lines
2019 LCR need: 516 MW (includes 130 MW of QF/Muni generation)
2024 LCR need: 505 MW (includes 130 MW of QF/Muni generation)
Limiting component: Thermal overload on the Eagle Rock-Cortina

Lakeville Sub-area Category C
Slide 17
LCR need depends on the generation in the Pittsburg area.

Changes
Compared to 2019 LCR study:
1. Load forecast is higher by 66 MW
2. LCR need has decreased by 11 MW
3. Two small renewable projects
Slide 18
Your comments and questions are welcomed
For written comments, please send to: [email protected]

Sierra Area Load and Resources (MW)
Load = 1976 2177
Transmission Losses = 100 84
Total Load = 2076 2261
Market Generation = 771 771
Muni Generation = 1107 1107
QF Generation = 192 192
Total Qualifying Capacity = 2070 2070
2019 2024
Slide 19
Northern Sierra
Slide 20
Pal
erm
o
Co
lgat
e P
H
Bangor
Smartville
To Woodland
To West Sac.
Dru
m
Atl
anti
c Rio Oso
Pea
se
Ho
ncu
t
E.
Mar
ysvi
lle
Oliv
ehu
rst
B
ogu
e E.
Nic
ola
us
To Table Mtn.
Enci
nal
Li
ve O
ak
Bar
ry
Tud
or
Harter
Browns Vly
Yuba Goldfields
Nar
row
s
Lin
coln
P
leas
ant
Gro
ve
Form
ica
SPI
Cam
p
Far
Wes
t
Beal AFB
Catlett G
rass
Vly
Alle
ghan
y Pike City Columbia Hill
Deer Creek
Wei
mar
Shady Glen
Ro
llin
s P
H
Bo
nn
ie
No
ok
Cap
e H
orn
Plu
mas
To Sacramento
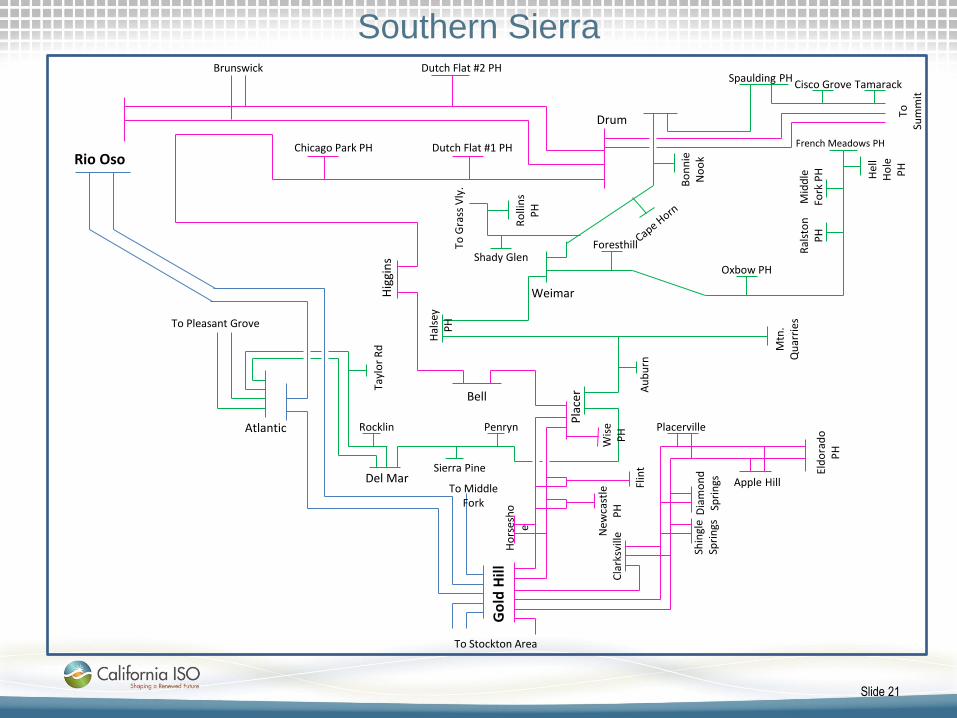
Southern Sierra
Slide 21
Rio Oso
Go
ld H
ill
Atlantic
Del Mar
Rocklin
Tayl
or
Rd
Penryn
Sierra Pine
To Pleasant Grove
Ho
rses
ho
e New
cast
le
PH
C
lark
svill
e
Flin
t
Shin
gle
Spri
ngs
Dia
mo
nd
Sp
rin
gs El
do
rad
o
PH
Placerville
Apple Hill To Middle
Fork
To Stockton Area
Wis
e P
H P
lace
r Au
bu
rn M
tn.
Qu
arri
es
Hal
sey
PH
Weimar
Ro
llin
s P
H
To G
rass
Vly
.
Shady Glen Foresthill
Oxbow PH
Bell H
iggi
ns
Chicago Park PH Dutch Flat #1 PH
Drum
Bo
nn
ie
No
ok
Spaulding PH
To
Sum
mit
Cisco Grove Tamarack
Ral
sto
n
PH
M
idd
le
Fork
PH
French Meadows PH
Hel
l H
ole
P
H
Dutch Flat #2 PH Brunswick
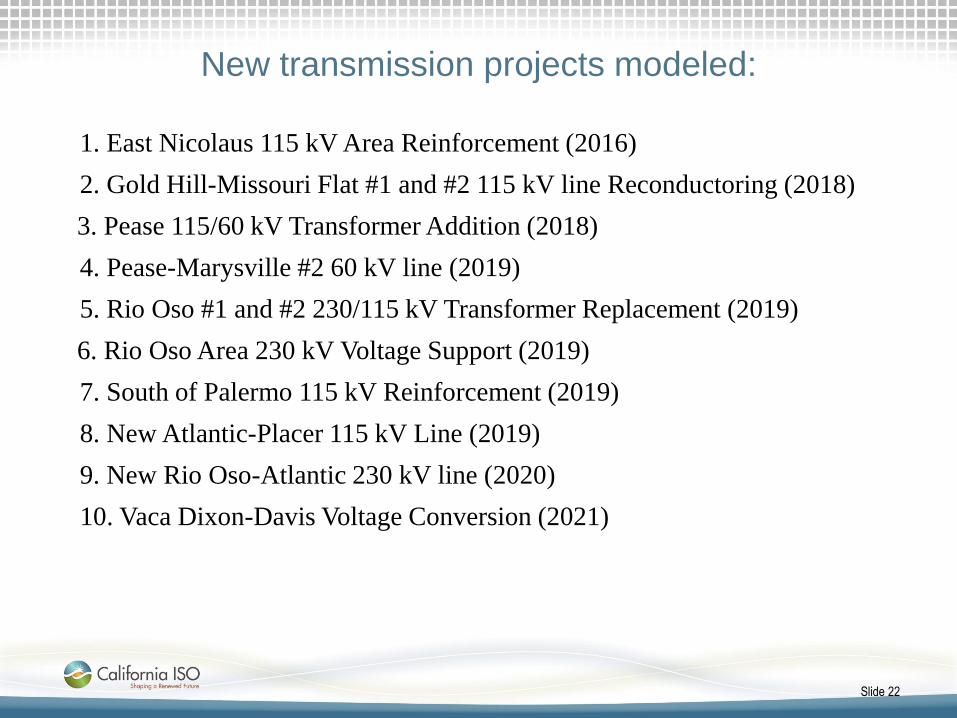
New transmission projects modeled:
1. East Nicolaus 115 kV Area Reinforcement (2016)
2. Gold Hill-Missouri Flat #1 and #2 115 kV line Reconductoring (2018)
3. Pease 115/60 kV Transformer Addition (2018)
4. Pease-Marysville #2 60 kV line (2019)
5. Rio Oso #1 and #2 230/115 kV Transformer Replacement (2019)
6. Rio Oso Area 230 kV Voltage Support (2019)
7. South of Palermo 115 kV Reinforcement (2019)
8. New Atlantic-Placer 115 kV Line (2019)
9. New Rio Oso-Atlantic 230 kV line (2020)
10. Vaca Dixon-Davis Voltage Conversion (2021)
Slide 22
Critical Sierra Area Contingencies
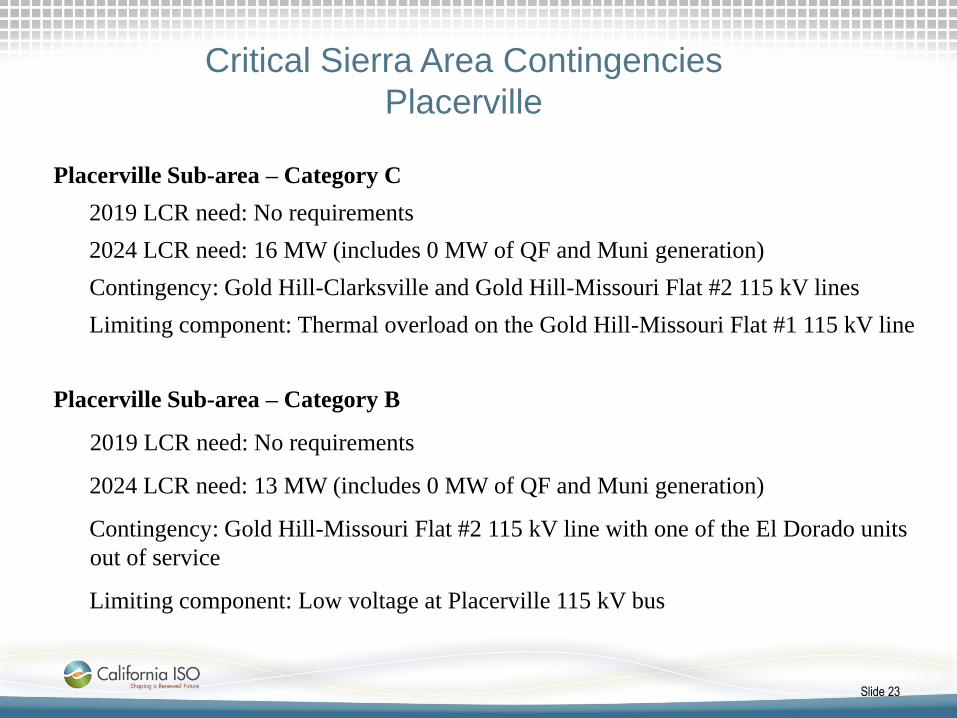
Placerville
Placerville Sub-area – Category C
2019 LCR need: No requirements
2024 LCR need: 16 MW (includes 0 MW of QF and Muni generation)
Contingency: Gold Hill-Clarksville and Gold Hill-Missouri Flat #2 115 kV lines
Limiting component: Thermal overload on the Gold Hill-Missouri Flat #1 115 kV line
Placerville Sub-area – Category B
2019 LCR need: No requirements
2024 LCR need: 13 MW (includes 0 MW of QF and Muni generation)
Contingency: Gold Hill-Missouri Flat #2 115 kV line with one of the El Dorado units
out of service
Limiting component: Low voltage at Placerville 115 kV bus
Slide 23

Critical Sierra Area Contingencies
Placer, Drum-Rio Oso and South of Palermo
Placer Sub-area – Category B & C
2019 LCR need: 60 MW (includes 38 MW of QF and Muni generation)
2024 LCR need: 62 MW (includes 38 MW of QF and Muni generation)
Contingency: New Atlantic-Placer 115 kV line with Chicago Park unit out of service
Limiting component: Thermal overload on the Drum-Higgins 115 kV line
Drum-Rio Oso Sub-area
Eliminated due to the Rio Oso Transformer Replacement project.
South of Palermo Sub-area
Eliminated due to the South of Palermo 115 kV Reinforcement project.
Slide 24

Critical Sierra Area Contingencies
Pease
Pease Sub-area – Category C
2019 LCR need: 93 MW (includes 70 MW of QF generation)
2024 LCR need: 127 MW (includes 70 MW of QF generation)
Contingency: Palermo-Pease and Pease-Rio Oso 115 kV lines
Limiting component: Thermal overload on the Table Mountain-Pease 60 kV line and low voltage at Pease 115 kV bus
Pease Sub-area – Category B
2019 LCR need: 51 MW (includes 70 MW of QF generation)
2024 LCR need: 82 MW (includes 70 MW of QF generation)
Contingency: Palermo-Pease 115 kV line and YCEC unit
Limiting component: Thermal overload on the Table Mountain-Pease 60 kV line
Slide 25
Critical Sierra Area Contingencies
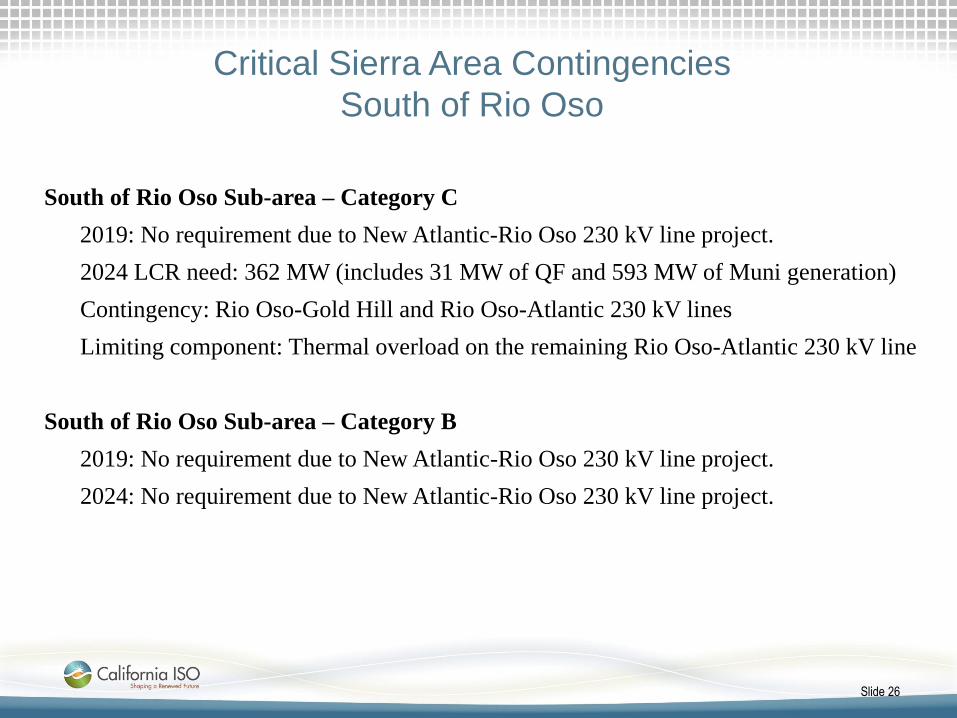
South of Rio Oso
South of Rio Oso Sub-area – Category C
2019: No requirement due to New Atlantic-Rio Oso 230 kV line project.
2024 LCR need: 362 MW (includes 31 MW of QF and 593 MW of Muni generation)
Contingency: Rio Oso-Gold Hill and Rio Oso-Atlantic 230 kV lines
Limiting component: Thermal overload on the remaining Rio Oso-Atlantic 230 kV line
South of Rio Oso Sub-area – Category B
2019: No requirement due to New Atlantic-Rio Oso 230 kV line project.
2024: No requirement due to New Atlantic-Rio Oso 230 kV line project.
Slide 26

Critical Sierra Area Contingencies
South of Table Mountain
South of Table Mountain Sub-area – Category C
2019 LCR need: 1102 MW (includes 192 MW of QF and 1107 MW of Muni generation)
2024 LCR need: 1478 MW (includes 192 MW of QF and 1107 MW of Muni generation)
Contingency: Table Mountain-Rio Oso 230 kV and Table Mountain-Palermo 230 kV DCTL outage
Limiting component: Thermal overload on the Table Mountain-Pease 60 kV line and Caribou-Palermo 115 kV line
South of Table Mountain Sub-area – Category B
2019 LCR need: 525 MW (includes 192 MW of QF and 1107 MW of Muni generation)
2024 LCR need: 907 MW (includes 192 MW of QF and 1107 MW of Muni generation)
Contingency: Table Mountain-Rio Oso 230 kV line and Belden Unit
Limiting component: Thermal overload on the Table Mountain-Palermo 230 kV line
Slide 27
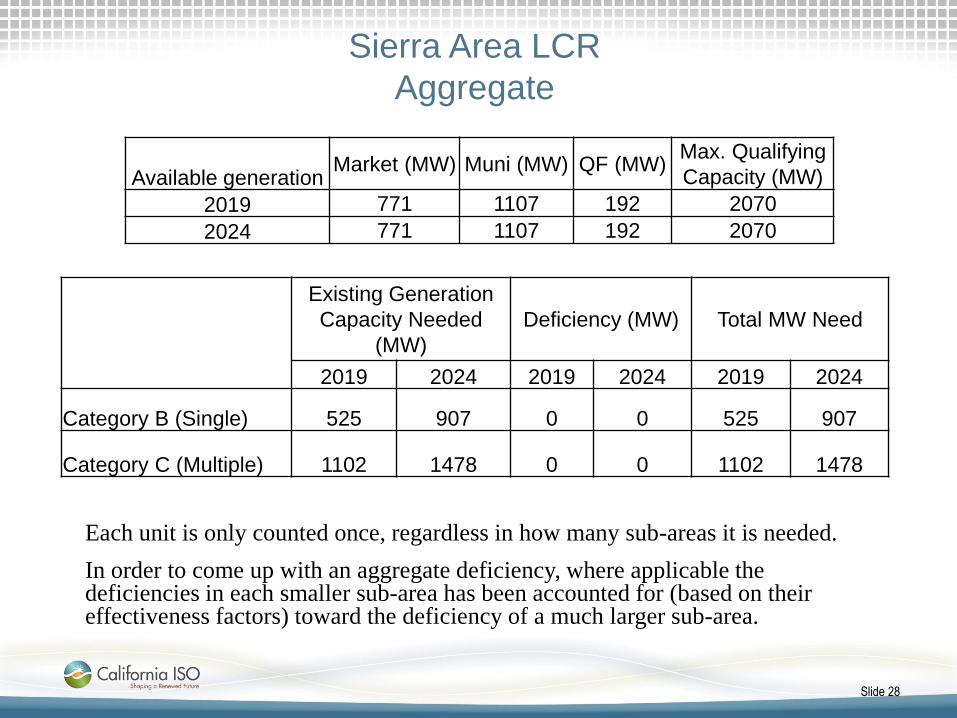
Sierra Area LCR
Aggregate
Each unit is only counted once, regardless in how many sub-areas it is needed.
In order to come up with an aggregate deficiency, where applicable the deficiencies in each smaller sub-area has been accounted for (based on their effectiveness factors) toward the deficiency of a much larger sub-area.
Slide 28
Existing Generation
Capacity Needed
(MW)
Deficiency (MW) Total MW Need
2019 2024 2019 2024 2019 2024
Category B (Single) 525 907 0 0 525 907
Category C (Multiple) 1102 1478 0 0 1102 1478
Available generation Market (MW) Muni (MW) QF (MW)
Max. Qualifying
Capacity (MW)
2019 771 1107 192 2070
2024 771 1107 192 2070
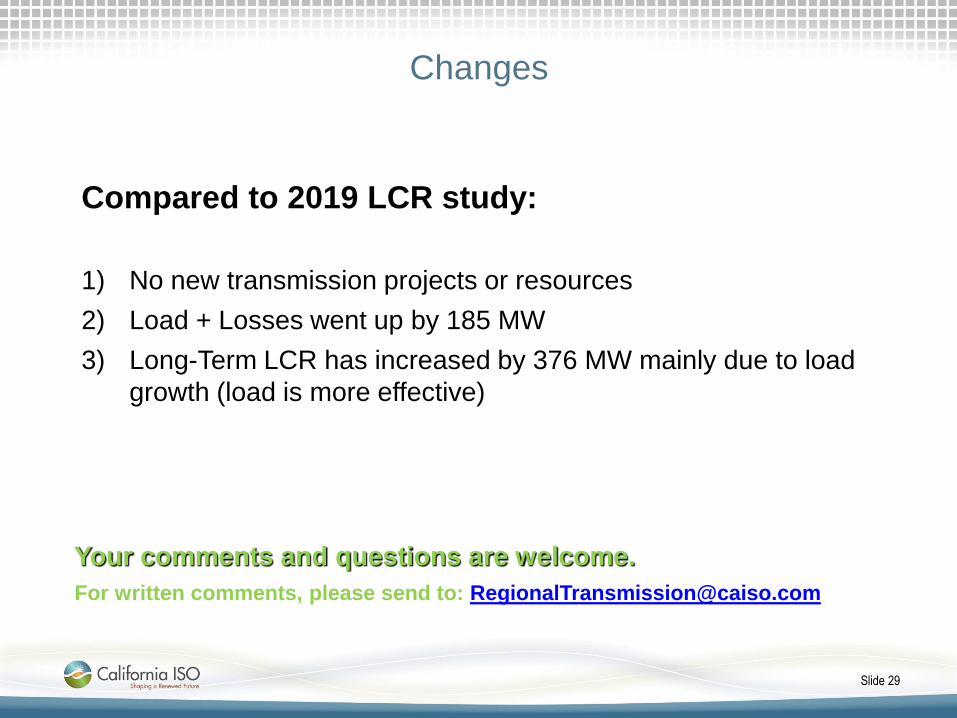
Changes
Slide 29
Your comments and questions are welcome.
For written comments, please send to: [email protected]
Compared to 2019 LCR study:
1) No new transmission projects or resources
2) Load + Losses went up by 185 MW
3) Long-Term LCR has increased by 376 MW mainly due to load
growth (load is more effective)
Stockton Area Load and Resources (MW)
Slide 30
Load = 1118 975
Transmission Losses = 18 17
Total Load = 1136 992
QF Generation = 158 156
Muni Generation = 137 114
Market Generation = 392 392
Total Qualifying Capacity = 687 662
2019 2024

Stockton Area
Slide 31
To Rio Oso
Tesl
a
Stag
g Ei
ght
Mile
Lo
di S
tig
To Gold Hill
Lock
efo
rd
To Brighton
Bellota
Weber
Ellis
Tracy
Kasson
Howland Road
Vie
rra
Safe
way
G
WF
Ow
ens
Illin
ois
Lam
mer
s A
EC
Salado Miller
Ingram Creek
Mo
des
to
Ener
gy
Teic
her
t
Lawrence Lab
Leprino Food
Ripon Co-Gen
Stan
isla
us
PH
Riverbank
Mel
on
es
Tulloch PH
Curtis Fiberboard
Rac
etra
ck
Donnells PH
Manteca
Stockton “A”
To Gold Hill
Lod
i
Ind
ust
rial
Val
ley
Spri
ngs
Country Club
Mosher
Hammer Mettler
Mar
tell
Par
dee
P
H
West Pnt
Elec
tra Pin
e G
rove
Ion
e C
lay
Corral Linden
Mo
rmo
n
East Stockton
Salado
Ban
ta
Gustine Crows Lndg.
Newman
Term
ino
us
New Hope
Seb
asti
ani W
Colony
Vic
tor

New transmission projects modeled:
1. Tesla 115 kV Capacity Increase (2016)
2. Weber 230/60 kV Transformer Nos. 2 and 2A Replacement (2016)
3. Ripon 115 kV New Line Reconfiguration (2016)
4. Stockton 'A' - Weber 60 kV Line Nos. 1 and 2 Reconductor (2017)
5. Mosher Transmission Project (2017)
6. Weber - French Camp 60 kV Line Reconfiguration (2018)
7. West Point - Valley Springs 60 kV Line (Reconductor) (2019)
8. West Point - Valley Springs 60 kV Line Project (Second Line) (2019)
9. Vierra 115 kV Looping (2019)
10. Lockeford - Lodi Area 230 kV Development (2020)
Slide 32

Critical Stockton Area Contingencies
Tesla-Bellota Sub-area
Tesla-Bellota Sub-area – Category C
2019 LCR need: 260 MW (129 MW of QF and 114 MW of Muni generation)
2024 LCR need: 313 MW (129 MW of QF and 114 MW of Muni generation)
Contingency: Tesla-Schulte #2 115 kV lines and Tesla-Vierra.
Limiting component: Thermal overload on the Tesla-Schulte #1 115 kV line.
Tesla-Bellota Sub-area – Category B
2019 LCR Need: 163 MW (129 MW of QF and 114 MW of Muni generation).
2024 LCR Need: 287 MW (129 MW of QF and 114 MW of Muni generation).
Contingency: Tesla-Schulte #2 115 kV line and the loss of GWF Tracy #3.
Limiting component: Thermal overload on the Tesla-Schulte #1 115 kV line.
Slide 33

Critical Stockton Area Contingencies
Stanislaus Sub-area
Stanislaus Sub-area – Category C
2019 LCR need: Same as Category B
2024 LCR need: Same as Category B
Stanislaus Sub-area – Category B
2019 LCR need: 112 MW (includes 19 MW of QF and 94 MW of Muni generation)
2024 LCR need: 133 MW (includes 19 MW of QF and 94 MW of Muni generation)
Contingency: Bellota-Riverbank-Melones 115 kV line and Stanislaus PH
Limiting component: Thermal overload on the River Bank Jct.-Manteca 115 kV line
Slide 34

Critical Stockton Area Contingencies
Weber and Lockeford Sub-areas
Slide 35
Weber Sub-area – Category C
2019 LCR need: 22 MW (includes 0 MW of QF generation)
2024 LCR need: 34 MW (includes 0 MW of QF generation)
Contingency: Stockton A-Weber #1 and #2 60 kV lines
Limiting component: Thermal overload on the Stockton A-Weber #3 60 kV line
Weber Sub-area – Category B
2024 LCR need: No Category B requirement.
Lockeford Sub-area
Eliminated due to the Lockeford-Lodi area 230 kV development project. (2020)
Stockton Area LCR
Aggregate
Each unit is only counted once, regardless in how many sub-areas it is needed.
In order to come up with an aggregate deficiency, where applicable the deficiencies in each smaller sub-area has been accounted for (based on their effectiveness factors) toward the deficiency of a much larger sub-area.
Slide 36
Available generation Market (MW) Muni (MW) QF (MW)
Max. Qualifying
Capacity (MW)
2019 392 137 158 687
2024 392 114 156 662
Existing Generation
Capacity Needed
(MW)
Deficiency (MW) Total MW Need
2019 2024 2019 2024 2019 2024
Category B (Single) 163 287 0 0 163 287
Category C (Multiple) 308 347 43 0 351 347
Changes
Slide 37
Your comments and questions are welcome.
For written comments, please send to: [email protected]
Compared to 2019 LCR study:
1) Lockeford sub-area eliminated due to the Lockeford - Lodi Area
230 kV Development project (2020)
2) Load + Losses went down by 144 MW mainly due to the
elimination of the Lockeford sub-area
3) Long-Term LCR has increased due to load growth and decreased
due to the elimination of deficiency and need in the Lockeford
sub-area resulting in an overall slight decrease of 4 MW

Greater Bay Area Map
Slide 38

Greater Bay Area Transmission System
Slide 39

New transmission projects modeled:
1. Pittsburg - Tesla 230 kV Reconductoring (2016)
2. Pittsburg - Lakewood SPS Project (2016)
3. Monta Vista - Wolfe 115 kV Substation Equipment Upgrade (2016)
4. NRS - Scott No. 1 115 kV Line Reconductor (2016)
5. Almaden 60 kV Shunt Capacitor (2017)
6. Bay Meadows 115 kV Reconductoring (2017)
7. Newark - Ravenswood 230 kV Line (2017)
8. Contra Costa - Moraga 230 kV Line Reconductoring (2017)
9. Moraga Transformer Capacity Increase (2017)
10. Christie 115/60 kV Transformer Addition (2017)
11. Contra Costa Sub 230 kV Switch Replacement (2017)
12. Embarcadero - Potrero 230 kV Transmission Project (2017)
13. Cooley Landing - Los Altos 60 kV Line Reconductor (2017)
14. Moraga - Oakland "J" SPS Project (2017)
15. Cooley Landing 115/60 kV Transformer Capacity Upgrade (2017)
16. Evergreen - Mabury 60 to 115 kV Conversion (2017)
17. Monta Vista - Los Gatos - Evergreen 60 kV Project (2017)
18. Moraga - Castro Valley 230 kV Line Capacity Increase Project (2017)
Slide 40
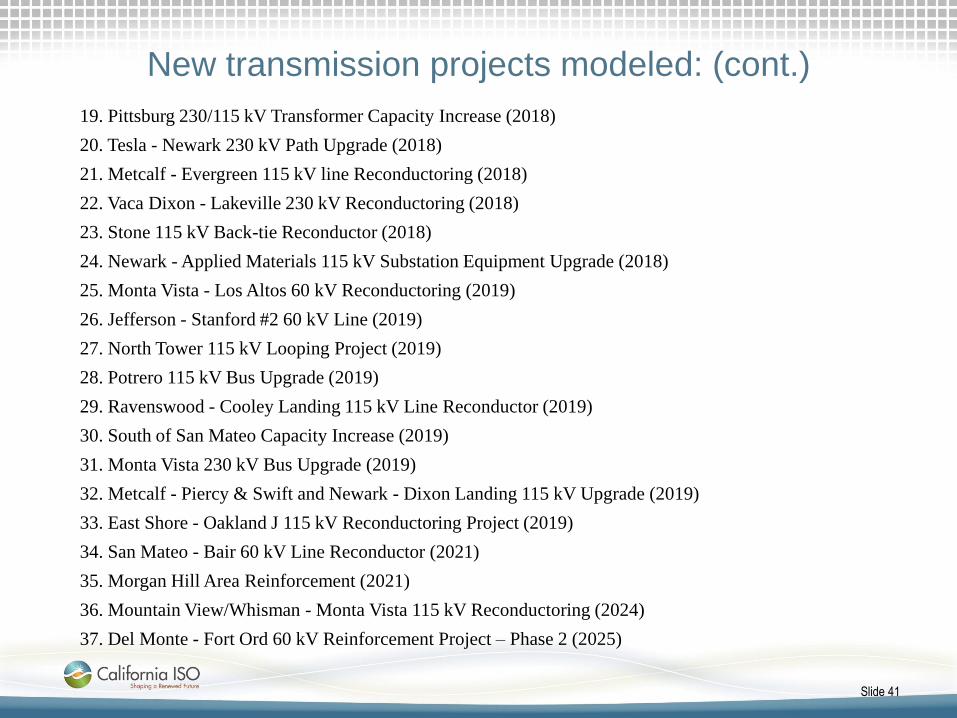
New transmission projects modeled: (cont.)
19. Pittsburg 230/115 kV Transformer Capacity Increase (2018)
20. Tesla - Newark 230 kV Path Upgrade (2018)
21. Metcalf - Evergreen 115 kV line Reconductoring (2018)
22. Vaca Dixon - Lakeville 230 kV Reconductoring (2018)
23. Stone 115 kV Back-tie Reconductor (2018)
24. Newark - Applied Materials 115 kV Substation Equipment Upgrade (2018)
25. Monta Vista - Los Altos 60 kV Reconductoring (2019)
26. Jefferson - Stanford #2 60 kV Line (2019)
27. North Tower 115 kV Looping Project (2019)
28. Potrero 115 kV Bus Upgrade (2019)
29. Ravenswood - Cooley Landing 115 kV Line Reconductor (2019)
30. South of San Mateo Capacity Increase (2019)
31. Monta Vista 230 kV Bus Upgrade (2019)
32. Metcalf - Piercy & Swift and Newark - Dixon Landing 115 kV Upgrade (2019)
33. East Shore - Oakland J 115 kV Reconductoring Project (2019)
34. San Mateo - Bair 60 kV Line Reconductor (2021)
35. Morgan Hill Area Reinforcement (2021)
36. Mountain View/Whisman - Monta Vista 115 kV Reconductoring (2024)
37. Del Monte - Fort Ord 60 kV Reinforcement Project – Phase 2 (2025)
Slide 41

Power plant changes
Additions:
• Oakley
• 3 small wind resources
• DG (2024 only)
Assumed Retirements:
• Moss Landing (OTC)
• Pittsburg (OTC)
• Oakland (non-OTC – 2024 only)
Slide 42

2019 1-in-10 Year Load Representation
Total Load = 9,868 MW
Transmission Losses = 200 MW
Pumps = 262 MW
Total Load + Losses + Pumps = 10,330 MW
2024 1-in-10 Year Load Representation
Total Load = 9,853 MW
Transmission Losses = 194 MW
Pumps = 264 MW
Total Load + Losses + Pumps = 10,311 MW
Greater Bay Area Load
Slide 43

San Jose Sub Area
San Jose Sub-area – Category B Contingency: Metcalf-Evergreen #2 115 kV line with Duane PP out of service
Limiting component: Thermal overload of Metcalf-Evergreen #1 115 kV line
2019 LCR need: 119 MW (includes 263 MW of QF/Muni generation)
2024 LCR need: None
San Jose Sub-area – Category C Contingency: Metcalf El Patio #1 or #2 overlapped with the outage of Metcalf-
Evergreen #2 115 kV line
Limiting component: Thermal overload of Metcalf-Evergreen #1 115 kV line
2019 LCR need: 385 MW (includes 263 MW of QF/Muni generation)
2024 LCR need: 170 MW (includes 263 MW of QF/Muni generation)
Slide 44

Llagas Sub Area
Llagas Sub-area – Category B
Contingency: Metcalf D-Morgan Hill 115 kV with one of the Gilroy peakers off-line
Limiting component: Thermal overload on the Morgan Hill-Llagas 115 kV line as well as
5% voltage drop at the Morgan Hill substation
2019 LCR need: 158 MW (includes 0 MW of QF/Muni generation)
2024 LCR need: None
Llagas Sub-area – Category C
Contingency: Metcalf D-Morgan Hill 115 kV line followed by Spring 230/115 kV bank
Limiting component: Thermal overload on the Morgan Hill-Llagas 115 kV line
2019 LCR need: Same as Category B
2024 LCR need: 23 MW (includes 0 MW of QF/Muni generation)
Slide 45

Oakland Sub Area
Oakland Sub-area – Category B
Contingency: Moraga – Claremont #1 or #2 230 kV line with one Oakland CT off-line
Limiting component: Remaining Moraga – Claremont 230 kV line
2019 LCR need: 141 MW (includes 49 MW of QF/Muni generation)
2024 LCR need: 151 MW (includes 49 MW of QF/Muni generation)
Oakland Sub-area – Category C
Contingency: Overlapping C-X #2 and C-X #3 115 kV cables
Limiting component: Thermal overload on the Moraga – Claremont #1 or #2 230 kV line.
2019 LCR need: 141 MW (includes 49 MW of QF/Muni generation)
2024 LCR need: 155 MW (includes 49 MW of QF/Muni generation)
Oakland power plant continue to be needed.
Slide 46

Pittsburg/Oakland Sub Area
Pittsburg/Oakland and/or Pittsburg sub-area
needs are eliminated due to:
1. Pittsburg - Tesla 230 kV Reconductoring (2016)
2. Contra Costa - Moraga 230 kV Line Reconductoring (2017)
3. Moraga Transformer Capacity Increase (2017)
4. Vaca Dixon - Lakeville 230 kV Reconductoring (2018)
Slide 47

Contra Costa Sub Area
Contra Costa Sub-area – Category B
Contingency: Kelso-Tesla 230 kV line with the Gateway off-line
Limiting component: Thermal overload on the Delta Switching Yard Tesla 230 kV line
2019 LCR need: 1629 MW (includes 264 MW of MUNI pumps and 256 MW of wind
generation)
2024 LCR need: 1509 MW (includes 264 MW of MUNI pumps and 256 MW of wind
generation)
Contra Costa Sub-area – Category C
Same as Category B
Slide 48

Greater Bay Area Overall
Bay Area Overall – Category B
Contingency: Tesla-Metcalf 500 kV line with Delta Energy Center out of service
Limiting component: Reactive margin within the Bay Area
2019 LCR need: 3600 MW (including 485 MW of QF, 519 MW of MUNI and 258 MW of
wind generation)
2024 LCR need: 4133 MW (including 485 MW of QF, 519 MW of MUNI, 120 MW of DG
and 258 MW of wind generation)
Bay Area Overall – Category C
Contingency: overlapping Tesla-Metcalf 500 kV line and Tesla-Newark #1 230 kV line
Limiting component: Thermal overload on the Tesla-Newark #1 or Lone Tree–Cayatano 230 kV lines
2019 LCR need: 4224 MW (including 485 MW of QF, 519 MW of MUNI and 258 MW of
wind generation)
2024 LCR need: Same as Category B
Slide 49

Greater Bay Area
Slide 50
Existing Generation
Capacity Needed
(MW)
Deficiency (MW) Total MW Need
2019 2024 2019 2024 2019 2024
Category B (Single) 3600 4133 0 0 3600 4133
Category C (Multiple) 4224 4133 0 0 4224 4133
Year
QF
(MW)
Muni
(MW)
Wind
(MW)
DG
(MW)
Market
(MW)
Max. Qualifying
Capacity (MW)
2019 485 519 258 0 5589 6851
2024 485 519 258 178 5589 7029
Available Generation
Total LCR need
Changes
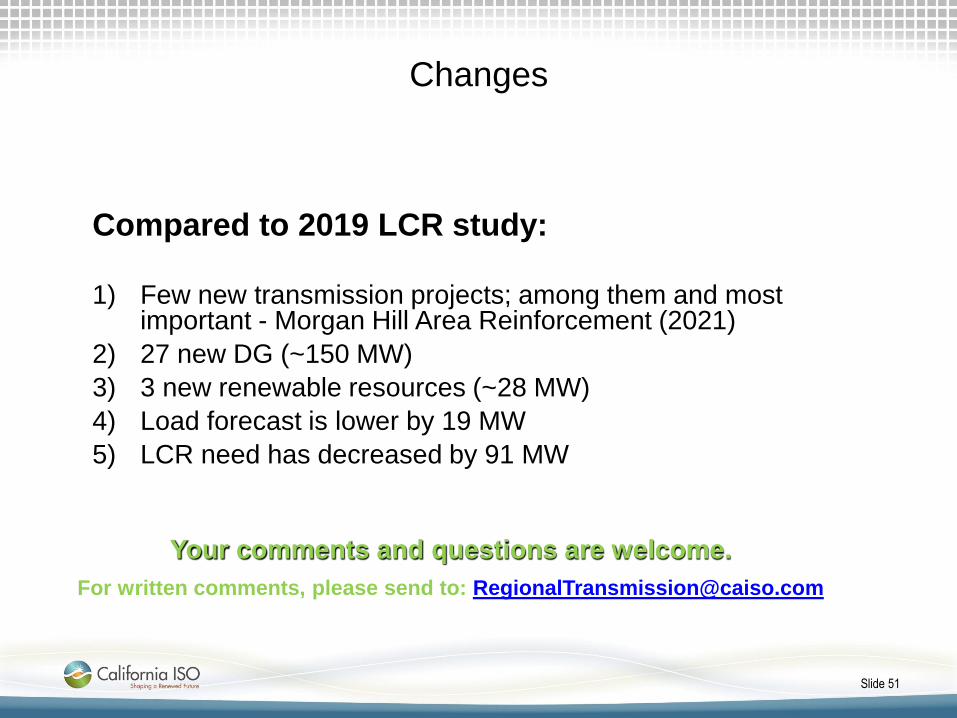
Slide 51
Compared to 2019 LCR study:
1) Few new transmission projects; among them and most important - Morgan Hill Area Reinforcement (2021)
2) 27 new DG (~150 MW)
3) 3 new renewable resources (~28 MW)
4) Load forecast is lower by 19 MW
5) LCR need has decreased by 91 MW
Your comments and questions are welcome.
For written comments, please send to: [email protected]

Fresno and Kern LCR Areas
Kern
Area
Slide 52

Greater Fresno Area
Electrical Boundaries and LCR Sub-Areas
Slide 53
Electrical Boundaries:
● Gates – McCall 230 kV line
● Gates – Gregg 230 kV line (New)
● Gates – Gregg 230 kV line (Old)
● Gates 230/70 kV transformer #5
● Panoche 230/115 kV transformer #1
● Panoche 230/115 kV transformer #2
● Panoche – Kearney 230 kV line
● Panoche – Helm 230 kV line
● Warnerville – Wilson 230 kV line
● Melones – Wilson 230 kV line
● Los Banos 230/70 kV transformer #3
● Los Banos 230/70 kV transformer #4
● San Miguel – Coalinga #1 70 kV line
● Smyrna – Alpaugh – Corcoran 115 kV line
Melones
Wilson
Warnerville
Gregg
Los Banos
Panoche
Gates
Henrietta
McCall
Helms
Helm
Mcmullin
Kearney
Herndon
Kngsbrg
Corcoran
Alpaugh
Gates 70 kVCoalnga
San Miguel
Wilson Sub Area
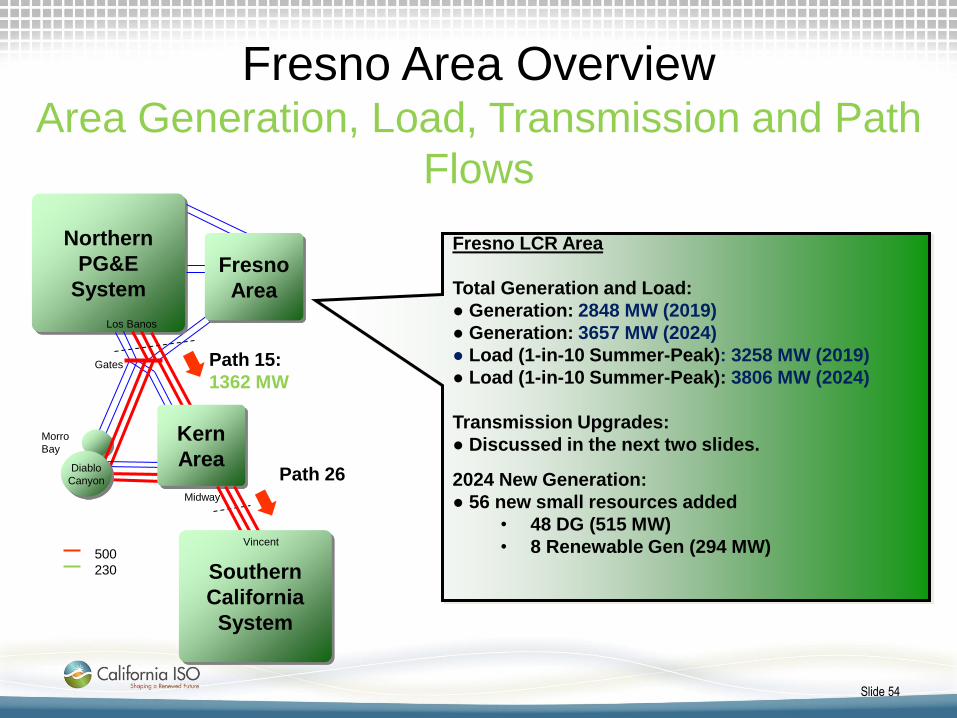
Fresno Area Overview Area Generation, Load, Transmission and Path
Flows
Northern
PG&E
System
Midway
Path 15:
1362 MW
Path 26
Gates
Los Banos
Fresno
Area
Vincent
Fresno LCR Area
Total Generation and Load:
● Generation: 2848 MW (2019)
● Generation: 3657 MW (2024)
● Load (1-in-10 Summer-Peak): 3258 MW (2019)
● Load (1-in-10 Summer-Peak): 3806 MW (2024)
Transmission Upgrades:
● Discussed in the next two slides.
2024 New Generation:
● 56 new small resources added
• 48 DG (515 MW)
• 8 Renewable Gen (294 MW)
500
230
Morro
Bay
Diablo
Canyon
Kern
Area
Southern
California
System
Vincent
Slide 54

New transmission projects modeled:
1. Fresno Reliability (stages: 2014, 2015, 2016, 2016)
2. Shepherd Substation Interconnection (2015)
3. Cressey - Gallo 115 kV Line (2016)
4. Lemoore 70 kV Disconnect Switches Replacement (2016)
5. Kearney 230/70 kV Transformer Addition (2017)
6. Kearney - Caruthers 70 kV Line Reconductor (2017)
7. Caruthers - Kingsburg 70 kV Line Reconductor (2017)
8. Reedley-Dinuba 70 kV Line Reconductor (2017)
9. Reedley-Orosi 70 kV Line Reconductor (2017)
10. Helm - Kerman 70 kV Line Reconductor (2017)
11. Ashlan - Gregg and Ashlan - Herndon 230 kV Line Reconductor (2017)
12. Oakhurst/Coarsegold UVLS (2017)
13. Gregg - Herndon #2 230 kV Line Circuit Breaker Upgrade (2017)
14. Los Banos - Livingston Jct - Canal 70 kV Switch Replacement (2017)
15. Warnerville - Bellota 230 kV Line Reconductoring (2017)
16. Gates No. 2 500/230 kV Transformer (2018)
Slide 55

New transmission projects modeled: (cont.)
17. Series Reactor on Warnerville-Wilson 230 kV Line (2018)
18. Reedley 70 kV Reinforcement (2018)
19. Reedley 115/70 kV Transformer Capacity Increase (2018)
20. Cressey - North Merced 115 kV Line Addition (2018)
21. Kearney - Kerman 70 kV Line Reconductor (2018)
22. Kearney - Herndon 230kV Line Reconductor (2019)
23. McCall - Reedley #2 115 kV Line (2019)
24. Oro Loma - Mendota 115 kV Conversion Project (2019)
25. Wilson 115 kV Area Reinforcement (2019)
26. Borden 230 kV Voltage Support (2019)
27. Northern Fresno 115 kV Area Reinforcement (2020)
28. Kerchhoff PH #2 - Oakhurst 115 kV Line (2020)
29. Oro Loma 70 kV Area Reinforcement (2020)
30. New Gates - Gregg 230 kV Line (2020)
31. Wilson - Le Grand 115 kV line reconductoring (2021)
32. Woodward 115 kV Reinforcement (2024)
Slide 56

Fresno Area LCR
Hanford Sub-Area
Slide 57
Limiting Contingencies:
Category B: None
Category C:
L-2: McCall-Kingsburg #2 115 kV &
Henrietta- GWF 115 kV
Constraint: McCall-Kingsburg # 1 115 kV
LCR Results (MW):
Contingency Cat.
B
Cat. C
2019 LCR 51 96
2024 LCR 0 63
Including:
QF 0 0
Muni 0 0
Deficiency 0 0 Gates
Hanford
McCall
Henrietta
Kingsburg
GWF-Hanford

Reedley
Fresno Area LCR
Reedley Sub-Area
McCall
Sanger
Limiting Contingencies:
Category C:
L-1-1: McCall-Reedley (McCall-Wahtoke)
115 kV & Sanger-Reedley 115kV
Constraint: Kings River-Sanger-Reedley
115 kV
Contingency Cat. C
2019 LCR 54
Including:
QF 10
Muni 0
Deficiency 44
LCR Results (MW):
Slide 58
Wahtoke
Parlier
Kings
River
Reedley
Dinuba
Orosi
Sand
Creek
2024 Sub-area eliminted due to:
McCall-Reedley # 2 115 kV line

Fresno Area LCR
Borden Sub-Area
Slide 59
Limiting Contingencies:
Category B:
T-1: Borden 230/70 kV # 4
Constraint: Borden 230/70 kV # 1
Category C:
L-1T-1: Friant - Coppermine 70 kV
and Borden 230/70 kV # 4
Constraint: Borden 230/70 kV # 1
Contingency Cat. B Cat. C
2024 LCR 63 83
Including:
QF 20 20
Muni - -
Deficiency 4 24
LCR Results (MW): Borden
Borden
Glass
Madera
Wishon
Coppermine
Bonita
Biola Friant
SJ#1
SJ#2
SJ#3
Crane
Valley
To Reedley
Tivy Valley
Fresno Area LCR
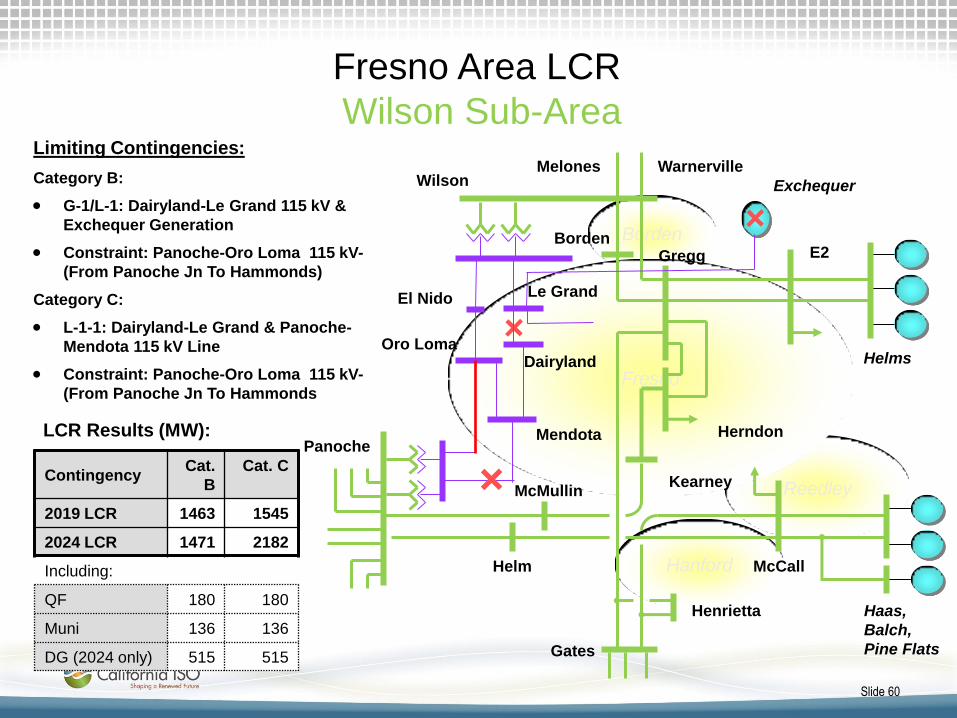
Wilson Sub-Area
Hanford
Borden
Reedley
Fresno
Haas,
Balch,
Pine Flats
Helms
Gregg
McCall
Herndon
Wilson
Panoche
Gates
Kearney McMullin
Helm
Borden
Melones Warnerville
Henrietta
Limiting Contingencies:
Category B:
G-1/L-1: Dairyland-Le Grand 115 kV &
Exchequer Generation
Constraint: Panoche-Oro Loma 115 kV-
(From Panoche Jn To Hammonds)
Category C:
L-1-1: Dairyland-Le Grand & Panoche-
Mendota 115 kV Line
Constraint: Panoche-Oro Loma 115 kV-
(From Panoche Jn To Hammonds
LCR Results (MW):
Slide 60
E2
Oro Loma
El Nido
Mendota
Contingency Cat.
B
Cat. C
2019 LCR 1463 1545
2024 LCR 1471 2182
Including:
QF 180 180
Muni 136 136
DG (2024 only) 515 515
Dairyland
Le Grand
Exchequer

Changes
Compared to 2019 LCR study:
1) Few new transmission projects – including New Gates-Gregg
230 kV line
2) 56 new DG and renewables resources (~809 MWs)
3) One new 70 kV sub-area identified
4) One sub-area eliminated due to new transmission projects
5) Load increased by 548 MW
6) LCR has increased by 637 MW
Slide 61
Your comments and questions are welcome.
For written comments, please send to: [email protected]

Kern LCR Area
Total Generation and Load for 2019:
● Generation (NQC plus new unit): 312 MW
● Load (1-in-10 Summer-Peak): 745 MW
Total Generation and Load for 2024:
● Generation (NQC plus new units): 262 MW
● Load (1-in-10 Summer-Peak): 255 MW
Kern Area Overview
Area Generation, Load and Transmission
Slide 62

New transmission projects modeled:
1. Kern - Old River 70 kV No.2 Reconductoring (2016)
2. San Bernard - Tejon 70 kV Line Reconductor (2017)
3. Kern PP 115 kV Area Reinforcement (2018)
4. Taft - Maricopa 70 kV Line Reconductor (2018)
5. Semitropic - Midway 115 kV Line Reconductor (2018)
6. Taft 115/70 kV Transformer #2 Replacement (2018)
7. Wheeler Ridge Voltage Support (2018)
8. Wheeler Ridge - Weedpatch 70 kV Line Reconductor (2018)
9. Kern PP 230 kV Area Reinforcement (2019)
10. Wheeler Ridge Junction Substation (2021)
Slide 63
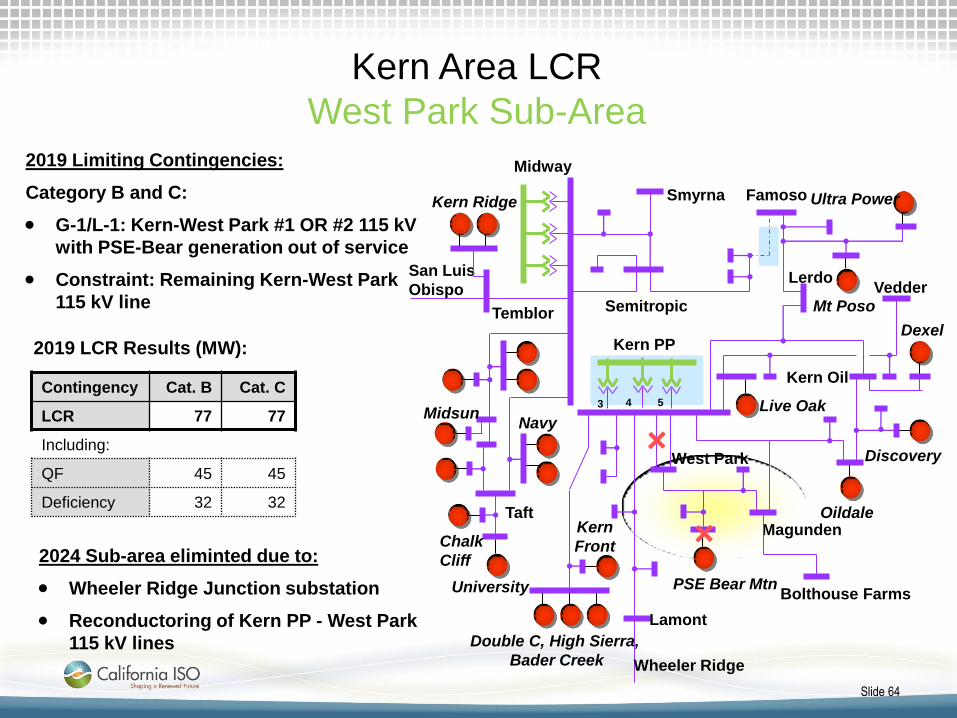
2019 Limiting Contingencies:
Category B and C:
G-1/L-1: Kern-West Park #1 OR #2 115 kV
with PSE-Bear generation out of service
Constraint: Remaining Kern-West Park
115 kV line
Kern PP
Lamont
West Park
Midway
Magunden
Kern Oil
Double C, High Sierra,
Bader Creek
Kern
Front
Oildale
Live Oak
Vedder
PSE Bear Mtn Bolthouse Farms
Discovery
Dexel
Semitropic
Famoso
Lerdo
Smyrna
Wheeler Ridge
Mt Poso
Ultra Power
Temblor
San Luis
Obispo
Taft
University
Navy
Chalk
Cliff
Midsun
Kern Ridge
Kern Area LCR
West Park Sub-Area
Contingency Cat. B Cat. C
LCR 77 77
Including:
QF 45 45
Deficiency 32 32
2019 LCR Results (MW):
Slide 64
3 4 5
2024 Sub-area eliminted due to:
Wheeler Ridge Junction substation
Reconductoring of Kern PP - West Park
115 kV lines

Limiting Contingencies:
Category B:
G-1/L-1: Kern-Magunden-Witco 115 kV
with PSE Live Oak gen. out of service
Constraint: Kern-Live Oak 115 kV line
Category C:
Kern-Magunden-Witco & Kern-7th
Standard 115 kV lines
Constraint: Kern-Live Oak 115 kV line
Kern PP
Lamont
West Park
Midway
Magunden
Kern Oil
Double C, High Sierra,
Bader Creek
Kern
Front
Oildale
Live Oak
Vedder
PSE Bear Mtn Bolthouse Farms
Discovery
Dexel
Semitropic
Famoso
Lerdo
Smyrna
Wheeler Ridge
Mt Poso
Ultra Power
Temblor
San Luis
Obispo
Taft
University
Navy
Chalk
Cliff
Midsun
Kern Ridge
Kern Area LCR
South Kern PP Sub-Area
Contingency Cat.
B
Cat. C
2019 LCR 111 116
2024 LCR 150 154
Including:
QF 179 179
DG (2024 only) 83 83
LCR Results (MW):
Slide 65
3 4 5
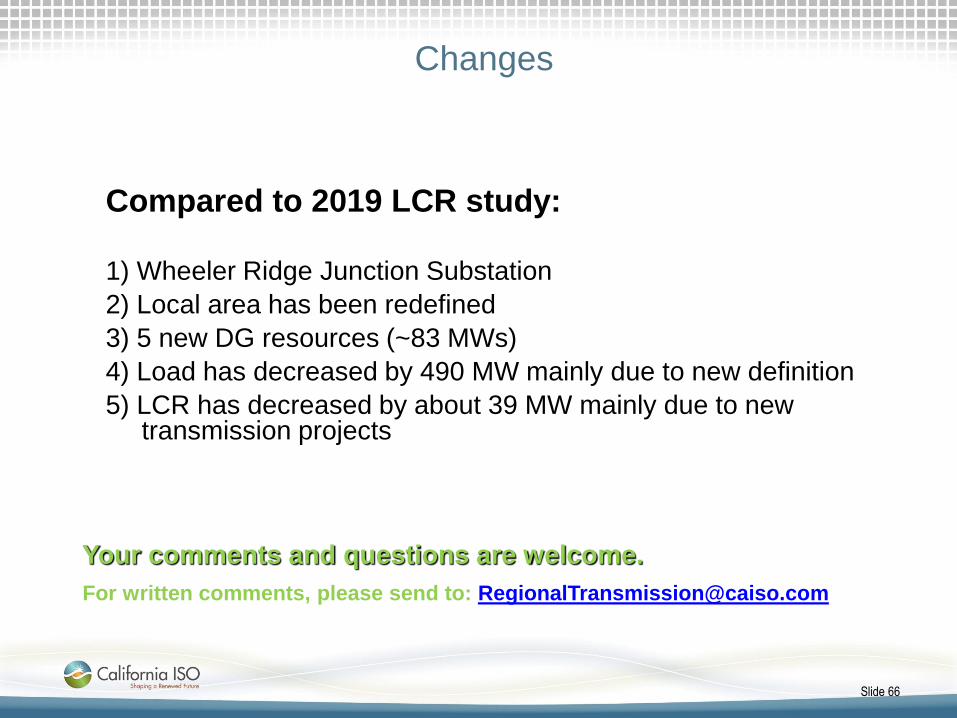
Changes
Compared to 2019 LCR study:
1) Wheeler Ridge Junction Substation
2) Local area has been redefined
3) 5 new DG resources (~83 MWs)
4) Load has decreased by 490 MW mainly due to new definition
5) LCR has decreased by about 39 MW mainly due to new transmission projects
Slide 66
Your comments and questions are welcome.
For written comments, please send to: [email protected]

2024 Long-Term LCR Study Results –
Southern Local Areas
David Le
Senior Advisor - Regional Transmission Engineer
2014-2015 Transmission Planning Process Stakeholder Meeting
November 19 - 20, 2014

Big Creek/Ventura Area
Page 2

Big Creek/Ventura Area*
Demand Assumptions**
Year
Load
(MW)
AAEE
(MW)
Pump Load
(MW)
Transmission
Losses
(MW)
Total
(MW)
2024 3,914 -236 361 72 4,111
Slide 3
Notes:
* Geographic area (i.e., excluding Saugus substation load); AAEE forecast
(bus-by-bus) provided by the California Energy Commission
** Does not include EE from LTPP process; this information, as well as
other preferred resources, will be provided further in the draft ISO
Transmission Plan
Critical Area Contingencies
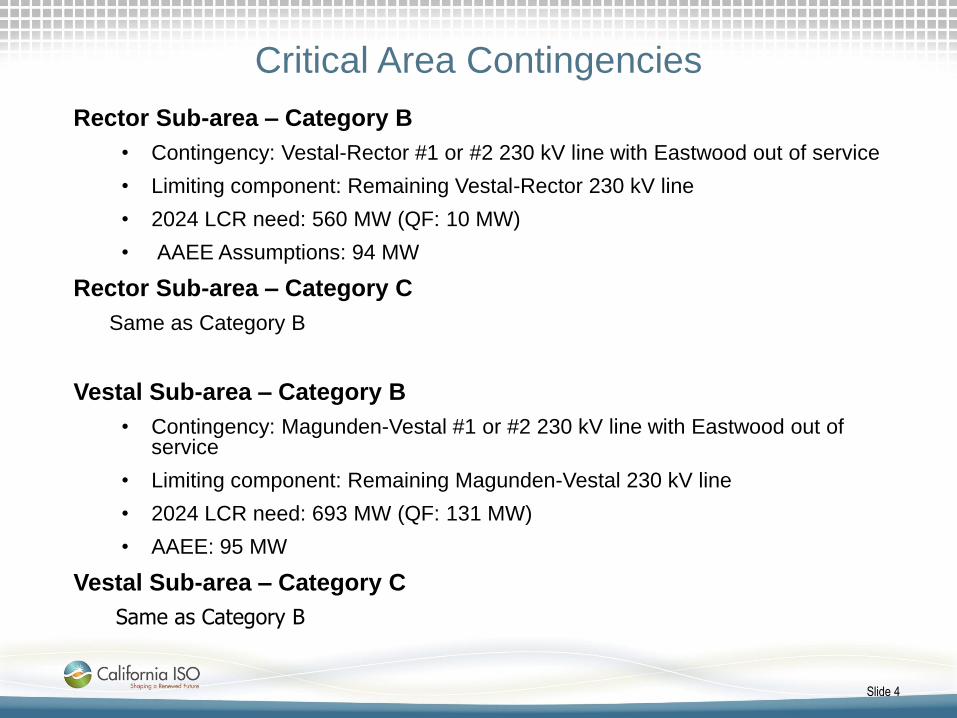
Rector Sub-area – Category B
• Contingency: Vestal-Rector #1 or #2 230 kV line with Eastwood out of service
• Limiting component: Remaining Vestal-Rector 230 kV line
• 2024 LCR need: 560 MW (QF: 10 MW)
• AAEE Assumptions: 94 MW
Rector Sub-area – Category C
Same as Category B
Vestal Sub-area – Category B
• Contingency: Magunden-Vestal #1 or #2 230 kV line with Eastwood out of service
• Limiting component: Remaining Magunden-Vestal 230 kV line
• 2024 LCR need: 693 MW (QF: 131 MW)
• AAEE: 95 MW
Vestal Sub-area – Category C
Same as Category B
Slide 4
Critical Area Contingencies
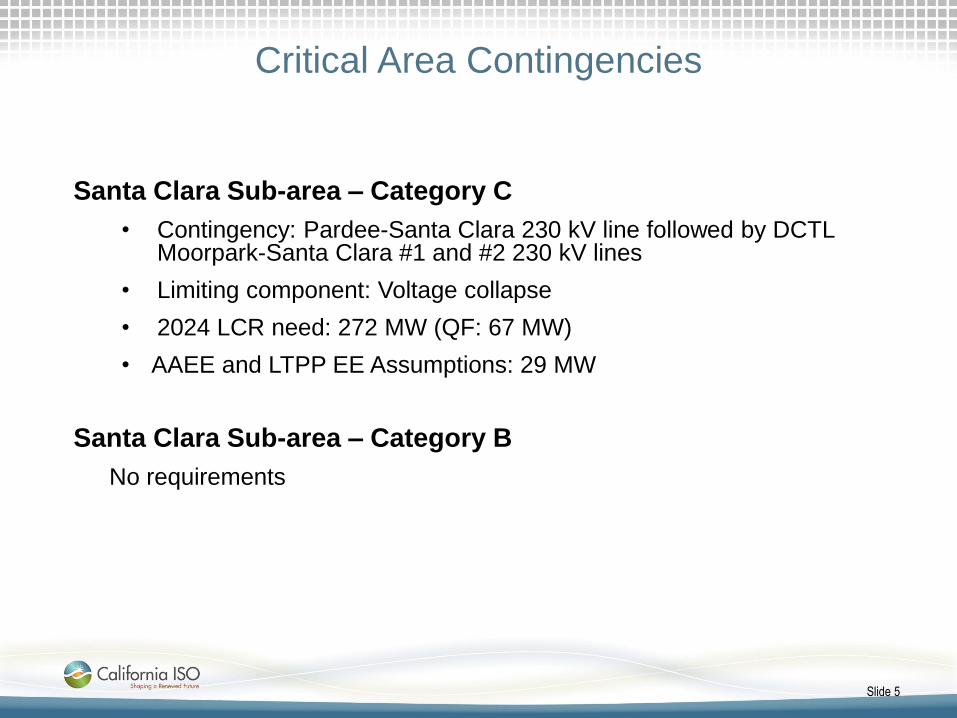
Santa Clara Sub-area – Category C
• Contingency: Pardee-Santa Clara 230 kV line followed by DCTL Moorpark-Santa Clara #1 and #2 230 kV lines
• Limiting component: Voltage collapse
• 2024 LCR need: 272 MW (QF: 67 MW)
• AAEE and LTPP EE Assumptions: 29 MW
Santa Clara Sub-area – Category B
No requirements
Slide 5
Critical Area Contingencies
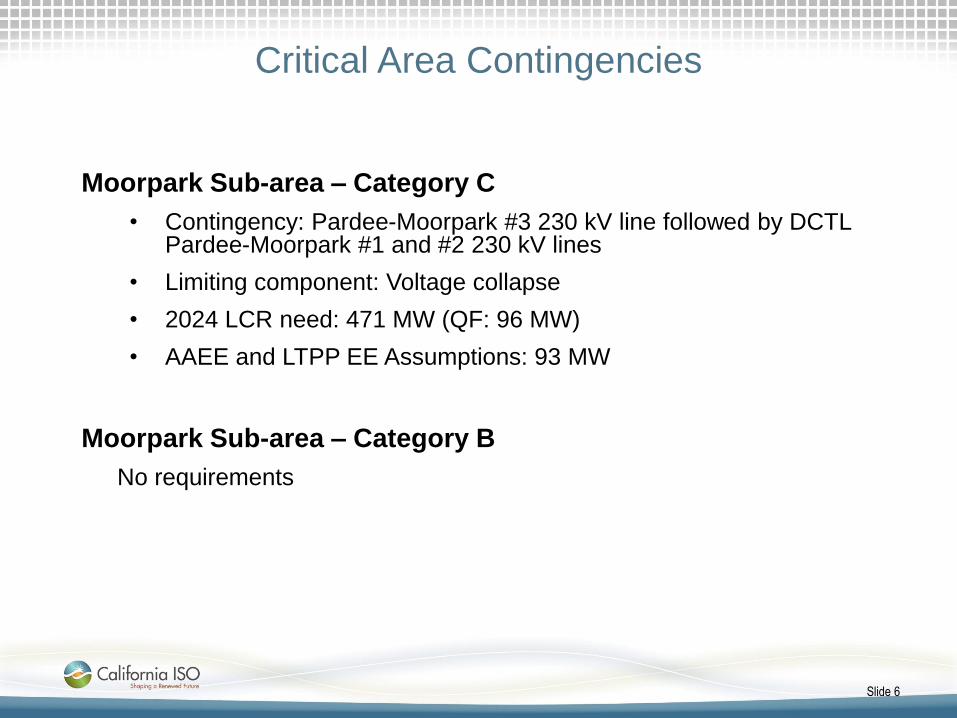
Moorpark Sub-area – Category C
• Contingency: Pardee-Moorpark #3 230 kV line followed by DCTL Pardee-Moorpark #1 and #2 230 kV lines
• Limiting component: Voltage collapse
• 2024 LCR need: 471 MW (QF: 96 MW)
• AAEE and LTPP EE Assumptions: 93 MW
Moorpark Sub-area – Category B
No requirements
Slide 6

Critical Area Contingencies
Big Creek/Ventura Overall – Category C
• Contingency: Sylmar-Pardee #1 or #2 230 kV line followed by Lugo-Victorville 500 kV or vice versa
• Limiting component: Remaining Sylmar-Pardee 230 kV line
• 2024 LCR need: 2,783 MW (includes 791 MW QF)
• AAEE and LTPP EE assumptions: 311 MW
Big Creek/Ventura Overall – Category B
• Contingency: Sylmar-Pardee #1 or #2 230 kV line with Pastoria power plant (CCGT) out of service
• Limiting component: Remaining Sylmar-Pardee 230 kV line
• 2024 LCR need: 2,603 MW (includes 791 MW QF)
• AAEE and LTPP EE assumptions: 311 MW
Slide 7

Conclusions
• No resource deficiency identified for the Big Creek/Ventura LCR and its sub-areas
• It is critical to have AAEE and LTPP Track 1 resources implemented for the local area to meet the reliability need for the Big Creek/Ventura LCR and sub-LCR areas
Slide 8
Page 9
Combined LA Basin/San Diego
Area and LA Basin-San Diego-
Imperial Valley Area
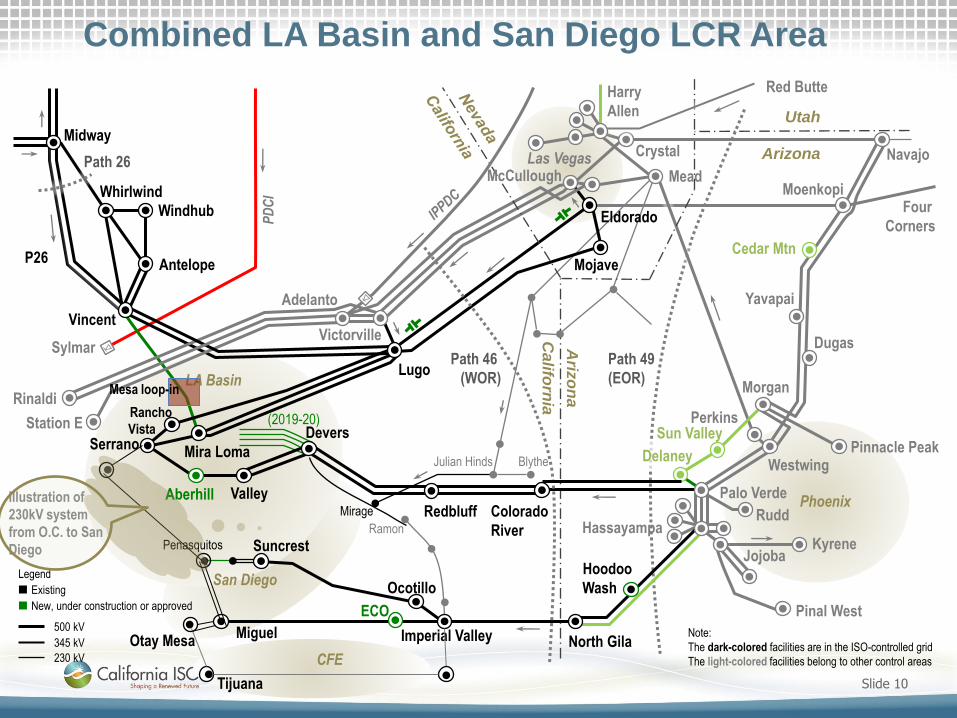
Combined LA Basin and San Diego LCR Area
Slide 10
Delaney
Devers
Midway
Vincent
Lugo
Palo Verde
Hassayampa
North Gila Imperial Valley Miguel
Suncrest
Valley
Serrano
Navajo Crystal
Mead Moenkopi
Mojave
Victorville
Adelanto
Westwing
Aberhill
Windhub
Califo
rnia
Ariz
on
a
Redbluff
Rinaldi
Station E
Whirlwind
Antelope
Mira Loma
Rancho
Vista
Jojoba Kyrene
Path 26
Path 49
(EOR)
Colorado
River
Pinnacle Peak
Phoenix
Las Vegas
San Diego
LA Basin
Perkins Sun Valley
Morgan
Rudd
Four
Corners
Hoodoo
Wash Ocotillo
ECO
Sylmar
Eldorado
Existing
Legend
New, under construction or approved
Mirage
Julian Hinds
Ramon
Blythe
500 kV
345 kV Note:
The dark-colored facilities are in the ISO-controlled grid
The light-colored facilities belong to other control areas
Cedar Mtn
Yavapai
Dugas
Penasquitos
McCullough
Harry
Allen
Red Butte
230 kV
Path 46
(WOR)
Arizona
Utah
Pinal West
P26 P
DC
I
(2019-20)
Tijuana
Otay Mesa
CFE
Illustration of
230kV system
from O.C. to San
Diego
Mesa loop-in

Combined LA Basin & San Diego Area Loads
(2024 study case)
Slide 11
Demand Assumptions*
AreaLoad
(MW)
AAEE
(MW)
Pump
Load
(MW)
Transmission
Losses
(MW)
Total Net
Load
(MW)
San Diego 5,682 -338 0 169 5,513
LA Basin 22,721 -1,147 30 550 22,154
Total 28,403 -1,485 30 719 27,667
Notes:
* Additional Achievable Energy Efficiency (AAEE) forecast (bus-by-bus)
provided by the California Energy Commission; SCE and SDG&E provided
forecast loads at each bus (i.e., substation)

Comparison of Load Forecast in the 2013-2014
Transmission Planning Process (2023 study case)
Slide 12
AreaLoad
(MW)
AAEE
(MW)
Pump
Load
(MW)
Transmission
Losses
(MW)
Total Net
Load
(MW)
San Diego 5,980 -197 0 192 5,975
LA Basin 22,563 -786 0 430 22,207
Total 28,543 -983 0 622 28,182
Notes:
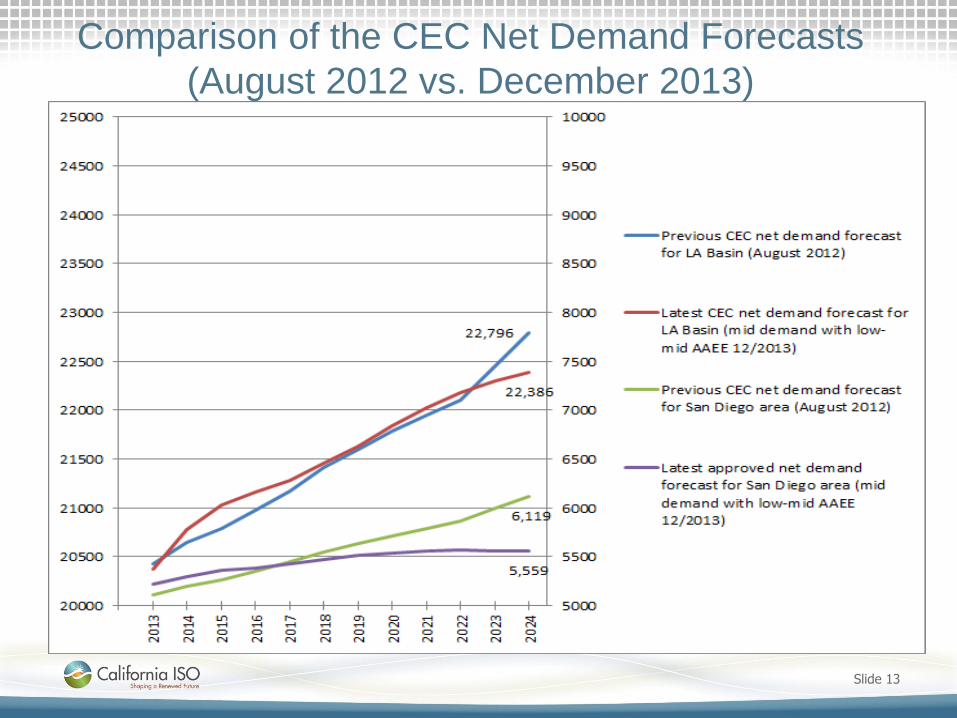
Comparing with 2023 study case in the last planning cycle (2013-2014
TPP), the net loads for both San Diego and LA Basin are 515 MW less,
mainly due to increase in the AAEE forecast.
Slide 13
Comparison of the CEC Net Demand Forecasts
(August 2012 vs. December 2013)

Transmission Upgrades Modeled
Slide 14
1. East County 500kV Substation (ECO)
2. Mesa Loop-In Project and South of Mesa 230kV line upgrades
(SCE’s service area)
3. Imperial Valley Phase Shifting Transformers (2x400 MVA)
4. Delany – Colorado River 500kV Line (Arizona – SCE Intertie)
5. Hassayampa – North Gila #2 500kV Line (APS)
6. Bay Blvd. Substation Project
7. Sycamore – Penasquitos 230kV Line
8. Talega Synchronous Condensers (2x225 MVAR)
9. San Luis Rey Synchronous Condensers (2x225 MVAR)
10. SONGS Synchronous Condenser (225 MVAR)
11. Santiago Synchronous Condenser (225 MVAR) (SCE service area)
12. Miguel-Otay Mesa-South Bay-Sycamore 230 kV re-configuration
13. Artesian 230/69 kV Substation and loop-in project
14. Imperial Valley – Dixieland 230 kV tie with IID
15. Bypass series capacitors on the Imperial Valley-N.Gila, ECO-
Miguel, and Ocotillo-Suncrest 500kV lines
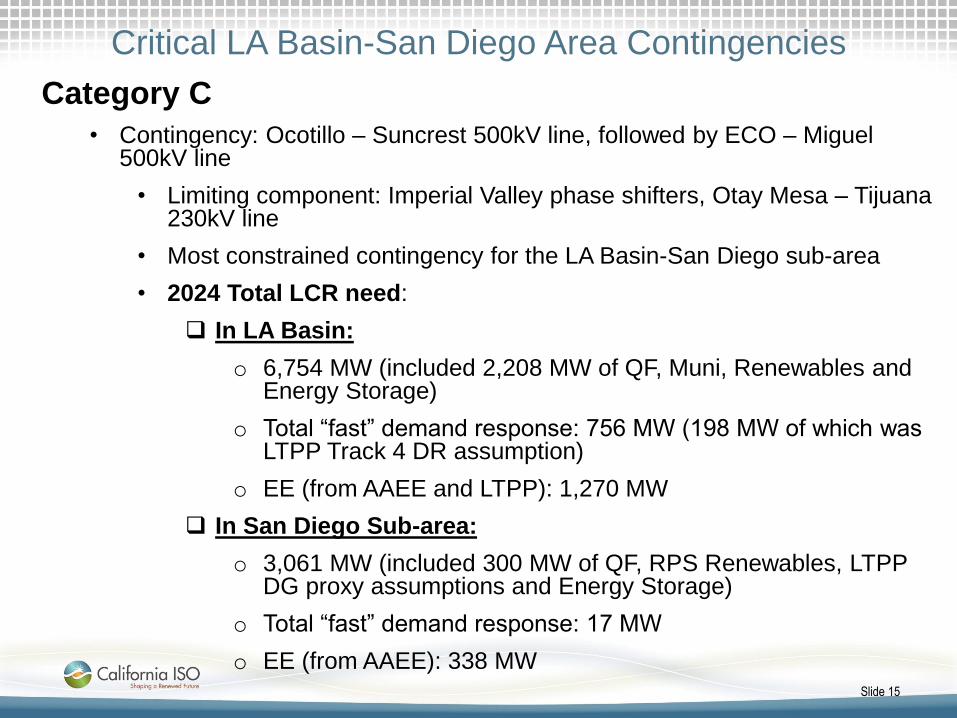
Critical LA Basin-San Diego Area Contingencies
Slide 15
Category C
• Contingency: Ocotillo – Suncrest 500kV line, followed by ECO – Miguel 500kV line
• Limiting component: Imperial Valley phase shifters, Otay Mesa – Tijuana 230kV line
• Most constrained contingency for the LA Basin-San Diego sub-area
• 2024 Total LCR need:
In LA Basin:
o 6,754 MW (included 2,208 MW of QF, Muni, Renewables and Energy Storage)
o Total “fast” demand response: 756 MW (198 MW of which was LTPP Track 4 DR assumption)
o EE (from AAEE and LTPP): 1,270 MW
In San Diego Sub-area:
o 3,061 MW (included 300 MW of QF, RPS Renewables, LTPP DG proxy assumptions and Energy Storage)
o Total “fast” demand response: 17 MW
o EE (from AAEE): 338 MW

Critical Contingencies (cont’d)
Page 16
Category C (cont’d)
• If full LTPP Track 1 and 4 authorizations are procured, there would be no deficiency
• Potential deficiency up to 500 MW, if there are:
o Less LA Basin LTPP procurement implementation (i.e., 608 MW less), and
o Less existing demand response implementation (i.e., 198 MW which are LTPP Track 4 assumptions)
• If full amount of existing “fast” DR is implementable (862 MW) for both the LA Basin and San Diego areas, then no deficiency was identified
• Loads are about 515 MW less for both the LA Basin and San Diego areas when compared to the 2023 study case in the last planning cycle (2013-2014 TPP).

Page 17
Critical Contingencies (cont’d) Category C
• Contingency: ECO-Miguel 500kV line, followed by the Ocotillo – Suncrest 500kV line
• Second most constrained contingency for the LA Basin-San Diego sub-area
• Limiting component: Voltage instability
• 2024 Total LCR need:
In LA Basin:
o 6,754 MW (included 2,208 MW of QF, Muni, Renewables and Energy Storage)
o Total “fast” demand response: 181 MW
o EE (from AAEE and LTPP): 1,270 MW
In San Diego Sub-area:
o 2,691 MW (included 300 MW of QF, RPS Renewables, LTPP DG proxy assumptions and Energy Storage)
o Total “fast” demand response: 17 MW
o EE (from AAEE): 338 MW
• No deficiency

Page 18
LA Basin-San Diego-Imperial Valley Area Critical
Contingency Category B & C
• Contingency: G-1 Otay Mesa power plant, followed by Imperial Valley - N.Gila 500kV line
• Limiting component: Voltage instability
• 2024 Total LCR need:
In LA Basin:
o 6,754 MW (included 2,208 MW of QF, Muni, Renewables and Energy Storage)
o Total “fast” demand response utilized: 181 MW
o EE (from AAEE and LTPP): 1,270 MW
In San Diego-Imperial Valley area:
o 4,046 MW (included 708 MW (NQC) of QF, RPS Renewables, LTPP DG proxy assumptions and Energy Storage)
o Total “fast” demand response utilized: 17 MW
o EE (from AAEE): 338 MW
• No deficiency

Conclusions
• In summary
Page 19
LTPP Procurement, DR and AAEE Scenarios Results
1. If authorized LTPP Tracks 1 and 4 resources are
procured fully (with Track 4 DR assumptions)
Then there is no
deficiency
2. If LTPP Tracks 1 and 4 are not fully procured (i.e.,
608 MW less than authorized amount for the LA
Basin), OR
3. If AEE level does not materialize as forecast
(again with Track 4 DR assumptions)
Then there
would be
resource
deficiency
4. If LTPP Tracks 1 and 4 are not fully procured, or
AAEE fails to materialize at forecast levels, but
existing DR can be successfully “repurposed”
with adequate operational characteristics to
satisfactorily be implemented for use by the ISO
to meet contingency conditions
Then it is
anticipated that
there would be
no resource
deficiency

Slide 20
Conclusions (cont’d)
• DR needs to be “fast” product with response time within 20 minutes to allow Operator adequate response time.
• The LCR need for the San Diego sub-area continues to be caused by the overlapping Category C (N-1-1) contingency by 500kV lines in southeastern San Diego area.
• The LCR need for the San Diego – Imperial Valley LCR area continues to be caused by the overlapping Category B (G-1/N-1) or C (i.e., N-1, followed by G-1) contingency for the major 500kV line east of Imperial Valley Substation
• With lower CEC demand forecast (due to larger AAEE projection for the LA Basin and San Diego areas), the primary constraints are the thermal constraints on the transmission facilities between SDG&E and CFE system (i.e., Imperial Valley phase-shifting transformers and the Otay Mesa – Tijuana 230kV line) under overlapping N-1-1 contingency
• The voltage instability concern is the next constraint. This transmission constraint may become the primary reliability constraint for the LA Basin/San Diego areas under higher load conditions beyond the 2024 time frame.

Page 21
Conclusions (cont’d)
• Series capacitors on the southern 500kV lines are bypassed
normally to prevent thermal loading concerns under summer
peak load conditions
• Further Special Protection System (SPS) require further
considerations and implementations in the ISO transmission
planning process to mitigate loading concerns for the Miguel
transformers and Sycamore-Suncrest 230kV lines under
overlapping contingency conditions
• Locational effectiveness factors for major contingencies will be
provided in the draft ISO Transmission Plan

Additional consideration is being given to potential
transmission reinforcement on a contingency basis:
• Forecast assumptions and approved transmission and resource procurement result in no deficiency
• Consideration must be given to the risk of unrealized forecast assumptions (AAEE and repurposing of DR) as well as lower than authorized procurement.
• Additional analysis has been performed on new proposals such as IID-proposed STEP Hoober – SONGS HVDC Inter-tie project. Other new proposals such as Midway-Devers 500kV line and Alberhill-Talega HVDC will also be evaluated and the results will be included in the draft ISO 2014-2015 Transmission Plan.
• Additional analysis including the CFE-ISO Intertie will be performed as the needs arise.
• This will supplement technical results developed in the 2013-2014 transmission planning cycle for other previously identified alternatives or electrically similar projects (such as TE-VS, HVDC submarine cable, Valley-Inland 500kV AC or DC line, Imperial Valley – Inland 500kV AC or DC line)
Page 22

Page 23
LA Basin Area and Sub-Areas

Critical Area Contingencies
El Nido Sub-area – Category C
• Contingency: Hinson-La Fresa 230 kV line out followed by Double Circuit Tower Line Redondo-La Fresa #1 and #2 230 kV lines
• Limiting component: Voltage collapse
• 2024 LCR need: 110 MW (included 50 MW of QF and Muni generation )
• AAEE and LTPP EE assumptions: 95 MW
• Mesa Loop-In Project helps reducing LCR need in this sub-area
El Nido Sub-area – Category B
No requirements
Slide 24

Critical Area Contingencies
West of Devers Sub-area – Category C
• Previous critical contingency: San Bernardino-Etiwanda 230 kV line out followed by San Bernardino-Vista 230 kV line or vice versa
• Previous reliability concern: voltage collapse
• 2024 LCR need: 0 MW (No requirements)
• Mesa Loop-in Project helps eliminating this reliability concern
West of Devers Sub-area – Category B
No requirements
Slide 25

Critical Area Contingencies
Valley-Devers Sub-area – Category B & C
• Mesa Loop-in Project and Delany-Colorado River 500kV Line Project help eliminate this reliability concern
LA Basin Area – Category C
• Contingency: Alberhill-Serrano 500kV line, followed by an N-2 of Red Bluff-Devers 500kV lines #1 & 2
• Limiting component: voltage instability
• 2024 LCR need:
o 5,000 - 5,485 MW (included 2,208 MW of QF, Muni, Renewables and Energy Storage)
2,226 MW of this need is located in the Eastern LA Basin area
The lower value (5,000 MW) is associated with the use of Valley Direct Load Trip RAS (VDLT RAS) if this
o AAEE and LTPP EE: 1,203 MW
o Total utilized existing and new (LTPP) “fast” demand response: 273 MW
Slide 26

Critical Area Contingencies
Western LA Basin Sub-area – Category C • Contingency: Mesa – Lighthipe 230 kV, followed by Mesa – Redondo 230
kV line • Limiting component: Mesa – Laguna Bell #1 230 kV line • 2024 LCR need (the total need is the sum of individual items listed below):
• Western LA Basin sub-area: 3,778 MW (included conventional generation, solar DG PV, and energy storage)
• Eastern (Valley) sub-area: 485 MW – Western LA Basin is expanded to include resources in the Valley sub-area to meet its reliability need
• AAEE and LTPP EE: 866 MW • Total utilized existing and new (LTPP) “fast” demand response: 273
MW
Western LA Basin Sub-area – Category B Non binding – multiple combinations possible
Slide 27

Conclusions
• No resource deficiencies as long as AAEE, LTPP Tracks 1 and 4 resources, and ISO Board-approved transmission projects are implemented.
• However, if less resources are to be procured, there could be deficiency for the combined LA Basin / San Diego area in the scenario where the existing “fast” demand response is not adequately implemented or procured.
• DR needs to be “fast” product with response time within 20 minutes to allow Operator adequate response time.
• The Mesa Loop-In Project eliminates the LCR need for some sub-areas in the Eastern LA Basin and helps reduce the LCR need in the El Nido sub-area
• Addition of the Mesa Loop-in Project, as well as reduction of conventional resources in the Western LA Basin necessitates the expansion of the Western LA Basin sub-area to include the Valley sub-area to provide resources to meet its local reliability need
• The LCR need for the larger LA Basin area continues to be driven by the overlapping Category B (G-1/N-1) or Category C (N-1-1) contingency in southern San Diego area
Slide 28

Page 29
San Diego Sub-Areas and
San Diego/Imperial Valley Area
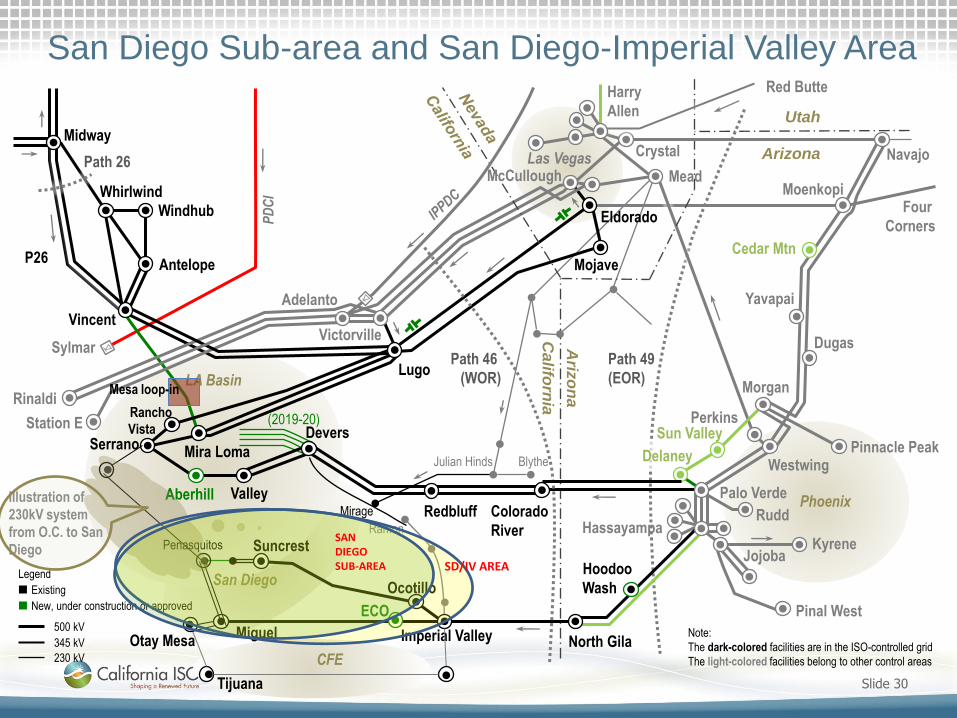
Slide 30
San Diego Sub-area and San Diego-Imperial Valley Area
Delaney
Devers
Midway
Vincent
Lugo
Palo Verde
Hassayampa
North Gila Imperial Valley Miguel
Suncrest
Valley
Serrano
Navajo Crystal
Mead Moenkopi
Mojave
Victorville
Adelanto
Westwing
Aberhill
Windhub
Califo
rnia
Ariz
on
a
Redbluff
Rinaldi
Station E
Whirlwind
Antelope
Mira Loma
Rancho
Vista
Jojoba Kyrene
Path 26
Path 49
(EOR)
Colorado
River
Pinnacle Peak
Phoenix
Las Vegas
San Diego
LA Basin
Perkins Sun Valley
Morgan
Rudd
Four
Corners
Hoodoo
Wash Ocotillo
ECO
Sylmar
Eldorado
Existing
Legend
New, under construction or approved
Mirage
Julian Hinds
Ramon
Blythe
500 kV
345 kV Note:
The dark-colored facilities are in the ISO-controlled grid
The light-colored facilities belong to other control areas
Cedar Mtn
Yavapai
Dugas
Penasquitos
McCullough
Harry
Allen
Red Butte
230 kV
Path 46
(WOR)
Arizona
Utah
Pinal West
P26 P
DC
I
(2019-20)
Tijuana
Otay Mesa
CFE
Illustration of
230kV system
from O.C. to San
Diego
Mesa loop-in
SAN DIEGO SUB-AREA SD/IV AREA
Areas and sub-areas studied
• El Cajon sub-area
• Mission sub-area
• Bernardo sub-area
• Esco sub-area
• Pala sub-area
• Miramar sub-area
• Border sub-area
• San Diego sub-area
• San Diego-Imperial Valley area
Page 31

El Cajon Sub-area Critical Contingency
Category C:
• Contingency: loss of El Cajon-Jamacha 69 kV (TL624) followed by loss of
Miguel–Granite–Los Coches 69 kV (TL632) or vice versa
• Limiting component: Garfield-Murray 69 kV (TL631) overloaded
• 2024 LCR need: 8 MW (included 0 MW of QF generation )
• AAEE assumptions: 17 MW
Category B: No requirements
Slide 32

Page 33
Mission Sub-area Critical Contingency
Category C:
• Contingency: Loss of Mission-Kearny 69 kV (TL663) followed by the loss
of Mission-Mesa Heights 69kV (TL676)
• Limiting component: Kearny-Clairmont Tap 69kV line (TL670) and
Clairmont-Clairmont Tap 69 kV and Clairmont Tap – Rose Canyon 69kV
line sections’ overloading concerns
• 2024 LCR: 51 MW (includes 4 MW of QF and 47 MW of deficiency –
this could potentially be evaluated for potential future energy storage or
transmission upgrades in the future)
• AAEE assumptions: 11 MW
• Existing local subtransmission reliability concerns were identified in
previous LCR studies. This reliability concern is not related to either
SONGS or Encina power plant (OTC) retirement.
Category B: No requirements

Bernardo Sub-area Critical Contingency
Category C: • Contingency: Loss of Artesian-Sycamore 69 kV (TL6920) followed
by loss of Poway-Rancho Carmel 69 kV (TL648)
• Limiting component: Felicita Tap-Bernardo 69 kV (TL689) overloaded
• 2024 LCR: 0 MW due to the Artesian 230 kV substation upgrades
• AAEE assumptions: 10 MW
Category B: No requirements
Slide 34

Esco Sub-area Critical Contingency
Category C:
• Contingency: loss of Pomerado-Poway 69 kV (TL6913), followed by the loss of Bernardo-Rancho Carmel 69kV (TL633) line
• Limiting component: overloading concern on Esco-Escondido-Warren Canyon Tap-Poway 69kV line
• 2024 LCR: 75 MW (included 38 MW of QF generation and 47 MW of deficiency) after completion of the Bernardo-Rancho Carmel 69kV upgrade
• AAEE assumptions: 8 MW
• This is an existing reliability concern which was identified in previous LCR studies. The deficiency is not related to SONGS and OTC retirement.
• This deficiency would be mitigated by a second Pomerado-Poway 69kV line project. This project is being presented to ISO Management for consideration and approval.
Category B:
No requirements
Slide 35

Pala Sub-area Critical Contingency
Category C: • Contingency: loss of Pendleton-San Luis Rey 69 kV line
(TL6912) followed by loss of Lilac-Pala 69kV (TL6908)
• Limiting component: Melrose-Morro Hill Tap 69kV (TL694) overloaded
• 2024 LCR: 37 MW (includes 0 MW of QF generation)
• AAEE assumptions: 6 MW
Category B: No requirements
Slide 36

Border Sub-area Critical Contingency
Category C: • Contingency: loss of Bay Boulevard-Otay 69 kV #1 (TL645)
followed by loss of Bay Boulevard-Otay 69 kV #2 (TL646)
• Limiting component: Imperial Beach-Bay Boulevard 69 kV (TL647) overloaded
• 2024 LCR: 41 MW (includes 5 MW of QF generation)
• AAEE assumptions: 10 MW
Category B: No requirements
Slide 37

Miramar Sub-area Critical Contingencies
Category C:
• Contingency: loss of Miguel-Bay Blvd. 230 kV (TL23042A), followed by the loss Sycamore-Penasquitos 230 kV line
• Limiting component: Sycamore-Scripps 69kV line
• 2024 LCR: 80 MW (includes 0 MW of QF)
• AAEE assumptions: 12 MW
Category B: • Contingency: Miramar Energy facility #1 or 2, system readjusted,
followed by the loss of Miguel-Bay Blvd. 230 kV (TL23042A
• Limiting component: Sycamore-Scripps 69 kV (TL6916)
• 2024 LCR: 48 MW (includes 0 MW of QF)
• AAEE assumptions: 12 MW
Slide 38

Slide 39
Conclusions
• No resource deficiencies as long as AAEE, LTPP Tracks 1 and 4
resources, and ISO Board-approved transmission projects are
implemented.
• However, if less resources are to be procured, there could be
deficiency for the combined LA Basin / San Diego area in the scenario
where the existing “fast” demand response is not adequately
implemented or procured.
• DR needs to be “fast” product with response time within 20 minutes to
allow Operator adequate response time.
• The LCR need for the San Diego sub-area continues to be caused by
the overlapping Category C (N-1-1) contingency by 500kV lines in
southeastern San Diego area.
• The LCR need for the San Diego – Imperial Valley LCR area continues
to be caused by the overlapping Category B (G-1/N-1) contingency for
major 500kV line east of Imperial Valley Substation
For written comments, please send to: [email protected]

Methodology for Calculating Locational
Effectiveness Factors (LEFs)
David Le
Senior Advisor - Regional Transmission Engineer
2014-2015 Transmission Planning Process Stakeholder Meeting
November 19 - 20, 2014

Overview
Slide 2
• Calculating LEFs based on thermal loading constraints
• Calculating LEFs based on post-transient voltage
stability concerns
– Nodal analysis approach
– Zonal analysis approach
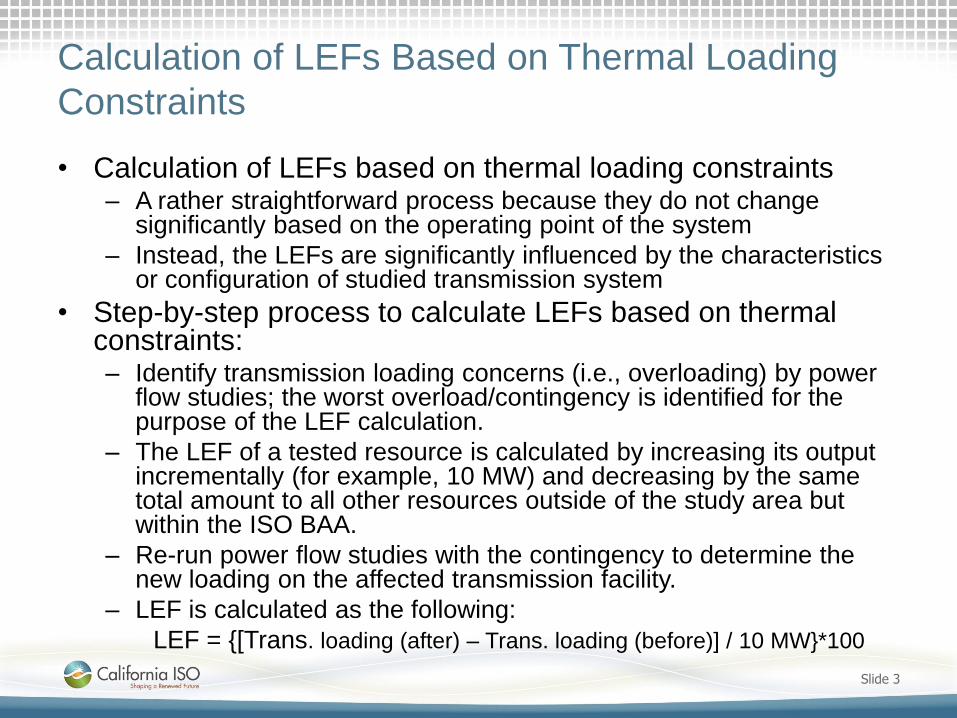
Calculation of LEFs Based on Thermal Loading
Constraints
• Calculation of LEFs based on thermal loading constraints – A rather straightforward process because they do not change
significantly based on the operating point of the system
– Instead, the LEFs are significantly influenced by the characteristics or configuration of studied transmission system
• Step-by-step process to calculate LEFs based on thermal constraints: – Identify transmission loading concerns (i.e., overloading) by power
flow studies; the worst overload/contingency is identified for the purpose of the LEF calculation.
– The LEF of a tested resource is calculated by increasing its output incrementally (for example, 10 MW) and decreasing by the same total amount to all other resources outside of the study area but within the ISO BAA.
– Re-run power flow studies with the contingency to determine the new loading on the affected transmission facility.
– LEF is calculated as the following:
LEF = {[Trans. loading (after) – Trans. loading (before)] / 10 MW}*100
Slide 3

• A simple example:
TL1 loading is 105 MW (before injection of additional 10 MW at
Gen B)
TL1 loading is 100 MW (after injection of additional 10 MW at
Gen B)
Gen B LEF = {[100 – 105] / 10}*100 = -50%
Gen B is 50% effective in reducing loading on TL1
Slide 4
Calculation of LEFs Based on Thermal Loading
Constraints (cont’d)
Gen B Gen A
Load A
TL1

Calculation of LEFs Based on Voltage Stability
Constraints
• Calculation of LEFs based on voltage stability constraints is a complicated process because they can change based on the operating point of the system and are dependent on the following: – Amount of resources (i.e., generation, demand response, energy
storage, AAEE, etc.) assumed in the power flow model, and
– Level of transmission upgrade assumptions
• There are two potential methodologies to determine LEFs in an LCR area: – Nodal analysis:
• If the LCR area is small
• Resource requirements needed for mitigation are low enough to be modeled at individual bus
– Zonal analysis: • If the LCR area is large and consists of several sub-areas
• Resource requirements needed for mitigating regional voltage stability concerns are too large to be modeled at individual bus; this would allow for realistic, practical and consistent study process for all sub-areas.
Slide 5
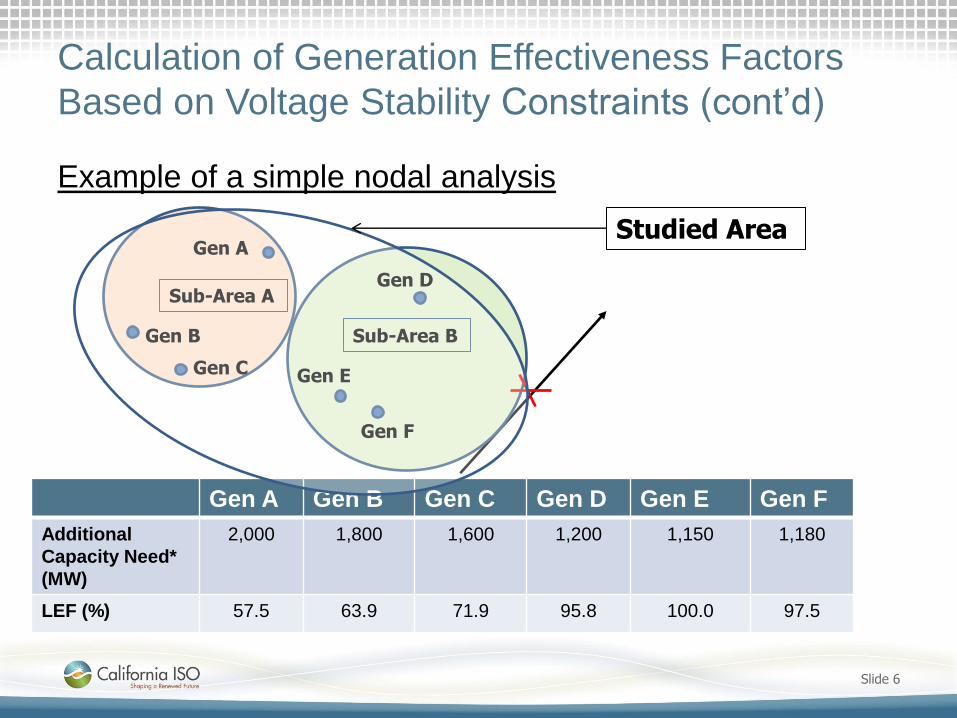
Calculation of Generation Effectiveness Factors
Based on Voltage Stability Constraints (cont’d)
Slide 6
Sub-Area A
Sub-Area B Gen B
Gen A
Gen C
Gen D
Gen E
Gen F
Example of a simple nodal analysis
Gen A Gen B Gen C Gen D Gen E Gen F
Additional
Capacity Need*
(MW)
2,000 1,800 1,600 1,200 1,150 1,180
LEF (%) 57.5 63.9 71.9 95.8 100.0 97.5
Studied Area

Calculation of LEFs Based on Voltage Stability
Constraints (cont’d)
• The following are advantages and disadvantages of nodal analyses used in determining LEFs based on voltage instability concerns: 1. Advantages:
• Specific LEF for each bus can be calculated
2. Disadvantages:
• Not practical, realistic nor feasible for modeling at each bus where additional required capacity is large (i.e., thousands or tens of thousands of MW) to mitigate voltage instability concerns in the less effective sub-areas
• Would result in inconsistent study approach in a large LCR area where there exists pockets of effective and in-effective sub-areas (i.e., it would not be consistent if nodal analyses are performed for a more effective sub-area, but zonal analyses would need to be performed for less or non-effective sub-areas)
Slide 7

Calculation of LEFs Based on Voltage Stability
Constraints (cont’d)
Example of a simple zonal analysis
Slide 8
Sub-Area B Sub-Area G Sub-Area A
Gen B
Studied Area
Sub-Area A Sub-Area B Sub-Area C
Additional Capacity
Need* (MW)
16,000 7,000 3,000
LEF (%) 18.8 42.9 100.0
Generating/Resource Sites

Calculation of LEFs Based on Voltage Stability
Constraints (cont’d)
Slide 9
• The following are advantages and disadvantages of zonal analyses used in determining LEFs :
1. Advantages:
• Practical and feasible in modeling large amount of capacity resources in a very large area that has multiple sub-areas to mitigate voltage instability concerns that affect the entire region;
• Can be performed consistently for all sub-areas under consideration;
• Would avoid other reliability issues if the resources are spread out to multiple buses rather than at one bus (i.e., delivery issues);
• Able to obtain power flow solution in modeling large amount of resources in multiple buses rather than at one single bus (see previous example where one sub-area requires 16,000 MW to mitigate voltage instability concern)
2. Disadvantages:
• Not having LEF for each bus;
• Having perception of being arbitrary in creating sub-areas vs. having more specific number for each bus.

Conclusions
• For thermal loading constraints, calculating LEF at each bus is a rather straightforward process because it does not need to model large amount of additional generation to identify the effectiveness factors at each bus.
• For voltage stability concerns, it is more complicated to determine the LEF for each bus if the capacity requirement is too large to model or to obtain power flow solution. This is further exacerbated with the fact that the resources elsewhere would have to be reduced in order to balance loads and resources in the power flow model.
• Nodal analyses (for voltage stability constraints) would perform well if the LCR study area is small and the required incremental resource capacity need is not too large and is feasible for modeling at a specific bus.
• Zonal analyses (for voltage stability constraints) would perform better and allow for consistent evaluation approach for a very large LCR study area that consist of multiple sub-areas that have significant differences in effectiveness factors in mitigating regional voltage instability concerns.
• Additional studies may need to be performed to evaluate for different scenarios with various levels of baseline resource and transmission upgrade assumptions to see how the LEF changes. The LEFs, for voltage stability assessment, are very sensitive to changes on baseline resource and transmission upgrade assumptions.
Slide 10

Wrap-Up
2014-2015 Transmission Planning Process Stakeholder Meeting
Tom Cuccia
Lead Stakeholder Engagement and Policy Specialist
November 19-20, 2014
Next Steps
Page 2
Date Milestone
November 20,
2014
Stakeholder Meeting - Day 2
November 20 –
December 4
Stakeholder comments to be submitted to
January 2015 2014-2015 Draft Transmission Plan posted
February 2015 Stakeholder Meeting on contents of draft
Transmission Plan


