CORPORATE PRESENTATION (Q2/H1 FY 16) - Triveni Group · 2015-11-16 · CORPORATE PRESENTATION...
38
CORPORATE PRESENTATION (Q2/H1 FY 16) 1
Transcript of CORPORATE PRESENTATION (Q2/H1 FY 16) - Triveni Group · 2015-11-16 · CORPORATE PRESENTATION...

CORPORATE PRESENTATION
(Q2/H1 FY 16)
1

Triveni Group
TEIL holds 21.8% of the equity in TTL
50% plus one
share
Triveni
Engineering
& Industries
Ltd. (TEIL)
Triveni
Turbine Ltd.
(TTL)
Sugar
Businesses Sugar
Businesses
Co-
generation
Business
Distillery
Business
GE Triveni
Ltd.
(GETL)
Engineering
Businesses
Gears
Business
Water
Business
Triveni Group Organisation Structure
2

Triveni Group Fact Sheet
Two Independent Listed Companies with pan India presence – Triveni
Engineering & Industries Ltd. and Triveni Turbine Ltd.
Listed in both National Stock Exchange & Bombay Stock Exchange – Market Cap
of ~ INR 43 billion (as on November 9, 2015)
Promoter driven, professionally managed companies with eminent and
independent Board of Directors
Triveni Engineering is one of the largest integrated sugar manufacturers in India
and market leader in its engineering businesses comprising high speed gears,
gearboxes, and water & waste water treatment solutions
Triveni Turbine Ltd. is the market leader in the steam turbines upto 30 MW size.
3

Engineering Businesses
4

Engineering Business – Pan India Presence
Market leader in High
speed gears & gear
boxes upto 70 MW
capacity and speed of
70,000 rpm
A leading player in the
high technology water &
wastewater
management business
Mysore Corporate Office
Manufacturing Facilities
Noida
Water Treatment Projects
Engineering
Businesses
Gears
Business
Water
Business
5

Engineering Businesses –Revenue Growth
0
500
1000
1500
2000
2500
3000
3500
4000
FY10 FY11 FY12 FY12-14* FY15
2625
3068
2736
3951
3009
565 651
423 256 255
` in
mil
lio
ns
Revenue PBIT
FY 12-14* - 18 months period from Oct 12 – Mar 14
6

Gears Business - Overview
Triveni is in the business of design, manufacture
and marketing of customised gears and gearboxes
(both high speed and niche low speed gears)
having a state-of-the-art design and manufacturing
facility at Mysore conforming to international
standards. About 70% market share in complete
high speed gear market across applications up to
70 MW capacity and speeds of 70,000 rpm.
Own developed technology for high speed gear
boxes upto 7.5 MW and for hydel gearbox range
upto 6 MW. Range above 7.5 MW-62 MW is
manufactured using technology licensed from
Lufkin, USA.
High Speed Gears product range includes all
Steam Turbine gear boxes, gear boxes for
compressors and load gear boxes for gas turbines.
Geographies extended to cover major markets in
South East Asia such as Malaysia, Indonesia,
Singapore, Thailand with the possibility of
enhancing territories in the future.
Niche engineered-to-order high technology low
speed gear applications with Lufkin for four
industrial segments viz., Rubber & Plastics,
Metals and Steel, Marine and Coal pulverizer
application in the thermal power plants.
7

Gears Business – Financial Performance
1014
1202
1043
1421
1033
345 419
301
397
292
0
200
400
600
800
1000
1200
1400
1600
FY10 FY11 FY12 FY12-14* FY15
` in
millio
ns
Net Sales PBIT
The turnover & PBIT for H1 FY 16 has been higher
by 12% and 11% respectively. There has been an
increase in off-take by OEMs while the lumpy
business of retrofitting, spares sales etc. was lower
in H1 FY 16. The exports also shown good growth
with about 14% of the revenue, which is a significant
growth year on year.
Overall the market is still impacted by the
slowdown in the capital goods segment.
The order in-take of ` 580 million for H1 FY 16 has
been higher in comparison to corresponding period
of previous year by about 17%.
The flow of orders under Strategic Supply
Agreement with GE Lufkin is expected to gain
momentum in the later part of the year.
Outstanding Order Book as on 30th Sep 2015 – ` 690 million
FY 12-14* - 18 months period from Oct 12 – Mar 14
8

Water Business - Overview
Technology association with world’s leading
technology providers for various products, process
& solutions such as Ultra filtration (UF), Reverse
Osmosis (RO), Moving Bed Bio Reactor (MBBR)
etc.
One of the widest ranges of products &
technologies offered in the Indian Market.
Indigenous Product lines include clarifiers, aerators,
filters, membrane solutions, de-watering equipment
and high purity water systems.
Over 2000 numbers of process equipments for
water & waste water treatment applications,
supplied and commissioned till date.
With the visibility of a fast growing market, Water
Business expected to grow consistently in future.
During FY12, the company has made a long term
strategic investment by acquiring 25.04% equity
stake in Aqwise-Wise Water Technologies Limited,
a company registered in Israel, engaged in
providing water treatment solutions using
proprietary technology. The investment is
synergistic to the water / waste water business of
the company.
9

Water Business – Financial Performance
1610
1866 1692
2530
1976
219 232 123 -141 -37
-500
0
500
1000
1500
2000
2500
3000
FY 10 FY 11 FY 12 FY 12-14 (*) FY 15
` i
n m
illi
on
s
Net Sales PBIT
FY 12-14* - 18 months period from Oct 12 – Mar 14
The turnover during the half year has suffered due to
lower order intake in the previous year, project delays
and payment issues with some customers.
The losses were due to under absorption of overheads
due to lower turnover. During the last financial year,
there were not many order finalization, which has
resulted in lower execution during the current year.
The position of order intake has improved in H1 FY 16
- WBG has received orders for ` 3.03 billion which
includes O&M portion of ` 770 million. Many more
enquiries in both the segments are in pipeline and are
awaiting finalisation, which are expected to be
concluded in the coming quarters.
Outstanding Order Book as on 30th Sept 2015 – ` 6.94 billion
(including ` 2.77 billion towards O&M)
10

Sugar Businesses
11

Sugar Business
One of the largest sugar
producers in India with
seven sugar
manufacturing facilities
Three grid connected
co-generation plants and
three incidental co-generation
plants located across five
sugar units.
One of the largest single
stream molasses based
distillery in the country
located at Muzaffarnagar
Sugar
Businesses
Sugar
Business
Co-generation
Business
Distillery
Business
12

Sugar Business – Industry Overview
As per industry estimates, the country’s sugar
production for SS 2015-16 is estimated in the range
of 26.8 – 27 million tonnes, which is going to be
lower than the previous year by about 1.5 million
tonnes.
The total sugarcane acreage in the country for SS
2015-16 is estimated to be around 52.84 lac
hectares, which is just 0.4% less than SS 2014-15.
Uttar Pradesh is estimated to have sugarcane
acreage of 23.02 lac hectares in SS 2015-16, as
against 23.07 lac hectares in SS 2014-15 and it is
also expected to have better yield which may
increase the sugarcane production and availability
for crushing by sugar mills. The preliminary
estimates indicate that sugar production in U.P. to
be around 7.5 million tonnes, which would be more
than 7.1 million tonnes produced in SS 2014-15.
Maharashtra is likely to have acreage at 10.5 lac
hectares this year due to less rainfall in July and
August, which are important months in the growth of
the cane crop. It is estimated that the yield per
hectare may go down leading to a decline of 14.3%
at 9.7 million tonnes from 10.5 million tonnes in last
crushing season.
Karnataka is estimated to produce about 4.6 million
tonnes of sugar which is 0.4 million tonnes lower
than the sugar production in SS 2014-15.
India:
13

Sugar Business – Industry Overview
The Central Government also notified the
mandatory export of 4 million tonnes of sugar for
SS 2015-16. The amount has been allocated to all
the mills in the country. Sugar mills have already
finalised contracts for over 100,000 tonnes ahead
of the beginning of the crushing season due to
sudden increase in sugar price in global markets.
The Government of Uttar Pradesh has disbursed
the committed cane subsidy of ` 28.60 per quintal
which enabled the millers to make partial cane
payment. Similarly, the interest free loan
sanctioned by Central Government has also been
utilised by mills to pay the cane arrears
The Central Government is actively pursuing
increasing the demand for fuel ethanol to target for
10% blending with petrol. It is expected to help the
industry to augment its revenues and it may on a
long run also help in regulating sugar production in
the country.
Global:
As per most of the industry estimates, global sugar
production is forecast to have a deficit for 2015-16
On the back of lower sugar production and an
estimated sugar deficit for the ensuing season,
sugar prices in the global market shown a surge of
around 30% from a low of US ¢11.3 per pound in
July 2015 to US ¢14.5 per pound in early November
2015.
14

Sugar Business – Industry Overview
(Figures in million tonnes)
* Figures taken as per Directorate of Sugar, Department of food
** Production/Imports/Exports figures include both White & Raw sugar
Closing stock taken as a percent of consumption is one of the indicators of sugar price movement.
2010-11 2011-12* 2012-13* 2013-14
2014-15
(E)
Opening Stock as on 1st Oct. 4.9 5.8 6.6 9.3 7.5
Production during the Season** 24.3 26.3 25.1 24.4 28.3
Imports 0 0 0.7 0.1 0.0
Total Availability 29.3 32.1 32.4 33.8 35.8
Off-take
I) Internal Consumption 20.7 22.6 22.7 24.2 25.1
ii) Exports 2.6 2.9 0.3 2.1 1.1
Total off-take 23.3 25.5 23.1 26.3 26.2
Closing Stock as on 30th Sept. 6.0 6.6 9.2 7.5 9.6
Stock as % of Off-take 28.9% 29.2% 40.5% 31.2% 38.3%
15

Sugar Business - Overview
Major facilities located in cane rich areas of
Western Uttar Pradesh with more than 80% cane
intensity – fertile and irrigated land
Sugar cane catchment area for all sugar units
under canal irrigation – both in Western & Central
Uttar Pradesh - Lower dependency on monsoon
Closer to country’s major sugar consuming
markets - better realizations & lower
transportation cost. Long term relationship with ~
250,000 farmers
Extensive sugar cane development programme –
to develop new areas under cane cultivation in
our new locations; improving yields of cane
across the units.
Deoband
Khatauli
Ramkola
Chandanpur
Sabitgarh
Milak Narayanpur
Rani Nangal
16

Sugar Business – Financial Performance
The sugar operations reported profit in the quarter
under review due to reversal to the extent of ` 40.42
crore of inventory write-down considered in the
previous quarter. It has been due to improvement in
the sugar prices.
The sugar inventory as on Sep 30, 2015 was 15.38
lac quintals valued at ` 2630/quintal.
0.29 million tonnes of sugar was despatched during
the half year.
The average sugar realisation price for the half year
was ` 25000/MT.
FY 10 FY 11 FY 12 FY 12-14 (*) FY 15
Net Sales (` in millions) 14055 13434 14821 24930 16284
PBIT (` in millions) (573) 74 29 (1919) (1659)
Sugar Manufactured (000 t) 506 420 465 937 491
FY 12-14* - 18 months period from Oct 12 – Mar 14
17

Co-generation Business - Overview
Triveni presently operates grid connected three co-
generation plants and three incidental co-
generation plants located across five sugar units
which facilitate export of surplus power to Uttar
Pradesh Power Corporation Limited (UPPCL).
Deoband and Khatauli co-generation plants of the
Company are registered as Clean Development
Mechanism (CDM) projects with United Nations
Framework Convention on Climate Change
(UNFCCC) and have been registered with
National Load Dispatch Centre (NLDC) as REC
projects.
18

Co-generation Business – Financial Performance
This quarter being off-season, there were no
operations.
Income of ` 7.6 million has been realised during
the current quarter and ` 17.7 million during the
half year from the sale of Renewable Energy
Certificates (RECs) in respect of Khatauli and
Deoband units
1467
1171 1293
2657
1568
270 366 499
994
658
0
500
1000
1500
2000
2500
3000
FY 10 FY 11 FY 12 FY 12-14 (*) FY 15
` i
n m
illi
on
s
Net Sales PBIT
FY 12-14* - 18 months period from Oct 12 – Mar 14
19
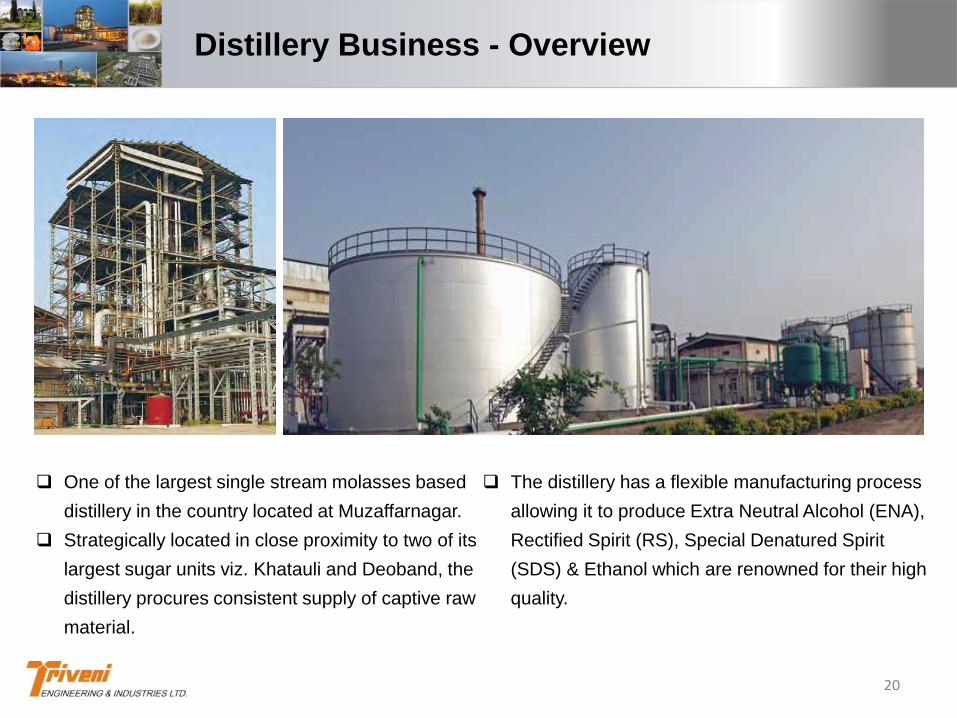
Distillery Business - Overview
One of the largest single stream molasses based
distillery in the country located at Muzaffarnagar.
Strategically located in close proximity to two of its
largest sugar units viz. Khatauli and Deoband, the
distillery procures consistent supply of captive raw
material.
The distillery has a flexible manufacturing process
allowing it to produce Extra Neutral Alcohol (ENA),
Rectified Spirit (RS), Special Denatured Spirit
(SDS) & Ethanol which are renowned for their high
quality.
20
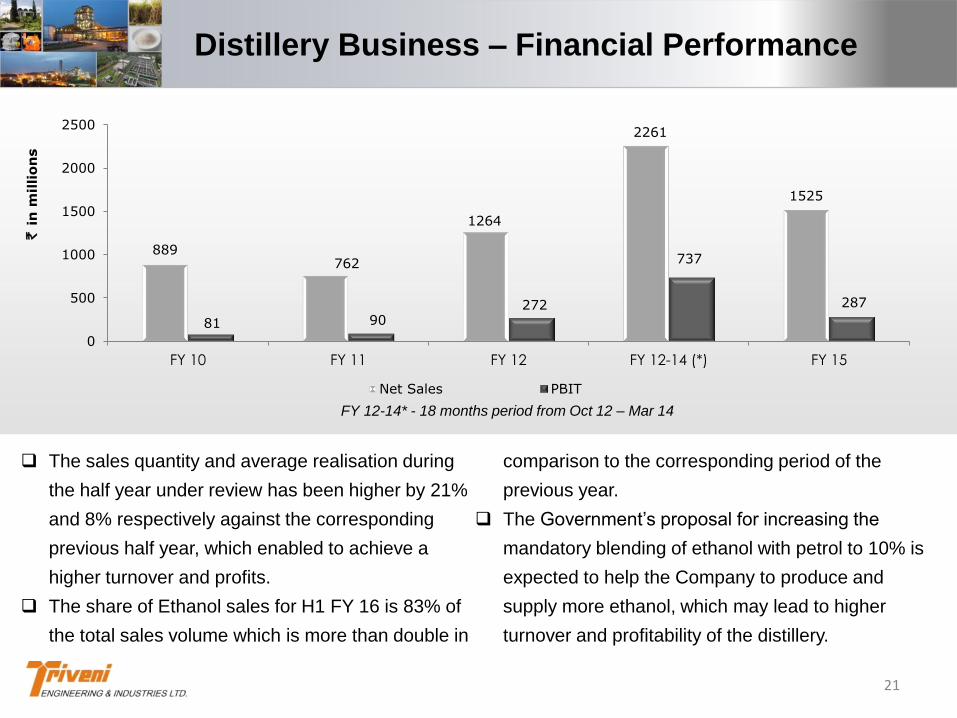
889 762
1264
2261
1525
81 90 272
737
287
0
500
1000
1500
2000
2500
FY 10 FY 11 FY 12 FY 12-14 (*) FY 15
` i
n m
illio
ns
Net Sales PBIT
Distillery Business – Financial Performance
The sales quantity and average realisation during
the half year under review has been higher by 21%
and 8% respectively against the corresponding
previous half year, which enabled to achieve a
higher turnover and profits.
The share of Ethanol sales for H1 FY 16 is 83% of
the total sales volume which is more than double in
comparison to the corresponding period of the
previous year.
The Government’s proposal for increasing the
mandatory blending of ethanol with petrol to 10% is
expected to help the Company to produce and
supply more ethanol, which may lead to higher
turnover and profitability of the distillery.
FY 12-14* - 18 months period from Oct 12 – Mar 14
21

Scheme of Arrangement
22

Scheme of Arrangement
Board of Directors of Triveni Engineering & Industries Limited (‘TEIL’ or ‘the Company’) at its meeting held
today i.e. 28th July 2015 have considered and approved the Composite Scheme of Arrangement
(“Scheme”) between Triveni Engineering & Industries Limited (‘TEIL’ or ‘the Transferor Company’) and
Triveni Sugar Limited (‘TSL’ or ‘the Transferee Company’) and Triveni Industries Limited (‘TIL’ or ‘the
Resulting Company’) and their respective shareholders and the creditors.
The Scheme envisages transfer and vesting of the undertakings in the manner described below under the
provisions of Sections 391 to 394 read with sections 100 to 103 of the Companies Act 1956 and section 52
of the Companies Act 2013 and other applicable provisions of the Companies Act, 1956 and Companies
Act, 2013, as and when notified and made applicable:
1. Transfer and vesting (by way of business transfer) of the Sugar Undertaking of TEIL (principally
comprising five sugar plants of TEIL situated at Sabitgarh (Western UP); Chandanpur, Rani Nangal and
Milaknarayanpur (Central UP), and Ramkola (Eastern UP)) into a 99.99% subsidiary, Triveni Sugar Limited
(TSL), including all related assets and liabilities and other consequential matters with effect from the
appointed date on 1st July, 2015. The consideration, as determined in the Valuation Report, for the transfer
will be discharged by TSL by the issuance of equity shares to TEIL.
23

Scheme of Arrangement
2. Transfer and vesting (by way of demerger) of the Demerged Undertaking of TEIL (principally comprising
sugar plants situated at Khatauli and Deoband (Western UP) along with their cogeneration facilities,
Distillery situated at Muzaffarnagar (Western UP) and related investments including investment in TSL into
a wholly owned subsidiary, Triveni Industries Limited (TIL), including all related assets and liabilities and
other consequential matters with effect from the appointed date on 1st November, 2015. The consideration
for the transfer will be discharged by TIL by the issuance of equity shares to the shareholders of TEIL in the
ratio of 1:1 (one fully paid equity share of TIL for every fully paid equity share held in TEIL).
3. After the proposed restructuring, TIL will become the holding company of TSL and it is proposed to get
TIL listed on BSE and NSE. TIL will apply for listing in compliance with all applicable provisions under law,
subject to necessary permissions, sanctions and/ or approvals of the statutory/ regulatory authorities.
The Scheme is subject to requisite consent and approval of the shareholders, lenders, creditors of the
Company, stock exchanges, SEBI and sanction of the Hon’ble High Court of Judicature at Allahabad and
permissions and approval of any other statutory or regulatory authorities under the provisions of applicable
laws as may be necessary for the implementation of the Scheme.
The in-principle approval from the stock exchanges (BSE & NSE) has been received and a petition has
also been filed in the Allahabad High Court for convening shareholders and creditors meeting.
24

Triveni Turbine Ltd.
25

Triveni Turbine Ltd.
50% plus one share
• Triveni Turbine Limited (TTL)
is one of the leading
industrial steam turbine
manufacturers of India in the
up to 30 MW.
• TTL listed in NSE & BSE,
two major stock exchanges
in India.
• Strong Aftermarket services
are supported by pan India
presence.
Triveni
Turbine Ltd.
(TTL)
GE Triveni
Ltd.
(GETL)
26

TTL – Fact Sheet
Location: A 50,000 sq.mt factory
area in the beautiful city of
Bengaluru. 13 service centres
across India
Significant presence in South East
Asia, Europe, South America, Middle
East & Africa, with installations in
over 50 countries
Key global player in steam turbines
industry with market leadership
position in India, having over 60%
market share in the range upto 30
MW
Annual Consolidated Revenues for
FY 15 at ` 6.51 billion (~ USD 102
million)
27
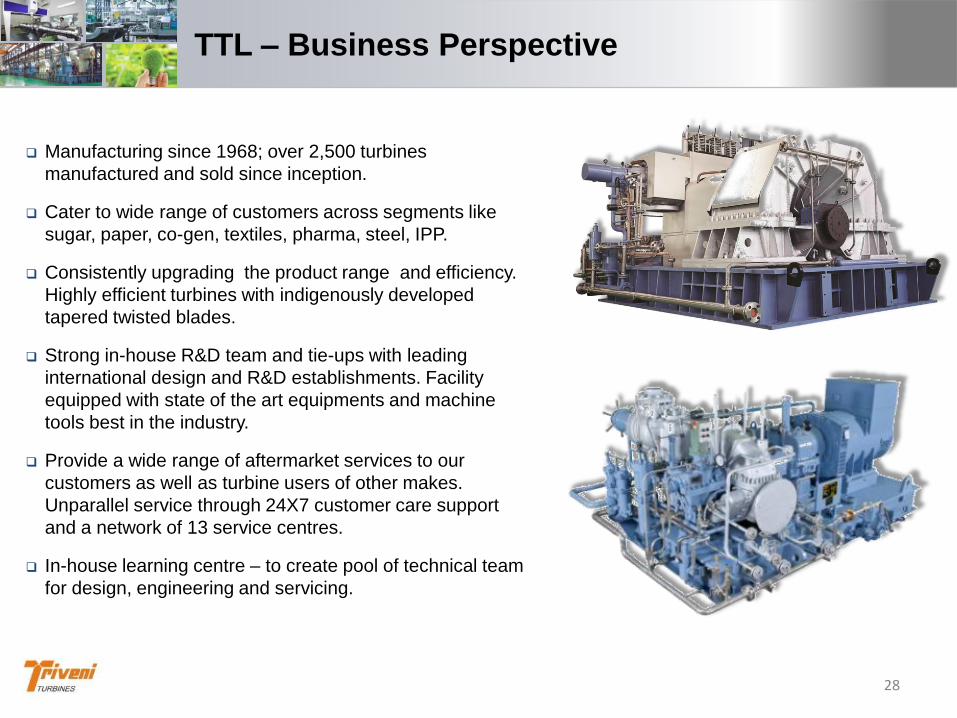
TTL – Business Perspective
Manufacturing since 1968; over 2,500 turbines
manufactured and sold since inception.
Cater to wide range of customers across segments like
sugar, paper, co-gen, textiles, pharma, steel, IPP.
Consistently upgrading the product range and efficiency.
Highly efficient turbines with indigenously developed
tapered twisted blades.
Strong in-house R&D team and tie-ups with leading
international design and R&D establishments. Facility
equipped with state of the art equipments and machine
tools best in the industry.
Provide a wide range of aftermarket services to our
customers as well as turbine users of other makes.
Unparallel service through 24X7 customer care support
and a network of 13 service centres.
In-house learning centre – to create pool of technical team
for design, engineering and servicing.
28

TTL – Business Perspective
Product
Product
Straight Condensing Type
Extraction Condensing Type
Bleed Condensing Type
Injection Condensing Type
Straight Back Pressure Type
Extraction Back Pressure Type
Bleed Back Pressure Type
Back Pressure Steam Turbines
Condensing Steam Turbines
Engineered-
to-order
Cost
Efficient
Best–in–class
Technology
Robust &
Reliable
Power
Generation
Capacity
Up to 30 MW
Steam Inlet
Temperature
Up to 545°C
Steam Inlet
Pressure
Up to 120 Bar (a)
For GETL range Above 30 MW to
100 MW 29

TTL – Aftermarket Services
Aftermarket Services are integrated under Customer Care Cell (CCC) which provides a
comprehensive range of customized service solutions and complete life cycle support for
industrial steam turbines
Full speed vacuum balancing tunnel for
balancing turbines, compressors/alternators –
can undertake balancing for turbo machines
up to 300 MW depending on specifications.
Offers all after-sales requirements from
erection and commissioning (E&C) to
maintenance and spare parts to efficiency
improvement.
Overhauling & troubleshooting.
Refurbishment & Residual Life Assessment of
all makes of turbines, compressors etc.
Customization & upgradation of old turbines
for both industrial and utility segments in India
and global markets.
Currently offering refurbishment solutions for
higher MW turbines for all makes.
30
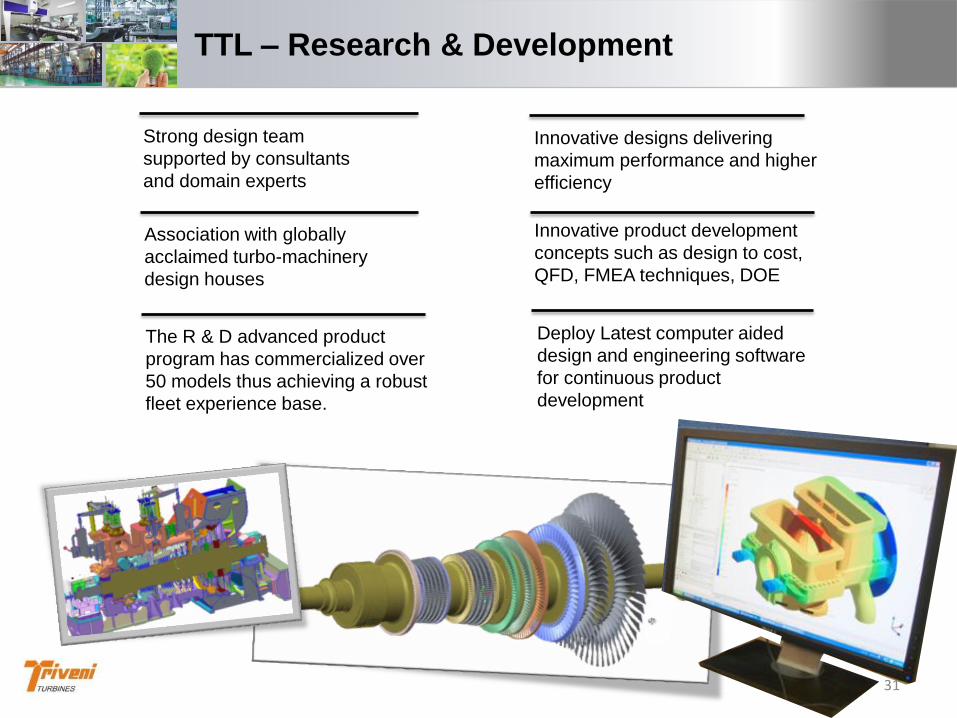
TTL – Research & Development
Innovative designs delivering
maximum performance and higher
efficiency
Strong design team
supported by consultants
and domain experts
Association with globally
acclaimed turbo-machinery
design houses
The R & D advanced product
program has commercialized over
50 models thus achieving a robust
fleet experience base.
Innovative product development
concepts such as design to cost,
QFD, FMEA techniques, DOE
Deploy Latest computer aided
design and engineering software
for continuous product
development
31

Sugar
Palm Oil
Distillery
Pulp & Paper
Food Processing
Textiles
Steel & Metal
Carbon Black
Cement
Chemicals & Fertilisers
Oil & Gas and Petrochemical
District Heating & Cooling
Municipal Solid waste
Industry Segments
TTL – Applications & Industry Segment
Co-generation
Captive Power Plant
Combined Heat & Power
CCP / Waste Heat Recovery
Incineration
Biomass
Applications
32

TTL – Financials
All financials are for April-March period for respective financial year
0 2000 4000 6000 8000
FY11
FY12
FY13
FY14
FY15
6135
6319
6569
5083
6255
1289
1350
1567
1014
1356
` million
PBT Net Sales
FY11 20.9
FY12 21.3
FY 13 23.8
FY14 20.0
FY 15 21.7
PBT Margins (%)
33

TTL – Financials
` million
Q2 FY 16 Q2 FY 15 % change H1 FY 16 H1 FY 15 % change
Income from
Operations (Net) 1773 1570 13% 3010 2785 8%
EBITDA 452 394 15% 700 648 8%
EBITDA Margin 25.5% 25.1% 23.3% 23.3%
Depreciation &
Amortisation 35 40 -13% 71 81 -12%
PBIT 417 354 18% 629 567 11%
PBIT Margin 23.5% 22.5% 20.9% 20.4%
Finance cost 2 -- 2 1
PBT 415 354 17% 627 566 11%
PBT Margin 23.4% 22.5% 20.8% 20.3%
PAT 276 239 16% 420 381 10%
PAT Margin 15.6% 15.2% 14.0% 13.7%
34

TTL – Financials
The total income for the half year under review has
been higher by 8% with product segment showing
a growth of 15% y-o-y while the aftermarket
revenue shown a decline by 9%.
The share of product and aftermarket has been
78:22 in H1 FY 16 as against 74:26 in H1 FY 15.
The export turnover has gone up by 17% in H1 FY
16 to ` 1.04 billion and the proportion to the total
sales have also gone up from 32% in H1 FY 15 to
35% in H1 FY 16.
During H1 FY 16, the total product order intake
has been ` 2.9 billion, which is a growth of 27% in
comparison to the corresponding period of last
year while the aftermarket order-intake has been
higher by 18% at ` 906 million.
The overall order booking at ` 3.8 billion during
H1 FY 16 has grown by 25% in comparison to the
corresponding period of last year.
The outstanding order book on a standalone
basis, as on 30th Sep 2015 has been ` 6.8 billion,
while on a consolidated basis, the outstanding
order book is ` 7.9 billion.
The share of aftermarket in the closing order
book has improved to 11% in H1 FY 16 from 9%
in H1 FY 15.
35
GE Triveni Ltd. – Joint Venture
Triveni Turbine Ltd. formed a 50:50 Joint Venture
with GE on 15th April 2010. GE Triveni Ltd.
(GETL) headquartered in Bengaluru, a subsidiary
of TTL, will design, supply, sell and service
advanced technology steam turbines in India in
the range above 30-100 MW for power generation
applications in India and globally.
GETL to get technology and on-going R&D
support from GE and TTL and will use TTL’s
Bengaluru facility for turbine manufacturing.
The outstanding order book as on 30th Sep 2015
for JV is ` 1.6 billion.
The turnover of the JV stood at ` 430 million in H1
FY 16. With a strong order backlog and enquiry
book, the business is expected to gain
momentum during the year.
The JV will be commissioning its first overseas
order during the current year, which should enable
it to establish references and help in getting more
orders in the future.
Further, many of the supplies made during the
previous years in the domestic market will also
get commissioned during the current year, which
should help the Company to finalise many
enquiries in the domestic market also.
36
Contact for Investor Relations
CN Narayanan
Triveni Engineering & Industries Ltd.
Tel. +91 120 430 8000 Fax : +91 120 431 1010
Gavin Desa/ Rabindra Basu
Citigate Dewe Rogerson
Tel: +91 22 66451237/1248
[email protected] / [email protected]
-----------------------------------------------------------------------------------------------------------------
DISCLAIMER : Some of the statements in this presentation that are not historical facts are forward looking statements. These forward-looking
statements include our financial and growth projections as well as statements concerning our plans, strategies, intentions and
beliefs concerning our business and the markets in which we operate.
These statements are based on information currently available to us, and we assume no obligation to update these statements as
circumstances change. There are risks and uncertainties that could cause actual events to differ materially from these forward-
looking statements. These risks include, but are not limited to, the level of market demand for our services, the highly-competitive
market for the types of services that we offer, market conditions that could cause our customers to reduce their spending for our
services, our ability to create, acquire and build new businesses and to grow our existing businesses, our ability to attract and
retain qualified personnel, currency fluctuations and market conditions in India and elsewhere around the world, and other risks
not specifically mentioned herein but those that are common to industry.
Further, this presentation may make references to reports and publications available in the public domain. Triveni Engineering &
Industries Ltd. makes no representation as to their accuracy or that the company subscribes to those views / findings.
37

Thank You
38