
CORPORATE PRESENTATION - · PDF fileCORPORATE PRESENTATION June 2015. 2 IMPORTANT NOTICE...
21
CORPORATE PRESENTATION June 2015
Transcript of CORPORATE PRESENTATION - · PDF fileCORPORATE PRESENTATION June 2015. 2 IMPORTANT NOTICE...

CORPORATE PRESENTATIONJune 2015

2
IMPORTANT NOTICE
Statements in this presentation concerning the Company’s business outlook or future economic
performances, anticipated profitability, revenues, expenses, or other financial items, anticipated cost
synergies and product or service line growth, together with other statements that are not historical facts,
are “forward-looking statements” and not necessarily represent future results.
Any forward-looking statements are estimates, reflecting the best judgment of ENAEX based on
currently available information and involve a number of risks, uncertainties and other factors that could
cause actual results to differ materially from those stated in such statements.

AGENDA
1
4
3
2
Company Overview
Business Description
ENAEX in the world
5
6
Innovations and Sustainability
Prillex expansion project
3
Financial Summary

COMPANY OVERVIEW1

The CompanyC
om
pan
y O
verv
iew
Enaex S.A., with 94 years in the market, the largest manufacturer of Ammonium Nitrate, explosives and blasting services in Latin America
1
CHEMICALS SERVICES
INTERNATIONAL
REVENUES*
US$ 690 million
EBITDA*
US$ 158 million
NET PROFIT*
US$ 97 million
5* June 2015 Results
LOCAL SERVICE

60,72%13,57%
12,59%
13,12%
Sigdo Koppers S.A.
Austin Powder
Karlezi Solari Group
AFP Investments Funds and Others
Corporate GovernanceC
om
pan
y O
verv
iew
1Ownership Structure Board of Directors
6
* As of June 2015

History HighlightsC
om
pan
y O
verv
iew
1
7
Ammonium Nitrate
plant
450.000 TON
Ammonium Nitrate
plant
100.000 TON
Acquires 33% of
Enaex S.A.
Enaex enters to
Santiago Stock
Exchange
1920
First Blend
truckStart of explosives
production
Beginning of APD and
PENT Production
1923 1964 1974 1983 1990 1999
2006 2007 2010 2012 2014 2015
Capital increase of
68 MM USD
Enaex
Argentina
CDM Project
Ammonium Nitrate
plant
850.000 TON
Expansion to Brazil
(33%)
Environmental impact
assessment for
Mejillones Project
1.200.000 TON
Foundation
Enaex acquired 91%
of Davey Bickford
Enaex acquired
100% of Britanite

BUSINESS DESCRIPTION2
4,7 4,95,3
5,6
5,4 5,35,7 5,8
0,34 0,340,40 0,43
0,530,64
0,710,73
1,1 1,1 1,11,0
0,9 0,9 0,8
-0,1
0,1
0,3
0,5
0,7
0,9
1,1
1,3
0,0
1,0
2,0
3,0
4,0
5,0
6,0
7,0
Copper Production (MMTons)
Explosives demand (MM Tons)
Mineral Grade (Kg/Ton)
Mining Industry OverviewB
usi
nes
s D
escr
ipti
on
1
9
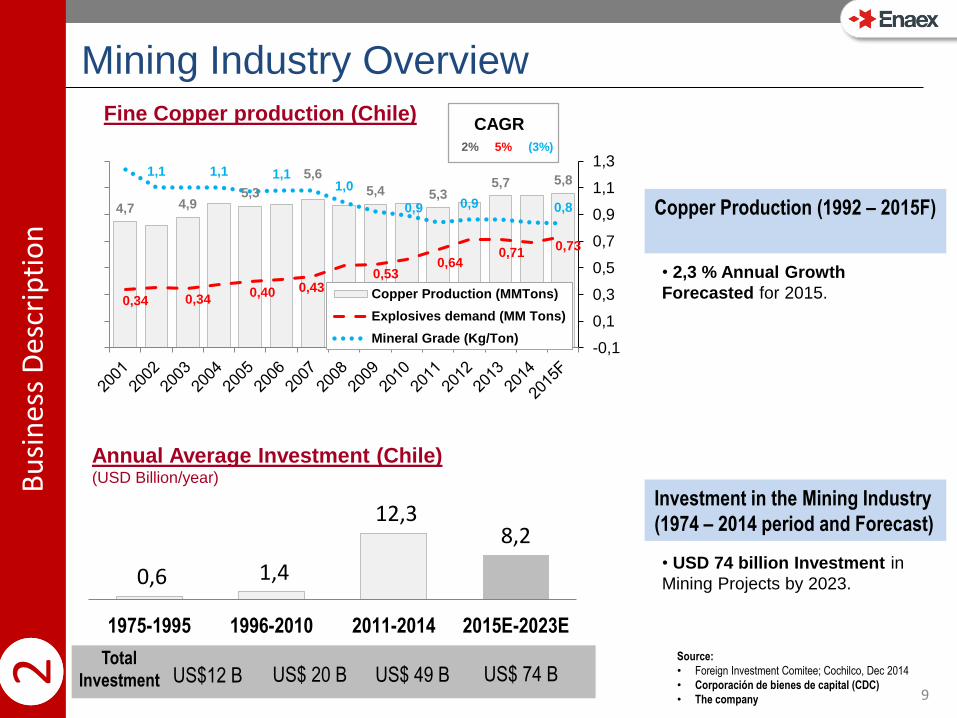
2Fine Copper production (Chile)
CAGR
2% 5% (3%)
Annual Average Investment (Chile)(USD Billion/year)
• 2,3 % Annual Growth
Forecasted for 2015.
Copper Production (1992 – 2015F)
US$12 B US$ 49 B US$ 20 BTotal
Investment
Source:
• Foreign Investment Comitee; Cochilco, Dec 2014
• Corporación de bienes de capital (CDC)
• The company
• USD 74 billion Investment in
Mining Projects by 2023.
Investment in the Mining Industry
(1974 – 2014 period and Forecast)
US$ 74 B
0,6 1,4
12,3 8,2
1975-1995 1996-2010 2011-2014 2015E-2023E

42%
34%
11%
10%3%
Bulk (ANFO, Emulsions)
Ammonium Nitrate
Cartridge (Dynamites, APD, Emulsions)
Blasting services and Technical consultancy
Others
78%
22%
National
International
Ammonium Nitrate & Explosives and SalesB
usi
nes
s D
escr
ipti
on
2
10
SalesRevenue by
Market
Sales Revenue by
Product / Service
Local PhysicalSales (th tons) Exports (th tons)
4522 22
13 15
117
45
19 2113
9
108
Perú Argentina México Bolivia Others Total
jun-14 jun-15
515 558 593597
613635
2010 2011 2012 2013 2014 LTM
* June 2015 Results
* June 2015 Results

Main CustomersB
usi
nes
s D
escr
ipti
on
12
Since 1922
Since 2000
Since 1988
Since 1995
Since 1986
Since 2012
Since 1992
11

ENAEX IN THE WORLD3

SubsidiariesEN
AEX
IN T
HE
WO
RLD
1
14
3Enaex Argentina (Since 2007)
• 2 Explosives distribution center.
• 2 Plants (ANFO and Emulsions)
Enaex Colombia (Since 2008)
• Joint Venture with INDUMIL
• Plant delivered with know how of Enaex (Cartridge Emulsions)
• Contract for 10 years
Britanite (Since 2012)
• Brazilian company with over 50 years of experience in explosives
manufacture for civil works & blasting services for open air and
underground Brazilian mining industry.
• Market Share: 40%
Chemtrade (Since 2014)
• 80% of ownership
• 1 Plant (non-electric / electric detonators)
• 4 year contract with Antamina (biggest mine un Peru)
Davey Bickford (Since 2015)
• 91% of the ownership
• World leader in electronic initiation system for mining
• 1 Plant with phyrotechnic components and electronic detonators

INNOVATION AND SUSTAINABLILITY4
15

INDUSTRY CHALLENGESIN
NO
VA
TIO
N A
ND
SU
STA
INA
BIL
ITY
1
16
4
Deep mining solutions
Hidrex® Panfex®
High Rock Fragmentation Products
Prillex ULD®
Energex®
Site-specific solutions
Milodon® Truck UBT Truck Bulk Blasting
MDL Projects Blast Site Watch®
Buffer Blast control
Explosives carbon footprint
So
cia
l
Re
sp
on
ab
ilit
yM
ine
ral G
rad
eE
ne
rgy a
nd
wa
ter
Pro
du
cti
vit
y
↓4 MM tCO2
COMPETITIVITY FACTOR ENAEX IN ACTION

PRILLEX EXPANSION PROJECT5
17

PANNA 5 - MejillonesP
RIL
LEX
EX
PAN
SIO
N P
RO
JEC
T1
18
5
350,000
MT / year
New Ammonium
Nitrate Plant
Feb - 2014
Approved
Environmental
Impact Assessment
350Million USD
Investment
Amount
1,200,000
MT / year
Complex
CapacitySTARTING

19
FINANCIAL SUMMARY6

70 77 79 91 94 99 97
2009 2010 2011 2012 2013 2014 LTM
92 110 142 152 150 154 158
2009 2010 2011 2012 2013 2014 LTM
312 409
575 641 648 646 689
2009 2010 2011 2012 2013 2014 LTM
Financial HighlightsFI
NA
NC
IAL
SUM
MA
RY
1
20
4
Market Cap(US$ millions)
Revenues(US$ millions)
EBITDA(US$ millions)
Net Profit(US$ millions)
* June 2015 Results
780
1.350 1.420 1.552 1.329 1.358 1.251
2009 2010 2011 2012 2013 2014 LTM

0,71 0,700,55 0,57
0,70
0,0
0,5
1,0
1,5
2,0
2011 2012 2013 2014 LTM
1,201,00
0,740,60
1,28
0,0
0,5
1,0
1,5
2,0
2011 2012 2013 2014 LTM
Conservative Financial PositionFI
NA
NC
IAL
SUM
MA
RY
1
21
4Financial Statements(US$ Millions)
Financial Debt/ EBITDA NFD / EBITDA Leverage
ROA: ROE:
AA-Stable
Outlook
AA-Stable
Outlook
Credit Rating(Local)
10% 19%Profitability Ratios:
* June 2015 Results
Balance Sheet 2013 2014 jun-15
Total Current Assets 289 335 467
Total Non Current Assets 504 501 591
Total Assets 793 836 1058
Total Current Liabilities 148 176 282
Total Non Current Liabilities 134 125 246
Total Equity 511 533 530
Total Equity and Liabilities 793 836 1.058
1,501,30
1,10 1,20
2,36
0,0
0,5
1,0
1,5
2,0
2,5
3,0
2011 2012 2013 2014 LTM