Corporate Presentation March 2018 - Cobalt27 … Presentation March 2018 1 | TSXV: KBLT | FSE: 27O...
36
0 www.co27.com | TSXV: KBLT | FSE: 27O Corporate Presentation May 2018
Transcript of Corporate Presentation March 2018 - Cobalt27 … Presentation March 2018 1 | TSXV: KBLT | FSE: 27O...

0 www.co27.com | TSXV: KBLT | FSE: 27O
Corporate Presentation May 2018

1 www.co27.com | TSXV: KBLT | FSE: 27O
Forward-Looking Statements Certain statements contained in this presentation constitute “forward-looking
information” or “forward-looking statements” (collectively, “forward-looking
statements”) within the meaning of applicable Canadian and United States
securities laws relating to, without limitation, expectations, intentions, plans
and beliefs, including information as to the future events, results of operations
and the Company’s future performance (both operational and financial) and
business prospects. In certain cases, forward-looking statements can be
identified by the use of words such as “expects”, “estimates”, “forecasts”,
“intends”, “anticipates”, “believes”, “plans”, “seeks”, “projects” or variations of
such words and phrases, or state that certain actions, events or results “may”
or “will” be taken, occur or be achieved. Such forward-looking statements
reflect the Company’s beliefs, estimates and opinions regarding its future
growth, results of operations, future performance (both operational and
financial), and business prospects and opportunities at the time such
statements are made, and the Company undertakes no obligation to update
forward-looking statements if these beliefs, estimates and opinions or
circumstances should change. Forward-looking statements are necessarily
based upon a number of estimates and assumptions made by the Company
that are inherently subject to significant business, economic, competitive,
political and social uncertainties and contingencies. Forward-looking statements
are not guarantees of future performance. In particular, this presentation
contains forward-looking statements pertaining, but not limited, to: the
completion, size, expenses and timing of the offering of common shares by the
Company and the use of proceeds therefrom; expectations regarding the price
of cobalt and sensitivity to changes in such prices; industry conditions and
outlook pertaining to the cobalt market; expectations respecting future
competitive conditions; industry activity levels; and the Company’s objectives,
strategies and competitive strengths.
By their nature, forward-looking statements involve numerous current
assumptions, known and unknown risks, uncertainties and other factors which
may cause the actual results, performance or achievements of the Company to
differ materially from those anticipated by the Company and described in the
forward-looking statements.
With respect to the forward-looking statements contained in this presentation,
assumptions have been made regarding, among other things: cobalt market
prices; future cobalt prices; future global economic and financial conditions;
future commodity prices, demand for cobalt and the product mix of such
demand and levels of activity in the battery metals industry and in such other
areas in which the Company may operate, and supply of cobalt and the
product mix of such supply; the accuracy and veracity of information and
projections sourced from third parties respecting, among other things, future
industry conditions and demand for cobalt; and, where applicable, each of
those assumptions set forth in the footnotes provided herein in respect of
particular forward-looking statements.
Although the Company has attempted to identify important factors that could
cause actual actions, events or results to differ materially from those described
in its forward-looking statements, there may be other factors that cause
actions, events or results not to be as anticipated, estimated or intended.
There can be no assurance that forward-looking statements will materialize or
prove to be accurate, as actual results and future events could differ materially
from those anticipated in such statements. The forward-looking statements
contained in this presentation are expressly qualified by this cautionary
statement. Readers should not place undue reliance on forward-looking
statements. These statements speak only as of the date of this presentation.
Except as may be required by law, the Company expressly disclaims any
intention or obligation to revise or update any forward-looking statements or
information whether as a result of new information, future events or otherwise.
Disclaimer
2 www.co27.com | TSXV: KBLT | FSE: 27O
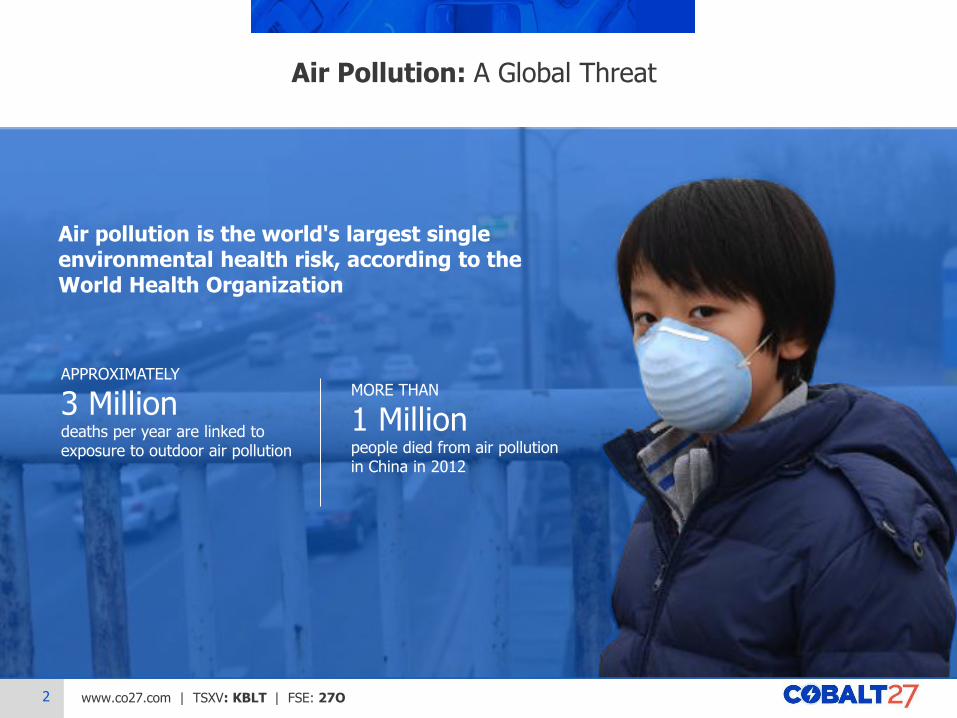
Air Pollution: A Global Threat
Air pollution is the world's largest single environmental health risk, according to the World Health Organization
APPROXIMATELY
3 Million deaths per year are linked to exposure to outdoor air pollution
MORE THAN
1 Million people died from air pollution in China in 2012

3 www.co27.com | TSXV: KBLT | FSE: 27O
The Need for Change
Greenhouse gas emissions from transportation have risen more rapidly than any other energy end-use sector since 1970 • Approximately 80% of this is attributable
to road vehicles
Greenhouse Gas Emissions - Transportation GtCO2 Equivalent per Year
Source: International Energy Agency. GtCO2 represents gigatonne of carbon dioxide.
New technologies and more aggressive policies are needed to reduce emissions as transportation demand is expected to rise significantly
TOTAL DIRECT/INDIRECT: 4.9 (Total Direct 4.7)
TOTAL DIRECT/INDIRECT: 2.9 (Total Direct 2.8)
TOTAL DIRECT/INDIRECT: 7.1
(Total Direct 7.0)
The transportation sector is one of the largest polluters of CO2 emissions

4 www.co27.com | TSXV: KBLT | FSE: 27O
The World is Responding
Potentially massive opportunity for the cobalt-based EV industry with China’s expanding middle class
7 Chinese automakers rank in the top 20 in terms of EV unit sales
100 Million EVs by 2030 targeted by the Paris Declaration on Electro-Mobility and
Climate Change
Could require an increase of
>4x current annual cobalt production
TODAY 2030
Gas/Diesel Vehicles Ban Governments are responding by banning the sales of gasoline and diesel vehicle by:
2025 Norway and Netherlands
2030 India and Germany
2040 UK and France
TBA China is working with regulators to set a timeline
39+ Automakers have invested in electric and plug-in hybrid electric
vehicles
The vast majority of these are utilizing battery technology involving cobalt
Volvo has pledged to manufacture only electric and hybrid vehicles by 2019
China has set a target that would see zero emission vehicles
10% of new sales by 2019
12% of new sales by 2020

5 www.co27.com | TSXV: KBLT | FSE: 27O
Investment Highlights
Strong cobalt fundamentals - direct
exposure to EV adoption
• Growing demand for electric vehicles (EVs) and energy storage expected to drive demand for battery metals, particularly cobalt
• Strong cobalt demand coupled with challenged supply supports potential cobalt price appreciation
Pure-play cobalt investment vehicle
• Direct leverage through physical cobalt
• Growth through streams and royalties
• Limited exposure to operational and capital risks
• Few investment alternatives providing exposure to cobalt
• Cash Flow-Linked Dividend Policy; Intention to Adopt Normal Course Issuer Bid
Growth through streams and royalties
• Opportunity to accretively grow value of cobalt holdings and cash flow per share
• Cash flowing Cobalt-Nickel Stream on producing Ramu Nickel-Cobalt Mine
• NSR on construction-ready Ni-Co project; GRR1 on construction-ready Sc-Co project
• 8 royalties on exploration stage projects
• Ongoing discussions with potential streaming counterparties
Transparent plan with experienced
management team
• Intends to hold physical cobalt and grow a portfolio of streams and royalties
• Experienced management team and Board with significant streaming, royalty and capital raising experience; advisory board of industry experts
• Low overhead expenses
Physical cobalt position with
stream and royalty upside potential
(1) Gross Revenue Royalty
6 www.co27.com | TSXV: KBLT | FSE: 27O
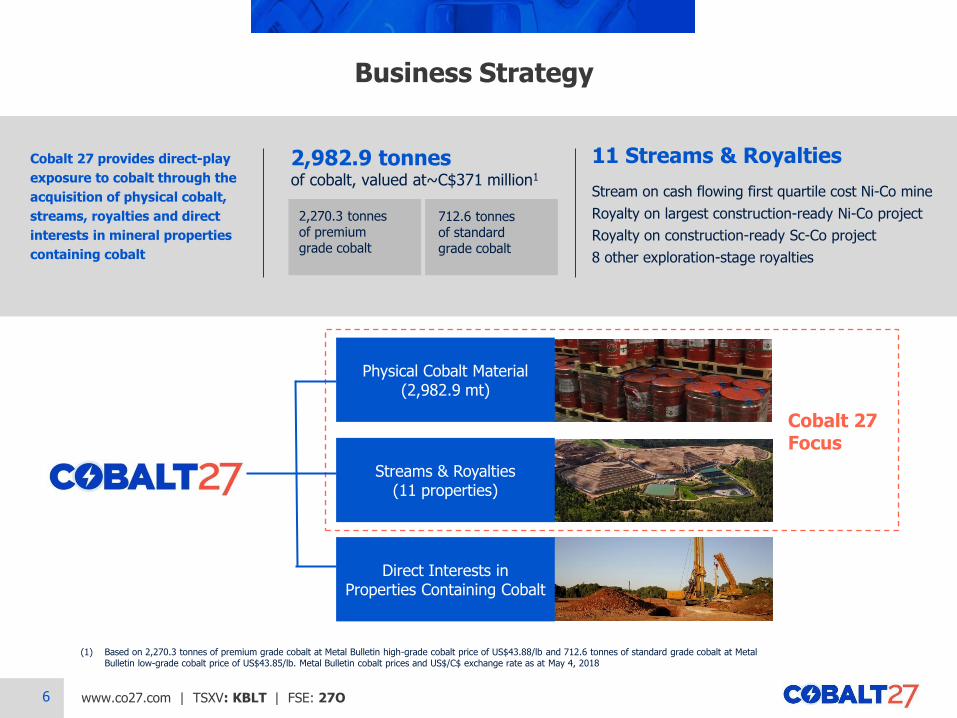
2,982.9 tonnes of cobalt, valued at~C$371 million1
Business Strategy
Physical Cobalt Material (2,982.9 mt)
Cobalt 27 provides direct-play
exposure to cobalt through the
acquisition of physical cobalt,
streams, royalties and direct
interests in mineral properties
containing cobalt
2,270.3 tonnes of premium grade cobalt
11 Streams & Royalties
Stream on cash flowing first quartile cost Ni-Co mine
Royalty on largest construction-ready Ni-Co project
Royalty on construction-ready Sc-Co project
8 other exploration-stage royalties
712.6 tonnes of standard grade cobalt
Streams & Royalties (11 properties)
Direct Interests in Properties Containing Cobalt
Cobalt 27 Focus
(1) Based on 2,270.3 tonnes of premium grade cobalt at Metal Bulletin high-grade cobalt price of US$43.88/lb and 712.6 tonnes of standard grade cobalt at Metal Bulletin low-grade cobalt price of US$43.85/lb. Metal Bulletin cobalt prices and US$/C$ exchange rate as at May 4, 2018

7 www.co27.com | TSXV: KBLT | FSE: 27O
SECTION I
Compelling Cobalt Fundamentals
8 www.co27.com | TSXV: KBLT | FSE: 27O
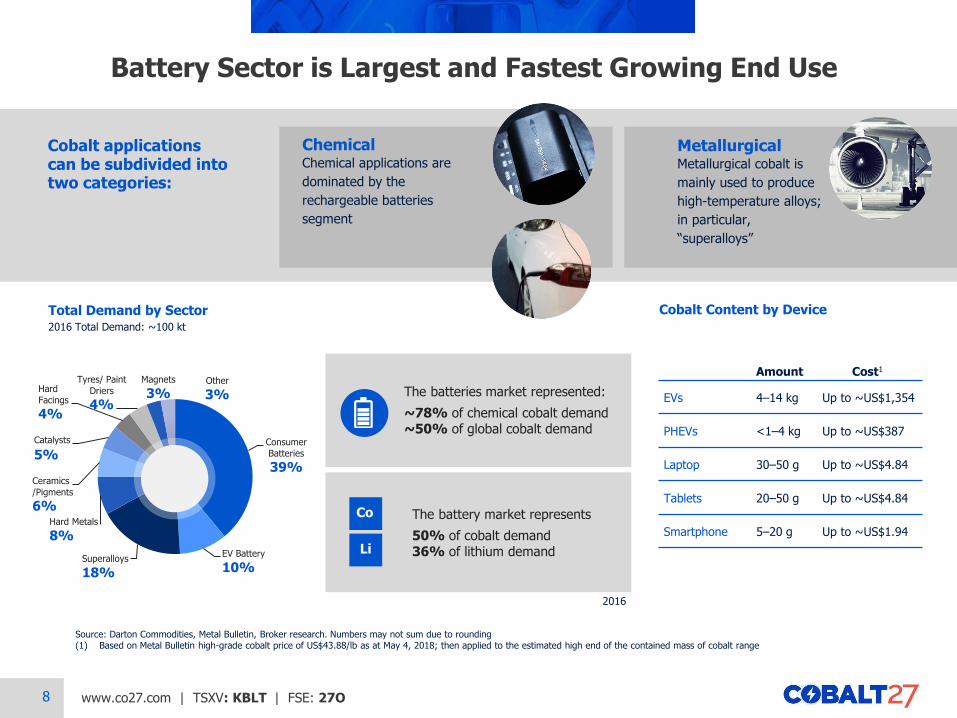
Battery Sector is Largest and Fastest Growing End Use
Cobalt Content by Device
Amount Cost1
EVs 4–14 kg Up to ~US$1,354
PHEVs <1–4 kg Up to ~US$387
Laptop 30–50 g Up to ~US$4.84
Tablets 20–50 g Up to ~US$4.84
Smartphone 5–20 g Up to ~US$1.94
Total Demand by Sector 2016 Total Demand: ~100 kt
Cobalt applications can be subdivided into two categories:
Chemical Chemical applications are
dominated by the
rechargeable batteries
segment
Consumer
Batteries
39%
EV Battery
10% Superalloys
18%
Hard Metals
8%
Ceramics
/Pigments
6%
Catalysts
5%
Hard
Facings
4%
Tyres/ Paint
Driers
4%
Magnets
3% Other
3%
Metallurgical Metallurgical cobalt is
mainly used to produce
high-temperature alloys;
in particular,
“superalloys”
The batteries market represented:
~78% of chemical cobalt demand ~50% of global cobalt demand
The battery market represents
50% of cobalt demand 36% of lithium demand
Co
Li
Source: Darton Commodities, Metal Bulletin, Broker research. Numbers may not sum due to rounding (1) Based on Metal Bulletin high-grade cobalt price of US$43.88/lb as at May 4, 2018; then applied to the estimated high end of the contained mass of cobalt range
2016
9 www.co27.com | TSXV: KBLT | FSE: 27O
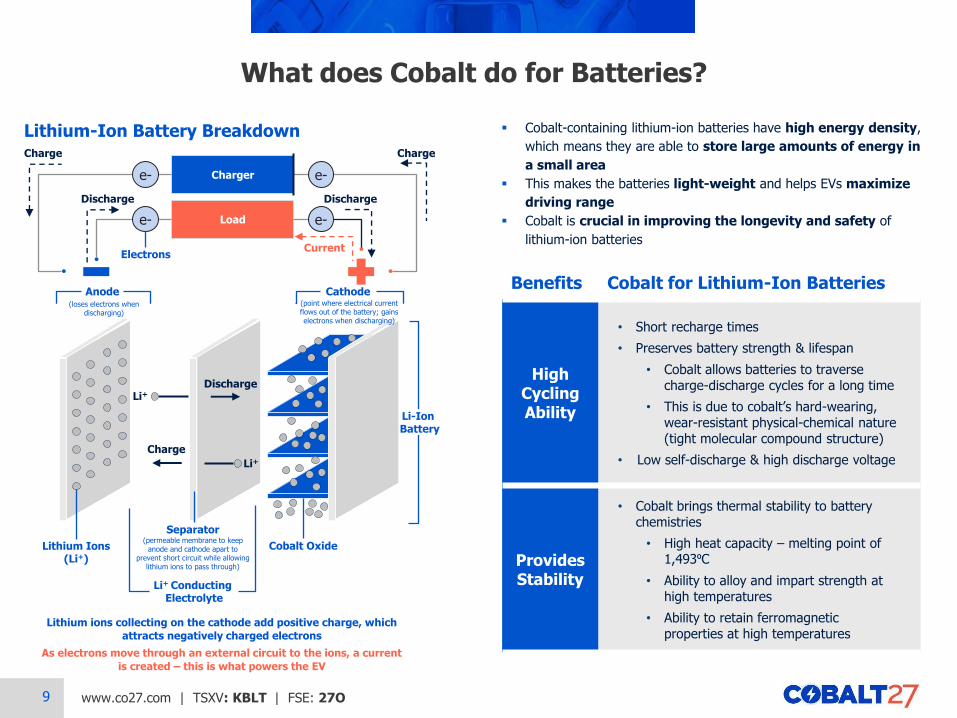
What does Cobalt do for Batteries?
High Cycling Ability
• Short recharge times
• Preserves battery strength & lifespan
• Cobalt allows batteries to traverse charge-discharge cycles for a long time
• This is due to cobalt’s hard-wearing, wear-resistant physical-chemical nature (tight molecular compound structure)
• Low self-discharge & high discharge voltage
Provides Stability
• Cobalt brings thermal stability to battery chemistries
• High heat capacity – melting point of 1,493⁰C
• Ability to alloy and impart strength at high temperatures
• Ability to retain ferromagnetic properties at high temperatures
Cobalt Oxide
Li+
Discharge
Charge
Anode
Separator (permeable membrane to keep
anode and cathode apart to prevent short circuit while allowing
lithium ions to pass through)
Li+
Cathode
Li+ Conducting
Electrolyte
Charger
Load
Discharge Discharge
e- e-
e- e-
Charge Charge
Cobalt-containing lithium-ion batteries have high energy density,
which means they are able to store large amounts of energy in
a small area
This makes the batteries light-weight and helps EVs maximize
driving range
Cobalt is crucial in improving the longevity and safety of
lithium-ion batteries
Benefits Cobalt for Lithium-Ion Batteries
Lithium Ions (Li+)
Lithium ions collecting on the cathode add positive charge, which
attracts negatively charged electrons
As electrons move through an external circuit to the ions, a current
is created – this is what powers the EV
Li-Ion Battery
Lithium-Ion Battery Breakdown
(loses electrons when discharging)
(point where electrical current flows out of the battery; gains electrons when discharging)
Electrons Current

10 www.co27.com | TSXV: KBLT | FSE: 27O
Battery Type
LCO (Lithium-Cobalt-Oxide)
NMC (Nickel-Manganese-Cobalt)
NCA (Nickel-Cobalt-Aluminum)
LMO (Lithium-Manganese-Oxide)
LFP (Lithium-Iron-Phosphate)
Common Uses &
Features
Uses: smartphones,
laptops, tablets,
cameras, wearables
Higher energy
density, shorter life
span
Uses: EVs, grid
storage, power tools,
medical devices
Higher life span,
higher power
Uses: EVs,
e-bikes, portable
computers, grid
storage
Higher energy
density, higher cost
Uses: EVs, grid
storage
Low energy density,
lower cost
Uses: EVs, tools, grid
storage and
e-bikes
Long life span, low
energy density
Batteries with cobalt-based chemistries typically have high energy densities
More cobalt than lithium contained in LCO, NMC, and NCA batteries
Types of Lithium-Ion Batteries
Source: Avicenne Energy Analysis 2014, Broker research, Darton Commodities, Tesla
Cobalt %
60% 19% 9%
73% EV Battery Market Share
73% of EVs sold in 2016 contain cobalt-containing batteries
Chinese vehicle manufacturers’ preference is changing from LFP to NMC in order to receive subsidies
Co Li Other
11 www.co27.com | TSXV: KBLT | FSE: 27O
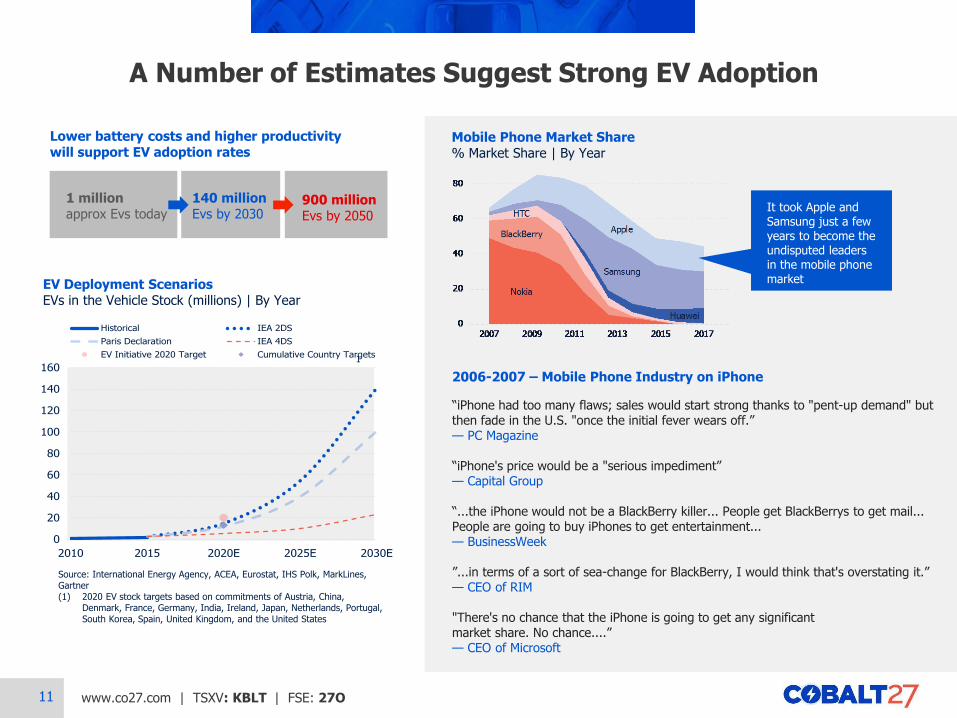
Lower battery costs and higher productivity will support EV adoption rates
A Number of Estimates Suggest Strong EV Adoption
140 million Evs by 2030
900 million Evs by 2050
1 million approx Evs today
Source: International Energy Agency, ACEA, Eurostat, IHS Polk, MarkLines, Gartner (1) 2020 EV stock targets based on commitments of Austria, China,
Denmark, France, Germany, India, Ireland, Japan, Netherlands, Portugal, South Korea, Spain, United Kingdom, and the United States
EV Deployment Scenarios EVs in the Vehicle Stock (millions) | By Year
0
20
40
60
80
100
120
140
160
2010 2015 2020E 2025E 2030E
Historical IEA 2DS
Paris Declaration IEA 4DS
EV Initiative 2020 Target Cumulative Country Targets1
Mobile Phone Market Share % Market Share | By Year
It took Apple and Samsung just a few years to become the undisputed leaders in the mobile phone market
2006-2007 – Mobile Phone Industry on iPhone Launch & Sales
PC Magazine argued iPhone had too many flaws; sales would start strong thanks to
"pent-up demand" but then fade in the U.S. "once the initial fever wears off."
Capital Group argued iPhone's price would be a "serious impediment" to competing
against what was essentially a no-cost phone like the RAZR.
BusinessWeek stated the iPhone would not be a BlackBerry killer as some had
predicted because the two devices were intended for two different markets. "People
get BlackBerrys to get mail, specifically corporate e-mail. People are going to buy
iPhones to get entertainment, with mail as a bonus. The products live in almost totally
disjoint worlds."
CEO of RIM predicted the impact of the iPhone on their business would be minimal.
"It's kind of one more entrant into an already very busy space with lots of choice for
consumers. But in terms of a sort of sea-change for BlackBerry, I would think that's
overstating it."
CEO of Microsoft said, "There's no chance that the iPhone is going to get any
significant market share. No chance. They may make a lot of money. But if you
actually take a look at the 1.3 billion phones that get sold, I'd prefer to have our
software in 60% or 70% or 80% of them, than I would to have 2% or 3%, which is what
Apple might get."
2006-2007 – Mobile Phone Industry on iPhone
“iPhone had too many flaws; sales would start strong thanks to "pent-up demand" but then fade in the U.S. "once the initial fever wears off.” — PC Magazine “iPhone's price would be a "serious impediment” — Capital Group “...the iPhone would not be a BlackBerry killer... People get BlackBerrys to get mail... People are going to buy iPhones to get entertainment... — BusinessWeek ”...in terms of a sort of sea-change for BlackBerry, I would think that's overstating it.” — CEO of RIM "There's no chance that the iPhone is going to get any significant market share. No chance....” — CEO of Microsoft
12 www.co27.com | TSXV: KBLT | FSE: 27O
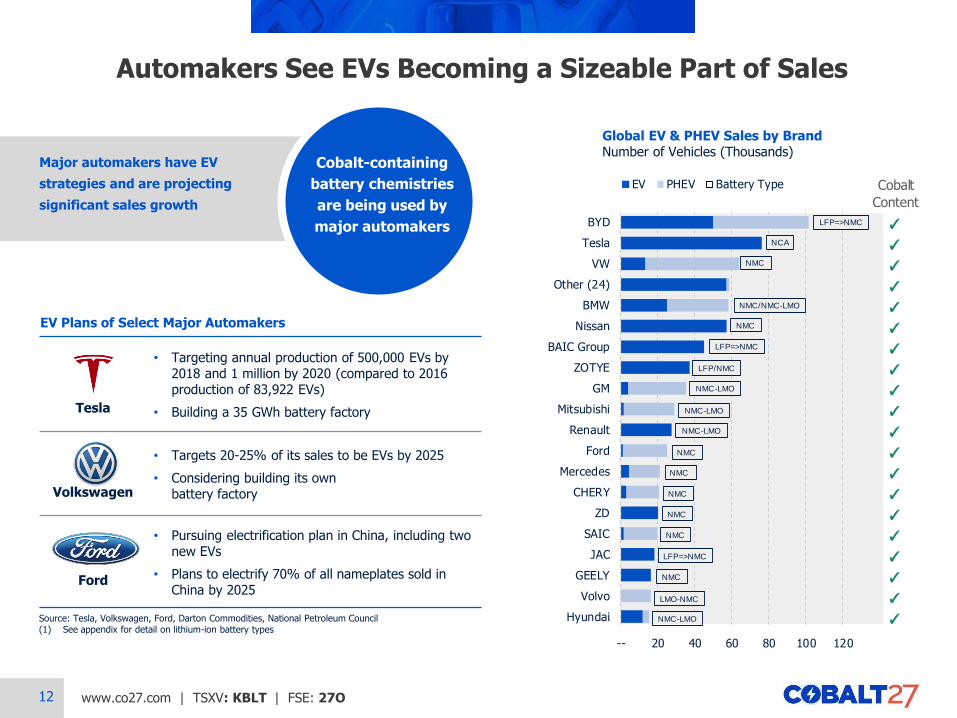
Major automakers have EV
strategies and are projecting
significant sales growth
Tesla
• Targeting annual production of 500,000 EVs by 2018 and 1 million by 2020 (compared to 2016 production of 83,922 EVs)
• Building a 35 GWh battery factory
Volkswagen
• Targets 20-25% of its sales to be EVs by 2025
• Considering building its own battery factory
Ford
• Pursuing electrification plan in China, including two new EVs
• Plans to electrify 70% of all nameplates sold in China by 2025
Global EV & PHEV Sales by Brand Number of Vehicles (Thousands)
Source: Tesla, Volkswagen, Ford, Darton Commodities, National Petroleum Council (1) See appendix for detail on lithium-ion battery types
EV Plans of Select Major Automakers
Automakers See EVs Becoming a Sizeable Part of Sales
1 Cobalt
Content
✓
✓
✓
✓
✓
✓
✓
✓
✓
✓
✓
✓
✓
✓
✓
✓
✓
✓
✓
✓
-- 20 40 60 80 100 120
BYD
Tesla
VW
Other (24)
BMW
Nissan
BAIC Group
ZOTYE
GM
Mitsubishi
Renault
Ford
Mercedes
CHERY
ZD
SAIC
JAC
GEELY
Volvo
Hyundai
EV PHEV Battery Type
LFP=>NMC
NCA
NMC
NMC/NMC-LMO
NMC
LFP=>NMC
LFP/NMC
NMC-LMO
NMC-LMO
NMC-LMO
NMC
NMC
NMC
NMC
NMC
LFP=>NMC
NMC
NMC-LMO
LMO-NMC
Cobalt-containing
battery chemistries
are being used by
major automakers

13 www.co27.com | TSXV: KBLT | FSE: 27O
• Cost parity with ICE vehicles is assumed by 2025
‒ ~140 Tesla-sized gigafactories required by 2035 to satisfy battery demand in an optimistic scenario
• Increased demand for cobalt in lithium ion batteries is expected as EV adoption continues to ramp up
‒ NMC and NCA consumption expected to grow the fastest due to their strong power, range and safety characteristics
0
5,000
10,000
15,000
20,000
25,000
30,000
35,000
2010 2016 2016 2020E
+110%
+169%
Surging Demand for Cobalt in Batteries
Cobalt Consumption by Battery Type
Metric Tonnes
Source: Broker research, Darton Commodities LCO NMC+NCA
Cobalt Demand in Li-Ion Batteries Metric Tonnes | %
49%53%
59%
20%
30%
40%
50%
60%
70%
80%
90%
100%
--
20,000
40,000
60,000
80,000
100,000
2016E 2018E 2020E 2022E
Total
Battery Demand as % of Overall Cobalt Demand
Forecast CAGR: 11.7%
n.a.
> 4x current annual production
Requires an increase of
Cobalt demand in Li-ion batteries expected to grow
11.7% CAGR from 2016 to 2022
14 www.co27.com | TSXV: KBLT | FSE: 27O
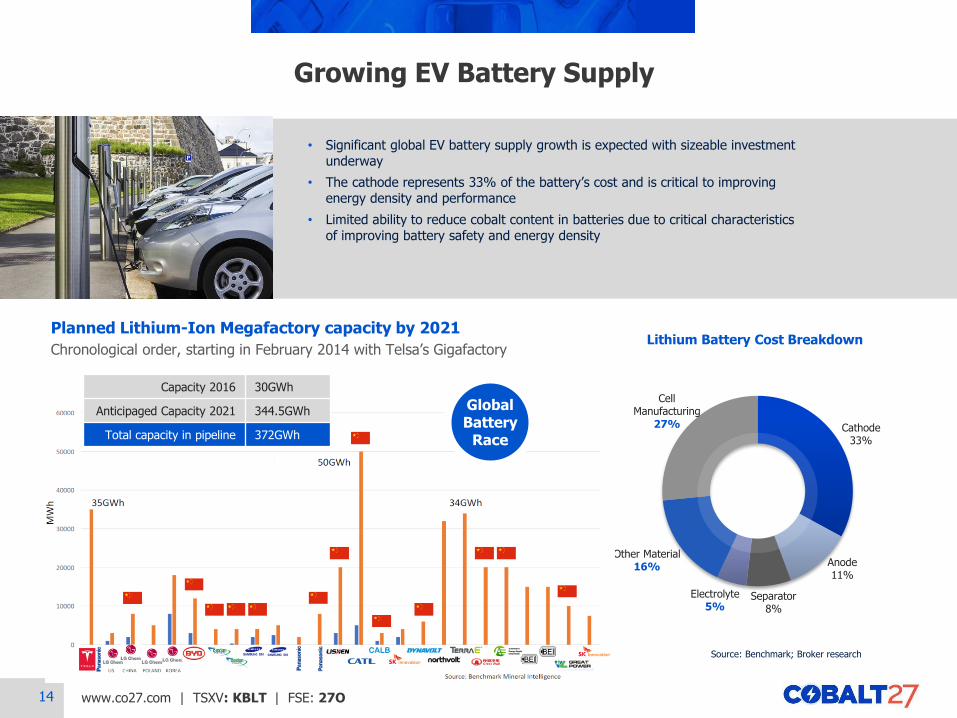
• Significant global EV battery supply growth is expected with sizeable investment underway
• The cathode represents 33% of the battery’s cost and is critical to improving energy density and performance
• Limited ability to reduce cobalt content in batteries due to critical characteristics of improving battery safety and energy density
Growing EV Battery Supply
Lithium Battery Cost Breakdown
Source: Benchmark; Broker research
Cathode 33%
Anode 11%
Separator 8%
Electrolyte 5%
Other Material 16%
Cell Manufacturing
27%
Planned Lithium-Ion Megafactory capacity by 2021
Chronological order, starting in February 2014 with Telsa’s Gigafactory
Global Battery
Race
Capacity 2016 30GWh
Anticipaged Capacity 2021 344.5GWh
Total capacity in pipeline 372GWh

15 www.co27.com | TSXV: KBLT | FSE: 27O
On the Verge of Cost Parity with ICE
Energy Density Improvements Driving Lower Costs
Source: U.S. Department of Energy, International Energy Agency, EV Obsession, HybridCARS, RethinkX
1,000
925
750
590
440325
290 268
100
100
125
60 7590
125140 150
200
295
400
0
50
100
150
200
250
300
350
400
450
500
0
200
400
600
800
1,000
1,200
2008 2009 2010 2011 2012 2013 2014 2015 2020E 2022E
En
erg
y D
en
sity
(Wh
/L)
Ba
tte
ry C
ost
(US
$/k
Wh
)
US DOE Battery Cost 2020 Tesla Battery Cost Target2022 GM Battery Cost Target 2022 Battery Cost TargetUS DOE Energy Density 2022 Energy Density Target
• EV battery costs have fallen significantly and EV battery energy density has concurrently increased
• Energy density is expected to continue to increase to 400 Wh/L by 2022 from 295 Wh/L in 2015
• Total cost-of-ownership parity with ICE vehicles is expected to be reached in Europe by 2018, in China by 2023 and in the US by 2025
• Electric motor simplicity gives EVs a significant maintenance cost advantage over the ICE
‒ Just 3 moving parts in a Chevy Bolt engine vs. 113 moving parts in a four-cylinder VW Golf ICE
Cost Per Mile US$ Per Mile
$0.38
$0.16
--
$0.10
$0.20
$0.30
$0.40
ICE Vehicle Electric Vehicle
Maintenance Depreciation
Energy Other Costs

16 www.co27.com | TSXV: KBLT | FSE: 27O
0
500
1,000
1,500
2,000
2,500
3,000
2015 2016E 2017E 2018E 2019E 2020E
Forecast CAGR: 13.8%
• Energy storage systems (ESS) represent another cobalt use expected to grow
ᅳ Used for power regulation for critical infrastructure, back-up power solutions, renewable energy systems, and smart grid applications
• Li-ion based ESS are expected to grow at a 13.8% CAGR between 2015 and 2020
• Tesla has started using NMC batteries in its 14 kWh Powerwall and 210 kWh Powerpack
Cobalt to Benefit from Energy Storage Systems Growth
Rows of solar panels in Kauai, Hawaii, where Tesla built a solar-plus-storage project
Source: Tesla, Inc., IHS Markit, Darton Commodities, US Department of Energy
Energy Storage Systems Li-ion based, in MWh/year

17 www.co27.com | TSXV: KBLT | FSE: 27O
Geographic concentration in the DRC
Majority of mined cobalt located in the DRC, a relatively politically unstable country
Lack of infrastructure has posed challenges to production
Increased focus on ethical mining
Approximately 15% of DRC output is produced by unregulated artisanal mining operations
Allegations of human rights abuses, including child labour, associated with artisanal mining have received substantial attention
Production dependent on other metals
Only 1% of mined cobalt is as the primary product; 99% as a by-product
Supply relatively less responsive to changes in cobalt prices compared to other metals
Chinese control over refined output
China currently produces over 50% of the world’s refined cobalt and 85% of cobalt oxides, salts and other chemicals
Cobalt Supply at Risk
Cobalt Production by Geography
Cobalt Production by Mine Type1
Source: Darton Commodities, CRU, UNICEF (1) 99% by-product consists of 67% copper mines by-product and 32% nickel mines by-product
2016 Mined Output: 109 kt
DRC 65%
Cuba 5%
Philippines 4%
Australia 4%
Russia 5%
Other 17%
99% of cobalt is mined as a by-product
18 www.co27.com | TSXV: KBLT | FSE: 27O
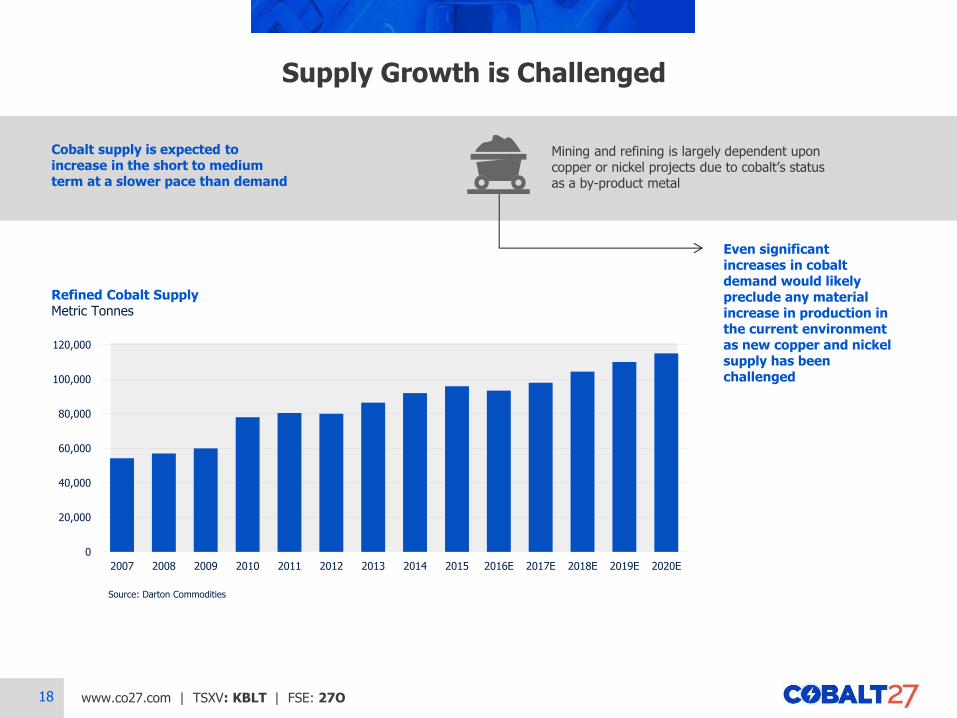
Supply Growth is Challenged
Refined Cobalt Supply Metric Tonnes
0
20,000
40,000
60,000
80,000
100,000
120,000
2007 2008 2009 2010 2011 2012 2013 2014 2015 2016E 2017E 2018E 2019E 2020E
Source: Darton Commodities
Cobalt supply is expected to increase in the short to medium term at a slower pace than demand
Mining and refining is largely dependent upon copper or nickel projects due to cobalt’s status as a by-product metal
Even significant increases in cobalt demand would likely preclude any material increase in production in the current environment as new copper and nickel supply has been challenged
19 www.co27.com | TSXV: KBLT | FSE: 27O
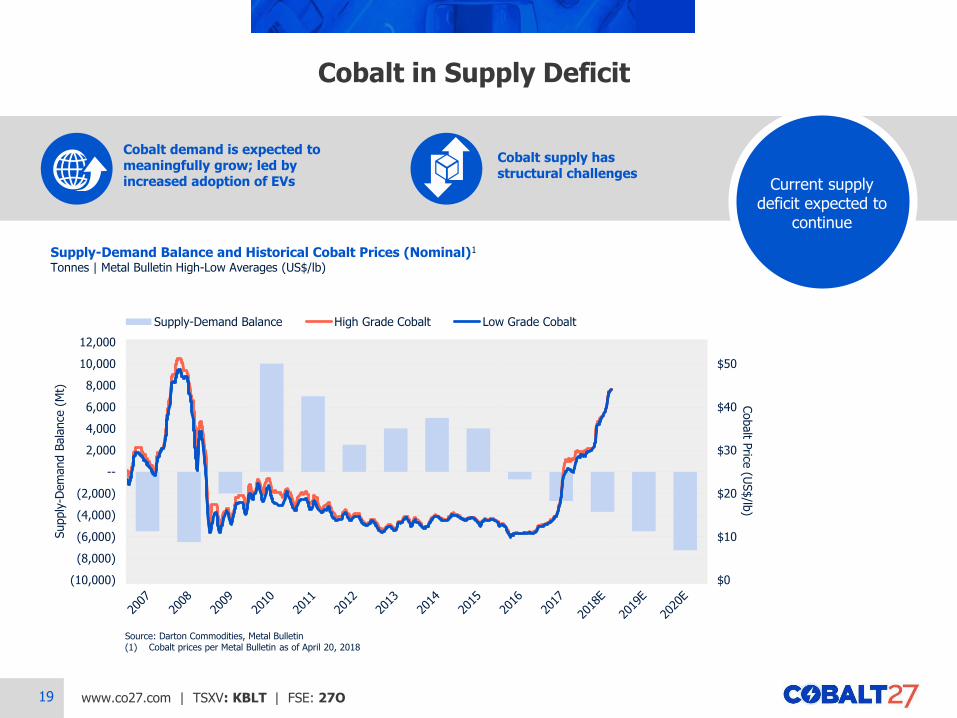
Cobalt demand is expected to meaningfully grow; led by increased adoption of EVs
Cobalt in Supply Deficit
Source: Darton Commodities, Metal Bulletin (1) Cobalt prices per Metal Bulletin as of April 20, 2018
Supply-Demand Balance and Historical Cobalt Prices (Nominal)1
Tonnes | Metal Bulletin High-Low Averages (US$/lb)
Current supply deficit expected to
continue
Cobalt supply has structural challenges
$0
$10
$20
$30
$40
$50
(10,000)
(8,000)
(6,000)
(4,000)
(2,000)
--
2,000
4,000
6,000
8,000
10,000
12,000
Cobalt P
rice (U
S$/lb
)
Supply
-Dem
and B
ala
nce
(M
t)
Supply-Demand Balance High Grade Cobalt Low Grade Cobalt
20 www.co27.com | TSXV: KBLT | FSE: 27O
--
$10
$20
$30
$40
$50
$60
$70
Real, 2018 US$ Nominal
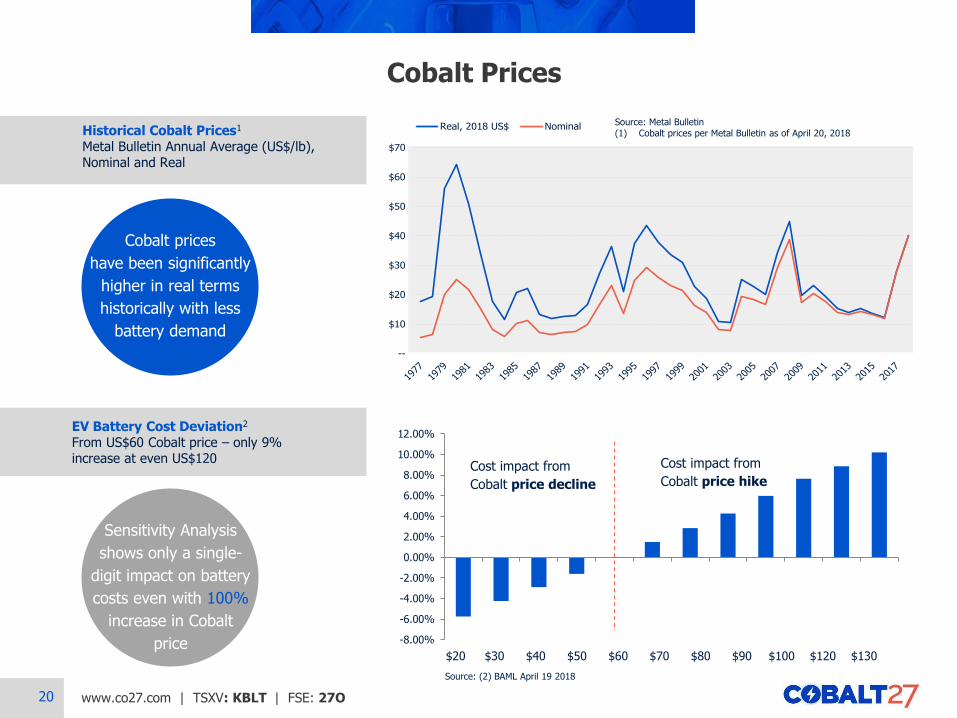
Cobalt Prices
Historical Cobalt Prices1
Metal Bulletin Annual Average (US$/lb), Nominal and Real
Cobalt prices
have been significantly
higher in real terms
historically with less
battery demand
Source: Metal Bulletin (1) Cobalt prices per Metal Bulletin as of April 20, 2018
-8.00%
-6.00%
-4.00%
-2.00%
0.00%
2.00%
4.00%
6.00%
8.00%
10.00%
12.00%EV Battery Cost Deviation2
From US$60 Cobalt price – only 9% increase at even US$120
Cost impact from
Cobalt price decline
Cost impact from
Cobalt price hike
$20 $30 $40 $50 $60 $70 $80 $90 $100 $120 $130
Source: (2) BAML April 19 2018
Sensitivity Analysis
shows only a single-
digit impact on battery
costs even with 100%
increase in Cobalt
price

21 www.co27.com | TSXV: KBLT | FSE: 27O
SECTION II
A Pure-Play Cobalt Vehicle

22 www.co27.com | TSXV: KBLT | FSE: 27O
Corporate Timeline
MAR 9, 2018 completed strategic private placement; 17,556,828 Shares sold at $11.40 per Share for aggregate gross proceeds of $200,147,842
JUN 23, 2017 closed $200.0 Mil initial offering of 2,222,225 Shares at $9.00 per share. JUN 27, 2017 Anthony Milewski, Chairman & CEO, appointed to London Metal Exchange’s Cobalt Committee. JUN 29, 2017 Over-allotment option completed; additional gross proceeds of $6.3 Mil
JUL 7, 2017 acquired 7 net smelter return (“NSR”) royalties JUL 10, 2017 Company’s shares begin trading on the Frankfurt Stock Exchange under the symbol “270”
FEB 22, 2018 acquired 1.75% NSR royalty on Dumont Nickel-Cobalt project, world's largest undeveloped, permitted, and construction-ready reserves of nickel and cobalt
DEC 19, 2017 completed underwritten public offering; a total of 8.1 Mil Shares sold at $10.50 per Share for aggregate gross proceeds of $85.05 Mil DEC 21 2017 Candace MacGibbon and Justin Cochrane appointed to board of directors DEC 22, 2017 closed over-allotment option; additional gross proceeds of $12,757,500
2017 2018
JAN FEB MAR APR MAY JUN JUL AUG SEP OCT NOV DEC
MAY 7, 2018 acquired 1.5% GRR* on Flemington Co-Sc-Ni Project in Australia MAY 17, 2018 Closed US$80 Mil Revolving Credit Facility MAY 22, 2018 acquired cash flowing Co-Ni stream on producing Ramu Ni-Co Mine for US$113 Mil. Announced Dividend Policy & Intention to Adopt a Normal Course Issuer Bid
* Gross Revenue Royalty

23 www.co27.com | TSXV: KBLT | FSE: 27O
2,982.9
tonnes of cobalt
Physical Cobalt Positions
Summary of Market Value of Company’s Physical
Position and Quotes to Determine Acquisition Price
Category Position Size (mt) Mid Price
as at May 4, 20181
Total Premium 2,270.3 US$43.88/lb Co
Total Standard 712.6 US$43.85/lb Co
Total Overall 2,982.9
(1) Based on Metal Bulletin cobalt prices and US$/C$ exchange rate as at May 4, 2018.
All of the Company’s physical cobalt is
insured and stored in bonded warehouses
located in the USA and Europe
valued at
~C$371million1
2,270.3 tonnes of premium grade cobalt and 712.6 tonnes of standard grade cobalt
24 www.co27.com | TSXV: KBLT | FSE: 27O
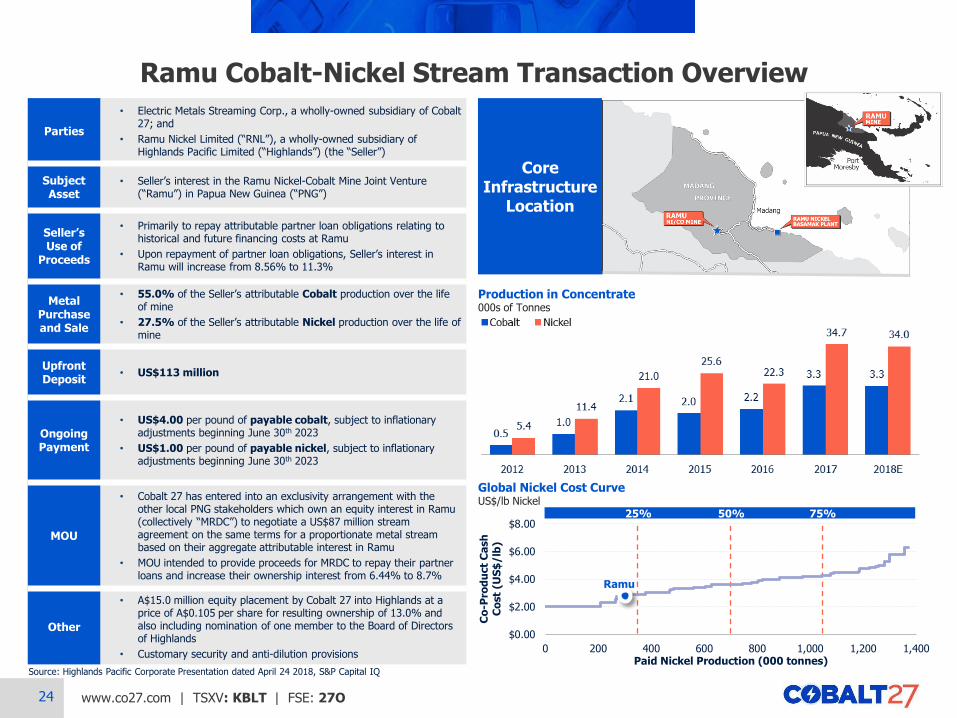
Ramu Cobalt-Nickel Stream Transaction Overview
Parties
• Electric Metals Streaming Corp., a wholly-owned subsidiary of Cobalt 27; and
• Ramu Nickel Limited (“RNL”), a wholly-owned subsidiary of Highlands Pacific Limited (“Highlands”) (the “Seller”)
Subject Asset
• Seller’s interest in the Ramu Nickel-Cobalt Mine Joint Venture (“Ramu”) in Papua New Guinea (“PNG”)
Seller’s Use of
Proceeds
• Primarily to repay attributable partner loan obligations relating to historical and future financing costs at Ramu
• Upon repayment of partner loan obligations, Seller’s interest in Ramu will increase from 8.56% to 11.3%
Metal Purchase and Sale
• 55.0% of the Seller’s attributable Cobalt production over the life of mine
• 27.5% of the Seller’s attributable Nickel production over the life of mine
Upfront Deposit
• US$113 million
Ongoing Payment
• US$4.00 per pound of payable cobalt, subject to inflationary adjustments beginning June 30th 2023
• US$1.00 per pound of payable nickel, subject to inflationary adjustments beginning June 30th 2023
MOU
• Cobalt 27 has entered into an exclusivity arrangement with the other local PNG stakeholders which own an equity interest in Ramu (collectively “MRDC”) to negotiate a US$87 million stream agreement on the same terms for a proportionate metal stream based on their aggregate attributable interest in Ramu
• MOU intended to provide proceeds for MRDC to repay their partner loans and increase their ownership interest from 6.44% to 8.7%
Other
• A$15.0 million equity placement by Cobalt 27 into Highlands at a price of A$0.105 per share for resulting ownership of 13.0% and also including nomination of one member to the Board of Directors of Highlands
• Customary security and anti-dilution provisions
Core Infrastructure
Location
Global Nickel Cost Curve US$/lb Nickel
25% 50% 75%
$0.00
$2.00
$4.00
$6.00
$8.00
0 200 400 600 800 1,000 1,200 1,400
Co
-Pro
du
ct
Ca
sh
C
ost
(US
$/lb
)
Paid Nickel Production (000 tonnes)
Ramu
Production in Concentrate 000s of Tonnes
Source: Highlands Pacific Corporate Presentation dated April 24 2018, S&P Capital IQ

25 www.co27.com | TSXV: KBLT | FSE: 27O
Overview of the Dumont Project and Royalty
Dumont Highlights
Strategically located in the established Abitibi mining camp
One of the largest undeveloped nickel and cobalt reserves
Fully permitted and in close proximity to roads, rail, an airport, and low-cost power supply
Open pit mine with a reserve life of 33 years, expected to reach commercial production around 2020
2P reserves of ~6,900 Mlbs Ni and ~278 Mlbs Co
Annual production of 33kt Ni and 1 kt Co for the 5 years; ramp up to annual production of 51 kt Ni and 2 kt Co thereafter
Royalty Highlights
Life-of-Mine 1.75% Net Smelter Returns (NSR) Royalty
Repurchase option on 0.375% of the NSR Royalty for US$15 mm, exercisable in July 2018, July 2019, or July 2020
COBALT RESERVES BENCHMARKING (KT CO)
ASSET OVERVIEW LOCATION MAP
NICKEL RESERVES BENCHMARKING (MT NI)
Producing Asset Development Asset Producing Asset Development Asset
Royalty further solidifies Cobalt 27 as the leading investment vehicle in the cobalt sector
RNC Dumont
Property
FS Pit Extent
Airports
Highways
Roads
CNR
Cities / Towns
Amos Amos
Municipal
Airport
395
111
109
Villemontel Launay
Lac La
Motte
Lac
Figuery
Lac
Obalski N
0 5 10km
QC Amos
Water
Aerodrom
e
Val-d’Or is 90 km southeast
from Dumont and 57 km
away from Amos
Source: Company filings
26 www.co27.com | TSXV: KBLT | FSE: 27O
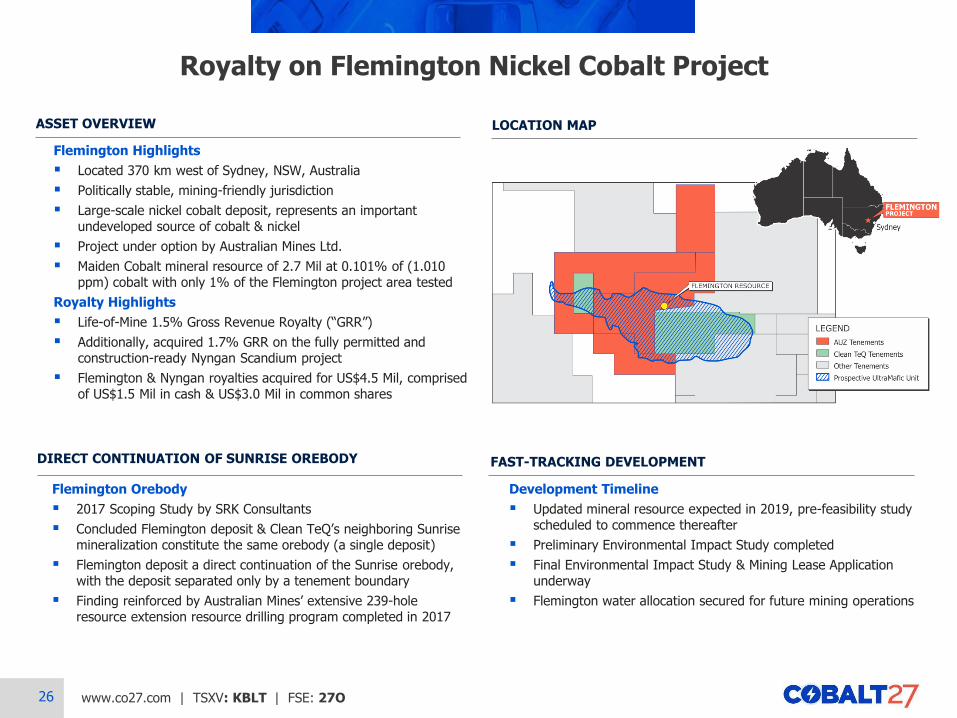
Royalty on Flemington Nickel Cobalt Project
LOCATION MAP
ASSET OVERVIEW
Flemington Highlights
Located 370 km west of Sydney, NSW, Australia
Politically stable, mining-friendly jurisdiction
Large-scale nickel cobalt deposit, represents an important undeveloped source of cobalt & nickel
Project under option by Australian Mines Ltd.
Maiden Cobalt mineral resource of 2.7 Mil at 0.101% of (1.010 ppm) cobalt with only 1% of the Flemington project area tested
Royalty Highlights
Life-of-Mine 1.5% Gross Revenue Royalty (“GRR”)
Additionally, acquired 1.7% GRR on the fully permitted and construction-ready Nyngan Scandium project
Flemington & Nyngan royalties acquired for US$4.5 Mil, comprised of US$1.5 Mil in cash & US$3.0 Mil in common shares
Flemington Orebody
2017 Scoping Study by SRK Consultants
Concluded Flemington deposit & Clean TeQ’s neighboring Sunrise mineralization constitute the same orebody (a single deposit)
Flemington deposit a direct continuation of the Sunrise orebody, with the deposit separated only by a tenement boundary
Finding reinforced by Australian Mines’ extensive 239-hole resource extension resource drilling program completed in 2017
DIRECT CONTINUATION OF SUNRISE OREBODY FAST-TRACKING DEVELOPMENT
Development Timeline
Updated mineral resource expected in 2019, pre-feasibility study scheduled to commence thereafter
Preliminary Environmental Impact Study completed
Final Environmental Impact Study & Mining Lease Application underway
Flemington water allocation secured for future mining operations
27 www.co27.com | TSXV: KBLT | FSE: 27O
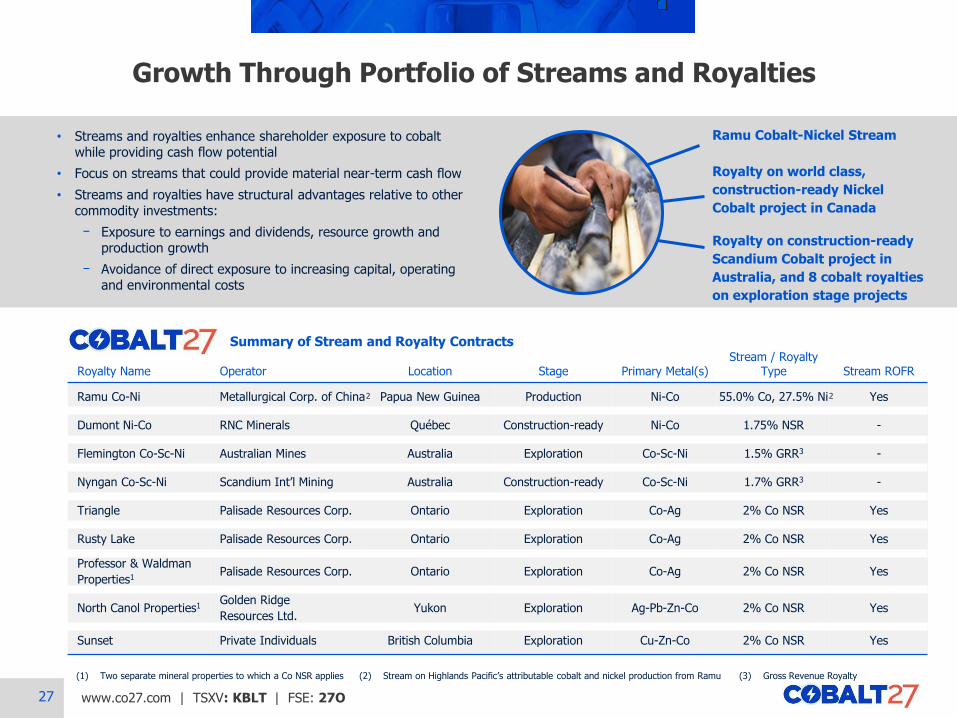
• Streams and royalties enhance shareholder exposure to cobalt while providing cash flow potential
• Focus on streams that could provide material near-term cash flow
• Streams and royalties have structural advantages relative to other commodity investments:
ᅳ Exposure to earnings and dividends, resource growth and production growth
ᅳ Avoidance of direct exposure to increasing capital, operating and environmental costs
Growth Through Portfolio of Streams and Royalties
Royalty Name Operator Location Stage Primary Metal(s) Stream / Royalty
Type Stream ROFR
Ramu Co-Ni Metallurgical Corp. of China Papua New Guinea Production Ni-Co 55.0% Co, 27.5% Ni Yes
Dumont Ni-Co RNC Minerals Québec Construction-ready Ni-Co 1.75% NSR -
Flemington Co-Sc-Ni Australian Mines Australia Exploration Co-Sc-Ni 1.5% GRR3 -
Nyngan Co-Sc-Ni Scandium Int’l Mining Australia Construction-ready Co-Sc-Ni 1.7% GRR3 -
Triangle Palisade Resources Corp. Ontario Exploration Co-Ag 2% Co NSR Yes
Rusty Lake Palisade Resources Corp. Ontario Exploration Co-Ag 2% Co NSR Yes
Professor & Waldman
Properties1 Palisade Resources Corp. Ontario Exploration Co-Ag 2% Co NSR Yes
North Canol Properties1 Golden Ridge
Resources Ltd. Yukon Exploration Ag-Pb-Zn-Co 2% Co NSR Yes
Sunset Private Individuals British Columbia Exploration Cu-Zn-Co 2% Co NSR Yes
Summary of Stream and Royalty Contracts
(1) Two separate mineral properties to which a Co NSR applies
Ramu Cobalt-Nickel Stream
Royalty on world class,
construction-ready Nickel
Cobalt project in Canada
Royalty on construction-ready
Scandium Cobalt project in
Australia, and 8 cobalt royalties
on exploration stage projects
(3) Gross Revenue Royalty (2) Stream on Highlands Pacific’s attributable cobalt and nickel production from Ramu
2 2
28 www.co27.com | TSXV: KBLT | FSE: 27O
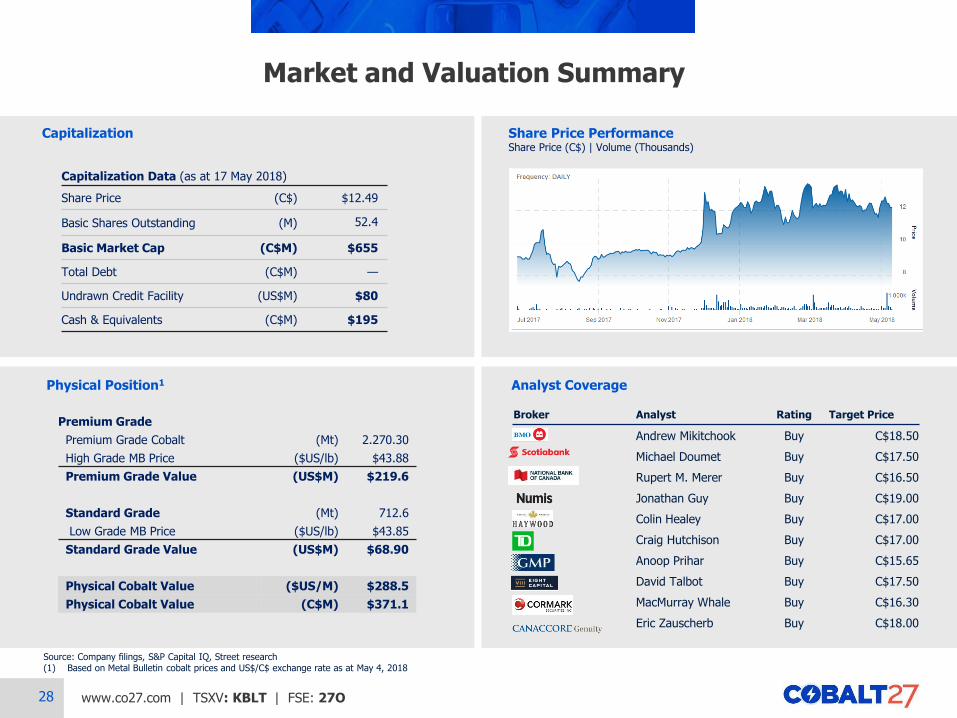
Broker Analyst Rating Target Price
Andrew Mikitchook Buy C$18.50
Michael Doumet Buy C$17.50
Rupert M. Merer Buy C$16.50
Jonathan Guy Buy C$19.00
Colin Healey Buy C$17.00
Craig Hutchison Buy C$17.00
Anoop Prihar Buy C$15.65
David Talbot Buy C$17.50
MacMurray Whale Buy C$16.30
Eric Zauscherb Buy C$18.00
Market and Valuation Summary
Source: Company filings, S&P Capital IQ, Street research (1) Based on Metal Bulletin cobalt prices and US$/C$ exchange rate as at May 4, 2018
Capitalization Share Price Performance Share Price (C$) | Volume (Thousands)
Physical Position1 Analyst Coverage
Capitalization Data (as at 17 May 2018)
Share Price (C$) $12.49
Basic Shares Outstanding (M) 52.4
Basic Market Cap (C$M) $655
Total Debt (C$M) —
Undrawn Credit Facility (US$M) $80
Cash & Equivalents (C$M) $195
Premium Grade
Premium Grade Cobalt (Mt) 2.270.30
High Grade MB Price ($US/lb) $43.88
Premium Grade Value (US$M) $219.6
Standard Grade (Mt) 712.6
Low Grade MB Price ($US/lb) $43.85
Standard Grade Value (US$M) $68.90
Physical Cobalt Value ($US/M) $288.5
Physical Cobalt Value (C$M) $371.1

29 www.co27.com | TSXV: KBLT | FSE: 27O
Anthony Milewski CHAIRMAN & CEO
Member of investment team at Pala Investments Director, advisor, founder and/or investor in multiple
mining companies
Nick French Consultant to the cobalt industry Founded SFP Metals Ltd., one of the largest cobalt traders
John Kanellitsas Vice Chairman and President of Lithium Americas Corp. Over 25 years in corporate finance and investment
management
Frank Estergaard, CPA, CA
Former KPMG partner (38 years at the firm) Director of Fission Uranium Corp
Candace MacGibbon, CPA, CA
CEO of INV Metals Inc. Former experience as CFO, Institutional Sales,
Research & Accounting
Justin Cochrane, CFA, PRESIDENT & COO 15 years of royalty & stream financing experience Former EVP of Corporate Development at Sandstorm
Gold Ltd.
Board and Management
CORPORATE FINANCE EXPERT
COBALT EXPERT
COBALT EXPERT
CORPORATE GOVERNANCE
EXPERT
MINING & FINANCE EXPERT
ROYALITY & STREAM EXPERT
Cindy Davis, CPA, Chief Financial Officer
Has provided financial reporting services since 2008
Director of Outdoor Partner Media Corporation
Management
Board of Directors
Jonathan Hykawy Founded Stormcrow Capital Limited Critical materials industry expert
Phil Day 20 years focused on mining operations and design Operated and ran multiple mining projects globally
Neil Warburton Director at Independence Group, a diversified mining
company Former CEO of Barminco Limited
Vincent Metcalfe Vice President at Osisko Gold Royalties Ltd., where he
also was previously Director of Project Evaluations Ted Miller Ford Motor Co. senior manager of energy storage and
materials strategy and research – responsible for R&D for EV’s
Mark Selby President & CEO of RNC Minerals Former VP at Quadra Mining and Inco Limited
Dr. Prabhakar Patil Former CEO of LG Chem Power Inc. Served as chief engineer for Ford's hybrid technologies
Andrew Ham Former Director of Mining Analysis at Sun Valley Gold Former Director of Mining Research/Senior Analyst at
Passport Capital
NICKEL EXPERT
BATTERY MATERIALS EXPERT
ROYALITY & STREAM EXPERT
Advisory Board
NICKEL SULFIDE & LATERITE EXPERT
MINE DEVELOPMENT & OPERATIONS
EV & ENERGY STORAGE EXPERT
NICKEL EXPERT
BATTERY EXPERT
MINING EXPERT
Diverse backgrounds
in streaming, capital
raising and cobalt
trading with public
company experience

30 www.co27.com | TSXV: KBLT | FSE: 27O
APPENDIX
Supplemental Information
31 www.co27.com | TSXV: KBLT | FSE: 27O
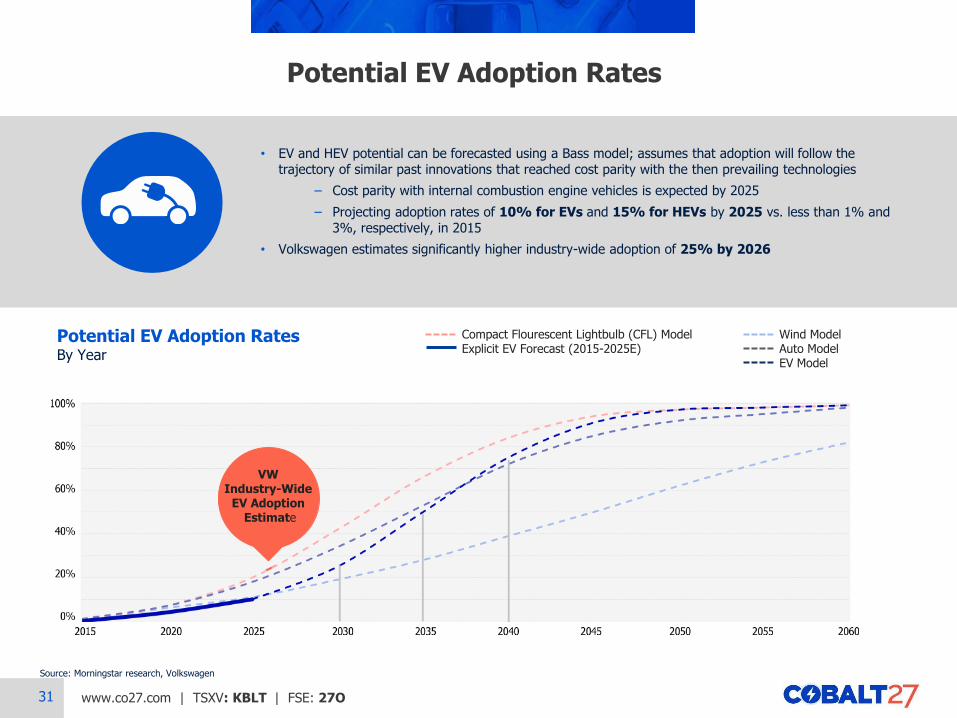
Potential EV Adoption Rates
• EV and HEV potential can be forecasted using a Bass model; assumes that adoption will follow the trajectory of similar past innovations that reached cost parity with the then prevailing technologies
‒ Cost parity with internal combustion engine vehicles is expected by 2025
‒ Projecting adoption rates of 10% for EVs and 15% for HEVs by 2025 vs. less than 1% and 3%, respectively, in 2015
• Volkswagen estimates significantly higher industry-wide adoption of 25% by 2026
Potential EV Adoption Rates By Year
Source: Morningstar research, Volkswagen
VW Industry-Wide
EV Adoption Estimate
Compact Flourescent Lightbulb (CFL) Model Explicit EV Forecast (2015-2025E)
Wind Model Auto Model EV Model
32 www.co27.com | TSXV: KBLT | FSE: 27O
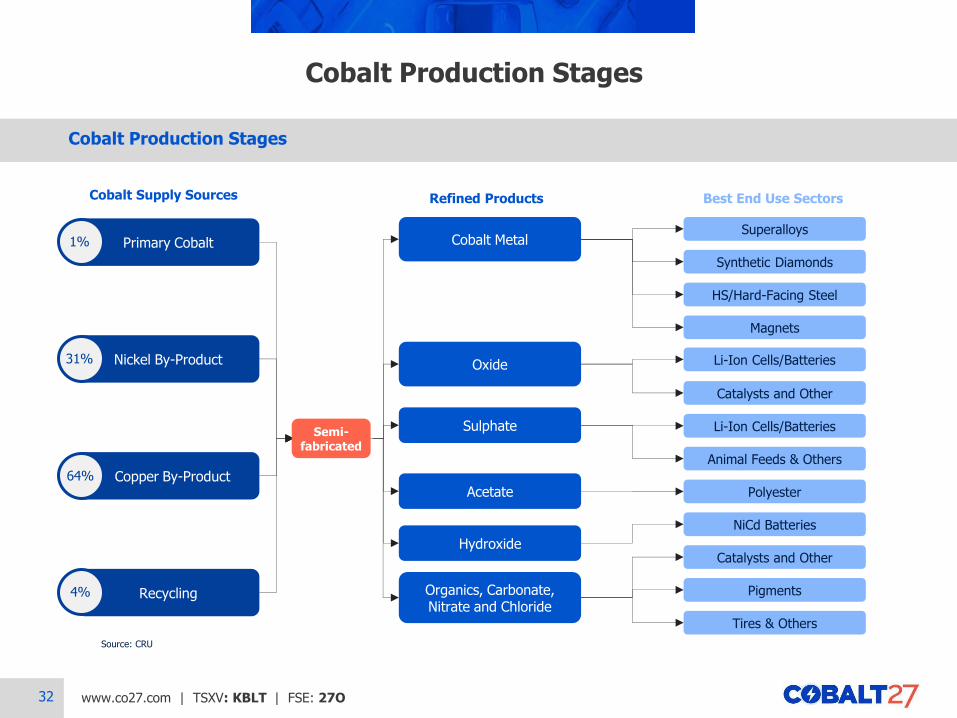
Cobalt Production Stages
Source: CRU
Cobalt Supply Sources Refined Products Best End Use Sectors
Primary Cobalt
Nickel By-Product
Copper By-Product
Recycling
Cobalt Metal
Oxide
Sulphate
Acetate
Hydroxide
Organics, Carbonate, Nitrate and Chloride
Superalloys
Synthetic Diamonds
HS/Hard-Facing Steel
Magnets
Li-Ion Cells/Batteries
Li-Ion Cells/Batteries
NiCd Batteries
Catalysts and Other
Animal Feeds & Others
Polyester
Catalysts and Other
Pigments
Tires & Others
Cobalt Production Stages
1%
31%
64%
4%
Semi-fabricated
33 www.co27.com | TSXV: KBLT | FSE: 27O
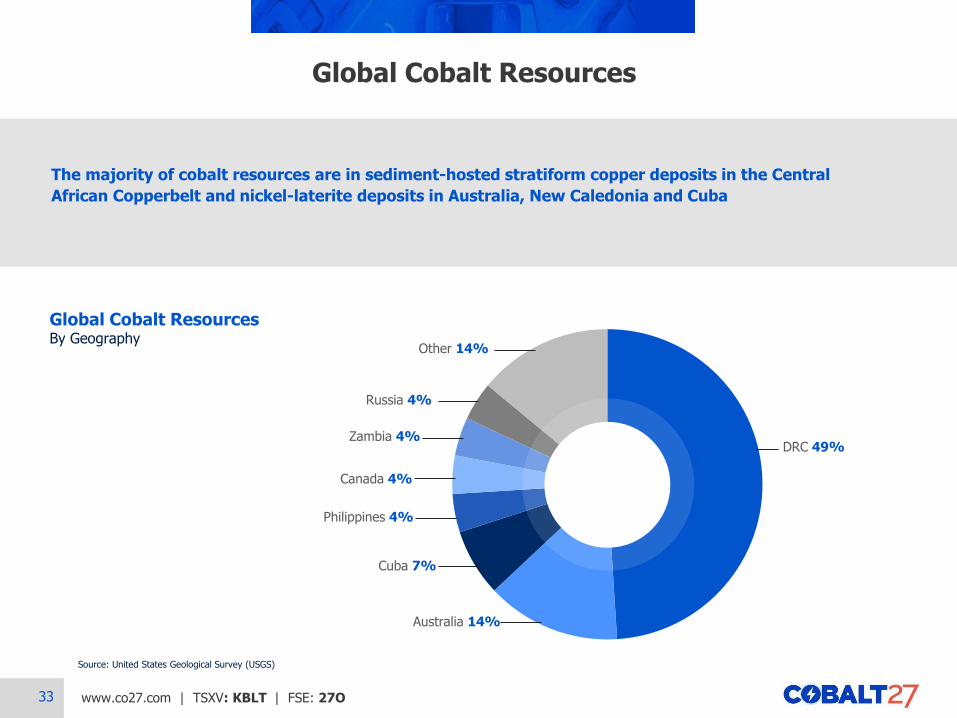
The majority of cobalt resources are in sediment-hosted stratiform copper deposits in the Central
African Copperbelt and nickel-laterite deposits in Australia, New Caledonia and Cuba
Global Cobalt Resources
Global Cobalt Resources By Geography
Source: United States Geological Survey (USGS)
DRC 49%
Australia 14%
Cuba 7%
Philippines 4%
Canada 4%
Zambia 4%
Russia 4%
Other 14%
34 www.co27.com | TSXV: KBLT | FSE: 27O
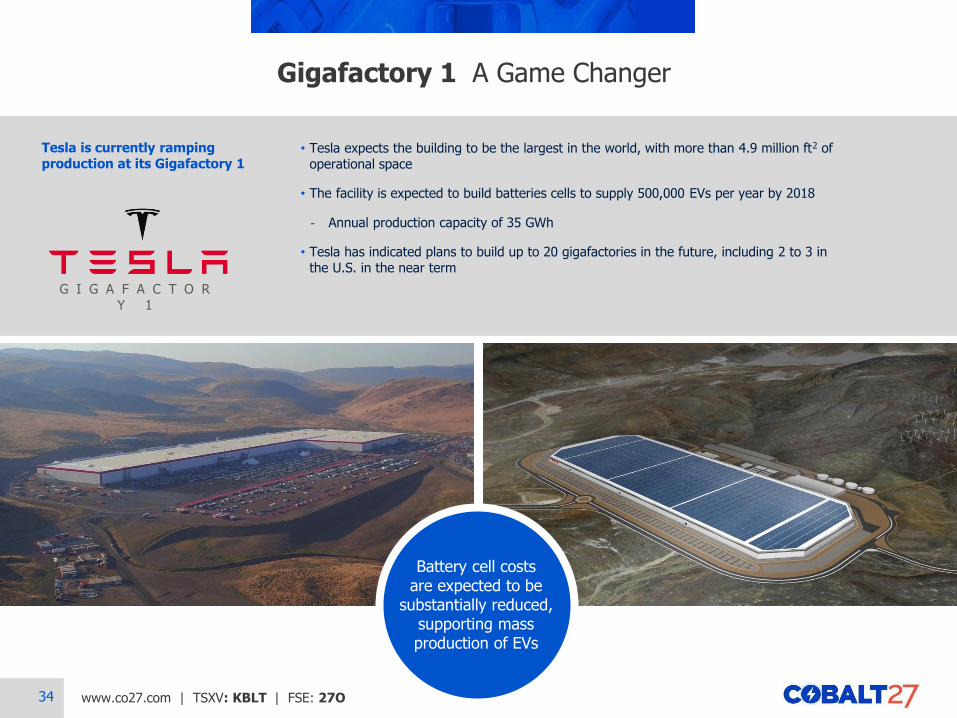
Tesla is currently ramping production at its Gigafactory 1
Gigafactory 1 A Game Changer
• Tesla expects the building to be the largest in the world, with more than 4.9 million ft2 of operational space
• The facility is expected to build batteries cells to supply 500,000 EVs per year by 2018
- Annual production capacity of 35 GWh
• Tesla has indicated plans to build up to 20 gigafactories in the future, including 2 to 3 in the U.S. in the near term
G I G A F A C T O RY 1
Battery cell costs are expected to be
substantially reduced, supporting mass production of EVs
35 www.co27.com | TSXV: KBLT | FSE: 27O
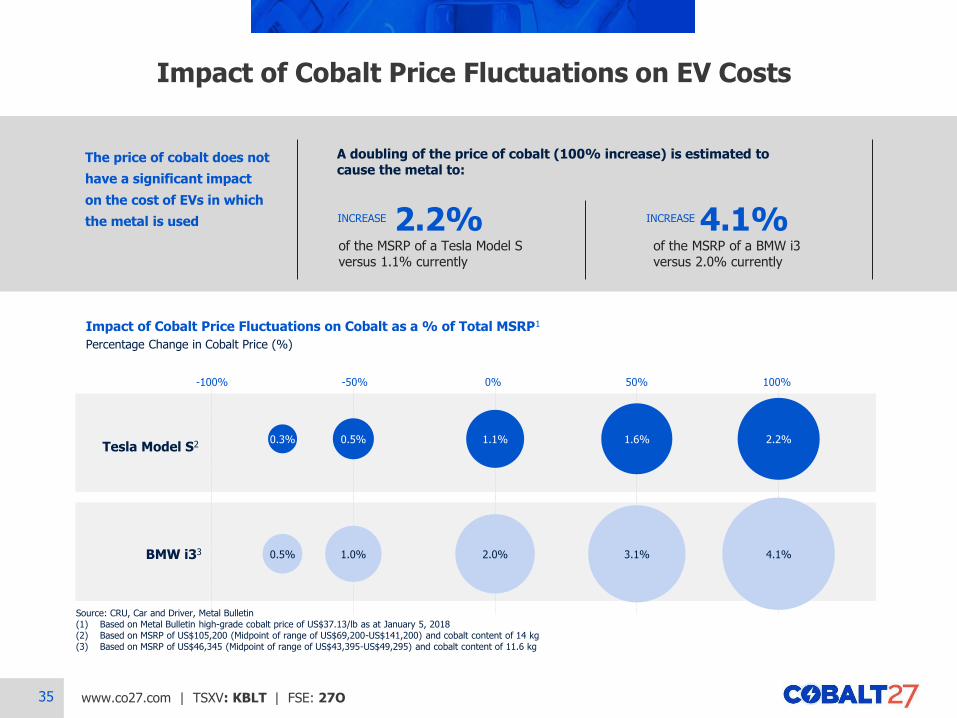
Impact of Cobalt Price Fluctuations on EV Costs
Impact of Cobalt Price Fluctuations on Cobalt as a % of Total MSRP1
Percentage Change in Cobalt Price (%)
Source: CRU, Car and Driver, Metal Bulletin (1) Based on Metal Bulletin high-grade cobalt price of US$37.13/lb as at January 5, 2018 (2) Based on MSRP of US$105,200 (Midpoint of range of US$69,200-US$141,200) and cobalt content of 14 kg (3) Based on MSRP of US$46,345 (Midpoint of range of US$43,395-US$49,295) and cobalt content of 11.6 kg
Tesla Model S2
BMW i33
0.3%
0.5%
0.5%
1.0%
1.1%
2.0%
1.6%
3.1%
2.2%
4.1%
(100%) (50%) 0% 50% 100%
The price of cobalt does not
have a significant impact
on the cost of EVs in which
the metal is used
A doubling of the price of cobalt (100% increase) is estimated to cause the metal to:
2.2% of the MSRP of a Tesla Model S versus 1.1% currently
INCREASE 4.1% of the MSRP of a BMW i3 versus 2.0% currently
INCREASE
0.3%
0.5%
0.5%
1.0%
1.1%
2.0%
1.6%
3.1%
2.2%
4.1%
(100%) (50%) 0% 50% 100%
-100% -50% 0% 50% 100%