
Corporate Presentation - Hurricane Energy...This Presentation may contain certain forward-looking...
30
Corporate Presentation Q3 2019
Transcript of Corporate Presentation - Hurricane Energy...This Presentation may contain certain forward-looking...

Corporate Presentation
Q3 2019
Hurricane | Corporate Presentation | Q3 2019
Disclaimer
2
This document is incomplete without reference to, and should be viewed solely in conjunction with the oral briefing which accompanies it (this document and the accompanying oral briefing being referred to as "this Presentation").
The information contained in this Presentation has been prepared by Hurricane Energy plc (the Company). This Presentation has not been approved by an authorised person in accordance with section 21 of the Financial Services and Markets Act 2000 and therefore it is being delivered for information purposes only.
This Presentation may contain certain forward-looking statements with respect to the Company's expectations and plans, strategy, management’s objectives, future performance, production, costs, revenues, and other trend information. These statements and forecasts involve risk, uncertainties and assumptions about the Company, its assets, its subsidiaries and investments, including, among other things, the development of its business, trends in its operating industry, and future capital expenditures and acquisitions. In light of these risks, uncertainties and assumptions, the Company's actual results could differ materially from those included in this document or as otherwise discussed at the Presentation. The statements have been made with reference to forecast price changes, economic conditions and the current regulatory environment. Nothing in this Presentation should be construed as a profit forecast. Past share performance cannot be relied on as a guide to future performance. These forward-looking statements speak only as at the date of this Presentation.
No representation or warranty, express or implied, is made or given by or on behalf of the Company or any of its members, directors, officers or employees or any other person as to the accuracy, correctness, completeness or fairness of the information, including estimates, opinions, targets and other forward looking statements, contained in this Presentation and no reliance should be placed on it. Neither the Company or any of its members, directors, officers or employees nor any other person accepts liability whatsoever for any loss howsoever arising from any use of this Presentation or its contents or otherwise arising in connection herewith, or undertakes to publicly update, review, correct any inaccuracies which may become apparent, or revise any forward-looking statement whether as a result of new information, future developments or otherwise. The Company is not under any obligation to update or keep current the information contained in this Presentation and any opinions expressed in it are subject to change without notice.
The Company's securities have not be registered under the US Securities Act of 1933, as amended (the Securities Act) and may not be offered or sold in the United States absent registration or an exemption from the registration requirements of the Securities Act. No public offering of the Company's securities is or will be made in the United States. In addition, the Company’s securities have not been and will not be registered under the applicable laws of Australia, Canada, Japan and South Africa and, subject to certain exceptions, may not be offered or sold within Australia, Canada, Japan or South Africa or to any national, resident or citizen of Australia, Canada, Japan or South Africa.

Introduction to Hurricane

Hurricane | Corporate Presentation | Q3 2019
Area Licences Interest Fields Gross Reserves and Resources (RPS Energy May/Dec 2017)
Greater Lancaster Area (GLA)
• P1368 Central• P2308
100%100%
Greater Warwick Area (GWA)
• P1368 South• P2294
50%50%
Other4 • P1368 North 100%
37 486
1,235
604
205
935
Lancaster
Halifax
Lincoln
Warwick
Whirlwind
2P Reserves 2C Contingent Resources Best Case Prospective Resources
Combined GLA: 1,758
Combined GWA: 1,539 mmboe
Introduction
4
Hurricane Energy overview
AssetsFinancial summary
Ticker LON:HUR (LSE AIM-quoted)
Shares outstanding 1,990,228,053
Market capitalisation1 £1.0 billion (US$1.3 billion)
Debt $230 million 7.5% convertible bonds due 2022 (initial conversion price $0.52/sh2)
Cash $81.0 million3 as at 30-Jun-2019
Source: RPS May-17 Lancaster CPR; RPS Dec-17 CPR; Note: 1. Based on a share price of £0.525 and GBPUSD rate of 1.27x, as at 30-Jun-19; 2. Fixed in USD, equates to £0.40/sh at FX rate at the time of issue; 3. Unrestricted cash and cash equivalents, unaudited; 4. Strathmore licence excluded as basement assets are current focus
Multi-billion barrel fractured basement resource on the UKCSAIM-quoted E&P company in production since June 2019
Hurricane | Corporate Presentation | Q3 2019
Introduction
5
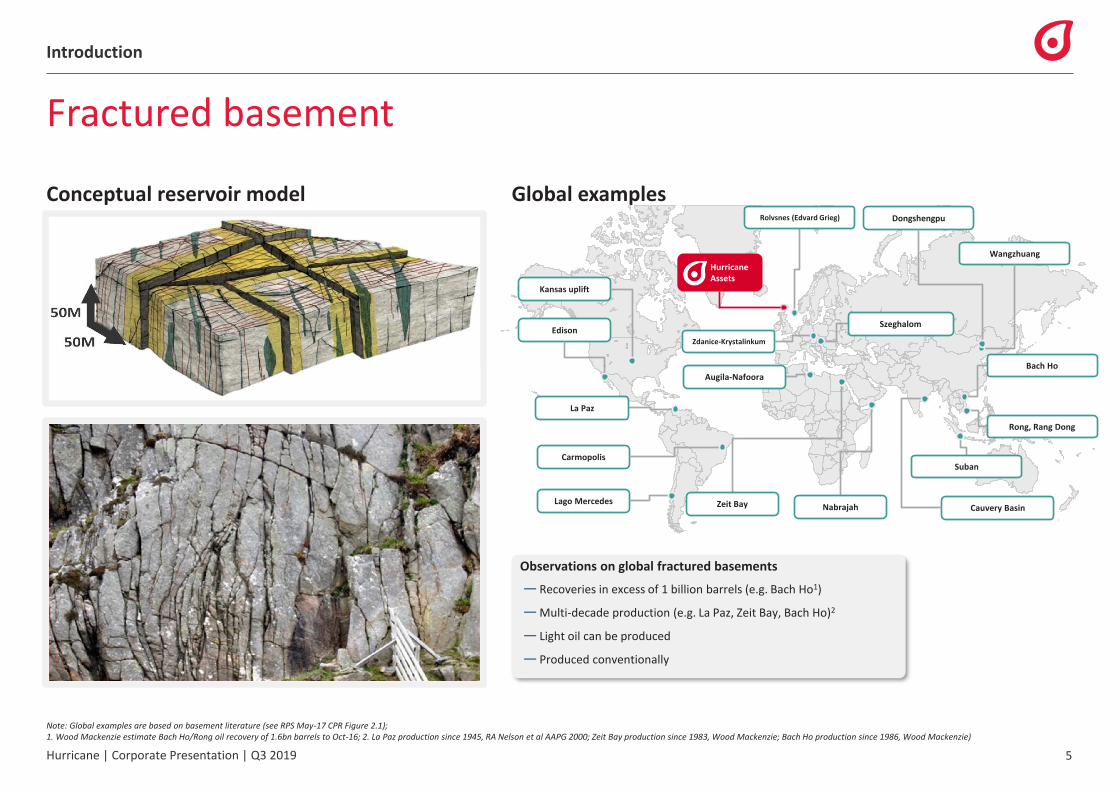
Fractured basement
Conceptual reservoir model Global examples
Note: Global examples are based on basement literature (see RPS May-17 CPR Figure 2.1); 1. Wood Mackenzie estimate Bach Ho/Rong oil recovery of 1.6bn barrels to Oct-16; 2. La Paz production since 1945, RA Nelson et al AAPG 2000; Zeit Bay production since 1983, Wood Mackenzie; Bach Ho production since 1986, Wood Mackenzie)
Observations on global fractured basements
— Recoveries in excess of 1 billion barrels (e.g. Bach Ho1)
— Multi-decade production (e.g. La Paz, Zeit Bay, Bach Ho)2
— Light oil can be produced
— Produced conventionally
Edison
Lago Mercedes
Carmopolis
Kansas uplift
Zdanice-Krystalinkum
Cauvery Basin
Dongshengpu
Wangzhuang
Nabrajah
Rolvsnes (Edvard Grieg)
Zeit Bay
Augila-Nafoora
Szeghalom
La Paz
Suban
Rong, Rang Dong
Bach Ho
Hurricane Assets

Hurricane | Corporate Presentation | Q3 2019
Introduction
6
Greater Lancaster Area (GLA) and Greater Warwick Area (GWA)
Westray Fault Zone Brynhild Fault
Zone
Whirlwind
Halifax
Lancaster Warwick
-
2P Reserves 2C Resources Combined
Lancaster mmstb 37 486 523
Halifax mmboe - 1,235 1,235
Total mmboe - 1,721 1,758
2C Resources Best Prospective Combined
Lincoln mmboe 604 - 604
Warwick mmboe - 935 935
Total mmboe 604 935 1,539
GLA Reserves/Resources GWA Resources
1. Greater Lancaster Area (GLA) – Lancaster EPS development− Achieved first oil from Aoka Mizu FPSO on 4 June 2019
− First cargo successfully lifted on 18 June 2019
− Production expected to gradually increase through 2019 to initial long term target of 17,000 bopd (20,000 bopd with 85% operating efficiency)
2. Greater Warwick Area (GWA) – Spirit Energy farm-in− Up to $387 million in carry across five conditional phases agreed in Sept-18
− First phase fully carried across $180.6 million work programme including three-wells in 2019
− Transocean Leader currently drilling second of three wells planned for 2019
Lincoln
Note: 1. In RPS Dec-17 CPR, the possibility of Lincoln and Warwick being one accumulation is acknowledged, although separation is conservatively assumed; similarly an intra-basement sealing fault between Lancaster and Halifax is considered; 2. Hurricane management base case, high case in RPS May-17 CPR; 3. Hurricane management base case (RPS consider a high and low case either side of this in Dec-17 CPR)

Hurricane | Corporate Presentation | Q3 2019
152154159166203214222
265268278292339
413460
641695
810
1,064
1,297
2,179
-
500
1,000
1,500
2,000
2,500
INEOSDyasEniDelek GroupCNOOCExxonMobilEnQuestWhalsayApacheSuncorEneConocoPhillCentricaSiccarPointChevronChrysaorEquinorTotalShellBPHurricaneEn
WI N
et
Res
erve
s (m
mb
oe)
Commercial Technical
Introduction
7
Monetising the largest undeveloped resource on the UKCS
Source: Wood Mackenzie Upstream Data Tool, accessed March 2019; ‘Technical reserves’ are equivalent to ‘contingent resources’, as defined by the Society of Petroleum Engineers’ Petroleum Resources Management System (PRMS) guidelines. Note: Spirit is shown under Centrica; Monetising the significant reserves and resources associated with the naturally fractured basement reservoirs within Hurricane’s portfolio to create shareholder value is the company’s strategy
Wood Mackenzie UK commercial/technical reserve ranking

Hurricane | Corporate Presentation | Q3 2019
Introduction
8
Targeting initial full-field development FIDs on GLA and GWA
Note: Indicative schedule; subject to partner approvals, regulatory consents and FIDs
2019 2020 2021 2022
Q1 Q2 Q3 Q4 Q1 Q2 Q3 Q4 Q1 Q2 Q3 Q4 Q1 Q2 Q3 Q4
Greater Lancaster Area
EPS development
Gas export
Full field development
Greater Warwick Area
Drilling
GWA Tie-Back
Full Field Development
Whirlwind Appraisal
3x Appraisal / prod. wells
Well Planning1x Lincoln Hz
2x Warwick Hz
Throughput capacity increaseHost mods.
FirstOilDevelopment
Gas productionFirst
gas exportGas export solution
ProductionFirst OilDevelopmentPreparation, LLIs
GWA Tie-back FID
GWA FFD FID
DevelopmentConcept select / FEEDGWA
FFD First Oil 2024
FEEDAdditional Rona
Ridge wellsWell planning
GLA FFD FIDGLA FFD First Oil
2025
# TBD
TBDConcept studies

Greater Lancaster Area

Hurricane | Corporate Presentation | Q3 2019
Greater Lancaster Area
10
Lancaster EPS – simple development for data and cash flow
Target initial productionBase case 17,000bopd (20,000bopd net of 85% uptime)
17-20 kbopd
Operating cash flow per annumFull year run-rate basis at 17-20 kbopd and $60/bbl Brent
$200-240m
Low operating costsAverage cost in 2020 at 17,000bopd, $60/bbl Brent
$20/bbl
EPS objectives
1 DataTo provide long term production data to enhance understanding of reservoir characteristics and associated full field development scenarios
2Commence phased development
Commence development of the resources in a phased manner with regard to managing uncertainties over reservoir characteristics and associated development risks
3 Financial return Deliver an acceptable return on investment

Hurricane | Corporate Presentation | Q3 2019
Greater Lancaster Area
11
EPS start-up results at or above expectations
Note: Based on preliminary analysis
Production
Reservoir data
Facilities performance
✓
✓
✓
✓
✓
✓
✓
✓
Pre-start-up Post-start-up
Production rates at end of start-up phase • 20,000 bopd using ESPs • 20,000 bopd under natural flow
Natural production rate • Well 6 – 5,300 bopd• Well 7Z – 6,520 bopd
• >16,500 bopd/well demonstrated
Water production • Best case water saturation 5-10% (2017 CPR)
• Well 6 – nil• Well 7Z – c. 8%
Gas-oil ratio • 342 – 466 scf/bbl • ~360 scf/bbl
Initial Productivity Index (PI)
• Well 6 – 160 stb/d/psi• Well 7Z – 147 stb/d/psi
• Well 6 – 205 stb/d/psi• Well 7Z – 190 stb/d/psi
Interference • Inter-well connectivity • Rapid inter-well connectivity
Pressure barriers • Connected volume of 250-300 mmbbl• No pressure barriers identified• Larger connected volume – to be
quantified
Operating efficiency • 45% / 65% for initial 2 quarters• 85% long-term
• 45% / 65% for initial 2 quarters• 85% long-term

Hurricane | Corporate Presentation | Q3 2019
Greater Lancaster Area
12
Production guidance
Production net to Hurricane, post-operating efficiency
Note: Subject to well results, regulatory consents and partner approvals
-
5
10
15
20
25
30
35
40
Q3 Q4 Q1 Q2 Q3 Q4 Q1 Q2 Q3 Q4
2019 2020 2021
Net
Oil
Pro
du
ctio
n R
ate
(mb
oep
d)
— 20,000 bopd pre-operating efficiency
— Gradual increase in operating efficiency over first 6 months (45%/65%/85%)
— Strong well performance through start-up phase potentially indicates that production will be able to catch-up downtime periods to average 20,000 bopd
— GWA tie-back to add 10,000 bopd gross (4,250 bopd net to Hurricane after 85% operating efficiency adjustment) in the success case, subject to FID and regulatory consent
— Planning to use all available Aoka Mizu throughput, subject to regulatory consent
9
13
17 - 20 17 - 20 17 - 20 17 - 20
Lancaster Base
Lancaster Upside
GWA
Debottlenecking
21 - 24 21 - 24 21 - 24 21 - 24
Net available Aoka Mizu processing capacity

Hurricane | Corporate Presentation | Q3 2019
Greater Lancaster Area
13
Future data and updates
Lancaster EPS bottom-hole pressure comparison
Note: Based on pre-start-up reservoir model
1,650
1,700
1,750
1,800
1,850
1,900
- 1 2 3
Bo
tto
mh
ole
Pre
ssu
re (
psi
)
Year
Low Case Base Case High Case
— 6 – 12 months of stable production are required to distinguish which scenario is best matched by actual bottom hole pressures
— Production performance to be reported by RNS in the event of deviation from guidance
— Hurricane model 3 non-unique scenarios to gauge EPS performance for the first 3 years of production, assuming gross individual well flow rates of 10,000 bopd

GreaterWarwick Area

Hurricane | Corporate Presentation | Q3 2019
Greater Warwick Area
15
Spirit farm-in targeting accelerated full field development
Deal structure
- $46.9m TBD TBDTBD
GWA Tie-back (Inc. Host Mods and
Gas Tie-in)3 Additional Wells GWA FFD
3 E&A Wells +GWA Tie-back
PreparationGWA FFD FEED
$90.3m $46.9m - 1 Up to $250m*
$90.3m $93.8m TBD TBD
Carry
Net Cost
Hurricane Operatorship Spirit Energy Operatorship
$180.6m $187.5m TBD TBDGross Cost
- 1
TBD
TBD
FID
Net Effective Cost
$90.3m $137.2m $137.2m Up to $387m*$137.2mCumulative Carry
FID FID FID
Spirit overview
69%
Stadtwerke München Group
(former Bayerngasshareholders)
31%
Overview
— Formed by combination of Centrica’s E&P business and Bayerngas Norge’s upstream businesses in 2017
— Assets in the UK, Norway, Denmark and the Netherlands
— 2P reserves at 2018 year end of 270 mmboe
— 2018 net production of 47mmboe (128mboepd)
Highlights
✓ Strong financial partner
✓ Technically and commercially aligned
✓ Operational capability to take on operatorship at FEED for FFD
✓ Prior experience with basement plays, inc. Norway
Note: 1. Phase 3 & 4 costs are payable at working interest with no carry (50:50); *$150-250 million contingent commitment on FID, dependent on reserves being developed, $150m up to 300mmboe and $0.5/boe thereafter up to 500mmboe, payable as carry over 3 years

Hurricane | Corporate Presentation | Q3 2019
Greater Warwick Area
16
Fully-carried 3-well programme in 2019
Schematic of well locations Well locations
Valhall Limestones
Kimmeridge Clay
Rona Sandstone
Fractured Basement
# Location Depth (TVDSS) Well Number
1 Warwick Deep Horizontal 1,900m 205/26b-13Z
2 Lincoln Horizontal 1,770m 205/26b-14
3 Warwick Crestal Horizontal 1,840m 204/30b-A
SE
-
205/26-1(Arco 1975)
205/26b-12(Hurricane
2016)
205/26b-14(Hurricane
2019)205/26b-13Z(Hurricane
2019)
204/30b-A(Hurricane
2019)
Hurricane ODT from 205/26b-12: 2,258m TVDSS
NW
RPS CPR P90 OWC: 2,109m TVDSS
2C Resources Best Prospective Combined
Lincoln mmboe 604 - 604
Warwick mmboe - 935 935
Total mmboe 604 935 1,539
GWA resources (Dec-17 CPR)
Note: Indicative schematic, not to scale
205/26b-13Z
205/26b-14
Hurricane | Corporate Presentation | Q3 2019
Greater Warwick Area
17
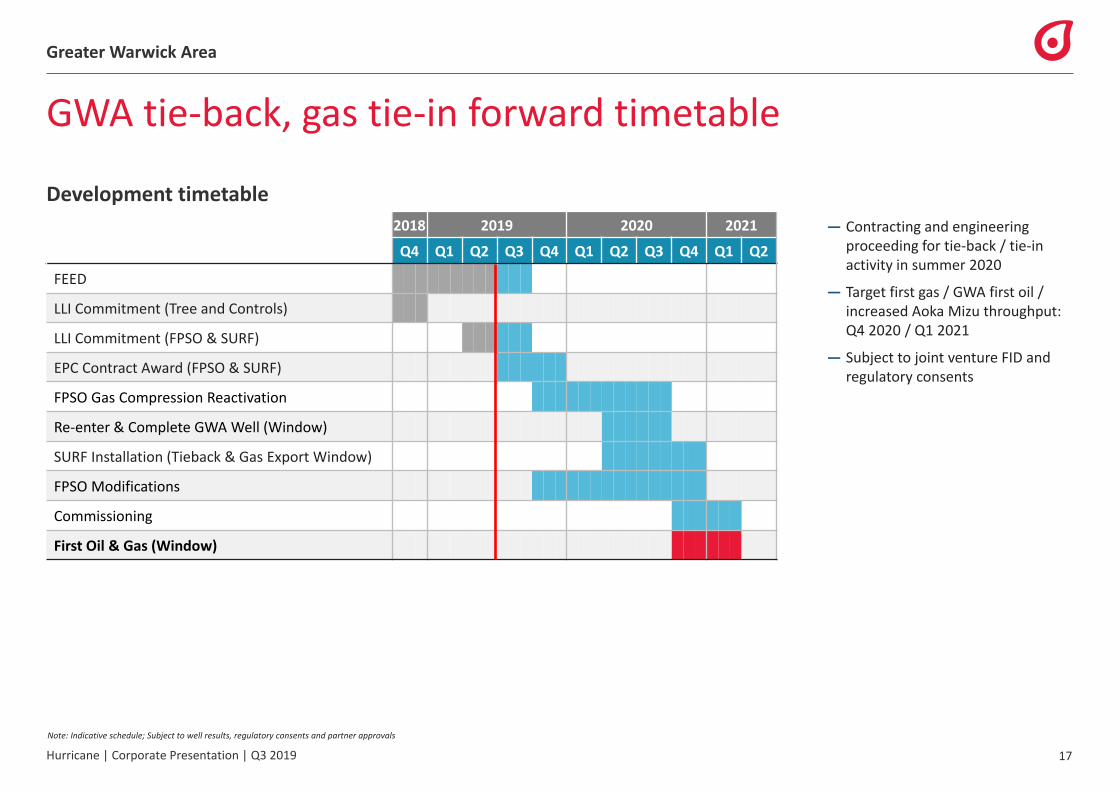
GWA tie-back, gas tie-in forward timetable
Development timetable
2018 2019 2020 2021
Q4 Q1 Q2 Q3 Q4 Q1 Q2 Q3 Q4 Q1 Q2
FEED
LLI Commitment (Tree and Controls)
LLI Commitment (FPSO & SURF)
EPC Contract Award (FPSO & SURF)
FPSO Gas Compression Reactivation
Re-enter & Complete GWA Well (Window)
SURF Installation (Tieback & Gas Export Window)
FPSO Modifications
Commissioning
First Oil & Gas (Window)
— Contracting and engineering proceeding for tie-back / tie-in activity in summer 2020
— Target first gas / GWA first oil / increased Aoka Mizu throughput:Q4 2020 / Q1 2021
— Subject to joint venture FID and regulatory consents
Note: Indicative schedule; Subject to well results, regulatory consents and partner approvals

Forward guidance

Hurricane | Corporate Presentation | Q3 2019
Forward guidance
19
Potential for 2P reserves of >100 mmboe in H1 2020
Potential 2P reserve uplift Aoka Mizu production profile
Note: Subject to well results, regulatory consents and partner approvals
-
5,000
10,000
15,000
20,000
25,000
30,000
35,000
Pro
du
ctio
n R
ate
(bo
epd
ne
t to
Hu
rric
ane
)
Lancaster 6-Yr Lancaster 10-Yr Lancaster Uptime Upside GWA Tie-back base GWA Tie-back upside Gas FPSO Debottleneck
— RPS May-17 reserves tie to 6-year 17,000 bopd FDP case
— CPR includes increase in 2P in event of extension of EPS to life of Aoka Mizu
— Following start-up process, wells are potentially able to catch-up production lost during downtime to average 20,000 bopd
— Incremental reserves anticipated following GWA tie-back FID based on GWA volumes, gas and potential for full use of debottlenecked capacity
Lancaster 6-Yr
Lancaster 10-Yr
Lancaster Uptime Upside
GWA Tie-back base
Gas
FPSO Debottleneck
-
20
40
60
80
100
Net
2P
Res
erve
s /
Po
ten
tial
Res
erve
s (m
mb
oe)
2019 2020 2021 2022 2023 2024 2025 2026 2027 2028 2029

Hurricane | Corporate Presentation | Q3 2019
Forward guidance
20
Opex per barrel
Opex per barrel
• Elevated per barrel costs due to initial lower operating efficiency
• Normalised base EPS opex• Per barrel costs improve further in
upside case
• Assuming GWA tie-back onstream and gas export
• Further improvement possible from full use of debottlenecked throughput
2.3 6.2 7.36.2 7.3
1.6 1.8
GLA
GWA
Produced oil volume (mmbbl)
28
2018
1715
-
10
20
30
Base Upside Base Upside
2019 H2 2020 2021
Op
ex p
er b
arre
l ($
/bb
l)
Fixed Variable
2019 H2 2020 2021
Note: Indicative guidance based on preliminary cost estimates and production profiles; Fixed costs do not include workovers, which would only be required if ESPs were to be used; All cases at $60/bbl flat Brent price

Hurricane | Corporate Presentation | Q3 2019
Forward guidance
21
Cash flow
Operating cash flow
— Addition of GWA reduces GLA’s share of the fixed component of costs
— Minimal contribution from gas – oil enabler
Capex
— Large majority of GWA capex spend in 2019-20 is paid for by Spirit (equity share + carry)
-
100
200
300
400
Base Upside Base Upside
2019 H2 2020 2021
Op
erat
ing
Cas
h F
low
($
mm
) GLA GWA
-
100
200
300
400
2019 H2 2020 2021
Cap
ex S
pen
d (
$m
m) GLA GWA (HUR Share) GWA (Spirit Share) Rona Ridge Wells
2019 H2 2020 2021
Note: Indicative guidance based on preliminary cost estimates and production profiles; Note: Operating cash flow in 2021 is allocated to GLA and GWA in proportion to net production rates; Does not include Post-FID full field development capex; 2019 H2 includes period from first oil

Hurricane | Corporate Presentation | Q3 2019
Forward guidance
22
Half year guidance
Revenue
— First cargo achieved on 18 June 2019
— Revenue recognised on offloading
— Facility in place with BP for payment immediately following loading
Cash
30 Jun 19
Unrestricted cash and cash equivalents
$81 million
Cargo size Approx. 350,000 barrels
Revenue $22 million
— First oil achieved with in excess of $50 million in cash, as guided
— Half year figure includes first revenue received in June
— Supplier deferred invoice of £18 million due in September
Trial lift
First cargo
Note: 30 June 2019 cash figure is unaudited

Hurricane | Corporate Presentation | Q3 2019
Forward guidance
23
Growth
-
20,000
40,000
60,000
80,000
100,000
120,000
140,000
-
100
200
300
400
500
600
700
800
900
1,000
2017 2018 2019 2020 2021 2022 2023 2024 2025 2026
Net
Pro
du
ctio
n (
bo
pd
)
Net
2P
Res
erve
s (m
mb
oe)
3x GWA
Lancaster EPSFID
3x GWA # TBD
GWA Phase 1 FFD FID
GLA Phase 1 FFD FID
Outlook for growth in reserves and production
Planned drilling TBD
Debottlenecking, Gas tie-in, GWA tie-back
2P Reserves (LHS) Production (RHS)
Note: 2017 Reserves are per May-17 RPS Energy CPR; Other ‘Reserves’ figures are management projections of net oil equivalent reserves based on planned work programme and assuming technical success and regulatory approvals; Production figures are net to equity interest but gross of operational efficiency and don’t include gas; 2022 reserve range and 2025+ production range based on a representative example range of equity ownership.

Supporting Information
Hurricane | Corporate Presentation | Q3 2019
Supporting information
25
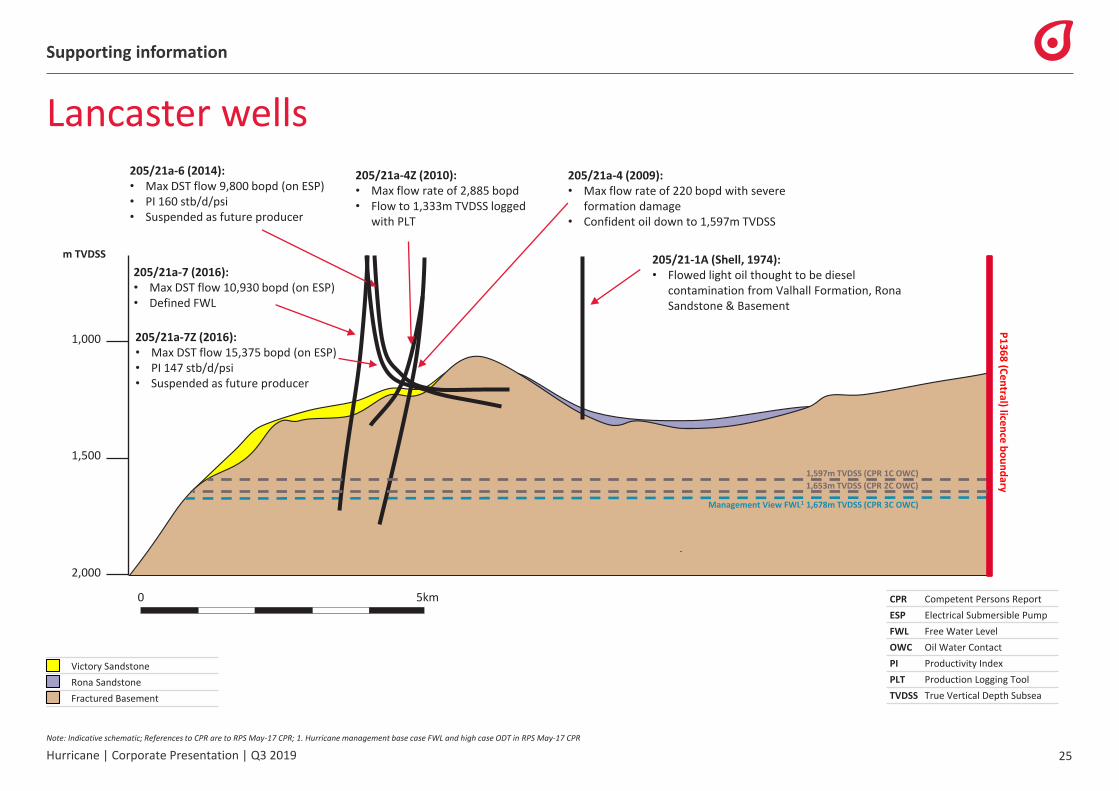
Lancaster wells
CPR Competent Persons Report
ESP Electrical Submersible Pump
FWL Free Water Level
OWC Oil Water Contact
PI Productivity Index
PLT Production Logging Tool
TVDSS True Vertical Depth Subsea
Victory Sandstone
Rona Sandstone
Fractured Basement
P1
36
8 (C
en
tral) licen
ce b
ou
nd
ary
-
1,000
m TVDSS
2,000
1,500
0 5km
205/21-1A (Shell, 1974): • Flowed light oil thought to be diesel
contamination from Valhall Formation, Rona Sandstone & Basement
205/21a-7 (2016): • Max DST flow 10,930 bopd (on ESP)• Defined FWL
205/21a-6 (2014): • Max DST flow 9,800 bopd (on ESP)• PI 160 stb/d/psi• Suspended as future producer
205/21a-4 (2009): • Max flow rate of 220 bopd with severe
formation damage• Confident oil down to 1,597m TVDSS
205/21a-4Z (2010): • Max flow rate of 2,885 bopd • Flow to 1,333m TVDSS logged
with PLT
205/21a-7Z (2016):• Max DST flow 15,375 bopd (on ESP)• PI 147 stb/d/psi• Suspended as future producer
1,597m TVDSS (CPR 1C OWC)
1,653m TVDSS (CPR 2C OWC)
Management View FWL1 1,678m TVDSS (CPR 3C OWC)
Note: Indicative schematic; References to CPR are to RPS May-17 CPR; 1. Hurricane management base case FWL and high case ODT in RPS May-17 CPR

Hurricane | Corporate Presentation | Q3 2019
Supporting information
26
EPS fluid production
Note: Indicative schematic; References to CPR are to RPS May-17 CPR
Basement fluid
Oil
Aquifer Water
Trapped Water
Lithology
Overburden
Victory Sandstone
Rona Sandstone
Fractured Basement
— Although oil is the dominant mobile fluid above the oil water contact, water is also typically present within the column in conventional reservoirs
— At Lancaster, trapped, or perched water will be present, in less connected parts of the fracture network that have been bypassed by the oil charge
— The RPS CPR (2017) estimates a best case range of 5-10% water, which is factored into resource estimates
— The 205/21a-6 well – only dry oil
— 205/21a-7Z well – 8% water cut, which arrived early, is not rate dependent and is consequently interpreted as trapped, or perched, water

Hurricane | Corporate Presentation | Q3 2019
Supporting information
Portfolio overview
Note: Reserve/Resources figures are gross; For full details refer to RPS Energy CPRs
27
Asset2P
Reserves2C
Resources
P50 Prospective Resources
Wells
Well NumberMax DST
Rate Status
37 mmboe - -205/21a-6
205/21a-7Z
9,800 stb/d
15,375 stb/d
Completed for EPS production
Completed for EPS production
- 486 mmboe -
205/21-1a
205/21a-4
205/21a-4Z
205/21a-7
na
1,367 bopd
2,885 bopd
11,000 stb/d
Shell 1974 P&A’d
Logged, tested, P&A’d
Logged, tested, suspended
Logged, tested, P&A’d
- 1,235 mmboe -205/23-2
205/23-3A
na
na
Arco 1998, P&A’d
ODT confirmed, suspended
- 604 mmboe -205/26-1
205/26b-12
na
na
Arco 1975, P&A’d
ODT confirmed, P&A’d
- - 935 mmboe 205/26b-13Z na Obtained reservoir pressure, P&A’d
- 205 mmboe -205/22-1a
205/21a-5
na
na
BP 1974, P&A’d
ODT confirmed, suspended
- 32 mmboe -205/26a-3
204/30a-3
na
na
Amerada Hess 1991, P&A’d
Amerada Hess 1995, P&A’d
Greater Lancaster
Area
Greater Warwick
Area
Lancaster EPS
Lancaster Resources
Halifax
Lincoln
Warwick
WhirlwindWhirlwind
Hurricane well
Historical well
StrathmoreStrathmore
Key:

Hurricane | Corporate Presentation | Q3 2019
Supporting information
28
Rona Ridge reserves and resources – 2017 CPRs
Asset Unit Initially In-Place Volumes Contingent Resources3
Low Best High 1C 2C 3C
Lancaster mmstb 1,571 2,326 3,333 129 486 1,117
Halifax mmboe 2,523 5,157 9,064 268 1,235 3,379
Lincoln mmboe 1,404 2,514 4,113 150 604 1,537
Whirlwind1 mmboe 137-219 268-409 445-652 91-98 179-205 301-373
Strathmore mmboe 131 182 246 20 32 57
Total2 mmboe 5,848 10,588 17,408 665 2,562 6,463
Contingent resources (gross)
Prospective resources (gross) Reserves (gross/net)
Asset Unit Prospective Resources GPoS
Low Best High
Warwick mmboe 228 935 2,790 77%
Asset Unit Reserves
1P 2P 3P
Lancaster (6-year EPS) mmstb 28.1 37.3 49.3
Lancaster (10-year EPS)4 mmstb 44.5 62.1 88.7
Source: RPS May-17 Lancaster CPR; RPS Dec-17 CPR; Note: 1. Range is Whirlwind gas/condensate case - oil case; 2. Whirlwind oil case; 3. Exclusive of Reserves; 4. Increase in Reserves from EPS extension from 6 years to 10 years would cause corresponding decrease in Resources

Hurricane | Corporate Presentation | Q3 2019
Supporting information
29
Board of directors
Executive directors
Dr Robert TriceChief Executive Officer
Robert is Hurricane’s founder and has over 30 years’ oil industryexperience, the majority of which was obtained at Enterprise Oiland Shell. He has worked in field development, exploration, well-site operations and geological consultancy.
Robert has a PhD in Geology from Birkbeck College, University ofLondon and has held the position of Visiting Professor atTrondheim University, Norway. He has published and presented onsubjects related to fractured reservoirs and exploration forstratigraphic traps. He is a Fellow of the Geological Society and amember of the Petroleum Exploration Society of Great Britain andthe Society of Petroleum Engineers.
Neil PlattChief Operations Officer
Neil has more than 25 years’ experience in the oil industry and hasworked for Amoco, BG and Petrofac. He has completedassignments both in the UK and internationally, working in a varietyof engineering, commercial and management roles includingProduction Asset Manager (NSW) for BG and Vice President forProject Delivery in Petrofac Production Solutions.
Neil joined Hurricane in 2011 and was appointed to the Board in2013. As Chief Operations Officer Neil is responsible for dailyoperations and asset delivery (drilling and projects).
Alistair StobieChief Financial Officer
Alistair has significant capital markets and oil and gas industryexperience. Alistair was previously Director of Finance at AIM-quoted Zoltav Resources and Chief Financial Officer (CFO) at OandoExploration & Production. Prior to this, Alistair founded and wasCFO at both Volga Gas, where he was CFO and led its IPO to raiseUS$135 million, and Pan-Petroleum, which acquired an interest inthe multi-billion barrel oil in place Mengo-Kundji-Bindi licence inCongo-Brazzaville.
During his career Alistair has been actively involved in numerouscorporate transactions including fundraisings, M&A and theacquisition and disposal of licence interests. Alistair joined theBoard in 2016.
Non-Executive directors
Steven McTiernanChairman
Dr David JenkinsSenior Independent Non-Executive Director
John van der WelleNon-Executive Director
Roy KellyNon-Executive Director
Sandy ShawNon-Executive Director
Jason ChengAlternate Director
Leonard TaoAlternate Director

Hurricane | Corporate Presentation | Q3 2019
Supporting information
30
Glossary
bbl Barrels
boe Barrels of oil equivalent
bopd Barrels of oil per day
CPR Competent Persons Report
DST Drill-stem Test
EPS Early Production System (phase 1 of Lancaster/GLA development)
ESP Electrical Submersible Pump
FEED Front End Engineering and Design
FID Final Investment Decision
FPSO Floating Production Storage and Offloading vessel
FFD Full Field Development (phase 2 of the Lancaster/GLA development)
FWL Free Water Level
GLA Greater Lancaster Area (Lancaster and Halifax)
GWA Greater Warwick Area (Warwick and Lincoln)
LLI Long Lead Items
mmboe Million barrels of oil equivalent
mmstb Million stock tank barrels of oil
ODT Oil Down To
OWC Oil Water Contact
OGA Oil and Gas Authority (An executive agency of the UK Government’s Department for Business, Energy and Industrial Strategy)
PI Productivity Index
stb Stock Tank Barrel
SURF Subsea Umbilicals Risers and Flowlines
TMS Turret Mooring System
TVDSS True Vertical Depth Subsea
TVT True Vertical Thickness
UKCS United Kingdom Continental Shelf
WI Working Interest


![Company's presentation [ABC Construction]](https://static.fdocuments.us/doc/165x107/54799a50b4795977098b47f9/companys-presentation-abc-construction.jpg)