Corporate Presentation - Genting Malaysia Berhad · Corporate Presentation . Agenda 2 ... is...
31
CLSA IF2012 – HK Sept 2012 1 Corporate Presentation
Transcript of Corporate Presentation - Genting Malaysia Berhad · Corporate Presentation . Agenda 2 ... is...

CLSA IF2012 – HK
Sept 2012
1
Corporate Presentation
Agenda
2
Introduction
Financial Highlights
Malaysian Operations – Resorts World Genting
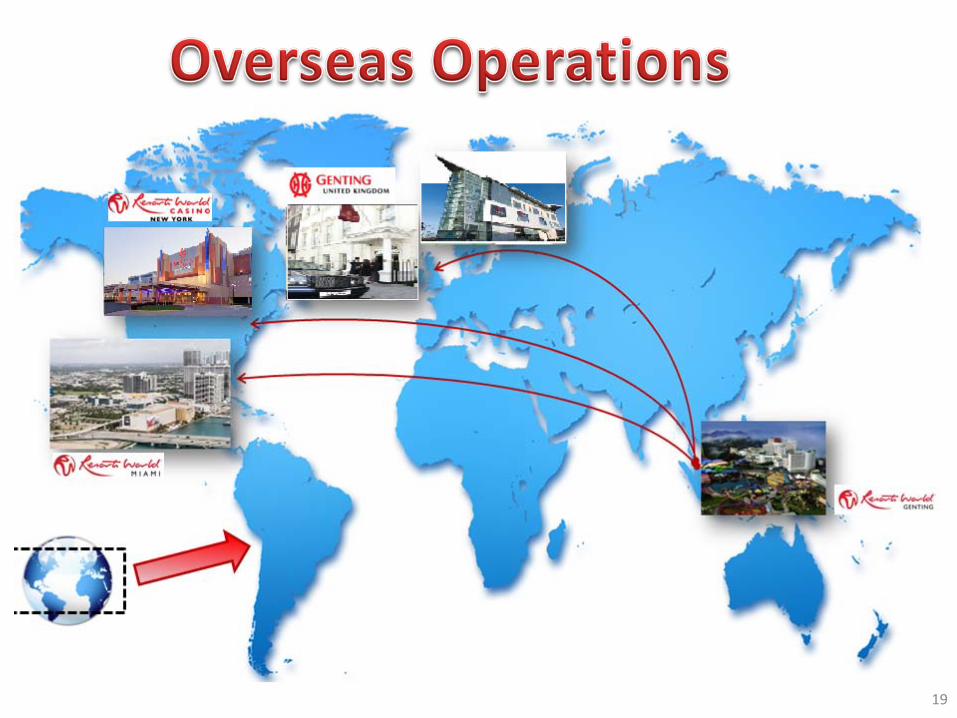
Overseas Operations
– United Kingdom – United States
Looking Ahead

3

Overview Market capitalisation of approx. RM21 billion (USD6.7 billion)
Listed on the Malaysian Stock Exchange (Bursa Malaysia)
A component company of the KL Composite Index
Three gaming operations
Resorts World Genting
Genting Casinos United Kingdom
Resorts World Casino New York City
4

Overview (cont’) Resorts World Genting – A leading integrated leisure & entertainment resort
Over 20 million visitors in 2011 (2010: 19.9 million visitors)
Over 14,000 employees
Over 3.3 million Genting loyalty card members
More than 9,000 rooms at the Resorts World Genting
Adjusted EBITDA of RM2,106 million in 2011 (2010: RM1,980 million)
5

Overview (cont’)
Genting Casinos United Kingdom (“Genting UK”) – One of the largest casino operator in the UK
More than 3.7 million visitors in 2011 (2010: 3.4 million visitors)
Operates 43 casinos and a poker club
Over 3,000 employees
Adjusted EBITDA of £33 million in 2011 (2010: £19 million)
6

Overview (cont’)
Resorts World Casino New York City (“RWNYC”) – New York’s leading video lottery gaming facility
Over 5 million visitors in 1H2012
Equipped with 5,000 gaming machines and other leisure facilities
Over 1,500 employees
Opened on 28 Oct 2011
Adjusted EBITDA of USD33.3 million in 1H2012
One of the highest grossing video lottery facilities in the United States (Net wins* of approximately USD59 million in Aug 2012)
7
* Net revenues remaining after payout of prizes to players
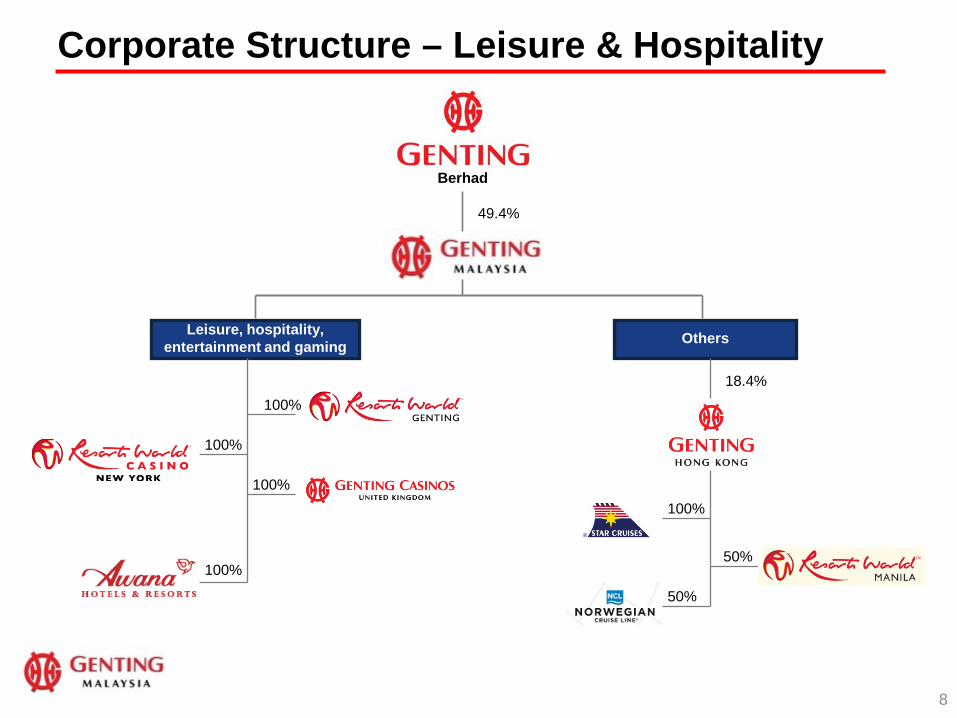
Corporate Structure – Leisure & Hospitality
Genting Berhad
49.4%
18.4%
Leisure, hospitality, entertainment and gaming Others
100%
100%
100%
100%
8
100%
50%
50%
Berhad
9

Financial Performance at a Glance – FY2011
10
…………. Growing the top and bottom line
Resilient Malaysian operations • EBITDA margins – consistent • Higher VIP hold %
Full year contribution from UK’s
operations
US operations • Maiden contribution from
RWNYC • One-off property related and
pre-operating costs
2011 2010
In RM 'million
(1) Includes construction revenue & construction profit of RM1741.5m and RM13.4m respectively from the development of Resorts World Casino New York City(2) Excluding the construction revenue & construction profit, the 2011 adjusted EBITDA margins for US and the Group are 20% and 34% respectively
1,156 1,847 8,493
161 34 2,330
14% 2% (2) 27% (2)
Revenue 5,490 5,333 ↑ 59%
Malaysia UKUS &
Others (1) Total
Adjusted EBITDA margin
39% 38%
Adjusted EBITDA
2,135 2,024 ↑ 15%
Net Profit 1,497 1,277 ↑ 12%
Tax (463) (455) ↑ 4%
PBT 1,961 1,731 ↑ 10% 79 (138) 1,902
(9) 0 (472)
70 (138) 1,430

Financial Performance at a Glance – 1H2012
11
Higher revenue from Malaysia operations • Higher volume of business,
offset by lower VIP hold %
53% growth in UK revenue • Higher volume of business
and hold % from the London casinos
US operations
• Positive contributions from RWNYC
• One-off costs relating to Miami initiatives
…………. Encouraging contributions from overseas operations
1H12 1H11
In RM 'million
(1) Includes construction revenue of RM627.7m in 1H2011 from the development of RWNYC
(2) Includes construction loss of RM48.2m in 1H2012 and construction profit of RM28.4m in 1H2011 from the development of RWNYC
(3) Excluding the construction revenue & construction profit/(loss), the 1H12 adjusted EBITDA margins for US and the Group are 28% and 33% respectively. (1H11 Group :35%)
↑ 5%
Tax (230) (19) (2) (251) (252)
Net Profit 715 97 (47) 765 732
PBT 945 116 (45) 1,016 984 ↑ 3%
30% (3)
↓ 1%
Adjusted EBITDA margin
38% 19% 18% (3) 32% (3)
1,157 ↑ 11%Adjusted
EBITDA (2) 1,039 159 82 1,280
Revenue (1) 2,745 818 460 4,023 3,847 ↑ 5%
TotalMalaysia UKUS &
Others Total

Revenue and Adjusted EBITDA - FY07 to FY11
12
……….… Overseas operations to contribute further
Review of Performance Revenue growth: ↑27% y-o-y (2011 vs 2010) to RM6,752 million (5-year CAGR: 12%)
Adjusted EBITDA growth : ↑14% y-o-y (2011 vs 2010) to RM2,317 million (5-year CAGR: 7%)
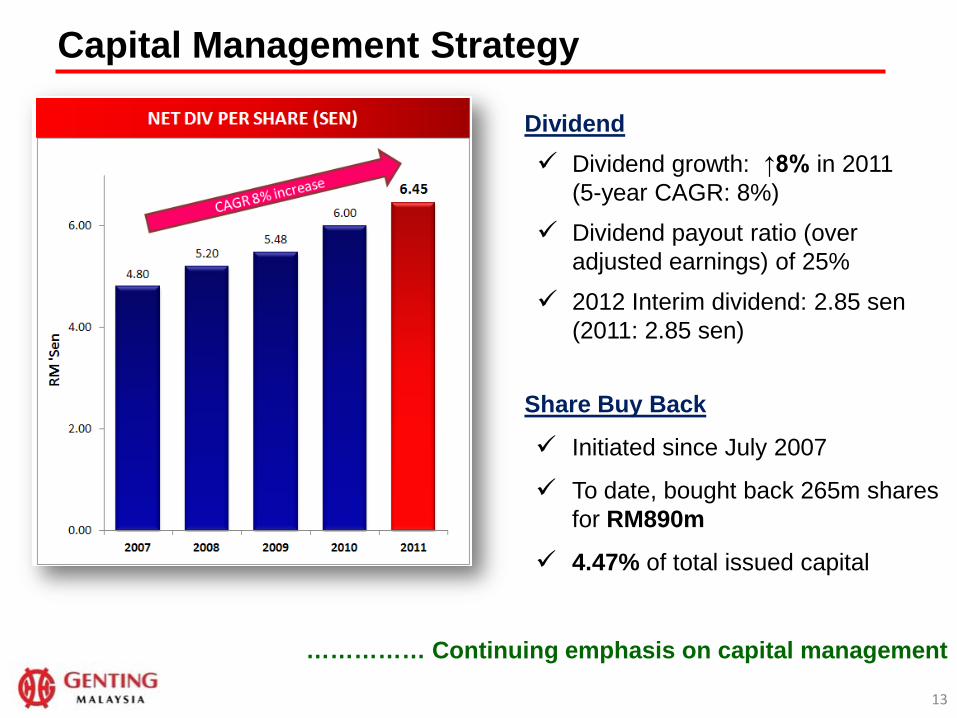
Capital Management Strategy
13
Dividend Dividend growth: ↑8% in 2011
(5-year CAGR: 8%)
Dividend payout ratio (over adjusted earnings) of 25%
2012 Interim dividend: 2.85 sen (2011: 2.85 sen)
Share Buy Back
Initiated since July 2007
To date, bought back 265m shares for RM890m
4.47% of total issued capital
…………… Continuing emphasis on capital management
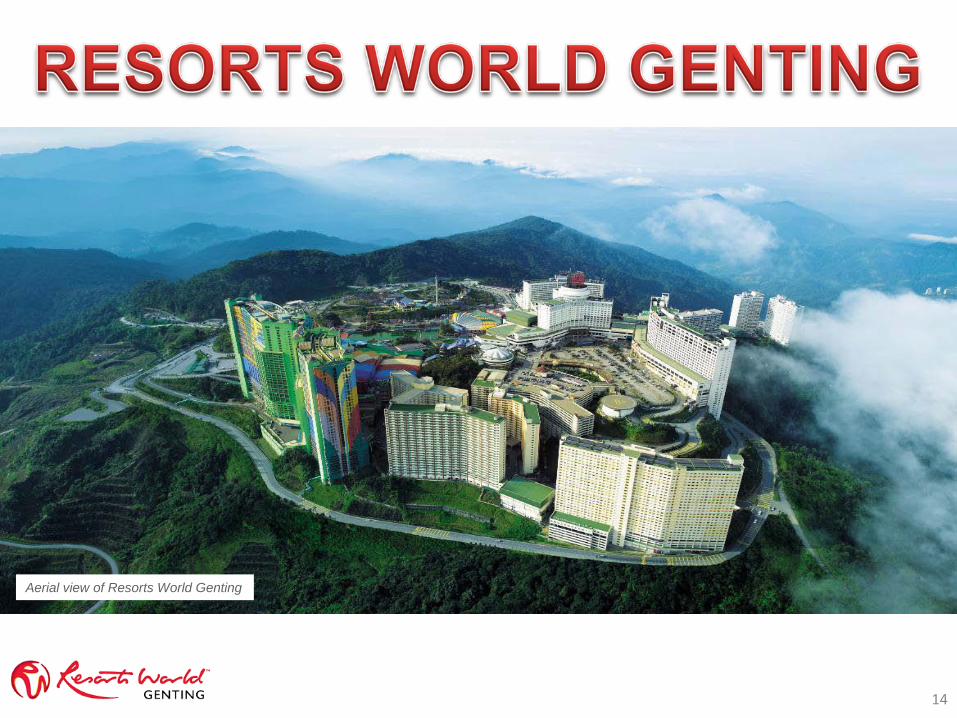
Aerial view of Resorts World Genting
14

Resorts World Genting – Performance Review
15
….…… Domestic operations resilient despite competition
Resilient Malaysian operations:
Revenue growth ↑7% y-o-y (2011 vs 2010) despite regional competition: Volume of business ↑ Average spend per visitor ↑
5-year CAGR : 6%
Adjusted EBITDA ↑6% y-o-y (2011 vs
2010): Margins consistent Managing operational cost
efficiencies
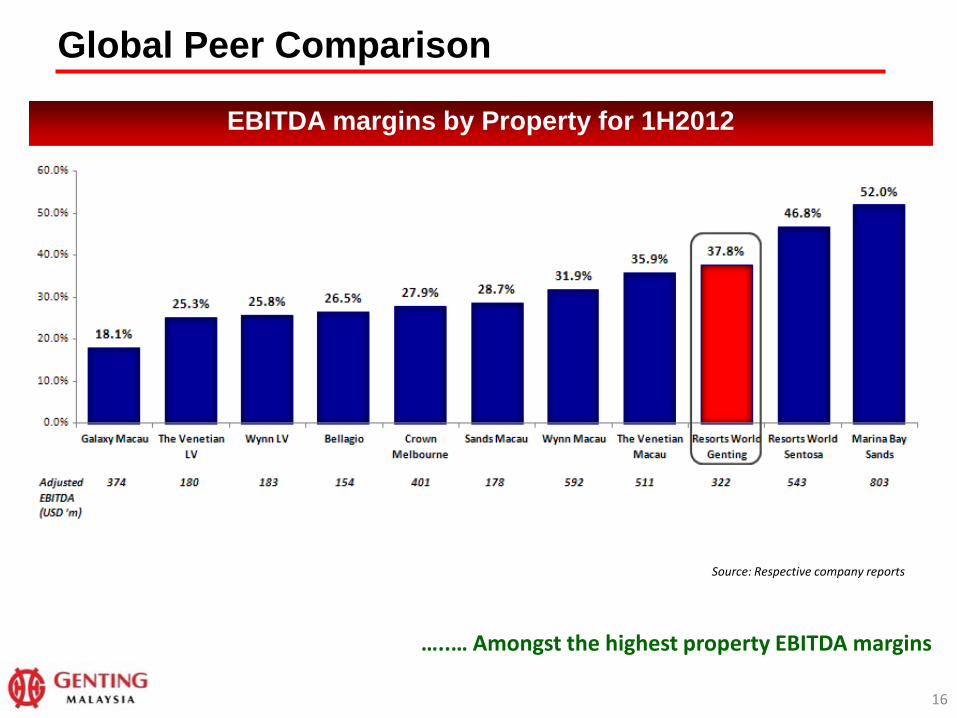
Global Peer Comparison
16
…..… Amongst the highest property EBITDA margins
EBITDA margins by Property for 1H2012
Source: Respective company reports

Resorts World Genting - Consistently High Occupancy Rates
17
……. Consistent high occupancy rates
2.7 million room nights sold in FY11 - Bus Program underpinned weekday occupancy Card members took up 73% in FY11 of room sold (FY10: 69%) Malaysians took over 63% of rooms sold Day trippers in excess of 70% of total visitors

Regional competition
18
Mass Market
Segment
VIP Market
A strong 65% revenue mix for mass market business
Strong domestic support
Locals form bulk of our 20m+ visitors
Over 3.3m loyalty card members
Competitive room rates, F&B and Theme Park prices
Resorts World Genting’s resilience
35% revenue mix for premium players business
Premium Members privileges
Competitive marketing and high level of service delivery
Expanded pie
… market continues to grow
… providing great value to the mass market
19
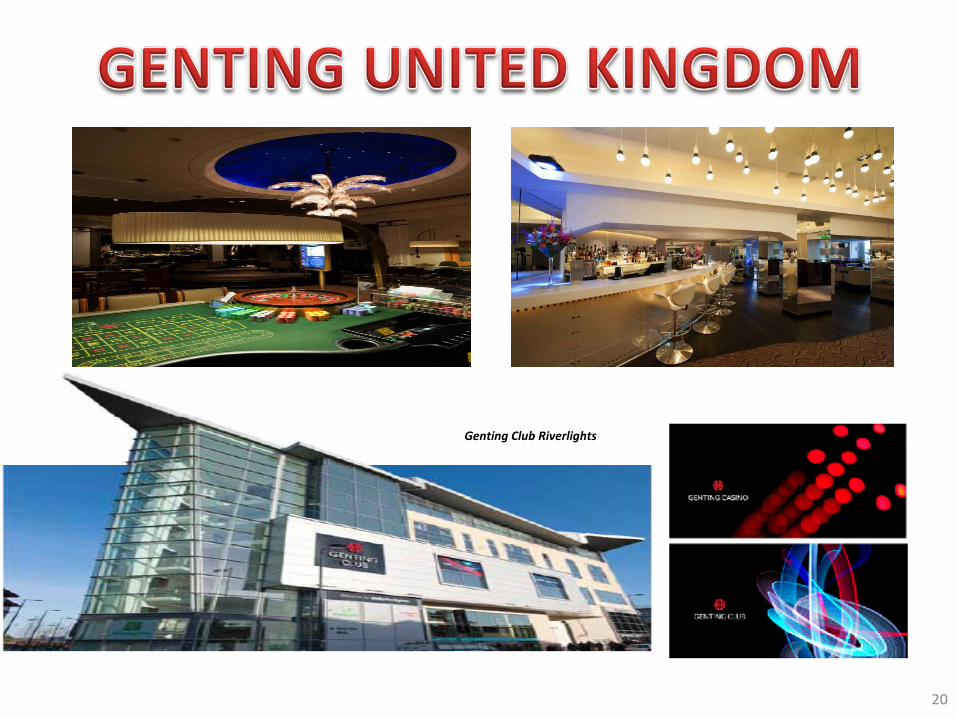
Genting Club Riverlights
20
21
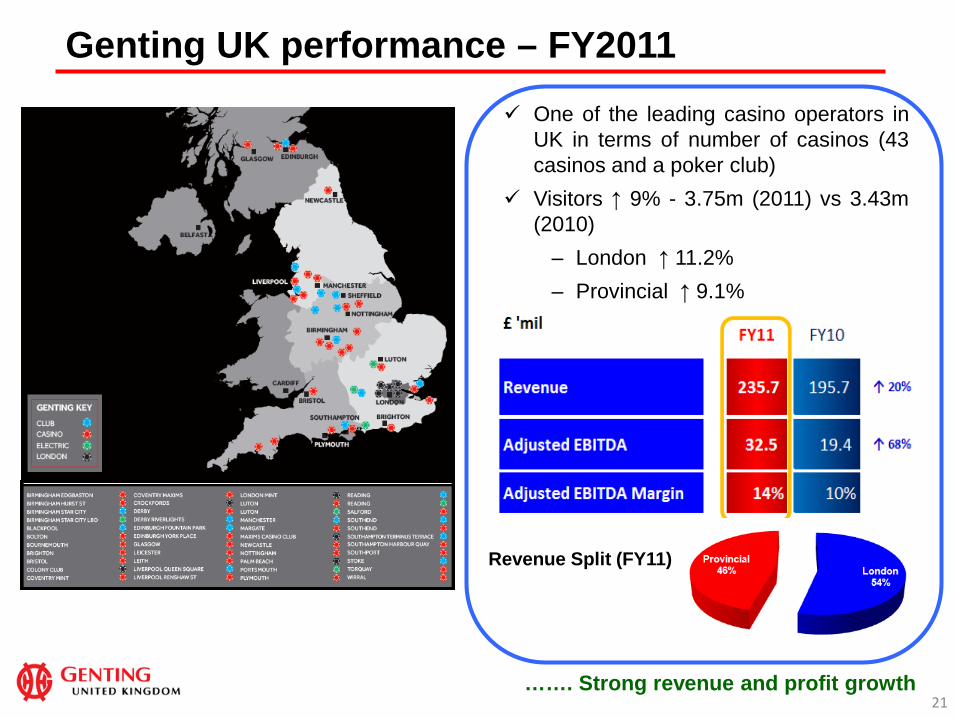
One of the leading casino operators in UK in terms of number of casinos (43 casinos and a poker club)
Visitors ↑ 9% - 3.75m (2011) vs 3.43m (2010)
– London ↑ 11.2% – Provincial ↑ 9.1%
Genting UK performance – FY2011
……. Strong revenue and profit growth
Revenue Split (FY11)
22
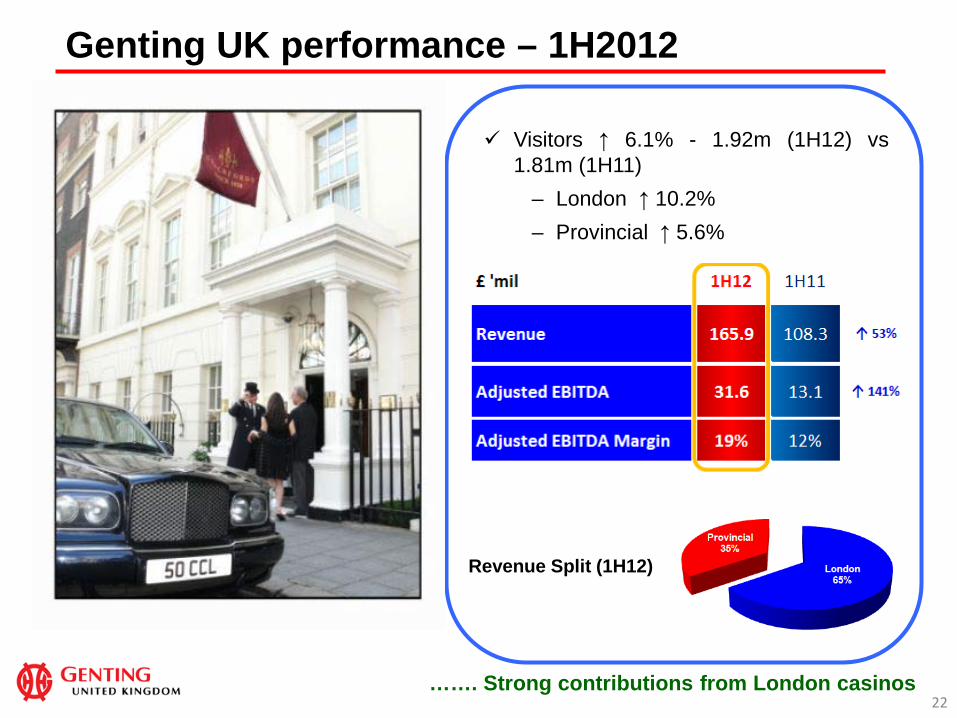
Visitors ↑ 6.1% - 1.92m (1H12) vs
1.81m (1H11) – London ↑ 10.2% – Provincial ↑ 5.6%
Revenue Split (1H12)
Genting UK performance – 1H2012
……. Strong contributions from London casinos

23
Resorts World At The NEC (“RWNEC”) - Background Awarded a large casino licence in July 2011 to develop a leisure and entertainment
complex at the National Exhibition Centre (“NEC”) in Birmingham, England
RWNEC is expected to be operational by mid 2015
Investment commitment circ. £140 million
Components of RWNEC
Casino (30 gaming tables, 150 slot machines, sports betting and bingo;)
4-star hotel (170 rooms, 5 suites, 2 junior suites, 1 Presidential suite)
Factory outlet retail
11-screen cinema
Conference and banqueting space
……. Creating a unique experience for UK

24
RWNEC – Strategic Proximity
15 minutes to airport
10 minutes to train station
Access to 5 motorways

25
26
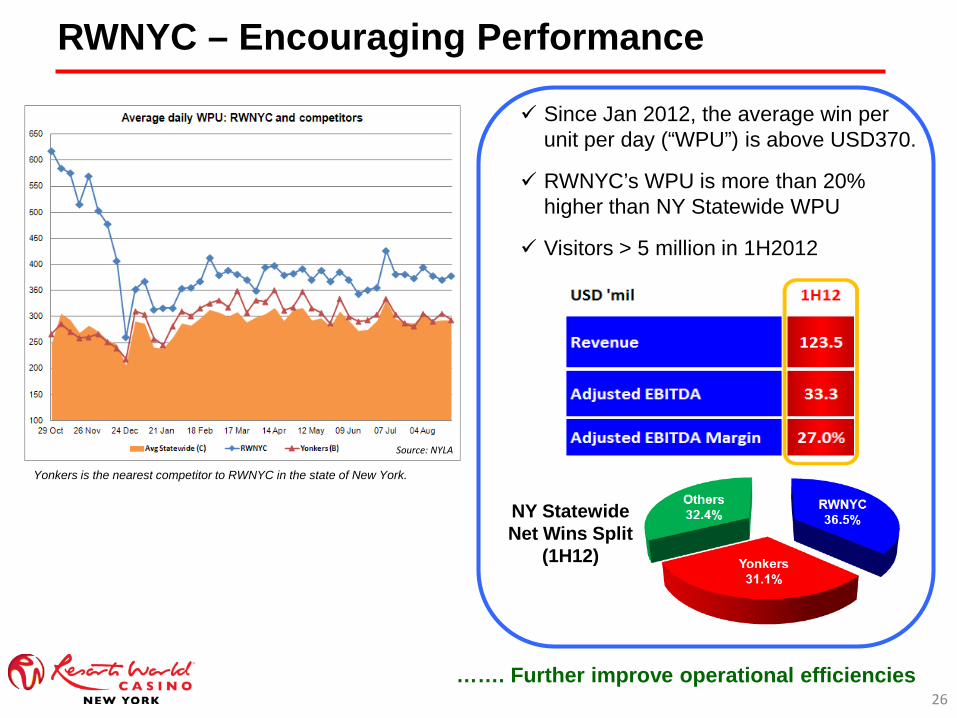
Source: NYLA
Yonkers is the nearest competitor to RWNYC in the state of New York.
RWNYC – Encouraging Performance
Since Jan 2012, the average win per unit per day (“WPU”) is above USD370.
RWNYC’s WPU is more than 20% higher than NY Statewide WPU
Visitors > 5 million in 1H2012
NY Statewide Net Wins Split
(1H12)
……. Further improve operational efficiencies
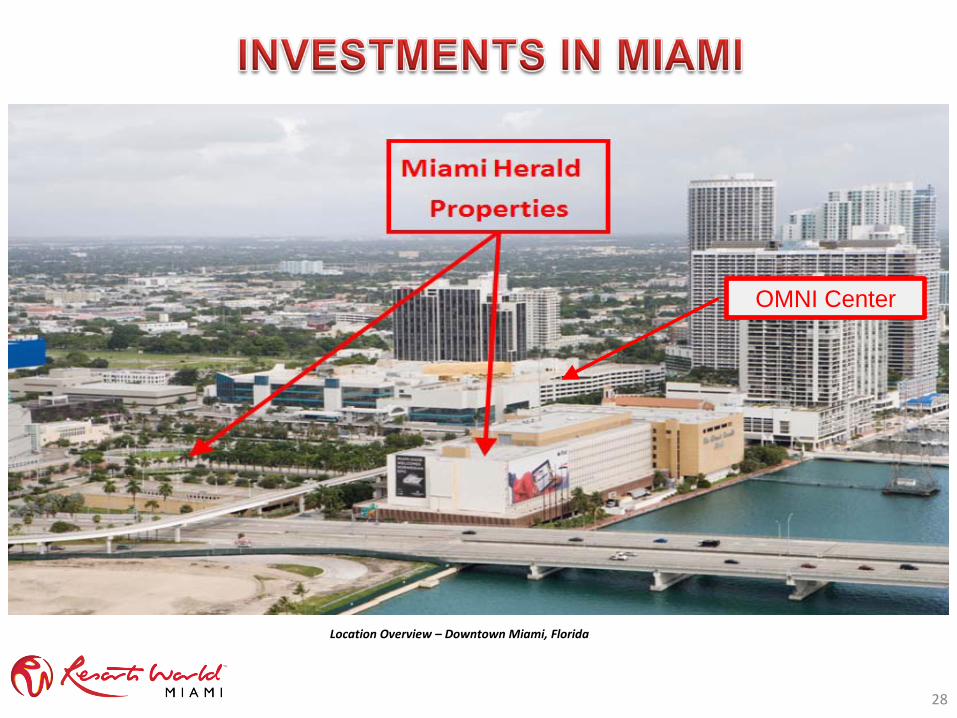
28
Location Overview – Downtown Miami, Florida
OMNI Center
29
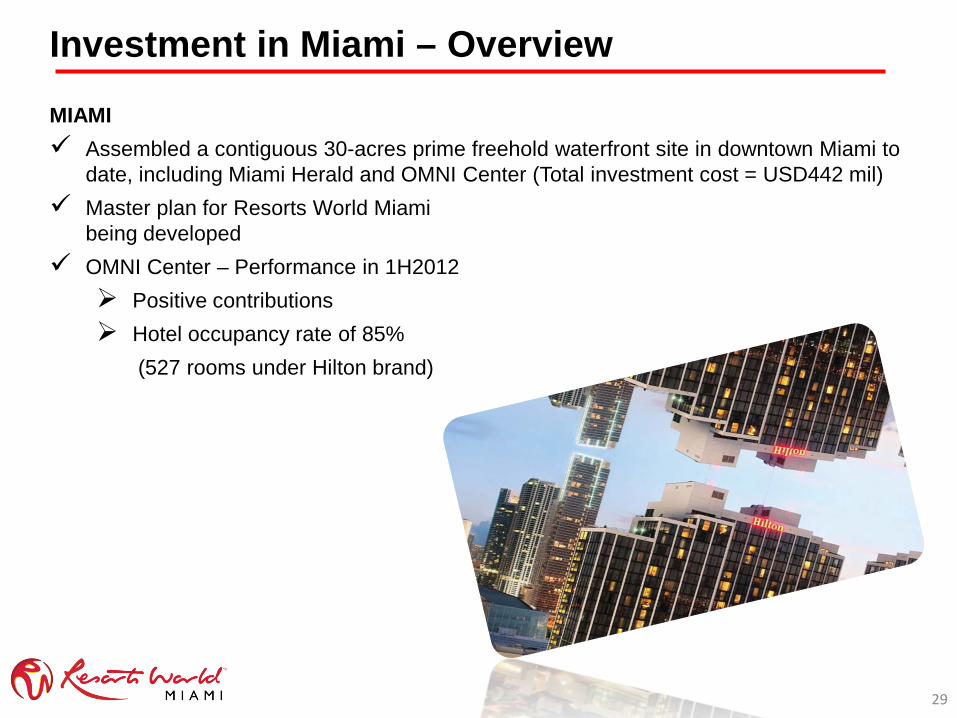
Investment in Miami – Overview
MIAMI Assembled a contiguous 30-acres prime freehold waterfront site in downtown Miami to
date, including Miami Herald and OMNI Center (Total investment cost = USD442 mil) Master plan for Resorts World Miami
being developed OMNI Center – Performance in 1H2012 Positive contributions Hotel occupancy rate of 85% (527 rooms under Hilton brand)

30
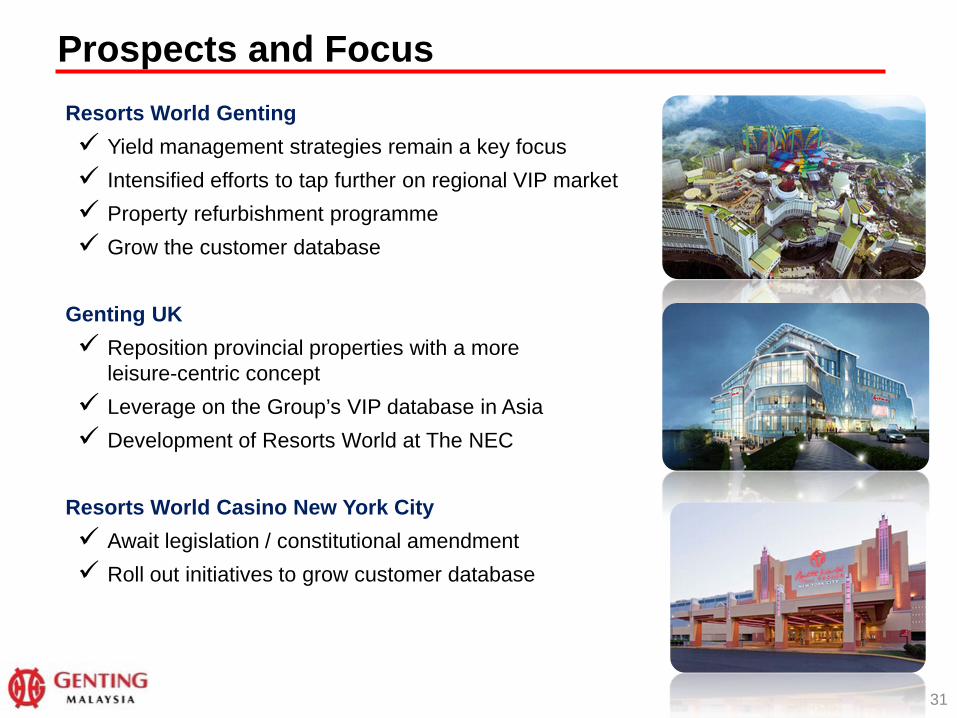
Prospects and Focus
31
Resorts World Genting Yield management strategies remain a key focus Intensified efforts to tap further on regional VIP market Property refurbishment programme Grow the customer database
Genting UK Reposition provincial properties with a more
leisure-centric concept Leverage on the Group’s VIP database in Asia Development of Resorts World at The NEC
Resorts World Casino New York City Await legislation / constitutional amendment Roll out initiatives to grow customer database
Disclaimer Some of the statements made in this presentation which are not statements of historical facts are forward-looking statements and are based on the current beliefs, assumptions, expectations, estimates, objectives and projections of the directors and management of the Genting Malaysia Group (“Group”) about its business and the industry and markets in which it operates. These statements are not guarantees of future performance and are subject to risks, uncertainties and other factors some of which are beyond the control of the Group and are difficult to predict. Consequently, actual results could differ materially from those expressed or forecast in the forward looking statements as a result of, among other factors, changes in economic and market conditions, changes in the regulatory environment and other business and operational risks. The Group does not undertake to update these forward-looking statements to reflect events or circumstances that may arise after publication.
Thank You Visit us at www.gentingmalaysia.com
32