Corporate Presentation - cwb.com/media/cwb group/documents/investor relations... · CWB Financial...
38
Corporate Presentation 2 nd Quarter 2018
Transcript of Corporate Presentation - cwb.com/media/cwb group/documents/investor relations... · CWB Financial...
Corporate Presentation 2nd Quarter 2018
2 CWB Financial Group
Advisory Forward-looking Statements From time to time, CWB makes written and verbal forward-looking statements. Statements of this type are included in the Annual Report and reports to shareholders and may be included in filings with Canadian securities regulators or in other communications such as press releases and corporate presentations. Forward-looking statements include, but are not limited to, statements about CWB’s objectives and strategies, targeted and expected financial results and the outlook for CWB’s businesses or for the Canadian economy. Forward-looking statements are typically identified by the words “believe”, “expect”, “anticipate”, “intend”, “estimate”, “may increase”, “may impact”, “goal”, “focus”, “potential”, “proposed” and other similar expressions, or future or conditional verbs such as “will”, “should”, “would” and “could”.
By their very nature, forward-looking statements involve numerous assumptions and are subject to inherent risks and uncertainties, which give rise to the possibility that management’s predictions, forecasts, projections, expectations and conclusions will not prove to be accurate, that its assumptions may not be correct and that its strategic goals will not be achieved.
A variety of factors, many of which are beyond CWB’s control, may cause actual results to differ materially from the expectations expressed in the forward-looking statements. These factors include, but are not limited to, general business and economic conditions in Canada, including the volatility and level of liquidity in financial markets, fluctuations in interest rates and currency values, the volatility and level of various commodity prices, changes in monetary policy, changes in economic and political conditions, legislative and regulatory developments, legal developments, the level of competition, the occurrence of natural catastrophes, changes in accounting standards and policies, the accuracy and completeness of information CWB receives about customers and counterparties, the ability to attract and retain key personnel, the ability to complete and integrate acquisitions, reliance on third parties to provide components of business infrastructure, changes in tax laws, technological developments, unexpected changes in consumer spending and saving habits, timely development and introduction of new products, and management’s ability to anticipate and manage the risks associated with these factors. It is important to note that the preceding list is not exhaustive of possible factors.
Additional information about these factors can be found in the Risk Management section of CWB’s annual Management’s Discussion and Analysis (MD&A). These and other factors should be considered carefully, and readers are cautioned not to place undue reliance on these forward-looking statements as a number of important factors could cause CWB’s actual results to differ materially from the expectations expressed in such forward-looking statements. Unless required by securities law, CWB does not undertake to update any forward-looking statement, whether written or verbal, that may be made from time to time by it or on its behalf.
Assumptions about the performance of the Canadian economy over the forecast horizon and how it will affect CWB’s businesses are material factors considered when setting organizational objectives and targets. In determining our expectations for economic growth, we primarily consider economic data and forecasts provided by the Canadian government and its agencies, as well as an average of certain private sector forecasts. These forecasts are subject to inherent risks and uncertainties that may be general or specific. Where relevant, material economic assumptions underlying forward looking statements are disclosed.
3 CWB Financial Group
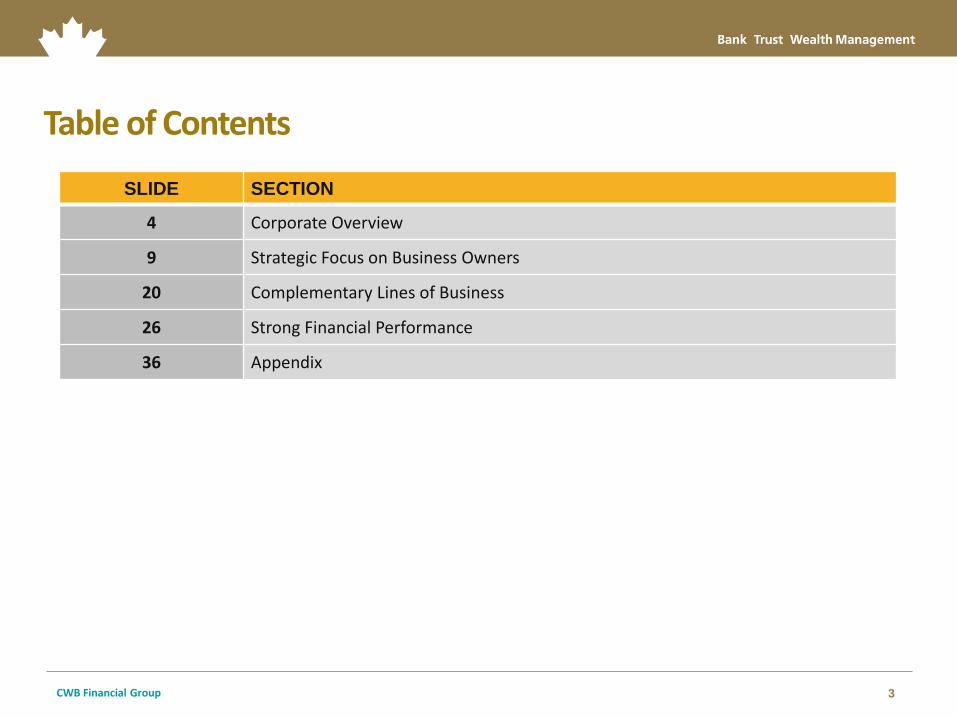
Table of Contents
SLIDE SECTION
4 Corporate Overview
9 Strategic Focus on Business Owners
20 Complementary Lines of Business
26 Strong Financial Performance
36 Appendix
4 CWB Financial Group
Corporate Overview
5 CWB Financial Group
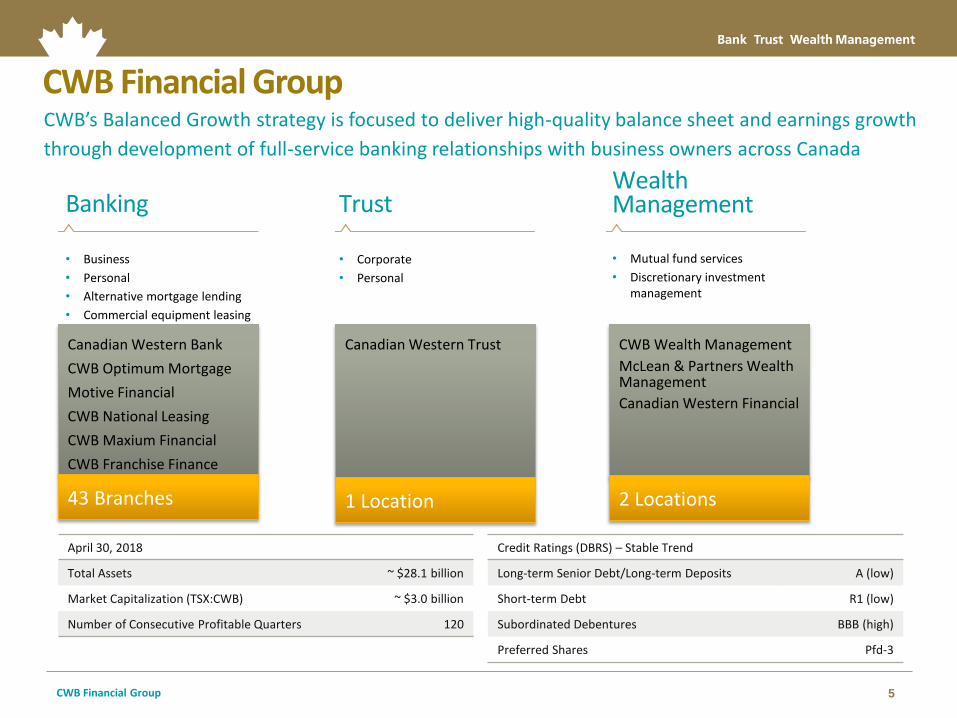
CWB’s Balanced Growth strategy is focused to deliver high-quality balance sheet and earnings growth
through development of full-service banking relationships with business owners across Canada
CWB Financial Group
Canadian Western Bank
CWB Optimum Mortgage
Motive Financial
CWB National Leasing
CWB Maxium Financial
CWB Franchise Finance
Canadian Western Trust CWB Wealth Management
McLean & Partners Wealth Management
Canadian Western Financial
April 30, 2018
Total Assets ~ $28.1 billion
Market Capitalization (TSX:CWB) ~ $3.0 billion
Number of Consecutive Profitable Quarters 120
Credit Ratings (DBRS) – Stable Trend
Long-term Senior Debt/Long-term Deposits A (low)
Short-term Debt R1 (low)
Subordinated Debentures BBB (high)
Preferred Shares Pfd-3
43 Branches
Banking
• Business
• Personal
• Alternative mortgage lending
• Commercial equipment leasing
1 Location 2 Locations
Trust
• Corporate
• Personal
Wealth Management
• Mutual fund services
• Discretionary investment management
6 CWB Financial Group
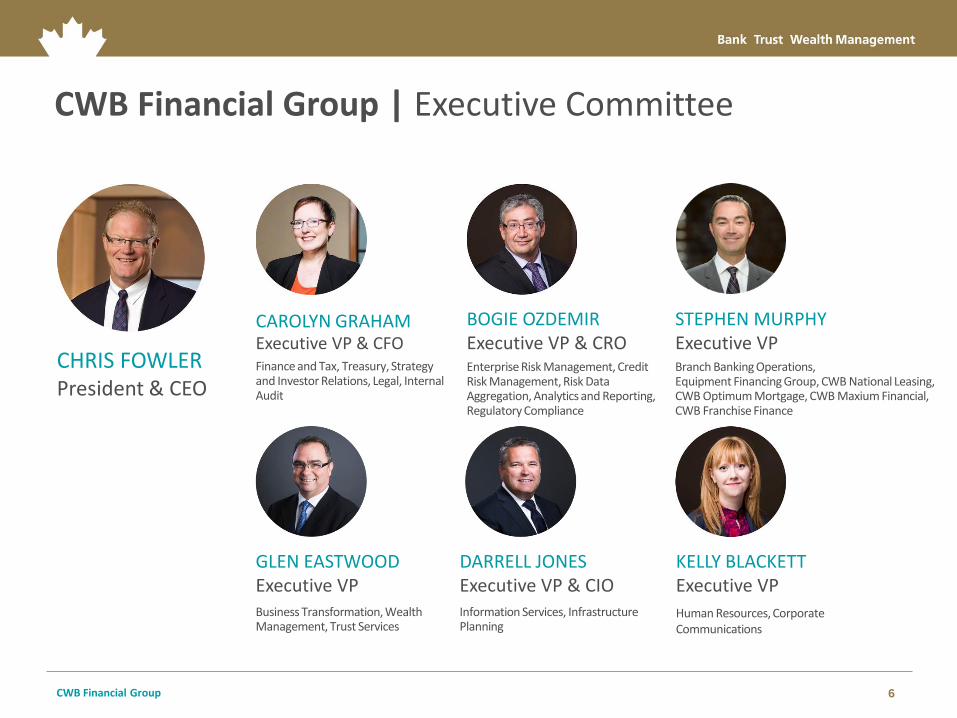
CWB Financial Group | Executive Committee
CHRIS FOWLER President & CEO
CAROLYN GRAHAM Executive VP & CFO Finance and Tax, Treasury, Strategy and Investor Relations, Legal, Internal Audit
BOGIE OZDEMIR Executive VP & CRO Enterprise Risk Management, Credit Risk Management, Risk Data Aggregation, Analytics and Reporting, Regulatory Compliance
STEPHEN MURPHY Executive VP Branch Banking Operations, Equipment Financing Group, CWB National Leasing, CWB Optimum Mortgage, CWB Maxium Financial, CWB Franchise Finance
GLEN EASTWOOD Executive VP Business Transformation, Wealth Management, Trust Services
KELLY BLACKETT Executive VP
Human Resources, Corporate Communications
DARRELL JONES Executive VP & CIO Information Services, Infrastructure Planning
7 CWB Financial Group
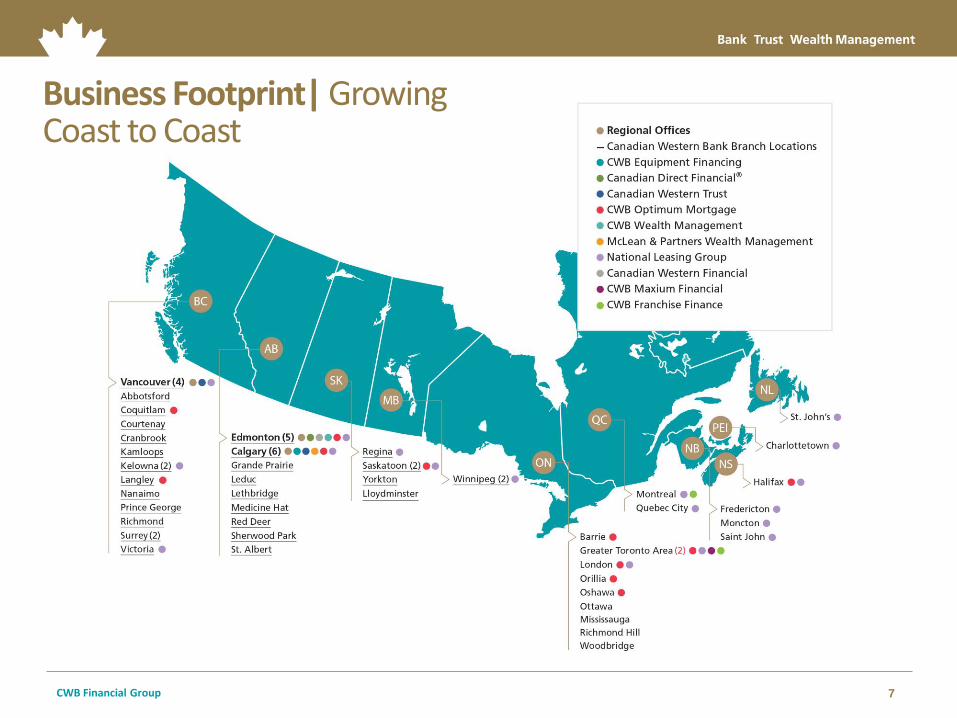
Business Footprint| Growing Coast to Coast
8 CWB Financial Group
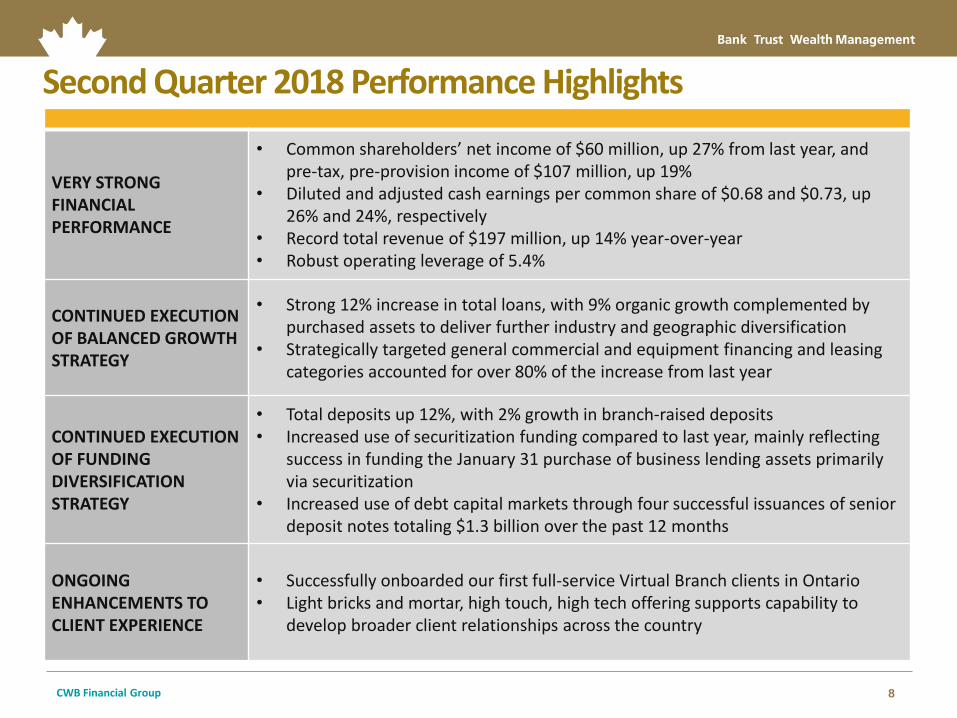
Second Quarter 2018 Performance Highlights
VERY STRONG FINANCIAL PERFORMANCE
• Common shareholders’ net income of $60 million, up 27% from last year, and pre-tax, pre-provision income of $107 million, up 19%
• Diluted and adjusted cash earnings per common share of $0.68 and $0.73, up 26% and 24%, respectively
• Record total revenue of $197 million, up 14% year-over-year • Robust operating leverage of 5.4%
CONTINUED EXECUTION OF BALANCED GROWTH STRATEGY
• Strong 12% increase in total loans, with 9% organic growth complemented by purchased assets to deliver further industry and geographic diversification
• Strategically targeted general commercial and equipment financing and leasing categories accounted for over 80% of the increase from last year
CONTINUED EXECUTION OF FUNDING DIVERSIFICATION STRATEGY
• Total deposits up 12%, with 2% growth in branch-raised deposits • Increased use of securitization funding compared to last year, mainly reflecting
success in funding the January 31 purchase of business lending assets primarily via securitization
• Increased use of debt capital markets through four successful issuances of senior deposit notes totaling $1.3 billion over the past 12 months
ONGOING ENHANCEMENTS TO CLIENT EXPERIENCE
• Successfully onboarded our first full-service Virtual Branch clients in Ontario • Light bricks and mortar, high touch, high tech offering supports capability to
develop broader client relationships across the country
9 CWB Financial Group
Strategic Focus on Business Owners
10 CWB Financial Group
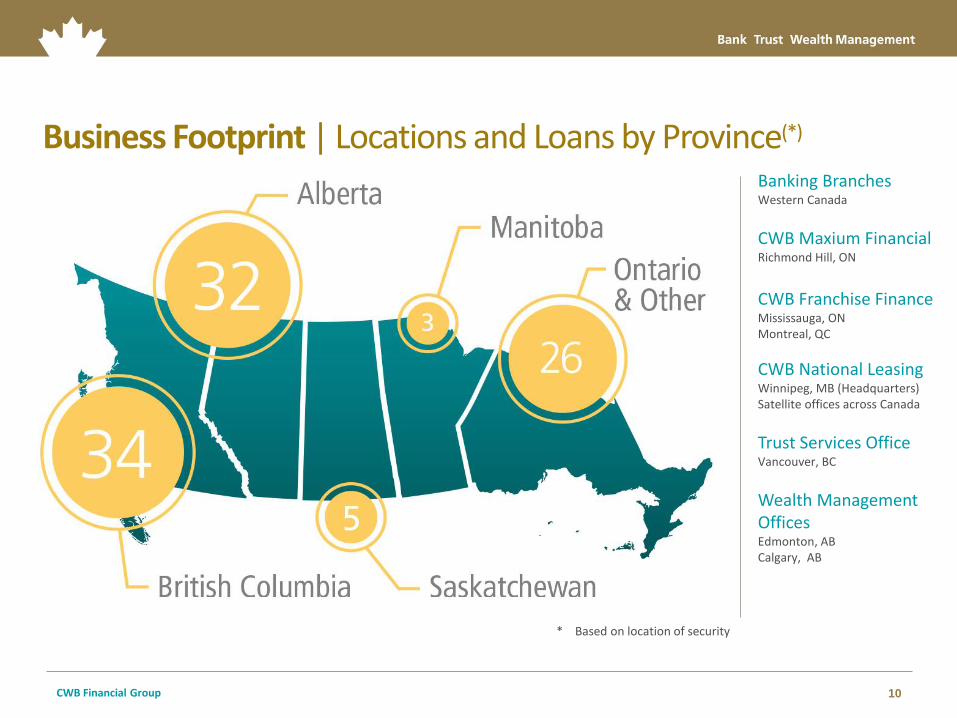
Business Footprint | Locations and Loans by Province(*) Banking Branches Western Canada
CWB Maxium Financial Richmond Hill, ON
CWB Franchise Finance Mississauga, ON Montreal, QC
CWB National Leasing Winnipeg, MB (Headquarters) Satellite offices across Canada
Trust Services Office
Vancouver, BC
Wealth Management Offices Edmonton, AB Calgary, AB
* Based on location of security
11 CWB Financial Group
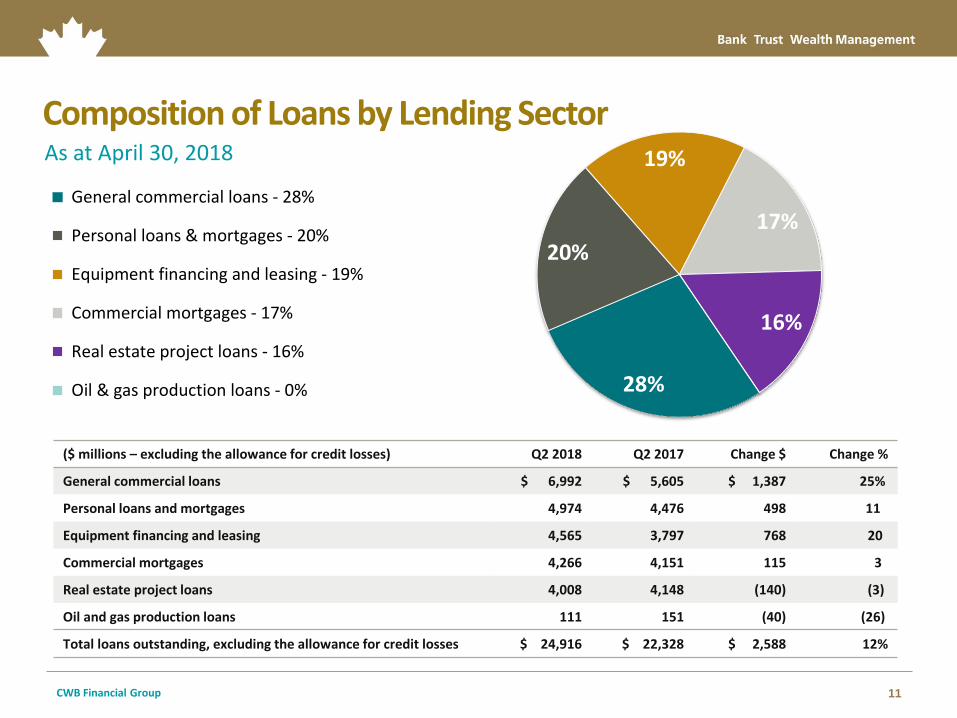
Composition of Loans by Lending Sector As at April 30, 2018
($ millions – excluding the allowance for credit losses) Q2 2018 Q2 2017 Change $ Change %
General commercial loans $ 6,992 $ 5,605 $ 1,387 25%
Personal loans and mortgages 4,974 4,476 498 11
Equipment financing and leasing 4,565 3,797 768 20
Commercial mortgages 4,266 4,151 115 3
Real estate project loans 4,008 4,148 (140) (3)
Oil and gas production loans 111 151 (40) (26)
Total loans outstanding, excluding the allowance for credit losses $ 24,916 $ 22,328 $ 2,588 12%
28%
20%
19%
17%
16%
General commercial loans - 28%
Personal loans & mortgages - 20%
Equipment financing and leasing - 19%
Commercial mortgages - 17%
Real estate project loans - 16%
Oil & gas production loans - 0%
12 CWB Financial Group
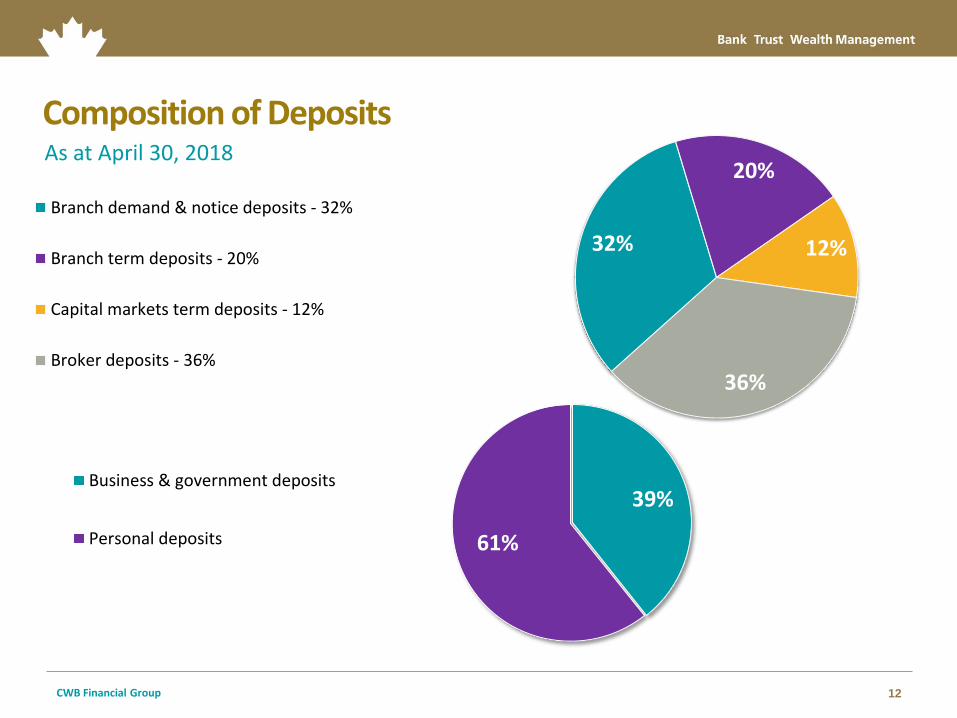
Composition of Deposits As at April 30, 2018
32%
20%
12%
36%
Branch demand & notice deposits - 32%
Branch term deposits - 20%
Capital markets term deposits - 12%
Broker deposits - 36%
39%
61%
Business & government deposits
Personal deposits
13 CWB Financial Group
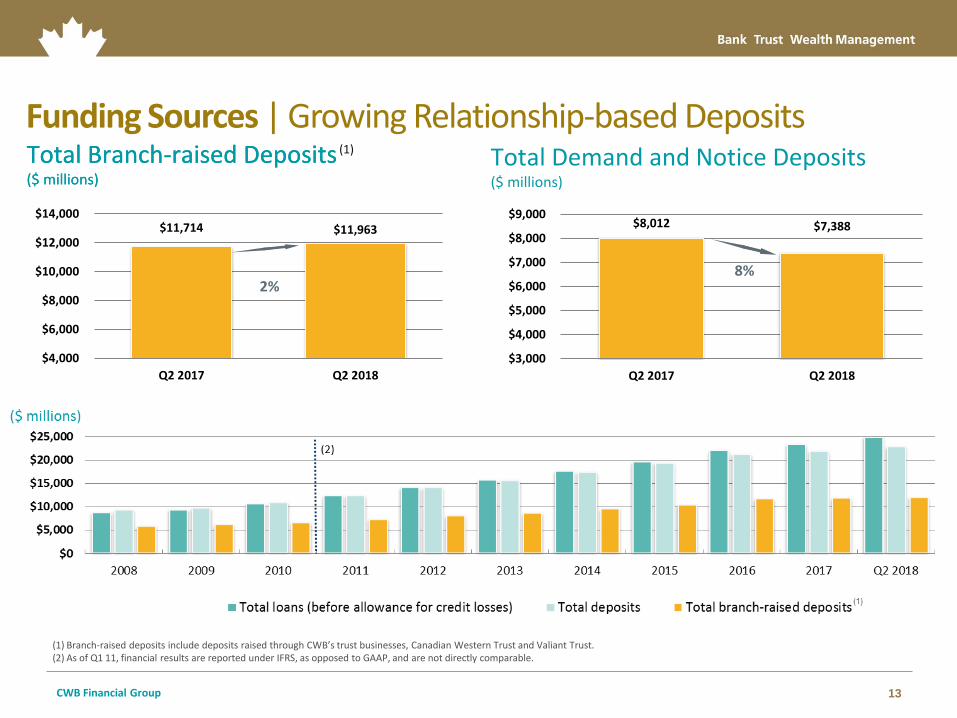
$11,714 $11,963
$4,000
$6,000
$8,000
$10,000
$12,000
$14,000
Q2 2017 Q2 2018
Total Branch-raised Deposits ($ millions)
2%
Total Branch-raised Deposits ($ millions)
Funding Sources | Growing Relationship-based Deposits
(1) Branch-raised deposits include deposits raised through CWB’s trust businesses, Canadian Western Trust and Valiant Trust. (2) As of Q1 11, financial results are reported under IFRS, as opposed to GAAP, and are not directly comparable.
(1)
$8,012 $7,388
$3,000
$4,000
$5,000
$6,000
$7,000
$8,000
$9,000
Q2 2017 Q2 2018
8%
Total Demand and Notice Deposits ($ millions)
14 CWB Financial Group
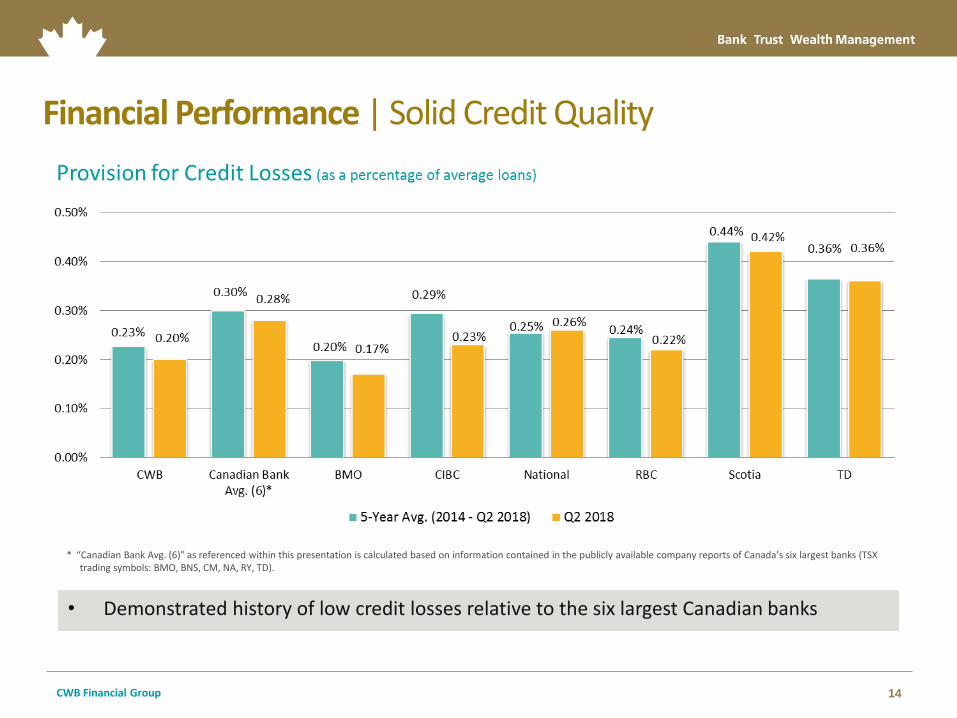
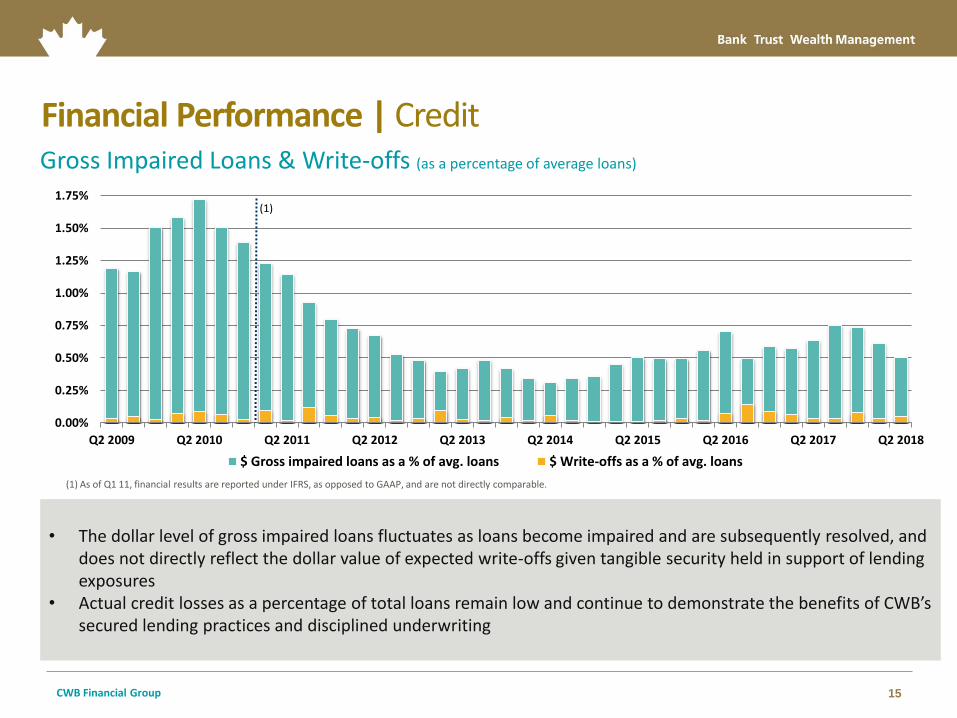
Financial Performance | Solid Credit Quality
* “Canadian Bank Avg. (6)” as referenced within this presentation is calculated based on information contained in the publicly available company reports of Canada’s six largest banks (TSX trading symbols: BMO, BNS, CM, NA, RY, TD).
• Demonstrated history of low credit losses relative to the six largest Canadian banks
15 CWB Financial Group
0.00%
0.25%
0.50%
0.75%
1.00%
1.25%
1.50%
1.75%
Q2 2009 Q2 2010 Q2 2011 Q2 2012 Q2 2013 Q2 2014 Q2 2015 Q2 2016 Q2 2017 Q2 2018
Gross Impaired Loans & Write-offs (as a percentage of average loans)
$ Gross impaired loans as a % of avg. loans $ Write-offs as a % of avg. loans
(1)
Financial Performance | Credit
• The dollar level of gross impaired loans fluctuates as loans become impaired and are subsequently resolved, and does not directly reflect the dollar value of expected write-offs given tangible security held in support of lending exposures
• Actual credit losses as a percentage of total loans remain low and continue to demonstrate the benefits of CWB’s secured lending practices and disciplined underwriting
(1) As of Q1 11, financial results are reported under IFRS, as opposed to GAAP, and are not directly comparable.
16 CWB Financial Group
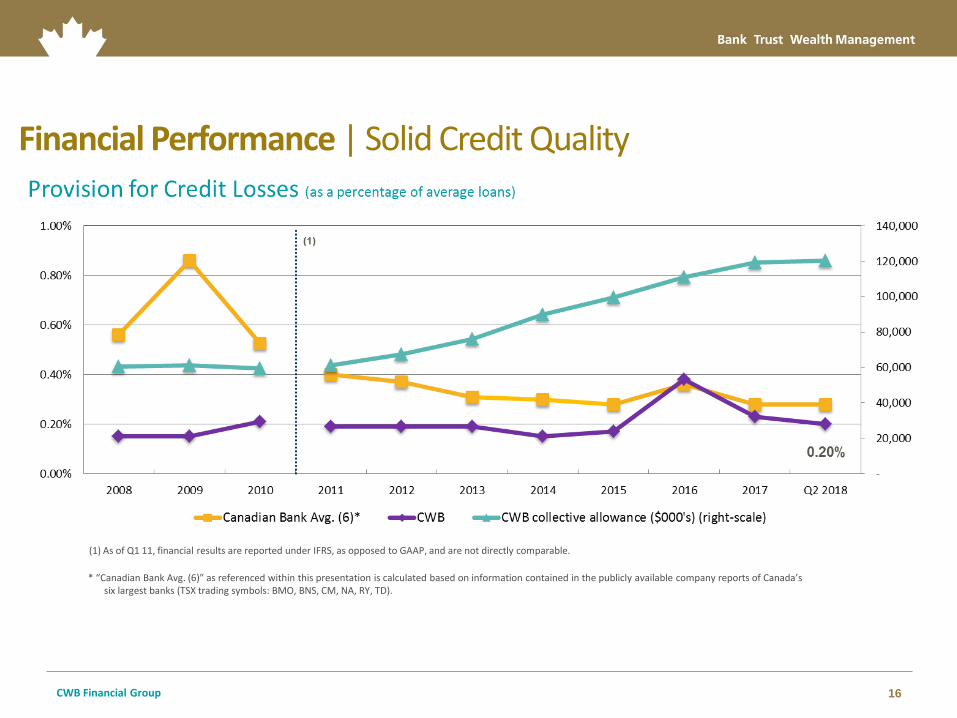
Financial Performance | Solid Credit Quality
(1) As of Q1 11, financial results are reported under IFRS, as opposed to GAAP, and are not directly comparable.
* “Canadian Bank Avg. (6)” as referenced within this presentation is calculated based on information contained in the publicly available company reports of Canada’s six largest banks (TSX trading symbols: BMO, BNS, CM, NA, RY, TD).
17 CWB Financial Group
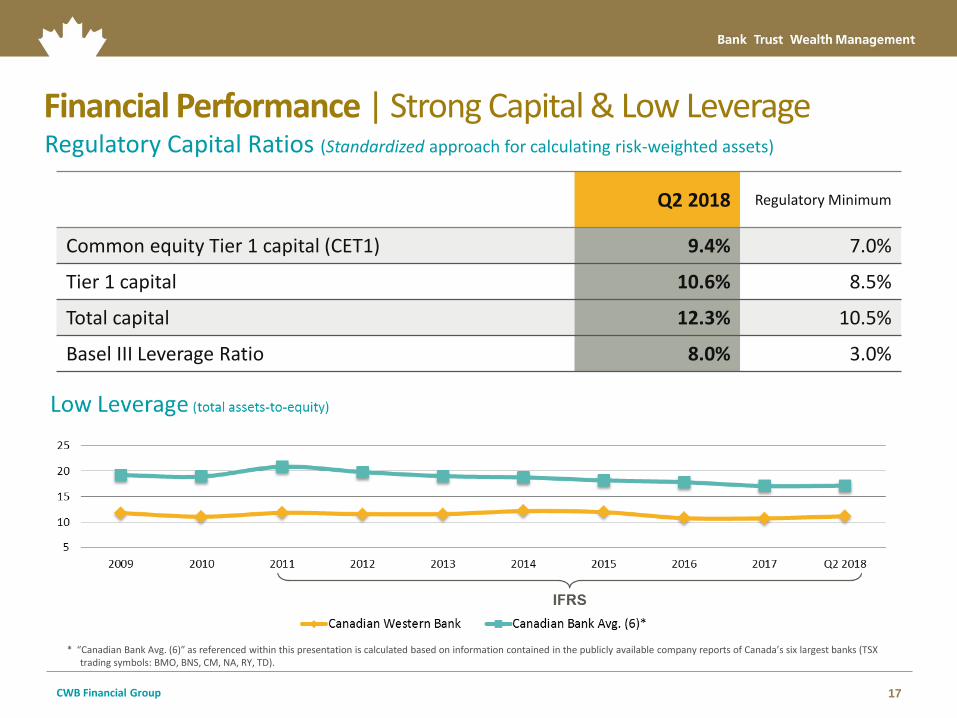
Financial Performance | Strong Capital & Low Leverage Regulatory Capital Ratios (Standardized approach for calculating risk-weighted assets)
* “Canadian Bank Avg. (6)” as referenced within this presentation is calculated based on information contained in the publicly available company reports of Canada’s six largest banks (TSX trading symbols: BMO, BNS, CM, NA, RY, TD).
Q2 2018 Regulatory Minimum
Common equity Tier 1 capital (CET1) 9.4% 7.0%
Tier 1 capital 10.6% 8.5%
Total capital 12.3% 10.5%
Basel III Leverage Ratio 8.0% 3.0%
18 CWB Financial Group
Financial Performance | Strong Capital & Low Leverage
* All comparative information as referenced within this presentation is calculated based on information contained in the publicly available company reports for fiscal 2017 of Canada’s six largest banks (TSX trading symbols: BMO, BNS, CM, NA, RY, TD) .
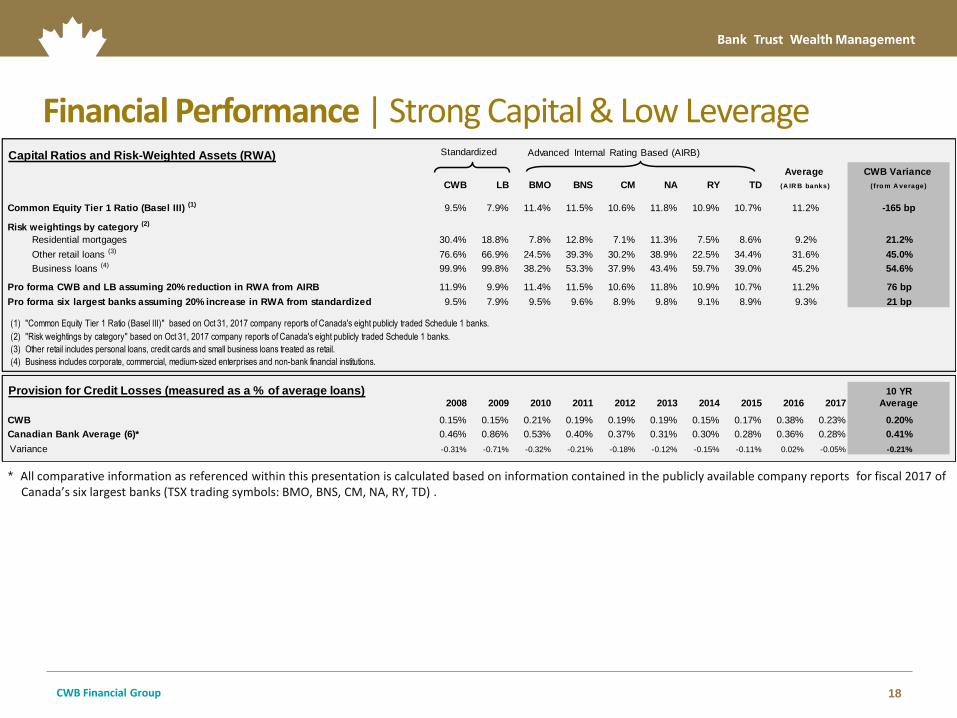
Capital Ratios and Risk-Weighted Assets (RWA)
CWB Variance
CWB LB BMO BNS CM NA RY TD ( f ro m A verage)
Common Equity Tier 1 Ratio (Basel III) (1) 9.5% 7.9% 11.4% 11.5% 10.6% 11.8% 10.9% 10.7% -165 bp
Risk weightings by category (2)
Residential mortgages 30.4% 18.8% 7.8% 12.8% 7.1% 11.3% 7.5% 8.6% 21.2%
Other retail loans (3) 76.6% 66.9% 24.5% 39.3% 30.2% 38.9% 22.5% 34.4% 45.0%
Business loans (4) 99.9% 99.8% 38.2% 53.3% 37.9% 43.4% 59.7% 39.0% 54.6%
Pro forma CWB and LB assuming 20% reduction in RWA from AIRB 11.9% 9.9% 11.4% 11.5% 10.6% 11.8% 10.9% 10.7% 76 bp
Pro forma six largest banks assuming 20% increase in RWA from standardized 9.5% 7.9% 9.5% 9.6% 8.9% 9.8% 9.1% 8.9% 21 bp
(1) "Common Equity Tier 1 Ratio (Basel III)" based on Oct 31, 2017 company reports of Canada's eight publicly traded Schedule 1 banks.
(2) "Risk weightings by category" based on Oct 31, 2017 company reports of Canada's eight publicly traded Schedule 1 banks.
(3) Other retail includes personal loans, credit cards and small business loans treated as retail.
(4) Business includes corporate, commercial, medium-sized enterprises and non-bank financial institutions.
Provision for Credit Losses (measured as a % of average loans) 10 YR
2008 2009 2010 2011 2012 2013 2014 2015 2016 2017 Average
CWB 0.15% 0.15% 0.21% 0.19% 0.19% 0.19% 0.15% 0.17% 0.38% 0.23% 0.20%
Canadian Bank Average (6)* 0.46% 0.86% 0.53% 0.40% 0.37% 0.31% 0.30% 0.28% 0.36% 0.28% 0.41%
Variance -0.31% -0.71% -0.32% -0.21% -0.18% -0.12% -0.15% -0.11% 0.02% -0.05% -0.21%
11.2%
9.3%
(A IR B banks)
Average
11.2%
9.2%
31.6%
45.2%
Advanced Internal Rating Based (AIRB) Standardized
19 CWB Financial Group
Complementary Lines of Business
20 CWB Financial Group
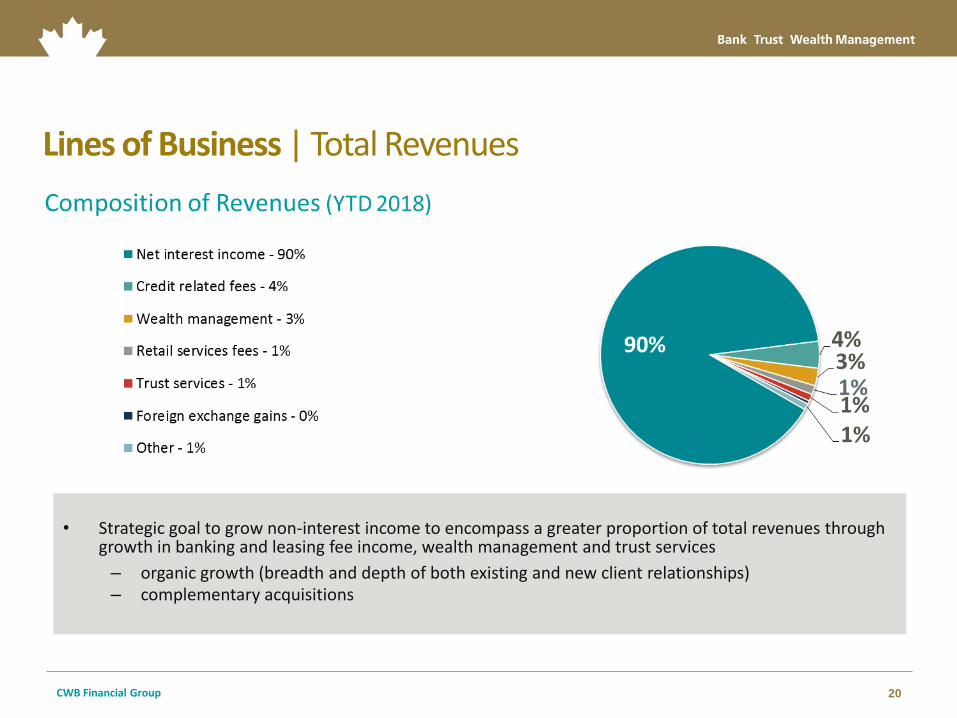
Lines of Business | Total Revenues
• Strategic goal to grow non-interest income to encompass a greater proportion of total revenues through
growth in banking and leasing fee income, wealth management and trust services
– organic growth (breadth and depth of both existing and new client relationships) – complementary acquisitions
21 CWB Financial Group
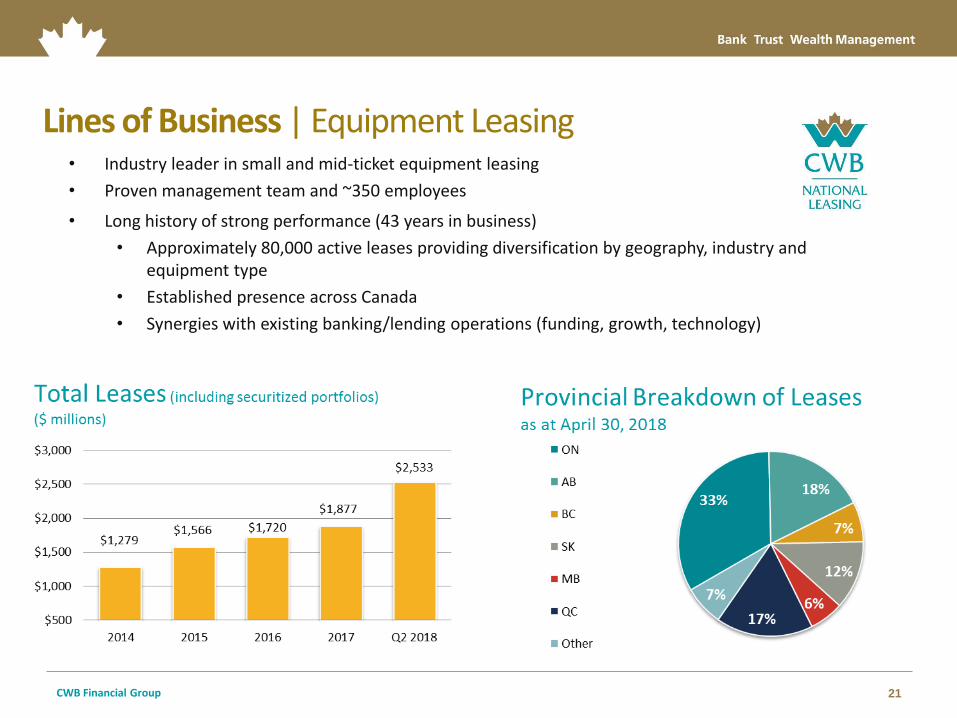
Lines of Business | Equipment Leasing • Industry leader in small and mid-ticket equipment leasing
• Proven management team and ~350 employees
• Long history of strong performance (43 years in business)
• Approximately 80,000 active leases providing diversification by geography, industry and equipment type
• Established presence across Canada
• Synergies with existing banking/lending operations (funding, growth, technology)
22 CWB Financial Group
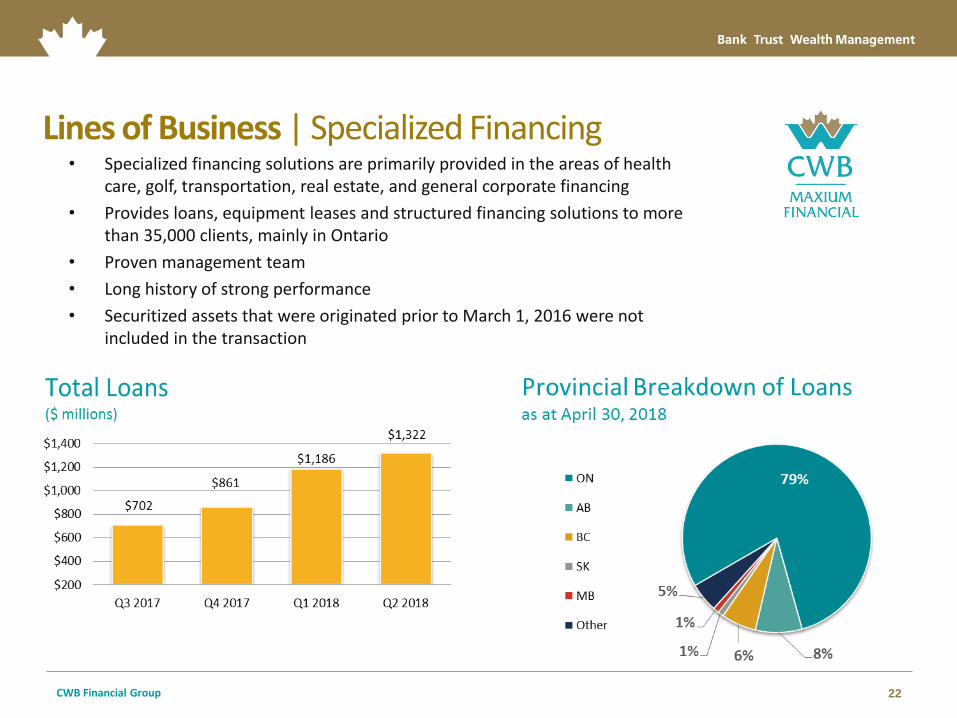
Lines of Business | Specialized Financing • Specialized financing solutions are primarily provided in the areas of health
care, golf, transportation, real estate, and general corporate financing
• Provides loans, equipment leases and structured financing solutions to more than 35,000 clients, mainly in Ontario
• Proven management team
• Long history of strong performance
• Securitized assets that were originated prior to March 1, 2016 were not included in the transaction
23 CWB Financial Group
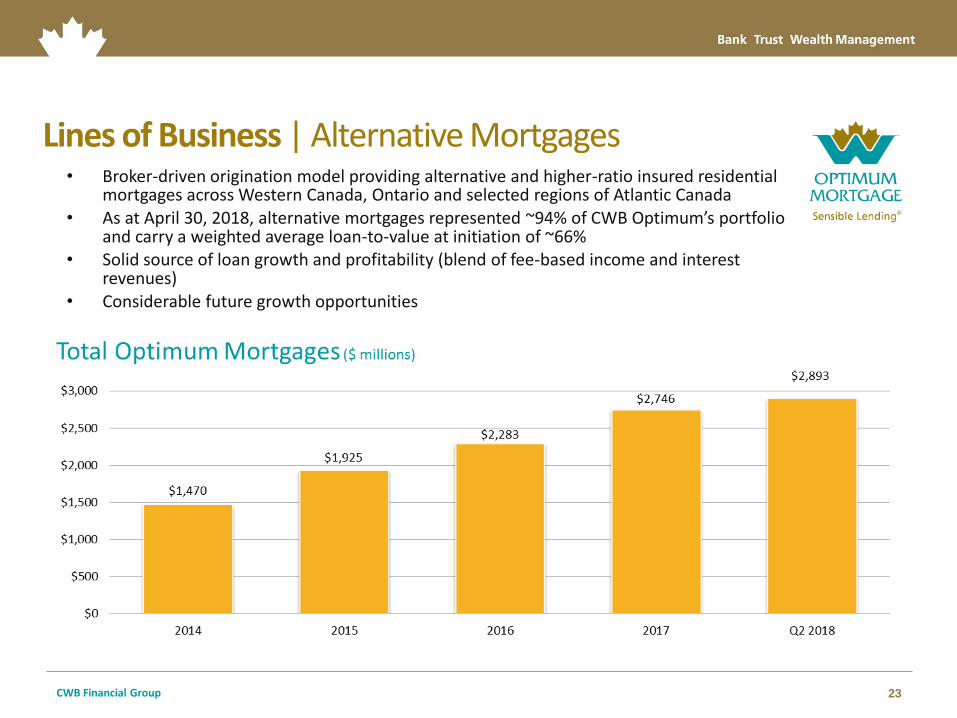
Lines of Business | Alternative Mortgages • Broker-driven origination model providing alternative and higher-ratio insured residential
mortgages across Western Canada, Ontario and selected regions of Atlantic Canada • As at April 30, 2018, alternative mortgages represented ~94% of CWB Optimum’s portfolio
and carry a weighted average loan-to-value at initiation of ~66% • Solid source of loan growth and profitability (blend of fee-based income and interest
revenues) • Considerable future growth opportunities
24 CWB Financial Group
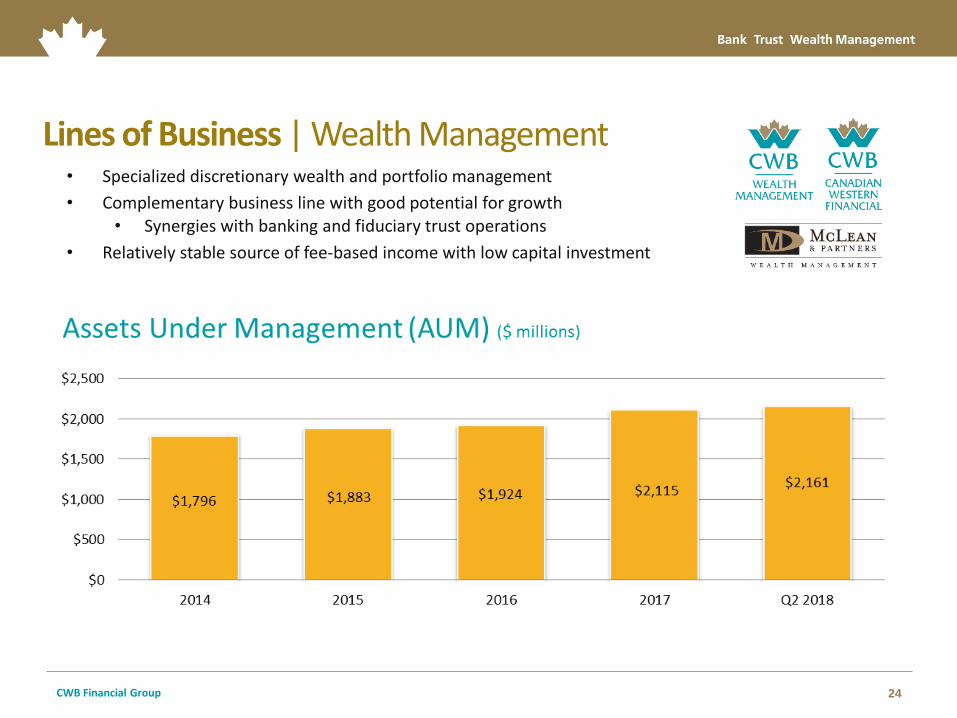
Lines of Business | Wealth Management • Specialized discretionary wealth and portfolio management
• Complementary business line with good potential for growth • Synergies with banking and fiduciary trust operations
• Relatively stable source of fee-based income with low capital investment
25 CWB Financial Group
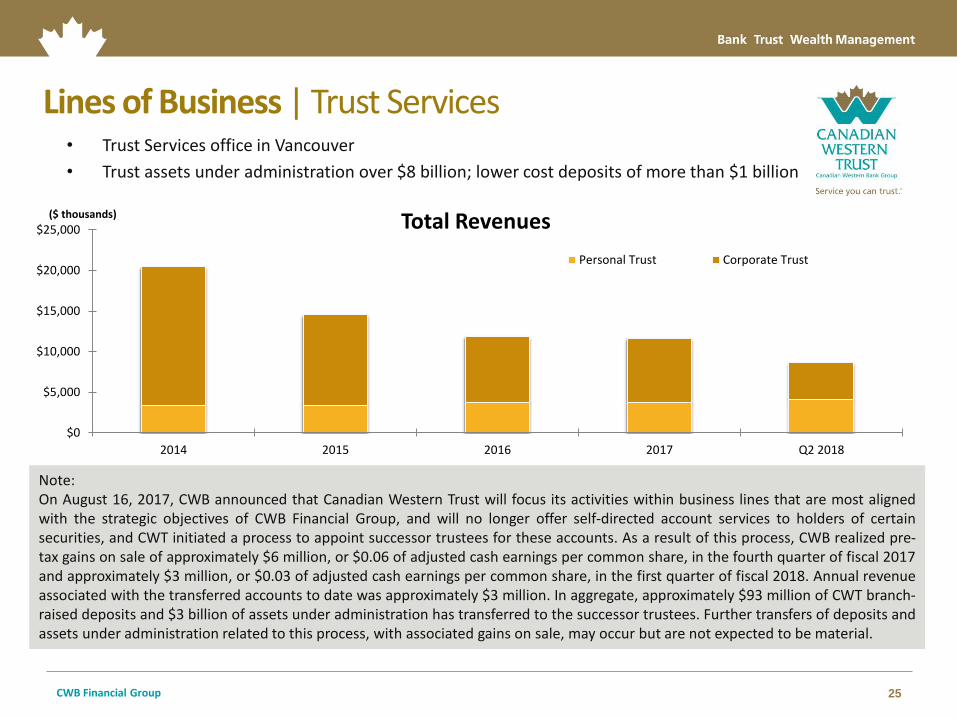
Lines of Business | Trust Services • Trust Services office in Vancouver
• Trust assets under administration over $8 billion; lower cost deposits of more than $1 billion
Note: On August 16, 2017, CWB announced that Canadian Western Trust will focus its activities within business lines that are most aligned with the strategic objectives of CWB Financial Group, and will no longer offer self-directed account services to holders of certain securities, and CWT initiated a process to appoint successor trustees for these accounts. As a result of this process, CWB realized pre-tax gains on sale of approximately $6 million, or $0.06 of adjusted cash earnings per common share, in the fourth quarter of fiscal 2017 and approximately $3 million, or $0.03 of adjusted cash earnings per common share, in the first quarter of fiscal 2018. Annual revenue associated with the transferred accounts to date was approximately $3 million. In aggregate, approximately $93 million of CWT branch-raised deposits and $3 billion of assets under administration has transferred to the successor trustees. Further transfers of deposits and assets under administration related to this process, with associated gains on sale, may occur but are not expected to be material.
$0
$5,000
$10,000
$15,000
$20,000
$25,000
2014 2015 2016 2017 Q2 2018
($ thousands) Total Revenues Personal Trust Corporate Trust
26 CWB Financial Group
Strong Financial Performance
27 CWB Financial Group
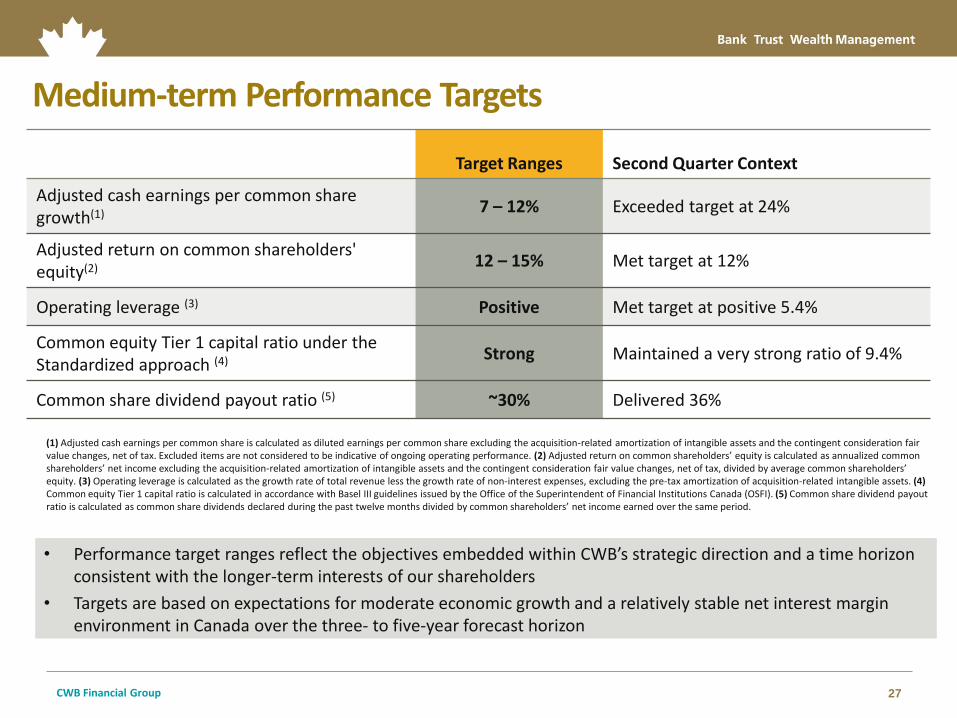
Medium-term Performance Targets
• Performance target ranges reflect the objectives embedded within CWB’s strategic direction and a time horizon consistent with the longer-term interests of our shareholders
• Targets are based on expectations for moderate economic growth and a relatively stable net interest margin environment in Canada over the three- to five-year forecast horizon
Target Ranges Second Quarter Context
Adjusted cash earnings per common share growth(1) 7 – 12% Exceeded target at 24%
Adjusted return on common shareholders' equity(2) 12 – 15% Met target at 12%
Operating leverage (3) Positive Met target at positive 5.4%
Common equity Tier 1 capital ratio under the Standardized approach (4) Strong Maintained a very strong ratio of 9.4%
Common share dividend payout ratio (5) ~30% Delivered 36%
(1) Adjusted cash earnings per common share is calculated as diluted earnings per common share excluding the acquisition-related amortization of intangible assets and the contingent consideration fair value changes, net of tax. Excluded items are not considered to be indicative of ongoing operating performance. (2) Adjusted return on common shareholders’ equity is calculated as annualized common shareholders’ net income excluding the acquisition-related amortization of intangible assets and the contingent consideration fair value changes, net of tax, divided by average common shareholders’ equity. (3) Operating leverage is calculated as the growth rate of total revenue less the growth rate of non-interest expenses, excluding the pre-tax amortization of acquisition-related intangible assets. (4) Common equity Tier 1 capital ratio is calculated in accordance with Basel III guidelines issued by the Office of the Superintendent of Financial Institutions Canada (OSFI). (5) Common share dividend payout ratio is calculated as common share dividends declared during the past twelve months divided by common shareholders’ net income earned over the same period.
28 CWB Financial Group
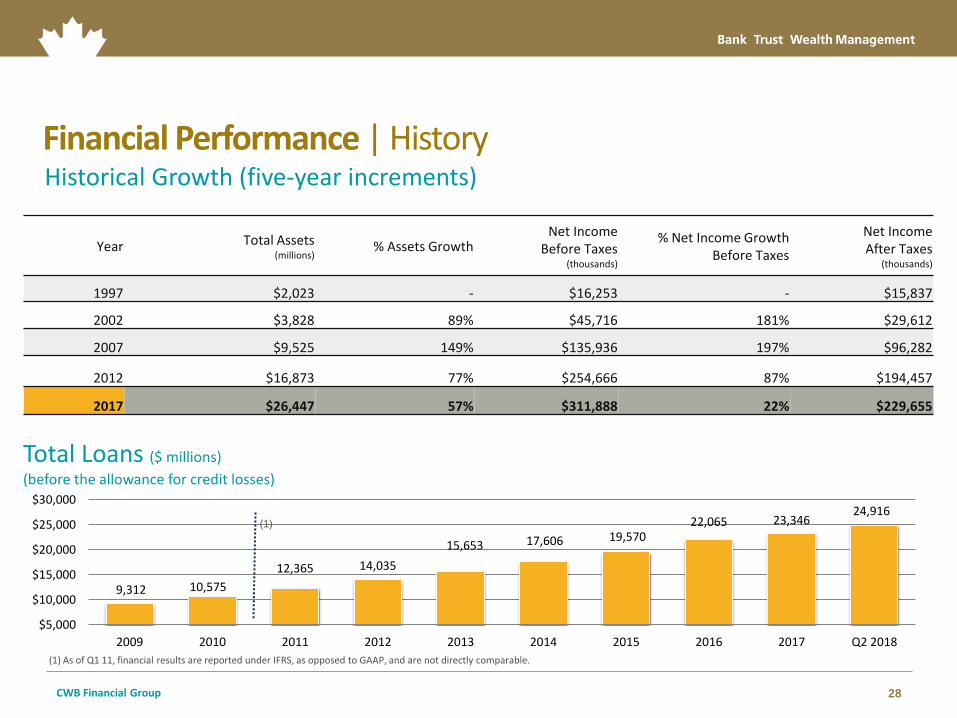
9,312 10,575
12,365 14,035
15,653 17,606 19,570 22,065 23,346
24,916
$5,000
$10,000
$15,000
$20,000
$25,000
$30,000
2009 2010 2011 2012 2013 2014 2015 2016 2017 Q2 2018
Total Loans ($ millions)
(before the allowance for credit losses)
(1)
Financial Performance | History Historical Growth (five-year increments)
(1) As of Q1 11, financial results are reported under IFRS, as opposed to GAAP, and are not directly comparable.
Year Total Assets (millions)
% Assets Growth Net Income
Before Taxes (thousands)
% Net Income Growth Before Taxes
Net Income After Taxes
(thousands)
1997 $2,023 - $16,253 - $15,837
2002 $3,828 89% $45,716 181% $29,612
2007 $9,525 149% $135,936 197% $96,282
2012 $16,873 77% $254,666 87% $194,457
2017 $26,447 57% $311,888 22% $229,655
29 CWB Financial Group
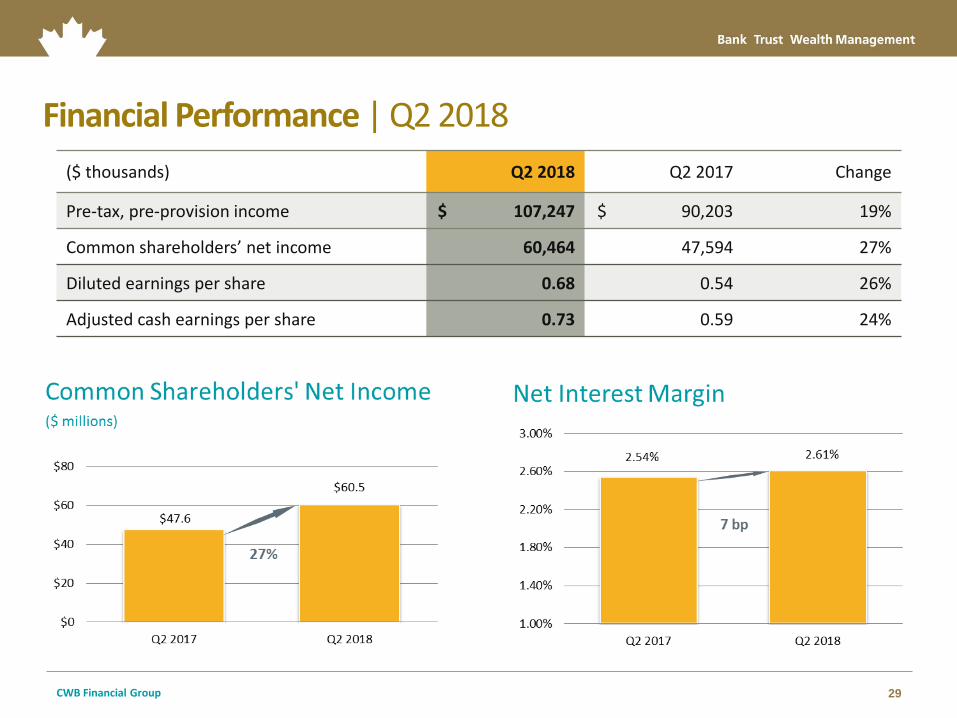
Financial Performance | Q2 2018
($ thousands) Q2 2018 Q2 2017 Change
Pre-tax, pre-provision income $ 107,247 $ 90,203 19%
Common shareholders’ net income 60,464 47,594 27%
Diluted earnings per share 0.68 0.54 26%
Adjusted cash earnings per share 0.73 0.59 24%
30 CWB Financial Group
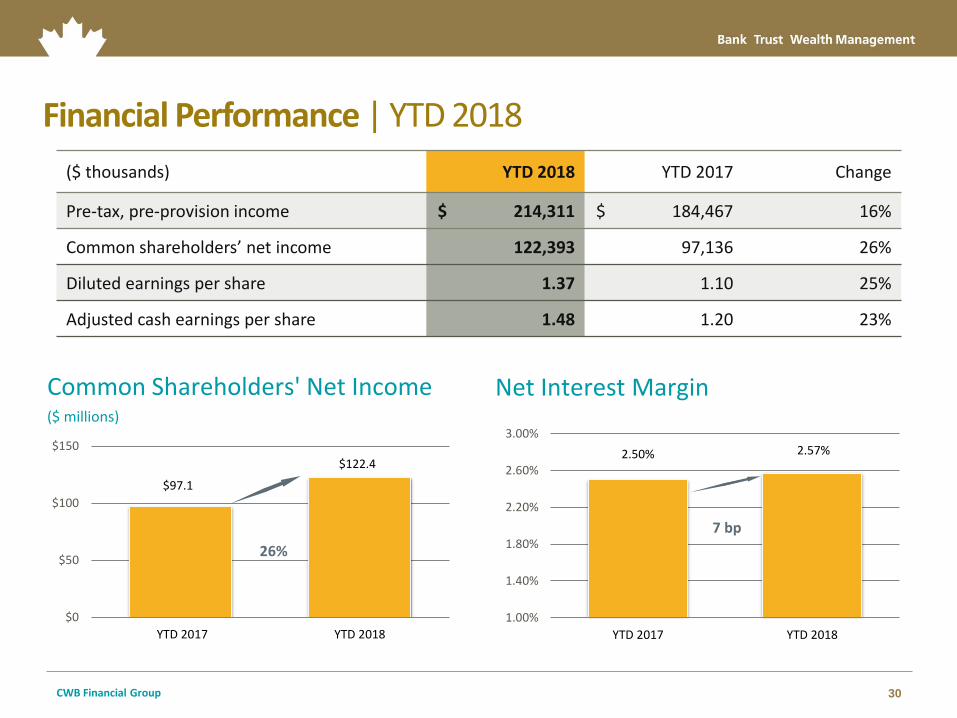
Financial Performance | YTD 2018
($ thousands) YTD 2018 YTD 2017 Change
Pre-tax, pre-provision income $ 214,311 $ 184,467 16%
Common shareholders’ net income 122,393 97,136 26%
Diluted earnings per share 1.37 1.10 25%
Adjusted cash earnings per share 1.48 1.20 23%
$97.1
$122.4
$0
$50
$100
$150
YTD 2017 YTD 2018
26%
Common Shareholders' Net Income ($ millions)
2.50% 2.57%
1.00%
1.40%
1.80%
2.20%
2.60%
3.00%
YTD 2017 YTD 2018
Net Interest Margin
7 bp
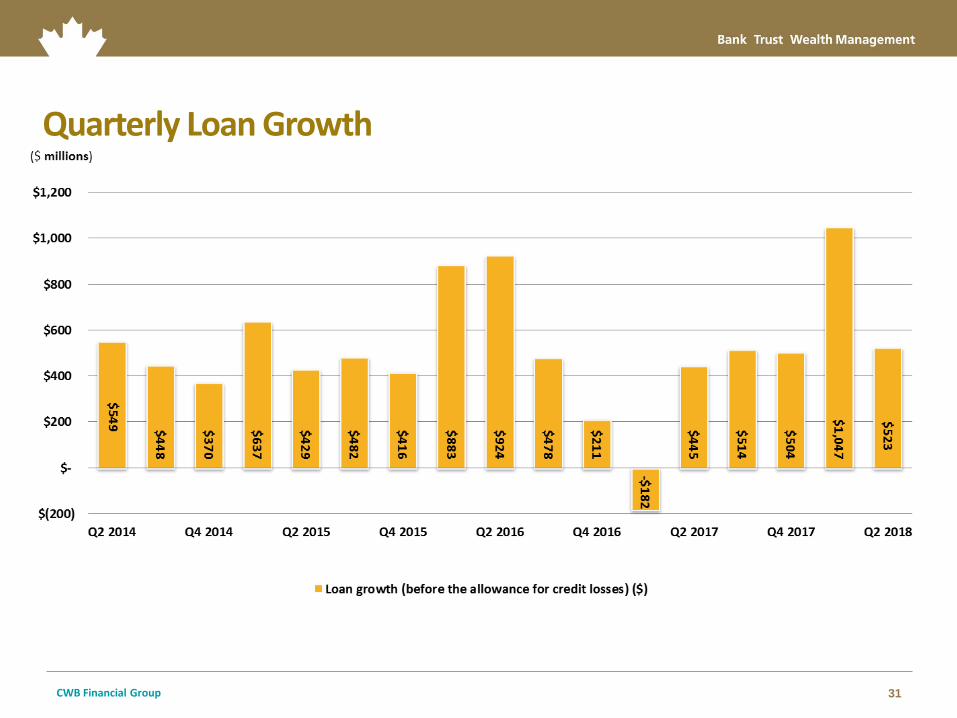
31 CWB Financial Group
Quarterly Loan Growth
32 CWB Financial Group
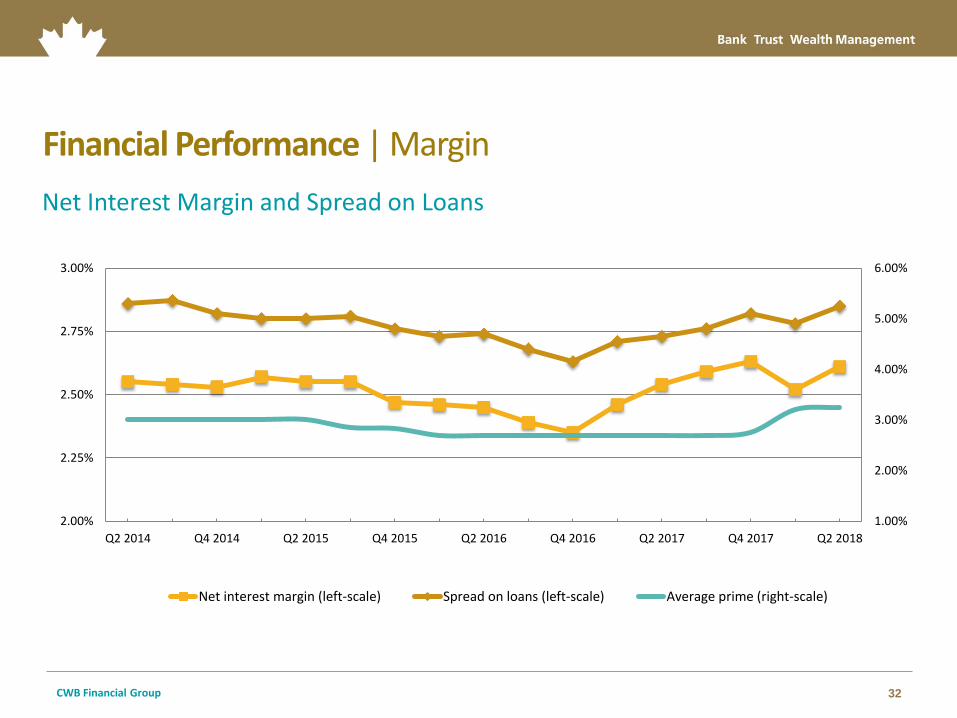
Financial Performance | Margin
1.00%
2.00%
3.00%
4.00%
5.00%
6.00%
2.00%
2.25%
2.50%
2.75%
3.00%
Q2 2014 Q4 2014 Q2 2015 Q4 2015 Q2 2016 Q4 2016 Q2 2017 Q4 2017 Q2 2018
Net Interest Margin and Spread on Loans
Net interest margin (left-scale) Spread on loans (left-scale) Average prime (right-scale)
33 CWB Financial Group
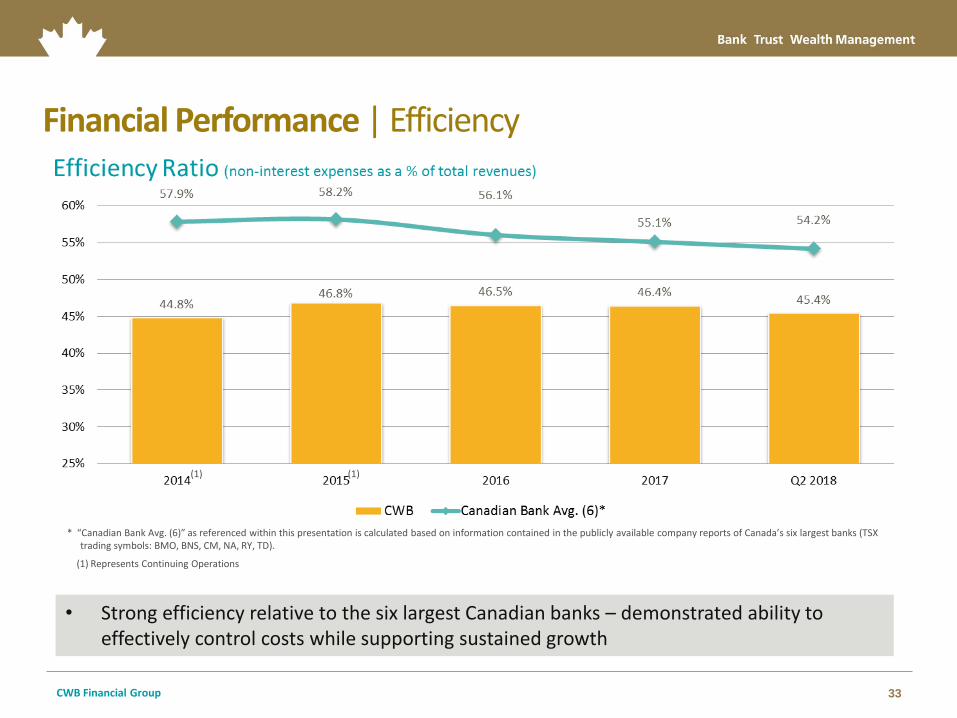
Financial Performance | Efficiency
* “Canadian Bank Avg. (6)” as referenced within this presentation is calculated based on information contained in the publicly available company reports of Canada’s six largest banks (TSX trading symbols: BMO, BNS, CM, NA, RY, TD).
(1) Represents Continuing Operations
• Strong efficiency relative to the six largest Canadian banks – demonstrated ability to effectively control costs while supporting sustained growth
(1) (1)
34 CWB Financial Group
(1) As of Q1 11, financial results are reported under IFRS, as opposed to GAAP, and are not directly compared.
35 CWB Financial Group
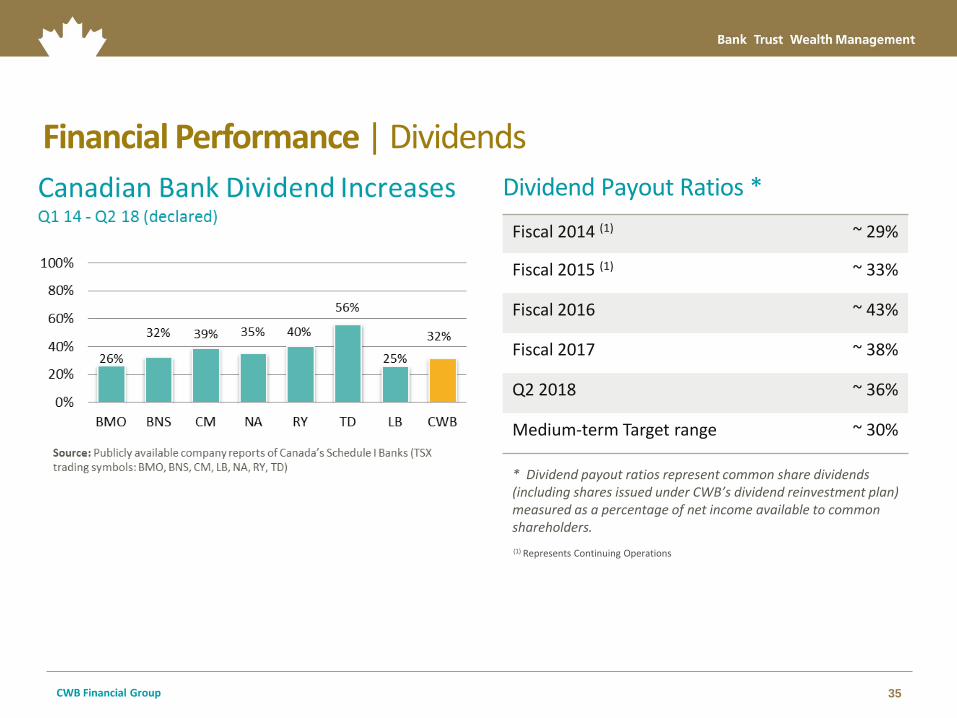
Financial Performance | Dividends
* Dividend payout ratios represent common share dividends (including shares issued under CWB’s dividend reinvestment plan) measured as a percentage of net income available to common shareholders.
Fiscal 2014 (1) ~ 29%
Fiscal 2015 (1) ~ 33%
Fiscal 2016 ~ 43%
Fiscal 2017 ~ 38%
Q2 2018 ~ 36%
Medium-term Target range ~ 30%
Dividend Payout Ratios *
(1) Represents Continuing Operations
36 CWB Financial Group
Appendix
37 CWB Financial Group
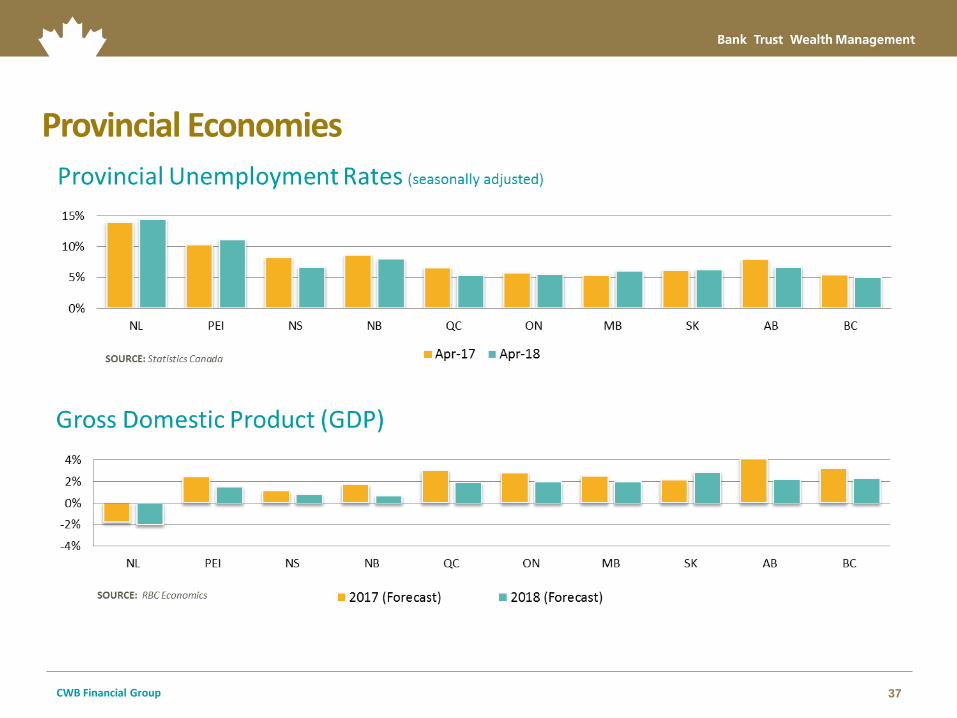
Provincial Economies
38 CWB Financial Group
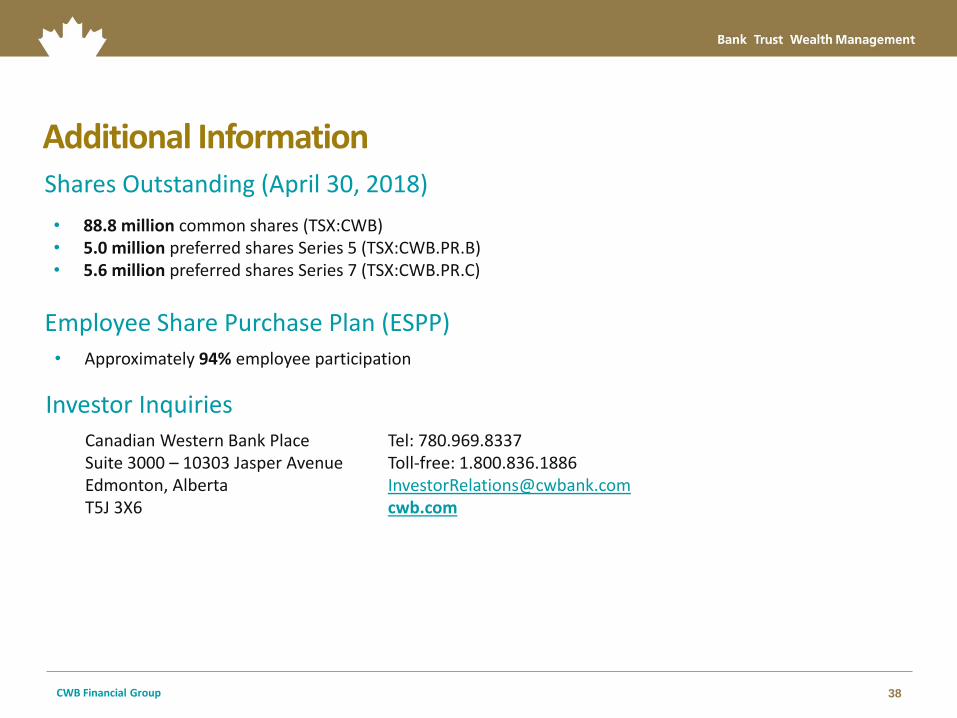
Additional Information Shares Outstanding (April 30, 2018)
Employee Share Purchase Plan (ESPP)
• 88.8 million common shares (TSX:CWB) • 5.0 million preferred shares Series 5 (TSX:CWB.PR.B) • 5.6 million preferred shares Series 7 (TSX:CWB.PR.C)
• Approximately 94% employee participation
Investor Inquiries
Canadian Western Bank Place Suite 3000 – 10303 Jasper Avenue Edmonton, Alberta T5J 3X6
Tel: 780.969.8337 Toll-free: 1.800.836.1886 [email protected] cwb.com