CORPORATE PRESENTATION - ressourcescartier.com · CORPORATE PRESENTATION May 7th, 2020 Philippe...
21
CORPORATE PRESENTATION May 7 th , 2020 Philippe Cloutier, President & CEO
Transcript of CORPORATE PRESENTATION - ressourcescartier.com · CORPORATE PRESENTATION May 7th, 2020 Philippe...

CORPORATE PRESENTATIONMay 7th, 2020
Philippe Cloutier, President & CEO
CAUTIONARY STATEMENT
FORWARD-LOOKING STATEMENTS
This document may contain forward-looking statements that reflect management’s current expectations withregards to future events. Such forward-looking statements are subject to certain factors and involve a number ofrisks and uncertainties. Actual results may differ from expected results. Factors that could cause our results, ouroperations or future events to change materially compared to expectations expressed or implied by the forward-looking statements include, but are not limited to, volatility in the price of gold, risks inherent to the miningindustry, uncertainty regarding mineral resource estimations, and additional funding requirements or theCompany’s ability to obtain such funding.
QUALIFIED PERSONS
The scientific and/or technical information presented in this presentation has been prepared and reviewed byMM. Gaétan Lavallière, P. Geo., Ph. D., Vice President for Cartier Resources and Ronan Déroff, P. Geo., M. Sc.,Senior Geologist, Project Manager and Geomatician, qualified persons as defined by National Instrument 43-101.Mr. Lavallière approved the information contained in this document.
2

AN ACCOMPLISHED TEAM
Management
Philippe Cloutier, P. Geo.President, CEO & Director
Jean-Yves Laliberté, CPA, CA, ICD.DChairman & Corporate Secretary
Michel Bouchard, P. Geo., M. Sc., MBAChair of Remuneration Committee
Gaétan Lavallière, P. Geo., Ph. D.Vice President
Nancy Lacoursière, B.A.A.Chief Financial Officer
Daniel Massé, B. Sc. A., A. Pl. Fin.Chair of Audit Committee
Ronan Déroff, P. Geo., M. Sc.Senior Geologist, Project Manager,
Geomatician
Mario Jacob, LL. B, ASCChair of Governance Committee
Board of Directors
3

CAPITAL STRUCTURE
COMMON SHARES - ISSUED AND OUTSTANDING 191,630,762
STOCK OPTIONS 13,050,000
WARRANTS 0
FULLY-DILUTED, MARCH 2020 204,680,762
SHARE DISTRIBUTIONSHARE STRUCTURE
4STRONG CASH POSITION 5.5 MILLION CAN $
SHAREHOLDER %
RETAIL• GROUP BMO• GROUP VAL-D’OR
54.1• 23.0• 10.0
AGNICO EAGLE 17.0
QUEBEC FUNDS 15.0
MERIAN GLOBAL 5.5
RUFFER 3.9
SSI 2.3
PRESIDENT & CEO 2.2
AVERAGE DAILY TRADING:> 185,000 SHARES / DAY*
*CALCULATED SINCE DECEMBER 2016

VALUE DRIVEN STRATEGY
➢ Focus in the Abitibi Greenstone Belt on “brownfield” projects
PRIORITISE PROJECTS PRODUCING LARGE VOLUME OF GOLD-BEARING MINERALISATION AT
CONSTANT GRADE
➢ Drilling focus on known Gold Zones
ADD VALUE TO THE ASSET THROUGH EXPLORATION
ADDITIONAL LONG TERM GROWTH OPPORTUNITIES
➢ Identify and evaluate best reward options
REWARD SHAREHOLDERS
➢ Benoist, Fenton and Wilson
5

Chimo Mine Property
Val-d’Or Mining Camp Mining Properties
CHIMO MINE PROPERTY LOCATION
6

CHIMO MINE PROJECT
Work in progress to increase resources:
➢ A total of 10,000 m of drilling on 5B4-5M4-5NE and 5CE Gold Zones
➢ 4 internal engineering studies and an industrial sorting study of the mineralisation
➢ Update of the property resources from the results of the 2 points mentioned above.
Work completed by Cartier:
➢ Total of 121 drill holes for 55,890 m and 20,792 gold samples collected
✓ Increase the resources
✓Discovery of 5B4-5M4-5NE and 5CE Gold Zones
➢Resource Estimate (gold price of US $ 1,300 per ounce and a cut-off grade of 2.5 g/t Au)
✓4,017,600 tonnes at an average grade of 4.53 g/t Au for a total of 585,190 ounces gold in the Indicated category;
✓4,877,900 tonnes at an average grade of 3.82 g/t Au for a total of 597,800 ounces gold in the Inferred category.
7
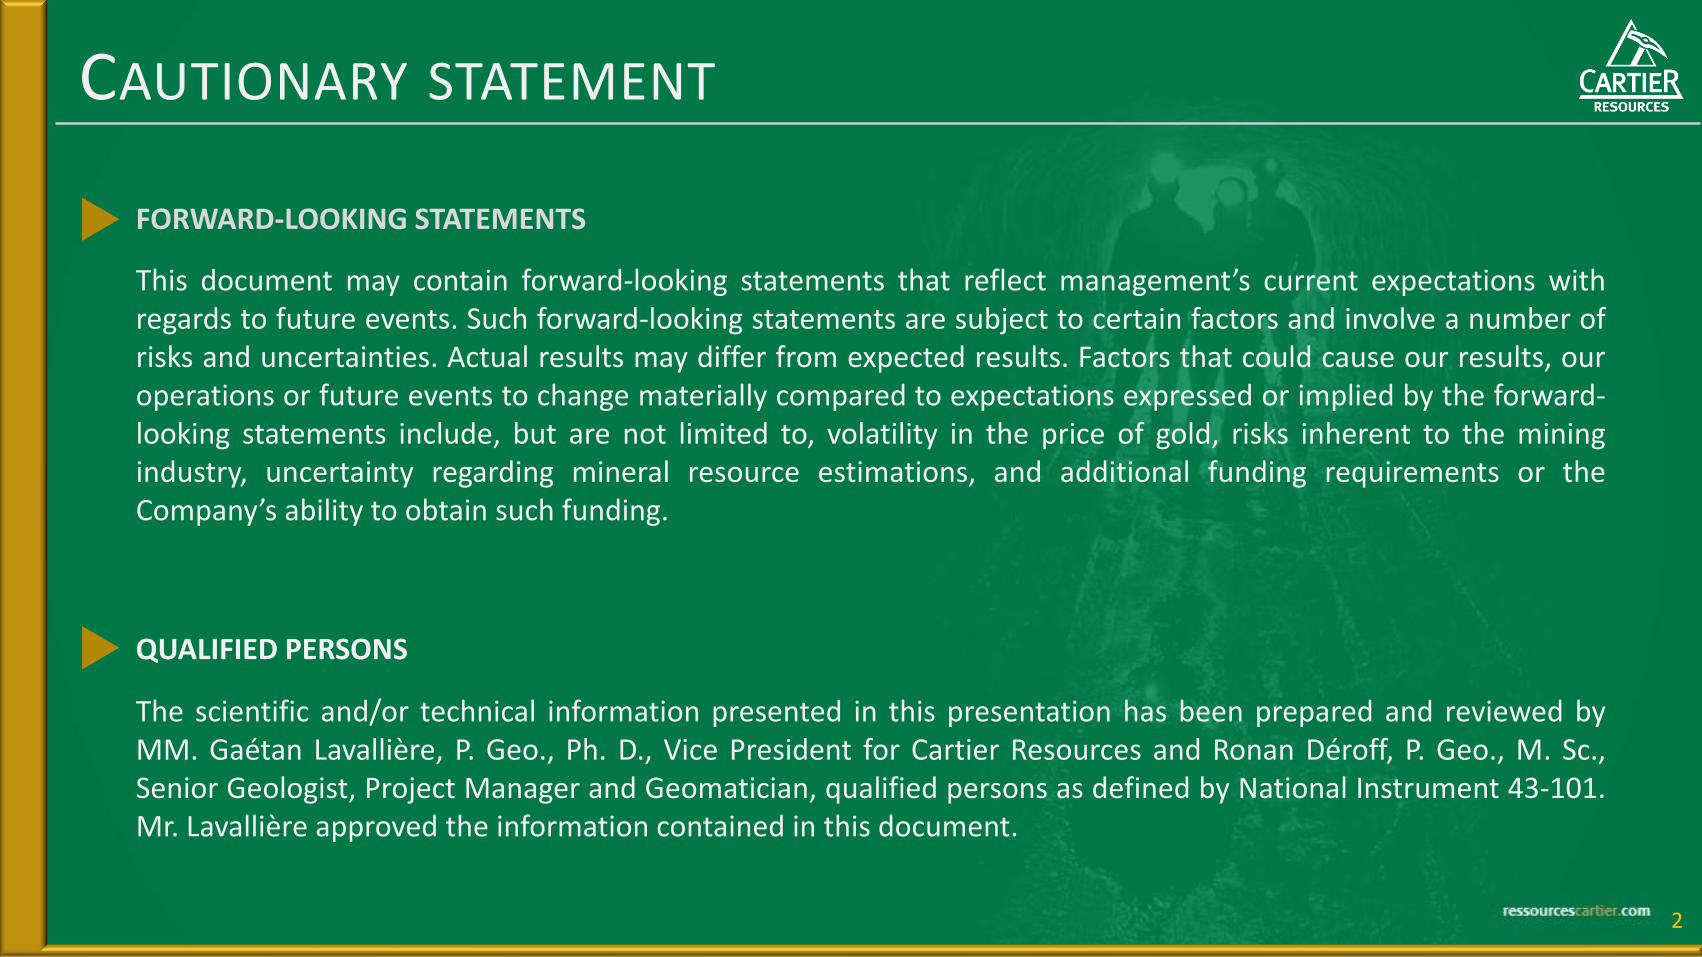
GROWING THE RESOURCE
0
0.2
0.4
0.6
0.8
1
1.2
1.4
1.6
1.8
Q4 2019 Q2 2020 Q4 2020
RES
OU
RC
E (M
OZ
AU
)
Indicated Resource Inferred Resource
461K 598K
TARGET> 800K ?
417K
585K
TARGET> 900K ?
TARGET
Using a gold price of US $ 1,300 per ounce and a cut-off grade of 2.5 g/t Au 8
Total ECRinvestment:
11.5 CAN $ / oz Au

GROWING THE RESOURCE
HISTORICAL PRODUCTION
1964-1997
400 Koz Au(MERN DV 85-05 to DV 97-01)
NI 43-101RESOURCE
Q4 2019November 5th, 2019
461 Koz Au417 Koz Au
NI 43-101RESOURCE
Q2 2020May 5th, 2020
585 Koz Au598 Koz Au
TARGET
Q4 2020> 800 Koz Au> 900 Koz Au
Using a gold price of US $ 1,300 per ounce and a cut-off grade of 2.5 g/t Au
9
Total ECRinvestment:
11.5 CAN $ / oz Au
Indicated ResourcesInferred Resources
+ +++
x2
x3
x4
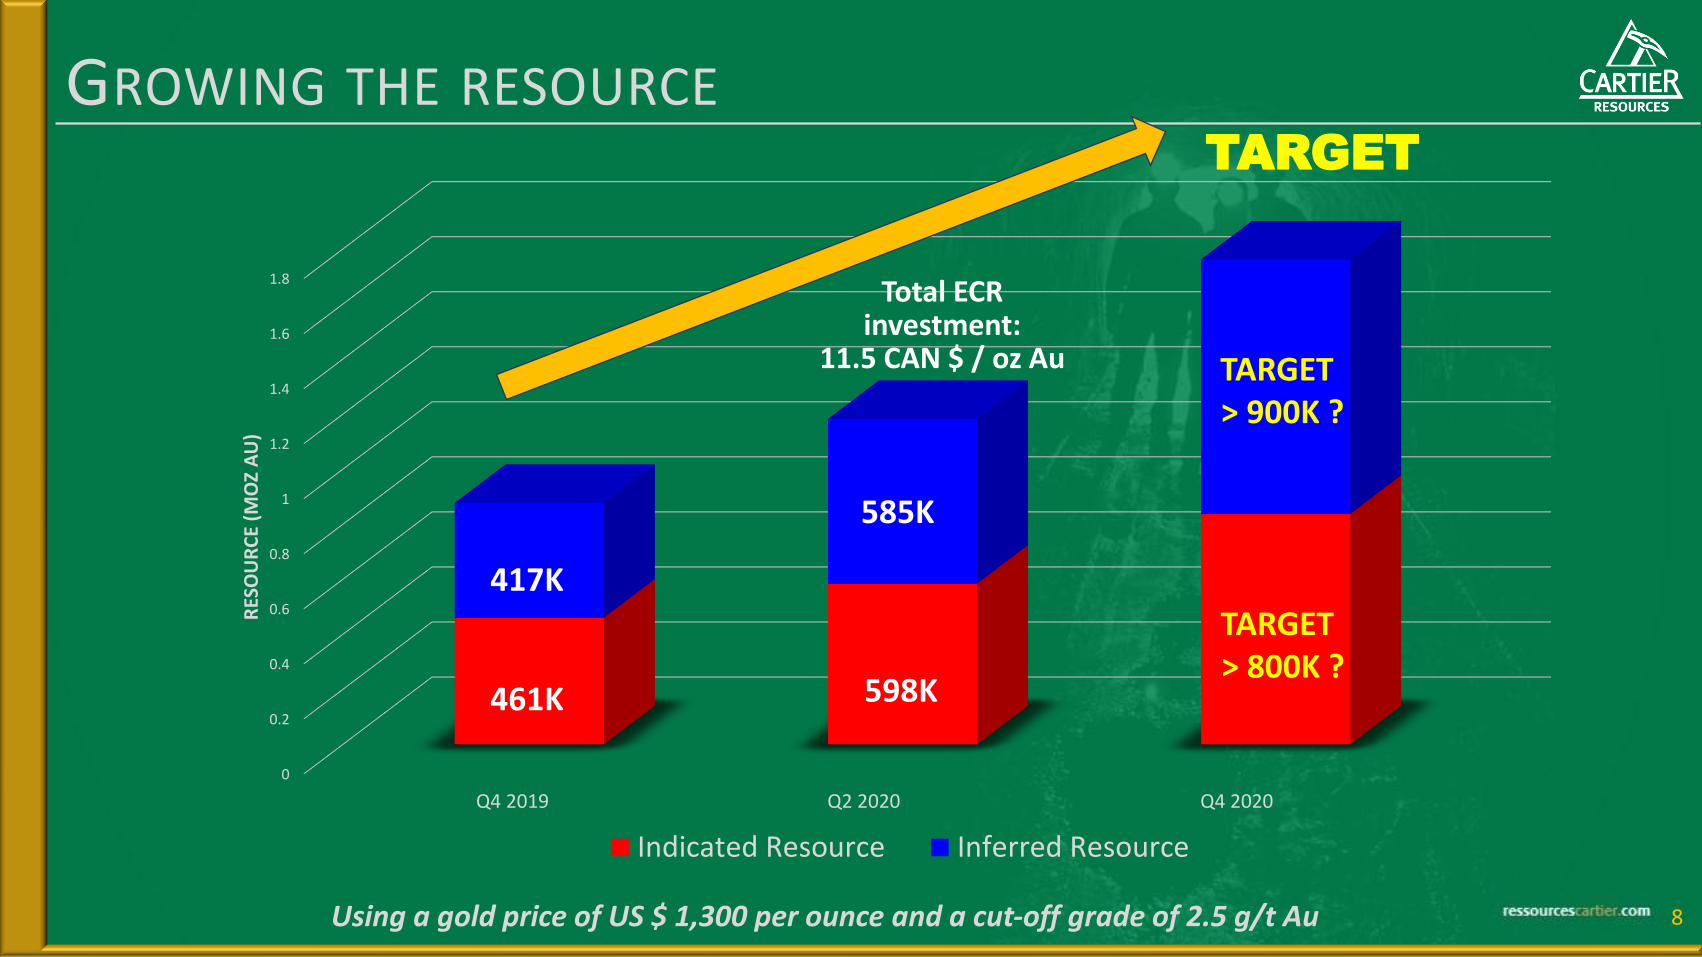
ECR EV/OZ AU VS PEERS
10
0
20
40
60
80
100
120
140
160
180
200
OSK QMX RDS BAR BTR PRB ECR O3 MQR FPC MGM
EV/O
Z (C
AN
$ /
OZ)
180
83
111
62
2541
EV/OZ ECR = 25 CAN $/OZ VS PEERS AVERAGE = 55 CAN $/OZ
47
1815 10 8
Based on May 1st, 2020 public information
EV: Enterprise Value
Range of ounce selling price: 100 to 150 CAN $/OZ

INTRINSIC VALUE UNDERESTIMATED
*100 CAN $ x 1.2 Moz Au
CASH POSITION
Well-Funded5.5 M CAN $
RESOURCESMay 5th, 2020
Chimo Mine585 Koz Au598 Koz Au
IN-SITU VALUATION
Market Cap 5.5 + 120* = 126 M CAN $
Stock Price0.66 CAN $ / Share
01/05/2020: ECR = 0.16 CAN $ / Share
11
Inferred Resources
Indicated Resources

CHIMO MINE VALUATION TIMELINE
12
Q3 2014
Q2 2019Q4 2019
Q4 2019
Q2 2020Q2 2020
NI 43-101 Resource
Central Gold CorridorCut-Off Grade: 2.5 g/t Au
461,280 oz Au417,250 oz Au
NI 43-101 Resource
North and South Gold CorridorsCut-Off Grade = 2.5 g/t Au
123 910 oz Au indicated180 550 oz Au inferred
Total585 190 oz Au indicated597 800 oz Au inferred
Drilling
7 500 m
?
Q4 2020Q3 2014
Q2 2019Q4 2019
Q4 2019
Q2 2020Q2 2020
NI 43-101 Resource
North and South Gold CorridorsCut-Off Grade: 2.5 g/t Au
123,910 oz Au180,550 oz Au
Total585,190 oz Au597,800 oz Au
AcquisitionCompilation
InterpretationDrilling
3 Gold Corridors49,000 m
Drilling East Sector
10,000 m
COMPLETED
IN PROGRESS
Q4 2020
TARGET
Central Gold CorridorCut-Off Grade: 1.5 g/t Au ?
> 600,000 oz Au ?> 700,000 oz Au ?
Total Target> 800,000 oz Au ?> 900,000 oz Au ?
INTERNAL ENGINEERING & INDUSTRIAL SORTING OF
MINERALIZATION
Inferred ResourcesIndicated Resources

CHIMO MINE: 3 CORRIDORS, 17 STRUCTURES, 27 GOLD ZONES
13

RESOURCE ESTIMATE: MAY 5TH 2020
14
Gold CorridorsCut-off Grade
2.5 g/t AuPrice $US 1300 / Oz
Indicated Resources Inferred Resources
MetricTonne (t)
Grade (g/t Au)
Troy Ounce (oz)
MetricTonne (t)
Grade (g/t Au)
Troy Ounce(oz)
Central (1) 3,263,300 4.40 461,280 3,681,600 3.53 417,250
North (2) 505,300 5.35 86,850 715,700 4.59 105,710
South (2) 249,000 4.63 37,060 480,600 4.84 74,840
Total 4,017,600 4.53 585,190 4,877,900 3.82 597,800
Note 1 : NI 43-101 Technical Report and Mineral Resource Estimate, Chimo Mine Project, Central Gold Corridor, Val-d’Or, Qc, Canada, Christian D’Amours, GéoPointCom Inc., Dec. 18th 2019Note 2 : Cartier increases gold resources of the Chimo Mine Property , Claude Savard, InnovExplo Inc., May 5th 2020.
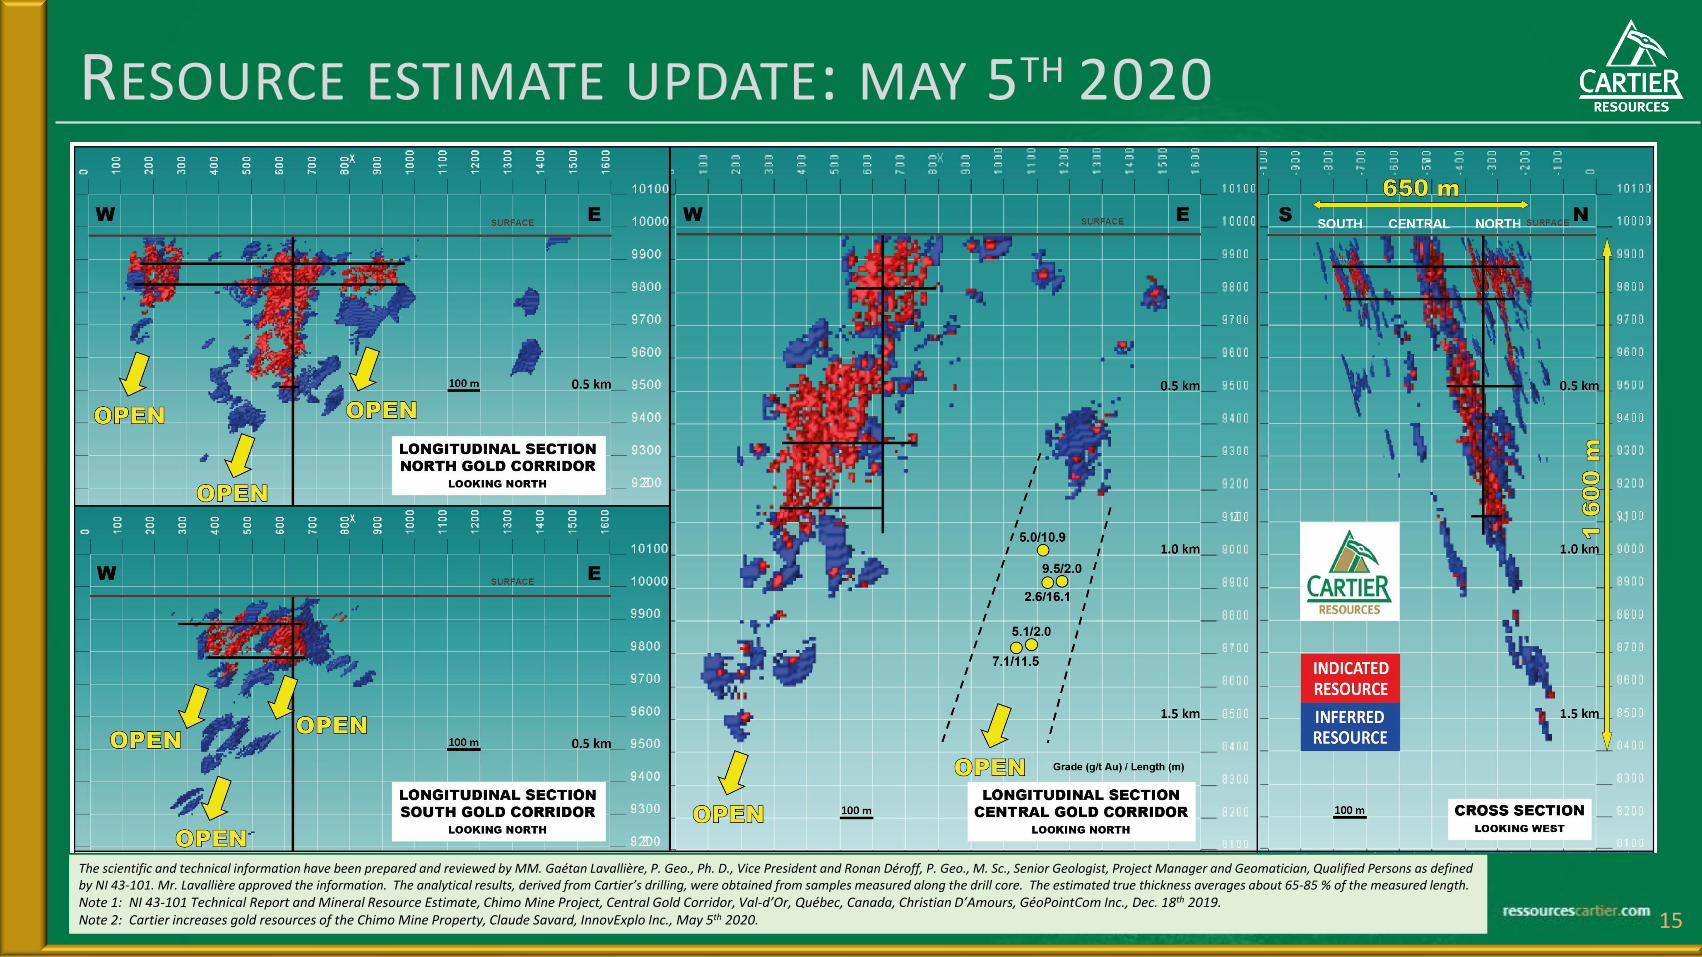
RESOURCE ESTIMATE UPDATE: MAY 5TH 2020
15
The scientific and technical information have been prepared and reviewed by MM. Gaétan Lavallière, P. Geo., Ph. D., Vice President and Ronan Déroff, P. Geo., M. Sc., Senior Geologist, Project Manager and Geomatician, Qualified Persons as definedby NI 43-101. Mr. Lavallière approved the information. The analytical results, derived from Cartier’s drilling, were obtained from samples measured along the drill core. The estimated true thickness averages about 65-85 % of the measured length.Note 1: NI 43-101 Technical Report and Mineral Resource Estimate, Chimo Mine Project, Central Gold Corridor, Val-d’Or, Québec, Canada, Christian D’Amours, GéoPointCom Inc., Dec. 18th 2019.Note 2: Cartier increases gold resources of the Chimo Mine Property, Claude Savard, InnovExplo Inc., May 5th 2020.

MINERALISATION AT CHIMO MINE
2 types of mineralisation:
Large volume of gold bearingsulphides (Asp non refractory)
Arsenopyrite concentrate represented3% of ore and 75% gold produced
Late Quartz Veins (cm to 10 m) withVG
Gravimetric concentrate represented1% of ore and 25% gold produced
• Information from historical mining records of the Chimo mine
16
OBJECTIVE OF INTERNAL ENGINEERING STUDIES:REDUCE THE CUT OFF-GRADE TO RECOVER MORE GOLD OUNCES

INTERNAL ENGINEERING STUDY:
Project 1C
Design mining schedule to feed maximum hoistingrate at surface
Production Capacity
Project 1B
Determine MAXIMUM hoisting capacity fromshaft with existingunderground infrastructure
Hoisting Capacity
Project 1A
Determine stopeconfiguration thatwould allow OPTIMAL recuperation of Resource
Mining Capacity
PROJECT 1: Maximum capacity to feed surface sorting plant
17
REDUCE PRODUCTION COSTS (OPEX)TO RECOVER MORE GOLD OUNCES
PROJECTCOMPLETED
WITH POSITIVECONCLUSION
Up to 5,000 t / day

18
HOISTING
PROJECT 2: Maximum capacity of industrial mineralisation sorting
Initial
grade
Initialgrade x 2
DRILLING MINING
REDUCE PRODUCTION COSTS (OPEX)TO RECOVER MORE GOLD OUNCES
SORTING
TRANSPORT
Initial
tonnage
Initial
tonnage
/ 2
Strong cost reductionfor transport, milling
and restauration
INTERNAL ENGINEERING STUDY:
19
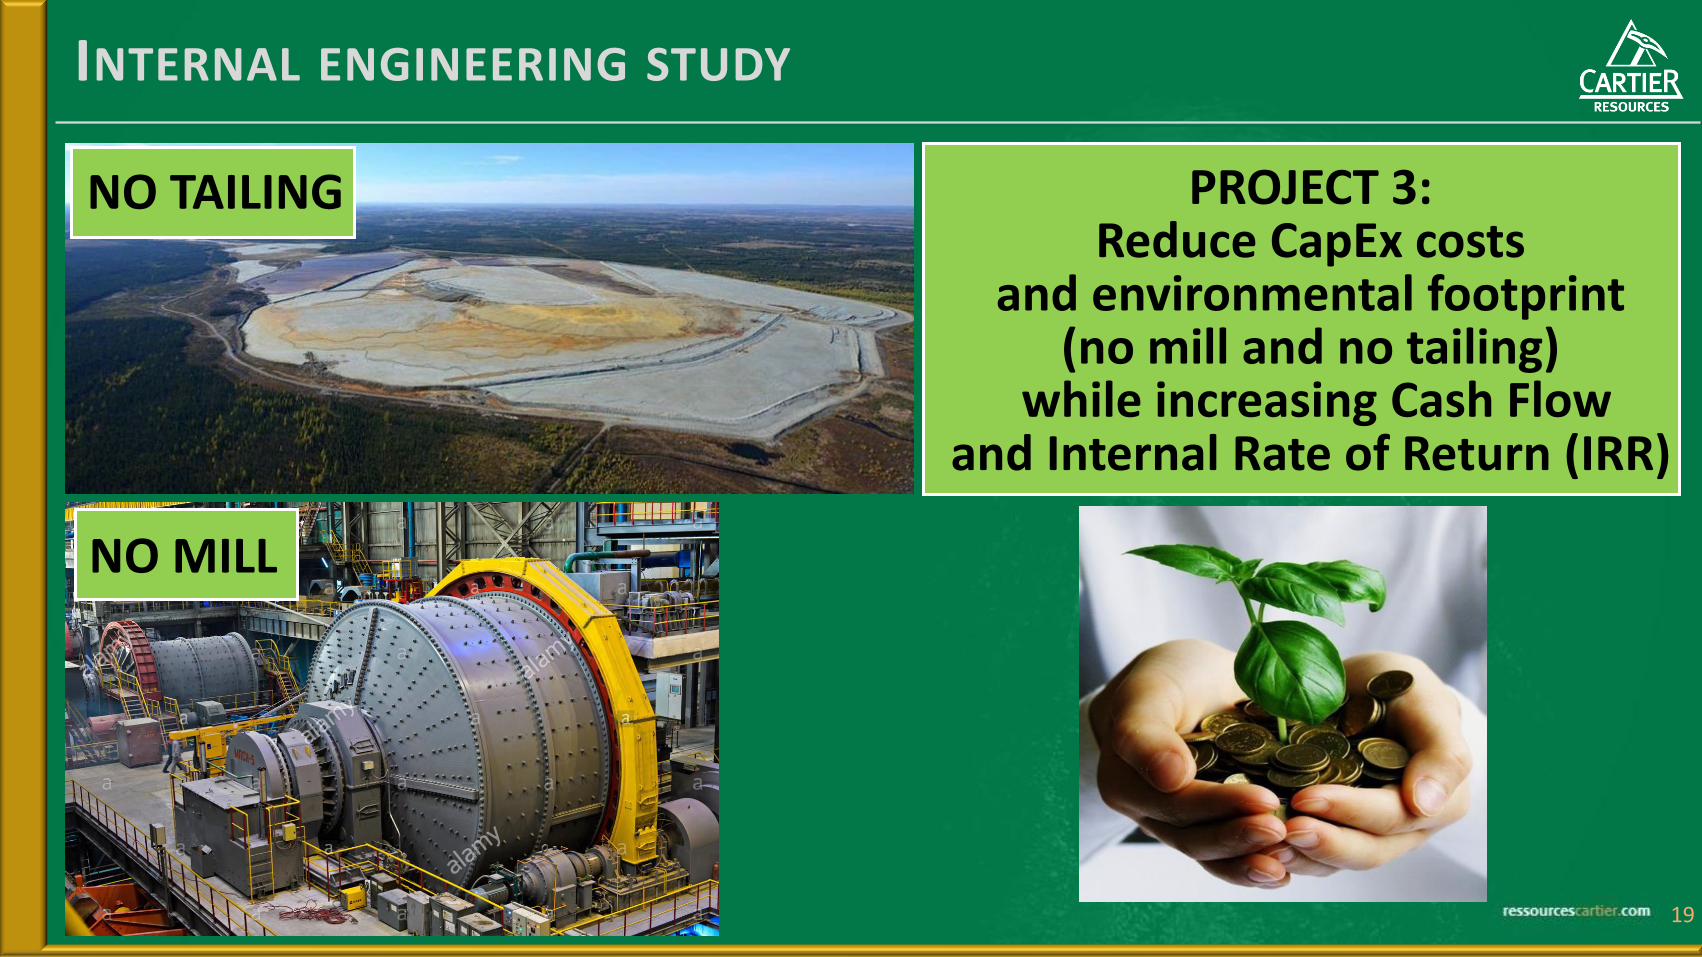
INTERNAL ENGINEERING STUDY
PROJECT 3:Reduce CapEx costs
and environmental footprint(no mill and no tailing)
while increasing Cash Flowand Internal Rate of Return (IRR)
NO MILL
NO TAILING

REPEAT PROCESS
Three more projects with similar characteristics: ➢ 100% owned by Cartier (exception Fenton: 50% Cartier JV with SOQUEM INC.);
➢ Gold deposit with well defined geometry / rapid growth potential;
➢ Characteristics present to produce large tonnage at constant grade;
➢ Situated near infrastructure and qualified workforce;
➢ Benoist Project Internal mineralisation study in progress.
BENOIST WILSONFENTON
20

THANK YOU !FOR MORE INFORMATION:PHILIPPE [email protected]
TOLL FREE: 1-877-874-1331DIRECT: 819-874-1331
Chimo Mine Visible Gold Sample from Zone 5B, Level 17, 108.4 g/t Au over 2.0 mCourtesy of Mr. Tony Brisson, Mine Geologist, 1995
21