Corporate Performance Management
30
T H E B U S I N E S S P E R F O R M A N C E S O F T W A R E C O M P A N Corporate Performance Management Chris Evers Director, Strategic Initiatives May, 2003
-
Upload
carlos-cervantes -
Category
Documents
-
view
51 -
download
0
description
Corporate Performance Management. Chris Evers Director, Strategic Initiatives May, 2003. "Each problem that I solved became a rule which served afterwards to solve other problems.“ ---- Descartes. Agenda. Performance Management. Delivery Challenges. Next Steps. Brio Metrics Builder TM. - PowerPoint PPT Presentation
Transcript of Corporate Performance Management

T H E B U S I N E S S P E R F O R M A N C E S O F T W A R E C O M P A N Y™
Corporate Performance Management
Chris Evers
Director, Strategic Initiatives
May, 2003

2
"Each problem that I solved became a rule which served afterwards to solve other problems.“
---- Descartes

3
Agenda
Delivery Challenges
Next Steps
Performance Management
Brio Metrics BuilderTM

4
Performance Management Themes
• How can our business processes best be aligned to achieve our strategy?
• How can we get employees to focus on achieving the strategy?
• How can we drive accountability?
• How can we optimize visibility to information to improve our ability to manage business performance?
• How do we know we are making desired progress to strategic goals?
5
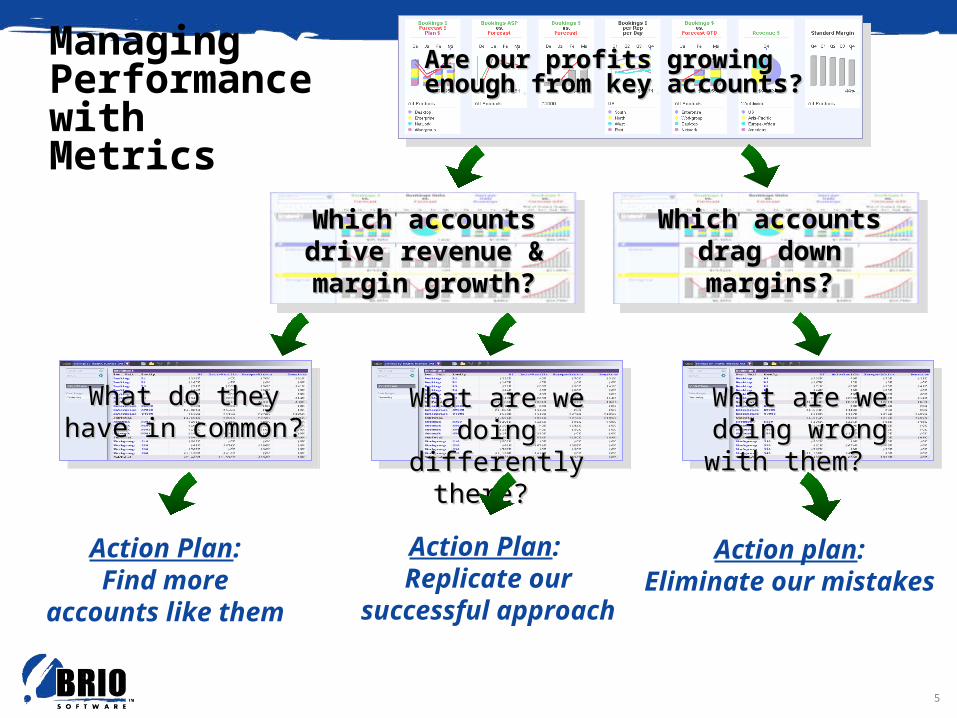
Are our profits growing enough Are our profits growing enough from key accounts?from key accounts?
Which accounts drag Which accounts drag down margins?down margins?
Which accounts Which accounts drive revenue & drive revenue & margin growth?margin growth?
Managing Performance with Metrics
What do they have What do they have in common? in common?
What are we doing What are we doing differently there? differently there?
Action Plan: Replicate our
successful approach
Action Plan:Find more
accounts like them
What are we doing What are we doing wrong with them? wrong with them?
Action plan: Eliminate our mistakes

6
Performance Management Makes a Difference
Measurement-managed companies outperform the competition
Source: American Management Association

8
Performance Management Applications
• Regulatory Requirements– Sarbanes-Oxley; Basel II Accord; HIPAA
• Operational Management– Six Sigma; ISO 9002; Human Resource Mgmt
• Competitive Position– Sales; Marketing; Customer Satisfaction

9
Effect of Sarbanes-Oxley Act
• CEOs and CFOs of publicly traded companies must certify financial statements, and those who knowingly certify falsely are liable for criminal and civil penalties.
• Auditability requires companies to develop and publish internal processes such that outsiders can attest to the existence of appropriate controls.
• Under the act’s disclosure mandates, companies must report financial results and material changes in corporate financial condition or operations “on a rapid and current basis.”

10
The Sarbanes-Oxley Act of 2002
• Sarbanes-Oxley requirements may be divided into three categories: certification, auditability, and disclosure.
• Accuracy and visibility are the two touchstones of Sarbanes-Oxley. Accuracy refers to the quality of the financial information a company reports to the public. Visibility means that the internal information processes that make accuracy possible must be transparent.

11
Barriers to Sarbanes-Oxley Compliance
“…while 81% of CFOs regard accurate earnings and revenue forecasting as a corporate priority, 63% are saddled with inadequate, non- or partially-integrated budgeting, forecasting, and decision support systems.”
- CFO Research Services, Inc.

12
Barriers to Sarbanes-Oxley Compliance
• When CFO Research Services, Inc. surveyed 277 senior finance executives about hinderences to financial accuracy and visibility, 56% cited technology.

13
Sarbanes-Oxley Compliance Fact
90% of the S&P 500 companies in the U.S. do not meet the shorter 10-Q filing deadline of 35 days.
- Parsons Consulting

14
More Performance Management Apps
• Strategic/ Finance– Revenue, Margin, Growth
performance– Lifetime customer value
• Products and Services– BBB (Bookings, Billings,
Backlog)– Product configurations and
bundles– Order fulfillment– Clinical Trials– Service calls
• Sales– Direct sales– Web Sales– Sales pipeline– Channel sales
• Marketing– Campaign analysis– Product forecasting
• Customer– Call Center– Customer behavior– Lifetime customer value
• Logistics– Routes– Distribution channels– Waiting queues
• Human Resource– Manpower allocation and
utilization

15
Metric Examples
Key Functionalities:
• Across all relevant facts
• Time Series
• Drillable
• Sliceable
• Unsupported dimensions handled gracefully
• Granularity differences handled gracefully
• Metrics on metrics
Key Functionalities:
• Across all relevant facts
• Time Series
• Drillable
• Sliceable
• Unsupported dimensions handled gracefully
• Granularity differences handled gracefully
• Metrics on metrics
• Traditional Metrics – Booking $, Billing $, Units– Avg. order size, Avg. sell price– % of shopping carts abandoned– Headcount, Business Days
• Temporal Metrics– % of GM growth– Booking $ YTD, GM QTD– Period over Period quality target
• Advanced Metrics– 3 mo. rolling average revenues– Cumulative revenue as a % of
forecast compared to average of the same week of the last 4 qtrs.

16
Agenda
Delivery Challenges
Next Steps
Performance Management

17
Typical Business Intelligence Pain
• The BI Tool promise:“Informed decision-making”
• Some Success, Some Failure
• Typical Failure Reasons:½ Technical/project failure¼ Failure to deliver business value¼ Spreadsheet Hell

18
“BI is Failing Firms”
• January 31, 2002: Frank Buytendijk, Gardening Group
• "… even now the best vendors have only 80 to 90 percent of the functionality in the Web-enabled software that they had in the desktop-based versions."
• Most damagingly, these Web versions actually took control away from users. Before 1998, business intelligence was largely user-driven. "Departmental heads could buy a nice little OLAP tool, ask the IT department to provide the links to the corporate data, and with a few days of training were able to generate their own reports," said Buytendijk. "Now everything is on the Web, so all of a sudden you have this notion of centralizing everything, which is good for IT departments, but the users have been left with nothing."
19
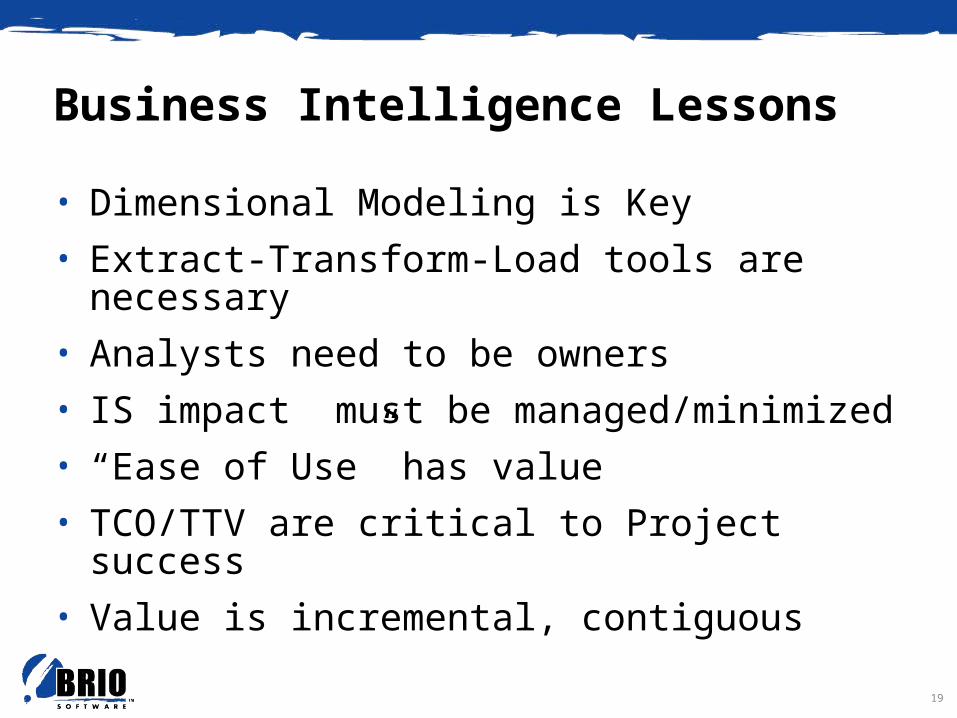
Business Intelligence Lessons
• Dimensional Modeling is Key
• Extract-Transform-Load tools are necessary
• Analysts need to be owners
• IS impact must be managed/minimized
• “Ease of Use” has value
• TCO/TTV are critical to Project success
• Value is incremental, contiguous

20
Business Intelligence Challenges
• Business Value Focus
• Root Cause Analysis
• Process Improvement
• Technology Vertigo
• Metric Management
• IS impact
• Excel or ”Not Developed Here” syndrome

21
Who is in need?
• Executive Level– Enable executives, managers and analysts to
interactively collaborate to accelerate business insight and enhance competitive advantage, thereby improving business performance
• Product Level– Integrate existing enterprise data with decision
processes to create business metrics that are delivered through personalized dashboards for all levels of the enterprise.
– Create, configure, and deliver business metrics that enable interactive, real-time strategic decision-making for improved business performance.

22
What do they need?
• Metrics-based performance management system
• Made for business decision makers– Execs, LOB Mgrs, Project Mgrs, Product Mgrs, Analysts
• Daily insight to KPI’s and metrics crucial to the business– Business process driven– Pre-established
• Environment of dynamic, cascaded metrics– Common analytic library of reusable metrics– Embedded analysis methods
• Personalization beyond metrics delivery

23
Agenda
Delivery Challenges
Next Steps
Performance Management

24
When Is Your Business Ready for Metrics- based Performance Management?
Increasing Information Maturity
Managing with Metrics• Top down initiatives• Process driven metrics & goals• Trending & root causes• Managers answer own questions
Measuring • Basic metrics & goals• Fact based, snap shots• Analyst-based access & reporting
Initial • Anecdotes• Individual heroics

25
Leveraging the Data
A typical data repository is defined by subject areas, dimensions, and facts (or details)
Product
Customer Sales
Support
Marketing
Strategic
Diagnostic
RootCause
Organization

26
Leveraging the Data
A report encompasses dimensions, subjects, and detail for a focused business audience with a specific information purpose
Need:Corporate reporting baseline
Audience:Creation: IT analyst
Use: Individual and departmental business info consumers
Product:Reporting Tools
Portals
Product
Customer Sales
Support
Marketing
Strategic
Diagnostic
RootCause
Organization

27
Leveraging the Data
Need:Data exploration and analysis
Audience:Creation and use: Business analyst
Product:BI Tools
A query enables the business analyst to analyze data, explore new questions, and deliver analysis results to business information consumers
Product
Customer Sales
Support
Marketing
Strategic
Diagnostic
RootCause
Organization

28
Leveraging the Data
A broad library of reports can be distributed to thousands of users over the web
Product
Customer Sales
Support
Marketing
Strategic
Diagnostic
RootCause
Organization
Need:Information distribution
Audience:Creation: Business analyst
Use:All employees, customers, suppliers
Product:Reporting Tools
BI Tools
Portals

29
Centralized metrics management can span all dimensions and detail needed for a specific subject or groups of subjects
Need:Centralized business metrics and methods for analysis
Audience:Creation: IT and business analysts
Use: Executives, business line managers, departmental business info consumers
Product:Metric Mgmt Tools
RootCause
Leveraging the Data
Product
Customer Sales
Support
Marketing
Strategic
Diagnostic
Organization

30
Complete Picture of Leveraging the Data
The flexibility in accessing the entire data repository based on varying user needs is accomplished through the complementary capabilities of the entire Brio Performance Suite
Product
Customer Sales
Support
Marketing
Strategic
Diagnostic
RootCause
Organization

T H E B U S I N E S S P E R F O R M A N C E S O F T W A R E C O M P A N Y™
Corporate Performance Management
Chris Evers
952-476-2729