Corporate Governance, Financial Characteristics...
15
International Journal of Business and Social Science Vol. 10 • No. 3 • March 2019 doi:10.30845/ijbss.v10n3p2 12 Corporate Governance, Financial Characteristics, Macroeconomic Factors and Performance of Commercial and Service Firms Listed at the Nairobi Securities Exchange Moses Odhiambo Aluoch Prof. Erasmus S. Kaijage Dr. Cyrus M. Iraya Department of Finance and Accounting School of Business University of Nairobi, Kenya Prof. Martin Ogutu Department of Business Administration School of Business University of Nairobi, Kenya Abstract The study examined relationships among corporate governance, financial characteristics, macroeconomic factors and performance of Commercial and Service firms listed at the Nairobi Securities Exchange. The specific objectives were to establish the effect of corporate governance on performance of Commercial and Service firms listed at the Nairobi Securities Exchange and to determine the intervening effect of financial characteristics on corporate governance and performance of Commercial & Service firms and to establish the moderating effect of corporate governance and performance of firms. This study was anchored on wealth maximization theory, agency theory and positivism philosophy. The study used census approach and a target population of 10 Commercial & Service firms listed at the Nairobi Securities Exchange between 2002 and 2016 were incorporated. The study used panel data and employed longitudinal descriptive research design to determine relationships amongst study variables. A panel data regression analysis was conducted using random effects model which allowed the companies to have a common mean value of the intercept to determine whether corporate governance influences performance of Commercial & Service firms. The research findings revealed that Liquidity and Interest rate significantly affect Return on Assets while Corporate Governance, Investments, Leverage, Growth Domestic Product Growth rate and Inflation rate had an insignificant effect on Return on Assets of listed commercial service firms. The results further revealed that only firm‘s Investments were significantly related to Tobin’s Q of listed commercial & service firms in Kenya. Corporate Governance, Leverage, Liquidity, Growth Domestic Product Growth rate, Interest rate and Inflation rate were found to have insignificant effects on Tobin’s Q of listed commercial & service firms. The study also concluded that commercial and service listed firms in Kenya continued to record poor performance despite corporate governance practices. The shareholders of commercial and service listed firms may adopt the findings of this study to restructure their corporate governance policies and practices to improve performance of their firms. Keywords: Firm performance, Macroeconomic Factors, Corporate Governance, Financial Characteristics, Commercial & Services 1.0 Introduction Background Information Performance of commercial and service firms listed at Nairobi Securities Exchange has varied since the introduction of corporate governance policies and practices by Capital Markets Authority of Kenya in the year 2002. Corporate governance policies and practices used in this study include board structure and board activities. The board structure include: board composition which comprises both executive and non-executive directors, gender and ethnicity (Carter, Simkins, & Simpson, 2003); board skills and experience, are occupational expertise of board members (Kesner,1998); board age, is the average age of board members (Rose, 2007); and board size, is the number of directors instituting the board (Jensen, 1993; Khanchel, 2007). The board activities are responsibilities performed by the board and committees set up by board for specific duties.
Transcript of Corporate Governance, Financial Characteristics...
International Journal of Business and Social Science Vol. 10 • No. 3 • March 2019 doi:10.30845/ijbss.v10n3p2
12
Corporate Governance, Financial Characteristics, Macroeconomic Factors and
Performance of Commercial and Service Firms Listed at the Nairobi Securities Exchange
Moses Odhiambo Aluoch
Prof. Erasmus S. Kaijage
Dr. Cyrus M. Iraya
Department of Finance and Accounting
School of Business
University of Nairobi, Kenya
Prof. Martin Ogutu
Department of Business Administration
School of Business
University of Nairobi, Kenya
Abstract
The study examined relationships among corporate governance, financial characteristics, macroeconomic factors and
performance of Commercial and Service firms listed at the Nairobi Securities Exchange. The specific objectives were to establish the effect of corporate governance on performance of Commercial and Service firms listed at the Nairobi
Securities Exchange and to determine the intervening effect of financial characteristics on corporate governance and
performance of Commercial & Service firms and to establish the moderating effect of corporate governance and performance of firms. This study was anchored on wealth maximization theory, agency theory and positivism
philosophy. The study used census approach and a target population of 10 Commercial & Service firms listed at the Nairobi Securities Exchange between 2002 and 2016 were incorporated. The study used panel data and employed
longitudinal descriptive research design to determine relationships amongst study variables. A panel data regression
analysis was conducted using random effects model which allowed the companies to have a common mean value of the intercept to determine whether corporate governance influences performance of Commercial & Service firms. The
research findings revealed that Liquidity and Interest rate significantly affect Return on Assets while Corporate
Governance, Investments, Leverage, Growth Domestic Product Growth rate and Inflation rate had an insignificant effect on Return on Assets of listed commercial service firms. The results further revealed that only firm‘s Investments
were significantly related to Tobin’s Q of listed commercial & service firms in Kenya. Corporate Governance, Leverage, Liquidity, Growth Domestic Product Growth rate, Interest rate and Inflation rate were found to have
insignificant effects on Tobin’s Q of listed commercial & service firms. The study also concluded that commercial and
service listed firms in Kenya continued to record poor performance despite corporate governance practices. The shareholders of commercial and service listed firms may adopt the findings of this study to restructure their corporate
governance policies and practices to improve performance of their firms.
Keywords: Firm performance, Macroeconomic Factors, Corporate Governance, Financial Characteristics,
Commercial & Services
1.0 Introduction
Background Information
Performance of commercial and service firms listed at Nairobi Securities Exchange has varied since the introduction of
corporate governance policies and practices by Capital Markets Authority of Kenya in the year 2002. Corporate
governance policies and practices used in this study include board structure and board activities. The board structure
include: board composition which comprises both executive and non-executive directors, gender and ethnicity (Carter,
Simkins, & Simpson, 2003); board skills and experience, are occupational expertise of board members (Kesner,1998);
board age, is the average age of board members (Rose, 2007); and board size, is the number of directors instituting the
board (Jensen, 1993; Khanchel, 2007). The board activities are responsibilities performed by the board and committees
set up by board for specific duties.
ISSN 2219-1933 (Print), 2219-6021 (Online) ©Center for Promoting Ideas, USA www.ijbssnet.com
13
The board activities include board tenure which is the duration the directors take in a firm (Mathew, Paul, Kamel &
Cherif, 2010); board ownership which is the holdings in a firm’s stock by board members (Brickley, Lease & Smith,
1988); board tools which are necessary tools and aids in place to enable discharging of responsibilities of the board
(CMA, 2015); board meetings including statutory and non-statutory meetings (Lipton & Lorch, 1992) and board
committees for deliberations of board activities (Klein, 2002). Board compensation is the remuneration to board
members (Murphy, 1984).
The financial characteristics used in this study were: investment, leverage and liquidity because of their direct influence
to firm performance. Investment refers to the sacrifice of current cash flows for future cash flows. It involves time, risk
and returns since the sacrifice takes place in the present, and is certain, while returns come later, and are uncertain
(Sharp et al., 2005). Investment in tangible and intangible assets such as property, plant, equipment and securities
ensures a good firm’s performance in profitability and value (Mudida & Ngene, 2010). Investment measures the
increase in capital spending such as buying new machines, building bigger factories. Investment in long term assets
makes firms to remain competitive and to survive given constant flow of ideas for new products, making existing
products better and reducing the operating cost (Hillie, Jaffe, Jordan, Ross &Westerfield, 2010). The overall investment
of a nation is a component of aggregate demand and therefore boosts economic growth. Effective investment should
also increase the productivity capacity of the economy and firms. Investment in new technology and capital goods can
increase the productivity capacity of the economy leading to an increase in the long run trend rate of economic growth.
Investment also increases the competiveness of an economy (Koori, 2015). Liquidity plays a significant role in
determining success or failure of a firm. It affects business performance due to its effect on the firm’s profitability and
value (Vahid, Mohsen & Mohammadreza, 2012). Liquidity is one of the pillars of performance of firms. Firms must
have an optimal level of liquidity in order to maximize their performance. Large inventories and generous trade credit
policy may lead to higher sales. Firms with larger stock tend to reduce the risk of stock-out, and also a good trade credit
policy may stimulate sales because it allows customers to assess quality before paying (Deloof, 2003).
Gross Domestic Product (GDP) is a measure for all finished goods and services produced in a country for a specific
fiscal year. GDP is equal to total investment, consumption, government spending, and exports less value of imports
(Maclennan& Pryce, 1996). The real GDP portrays economic performance in a country. Interest rate is a price that
relates to present claims on resources relative to future claims on resources. It is the price that a borrower pays in order
to be able to consume resources now. It represents the cost of borrowing capital for a given period of time. It also
represents the price the firms pay for use of debt capital. It is the fee paid for the use of borrowed assets. Inflation is
general rise in price levels for a basket of products (Gallagher, 2011). Inflation refers to the change in the general level
of prices in the economy over a given period of time (Santoni, 1986). Inflation rates have effects on the value of money
and it is measured by the changes in the consumer price index (Liow, Ibrahim & Huang, 2005).
Performance of a firm is a measure of overall well-being of a firm in terms of wealth creation over a given period of
time. It measures how a firm can use investment in long and short term assets to create revenues (Iraya, 2014).
Measures of firm performance can be achieved using either accounting or market metrics with different theoretical
foundation (Hillman & Keim, 2001).This study used Return on Assets and Tobin’s’ Q for both accounting and market
metrics respectively. Nairobi Stock Exchange, (NSE) is the principal bourse in Kenya offering automated platform for
the listing and trading in multiple securities. The market has an obligation to guarantee effective trading in securities
and derivatives and enhances economic development. NSE is publicly traded and the second self-listed exchange in
Africa (NSE, 2016). As at December 2016, there were sixty five (65) firms listed at the NSE. The Firms were grouped
into twelve different sectors including agricultural, automobiles and accessories, banking, commercial and services,
construction and allied, energy and petroleum, insurance, investment, investment services, manufacturing and allied,
telecommunication and technology and real estate investment trust.
Contentious proposals by many researchers on the relationship between corporate governance and firm performance
remained unsettled for a long time. Great corporate failures around the world in recent years have complicated the
problem. Most studies have been carried to examine the relationship between corporate governance and firm
performance and the outcomes have remained conflicting. Some studies established positive significant relationship
between corporate governance and firm performance (Van-Ness et al., 2010; Mulili & Wong, 2011, Rambo, 2013;
Okiaga, 2013; Gachoki & Rotich, 2013; Aduda et al., 2013; Lakaram, 2014; Wang, 2014; Badriyah et al., 2015;
Ahmed & Hamdan,2015; Michelberger,2017; Ibe, Ugwuanyi & Okanya, 2017). Other studies did not establish any
significant relationship between corporate governance and firm performance (Nandi & Ghose, 2012; Waweru & Riro, 2013; Vo& Nguyen, 2014; Jacob, 2015, Faizul &Thankom, 2016; Souha & Anis. 2016; Buvanendra, Sridharan &
Thiyagarajan, 2017).
International Journal of Business and Social Science Vol. 10 • No. 3 • March 2019 doi:10.30845/ijbss.v10n3p2
14
2.0 Literature Review
2.1.1 Theoretical Review
Wealth Maximization Theory
Wealth maximization theory was developed by Ponser (1983). According to the proponents of this theory, the
immediate operating goal and the ultimate purpose of all public corporations is and should be to maximize return on
equity capital. Windsor and Boatright (2010) as proponents of shareholder’s wealth maximization argue that the theory
focuses on the motives and behaviors of financial stakeholders. Wealth maximization theory has received criticism
from various authors. Majority of the critics argue that if the wealth of a firm is maximized, it would be of benefit to
both debenture holders and preference shareholders too. Directors act as agents of shareholders; however there is
always conflict of interest between directors and shareholders. Jones and Felps (2013) also posit that no extent
scholarship has systematically analyzed the utilitarian foundations of shareholder’s wealth maximization.
Stewardship Theory
Stewardship theory was developed by Donaldson and Davis (1991). The theory was an innovative view in
understanding relationship between ownership and management of a firm. Directors are stewards making decisions for
long term survival of firms as well as maximizing shareholders’ wealth. Directors normally perceive firms as extension
of themselves, rather than use their resources for their own interest; the directors’ main interest is ensuring the
sustained life and success of the firm. The theory is based on the duties of directors as stewards, integrating their goals
as part of the firm and recognizing the importance of structures that empower the steward and offers maximum
autonomy built on trust (Donaldson & Davis, 1991). The critics of stewardship theory argue that there is lack of
conclusive evidence linking board to firm performance which has turned researchers’ attention back to the black box of
board process, and emphasized the element of firm context in determining the role and value of the corporate
governance (Huse, 2003). This implies that board of directors which are components of corporate governance may act
as stewards but they do not have direct impact on firm profitability.
Resource Dependency Theory
Resource dependency theory was developed by Pfeffer and Salancik (1978). The theory deals with the study of how
external resources affect the behavior of the organization. The procurement of external resources is an important tenet
for both the strategic and tactical management of any company. The theory concentrates on the role of board of
directors in providing access to resources needed by the firm. The theory emphases on the activities that directors play
in finding resources required by the firm through connections to its external environment (Hillman, Canella & Paetzold,
2000). The theory further gives direction on recruitment of directors who assist in gaining access to vital resources of
the company for survival (Johnson, Daily & Ellstrand, 1996). The critics of this theory have based their arguments
concerning the boundary of space; Casciaro and Piskorski (2005) for instance argue that the Resource dependency
theory can be bounded to the boundaries of the organization concerning internal issues. Hillman et al., (2000) on the
other hand, posit that the Resource dependency theory is bounded to the environment of the organization and assumes
that the organizational actions are constrained to the events in the organizational environment, leaving the environment
as a space boundary.
2.1.2 Empirical Review
Michelberger (2017)found that German corporate governance compliance reports remained stable in five year period
2010-2014, none of the styles of governance factors showed a higher and significant correlation with firm performance
indicators of revenue growth, profitability and total shareholder’s return, most corporate governance variables had
positive effect on the total shareholder’s return, executive board and supervisory board compensations have only very
low effect on revenue growth and profitability. Ibe, Ugwuanyi and Okanya (2017) found that board size and executive
directors’ remunerations have negative and significant effect on firm performance (ROA), while board independence
and institutional ownership indicated positive and significant impact on the financial performance.
Faizul and Thankom (2016) found statistically significant positive relationship between a firm’s corporate governance
quality and its valuation; and there was no statistical relationship between corporate governance and operating
performance. Lekaram (2014) established that the board size is positively and significantly related to performance of
manufacturing firms listed in Kenya and a large proportion of external directors lead to a higher shareholders’ value.
The study did not consider all the firms, making inference of the results is difficult to a wider population and used only two variables of corporate governance which is inadequate for drawing a broader conclusion. This study employed
more characteristics of corporate governance and considered all commercial and service firms listed at the NSE.

ISSN 2219-1933 (Print), 2219-6021 (Online) ©Center for Promoting Ideas, USA www.ijbssnet.com
15
Rambo (2013) found that boards of listed and non-listed companies are significantly different and there is a need of
legal framework to align CMA guidelines to protect investors. This study included commercial and service firms listed
at the NSE.
3.0 Research Methodology
This study used a census approach and a target population of the study comprised all commercial and service firms
listed at the NSE between years 2002 and 2016. A total of ten commercial and service companies were listed at the
NSE as at 31st December 2016. Companies listed at NSE were targeted because the NSE acts as a country’s financial
barometer and the market had received empirical studies and financial data that were used to support this study (Ongore
& K’obonyo, 2011). The 10 companies were screened against various factors which included availability of data for the
period under review and the integrity of data. Data was extracted from annual reports of listed firms from CMA;
published financial statements from NSE; and economic reports from Central Bank of Kenya (CBK) and Kenya
National Bureau of Statistics (KNBS). This study used descriptive analysis and panel data regression in analyzing the
relationship between corporate governance and performance of commercial and service firms listed at the NSE.
Descriptive analysis was carried out to measure dispersion of variables such as standard deviations and coefficient of
variation which was used to disclose the volatility in relationships of the variables under study. A panel data regression
analysis was conducted using random effects model which allowed the companies to have a common mean value of the
intercept to determine whether corporate governance influence performance of commercial and service firms.
Coefficient of Determination (R2) and p-values were used to interpret the regression functions at a level of significance
of 0.05 (Bryman & Cramer, 1997). The respective individual regression coefficients were also tested for their statistical
significance using the t-test. Simple regression model was used to test hypothesis one: Relationship between Corporate
Governance (CG) and Performance of Firms (FP). Panel data regression model of random effects was used to
determine the relationship among Corporate Governance (CG), Financial Characteristics (FC), Macroeconomic Factors
(MF) and Performance of Firms (FP). These models were used to test hypothesis four, the joint effect:
FPit = β0+β1CGit +β2FCit-1 +β3MFit-1+ci +έit
Where:
FPij is Performance of Firms;
CG is Corporate Governance;
FC is Financial Characteristics;
MF is Macroeconomic Factors;
ci unobserved variable; β0 is the intercept;
β1, β2, β3, β4 and β5 are regression coefficients for Corporate Governance, Financial Characteristics and Macroeconomic
Factors for firm i in time t
έ is error term. The study Null hypotheses were rejected when calculated p-values exceeded 0.05 significance level
adopted by the study.
4.0 Results and Discussions
4.1 Descriptive Statistics of Study Variables
Table 1 shows the descriptive statistics of the variables under study. The results show the mean standard deviation,
minimum, maximum of corporate governance variables, financial characteristics variables, macroeconomic factors and
financial performance variables of listed firms in commercial and services sector in Kenya.

International Journal of Business and Social Science Vol. 10 • No. 3 • March 2019 doi:10.30845/ijbss.v10n3p2
16
Table 1: Descriptive Statistics of Study Variables
Variable N Mean Std. Dev. Min Max
Board Independence 101 0.75 0.15 0.38 0.94
Gender Diversity 101 0.20 0.26 0.00 1.00
Occupational Expertise 101 6.45 2.89 2.00 15.00
Board Age 101 55.72 4.05 47.75 63.50
Board Size 101 9.00 3.06 4.00 16.00
Board Tenure 101 3.74 0.89 3.00 5.00
Board Ownership 101 0.11 0.14 0.00 0.66
Board Tools 101 2.54 0.59 1.00 4.00
Board Meeting 101 4.62 1.08 3.00 8.00
Number in Board Committees 101 3.04 1.09 1.00 6.00
Committees Meeting 101 10.70 5.69 2.00 24.00
Board Remuneration 101 -0.03 -1.11 10.6 0.7
Investments 101 0.57 0.24 0.0 0.9
Leverage 101 0.82 3.11 -7.08 0.03
Liquidity 101 0.04 -0.31 1.28 0.72
GDP Growth Rate 120 4.85 2.19 0.20 8.40
Interest Rate 120 15.07 2.26 12.25 9.85
Inflation Rate 120 7.43 3.50 0.90 15.20
ROA 101 0.11 0.34 -1.38 0.67
Tobin’s Q 101 1.77 1.05 0.74 0.59
4.2 Correlation Analysis
4.2.1 Board Structure and Financial Characteristics in Commercial and Service Firms.
Table 2 presents the correlation findings of board structure indicators and financial characteristics of commercial and
service firms listed at NSE. The findings showed that board independence had a positive correlation with investments
and liquidity while it had a negative correlation with leverage. Gender diversity had a positive correlation with
investments and leverage while it had a negative correlation with liquidity. Occupational expertise had a positive
correlation with leverage and liquidity while negative correlation with investments. Board age had positive correlation
with investments and leverage while it had negative correlation with liquidity. Finally, the findings showed that board
size had positive correlation with leverage and liquidity while it had negative correlation with investments of
commercial and service firms listed at NSE.
Table 2: Board Structure and Financial Characteristics in Commercial and Service Firms
Board
independence
Gender
Diversity
Occupational
Expertise
Board
Age
Board
Size
Investme
nts
Levera
ge
Liqui
dity
Board independence r 1
Gender Diversity r -.251* 1
Occupational
Expertise r .593** -.359** 1
Board Age r .570** -0.006 .321** 1
Board Size r .720** -.483** .913** .407** 1
Investments r 0.01 .301** -0.066 .473** -0.230 1
Leverage r -0.003 0.086 0.106 0.040 0.020 0.153 1
Liquidity r 0.099 -.429** .271** -0.178 0.199* -.649** -0.09 1
** Correlation is significant at the 0.01 level (2-tailed).

ISSN 2219-1933 (Print), 2219-6021 (Online) ©Center for Promoting Ideas, USA www.ijbssnet.com
17
4.2.2 Board Activities and Financial Characteristics in Commercial and Service Firms
Table 3 presents the findings on correlation analysis between board activities indicators and financial characteristics
(investments, leverage and liquidity) in listed commercial and service firms. The findings showed that board tenure had
a positive correlation with investments while it had a negative correlation with liquidity and leverage. Board ownership
had positive correlation with liquidity and leverage while it had negative correlation with investments. The findings
also showed that board tools were negatively correlated with investment and positively correlated with leverage and
liquidity. Board meetings had positive correlation with leverage and investments and a negative correlation with
liquidity. The findings further showed that number in board committees was positively correlated with liquidity while
negatively correlated with investment and leverage. Board committee meetings on the other hand were positively
correlated with liquidity and negatively correlated with investments and leverage. Board remuneration had a positive
correlation with liquidity and negatively correlated with leverage and investments of listed commercial and service
firms in Kenya.
Table 3: Board Activities and Financial Characteristics in Commercial and Service Firms
Board
Tenure
Board
Ownership
Board
Tools Board
Meetings
No.in
Board
Committ
ees
Committe
es
Meetings
Board
Remuner
ation Investments Leverage Liquidity
Board Tenure r 1
Board
Ownership r -.625** 1
Board Tools r -0.111 .202* 1
Board
Meetings r -.288** .409** -0.098 1
No. in Board
Committees r -.289** -0.073 -0.034 -.216* 1
Committee
Meetings r 0.081 -0.114 -0.121 -0.15 .748** 1
Board
Remuneration r -0.111 0.052 0.153 0.04 -0.123 -.284** 1
Investments r .378** -.298** -.349** .199* -.317** -0.012 -0.131 1
Leverage r -0.035 0.122 0.03 0.01 -0.05 -0.003 -0.019 0.153 1
Liquidity r -.211* 0.01 .445** -.400** .305** 0.091 0.084 -.649** -0.097 1
N 101 101 101 101 101 101 101 101 101 101
* Correlation is significant at the 0.05 level (2-tailed).
4.2.3 Board Structure and Macroeconomic Factors in Commercial and Service Firms
Table 4 presents the results for board structure indicators and macroeconomic factors for listed firms in commercial and
service sector in Kenya. The finding presented showed that GDP growth rate had a positive correlation with board
independence, gender diversity, board age and board size while it had a negative correlation with occupational
expertise. The findings further showed that interest rate was positively correlated with all the board structure indicators.
Inflation rate on the other hand, had a negative correlation with board independence, occupational expertise, board size
and gender diversity while it was negatively correlated with board age for listed commercial and service firms in
Kenya.
Table 4: Board Structures and Macroeconomic Variables in Commercial and Service Firms
Board
independe
nce
Gender
Diversity
Occupatio
nal
Expertise Board Age
Board
Size GDP Interest Rate
Inflation
Rate
Board
independence r 1
Gender
Diversity r -.251* 1
International Journal of Business and Social Science Vol. 10 • No. 3 • March 2019 doi:10.30845/ijbss.v10n3p2
18
Occupational
Expertise r .593** -.359** 1
Board Age r .570** -0.006 .321** 1
Board Size r .720** -.483** .913** .407** 1
GDP r 0.127 0.029 -0.01 0.134 0.01 1
Interest Rate r 0.099 0.091 0.012 0.083 0.02 -0.151 1
Inflation Rate r -0.052 -0.004 -0.001 0.112 -0.01 -.262** -0.126 1
N 101 101 101 101 101 101 101 101
** Correlation is significant at the 0.01 level (2-tailed).
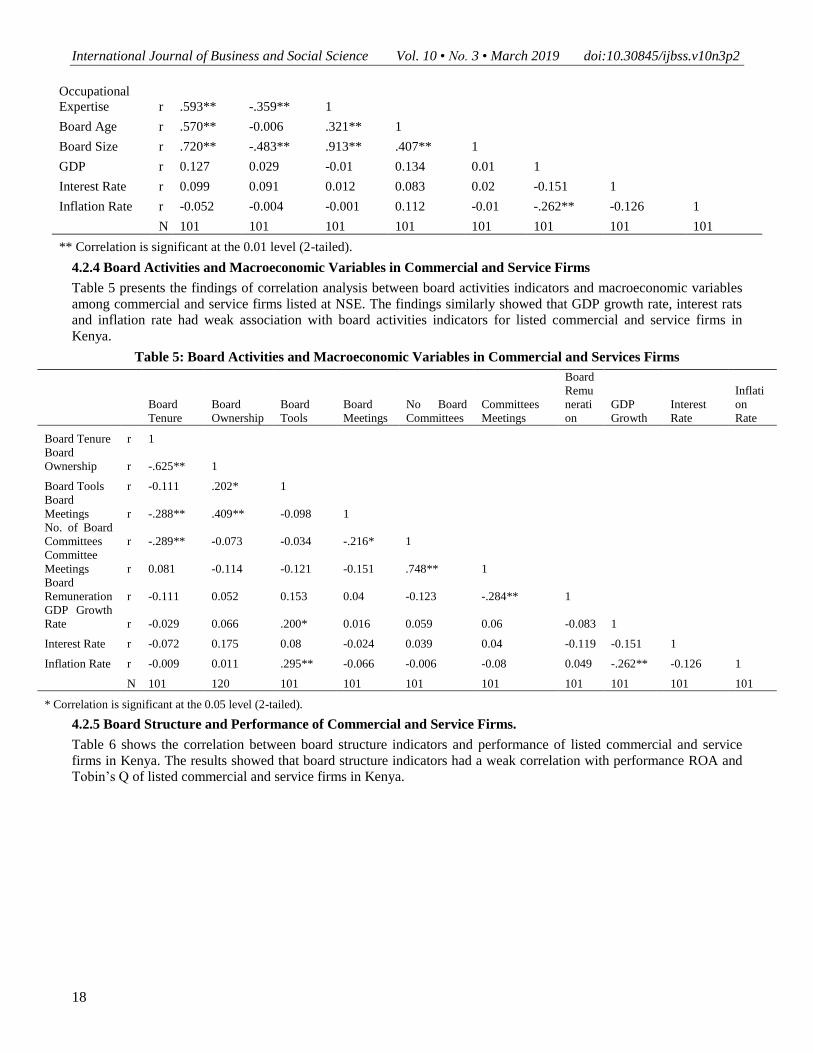
4.2.4 Board Activities and Macroeconomic Variables in Commercial and Service Firms
Table 5 presents the findings of correlation analysis between board activities indicators and macroeconomic variables
among commercial and service firms listed at NSE. The findings similarly showed that GDP growth rate, interest rats
and inflation rate had weak association with board activities indicators for listed commercial and service firms in
Kenya.
Table 5: Board Activities and Macroeconomic Variables in Commercial and Services Firms
Board
Tenure
Board
Ownership
Board
Tools
Board
Meetings
No Board
Committees
Committees
Meetings
Board
Remu
nerati
on
GDP
Growth
Interest
Rate
Inflati
on
Rate
Board Tenure r 1
Board
Ownership r -.625** 1
Board Tools r -0.111 .202* 1
Board
Meetings r -.288** .409** -0.098 1
No. of Board
Committees r -.289** -0.073 -0.034 -.216* 1
Committee
Meetings r 0.081 -0.114 -0.121 -0.151 .748** 1
Board
Remuneration r -0.111 0.052 0.153 0.04 -0.123 -.284** 1
GDP Growth
Rate r -0.029 0.066 .200* 0.016 0.059 0.06 -0.083 1
Interest Rate r -0.072 0.175 0.08 -0.024 0.039 0.04 -0.119 -0.151 1
Inflation Rate r -0.009 0.011 .295** -0.066 -0.006 -0.08 0.049 -.262** -0.126 1
N 101 120 101 101 101 101 101 101 101 101
* Correlation is significant at the 0.05 level (2-tailed).
4.2.5 Board Structure and Performance of Commercial and Service Firms.
Table 6 shows the correlation between board structure indicators and performance of listed commercial and service
firms in Kenya. The results showed that board structure indicators had a weak correlation with performance ROA and
Tobin’s Q of listed commercial and service firms in Kenya.

ISSN 2219-1933 (Print), 2219-6021 (Online) ©Center for Promoting Ideas, USA www.ijbssnet.com
19
Table 6: Board Structure and Performance of Commercial and Service Firms.
Board
independe
nce
Gender
Diversity
Occupational
Expertise Board Age
Board
Size ROA Tobin’s Q
Board
independence r 1
Gender Diversity r -.251* 1
Occupational
Expertise r .593** -.359** 1
Board Age r .570** -0.006 .321** 1
Board Size r .720** -.483** .913** .407** 1
ROA r 0.079 -.266** .301** -.242* .235* 1
Tobin’s Q r -0.021 -.275** .279** -.295** .228* .443** 1
N 101 101 101 101 101 101 101
*Correlation is significant at the 0.05 level (2-tailed).
4.2.6 Board Activities and Performance of Commercial and Service Firms.
Table 7 presents the findings of correlation analysis of board activities indicators and performance of listed commercial
and service firms at NSE. The findings showed that board activities indicators had a weak correlation with both ROA
and Tobin’s Q of commercial and service firms listed at NSE.
Table 7: Board Activities and Performance of Commercial and Service Firms.
Board
Tenure
Board
Ownership
Board
Tools
Board
Meetings
No Board
Committees
Committees
Meetings
Board
Remunerati
on ROA Tobin’s Q
Board Tenure r 1
Board
Ownership r -.625** 1
Board Tools r -0.111 .202* 1
Board Meetings r -.288** .409** -0.098 1
No. of Board
Committees r -.289** -0.073 -0.034 -.216* 1
Committee
Meetings r 0.081 -0.114 -0.121 -0.151 .748** 1
Board
Remuneration r -0.111 0.052 0.153 0.04 -0.123 -.284** 1
ROA r -0.081 -0.13 .330** -.465** .369** .229* 0.08 1
Tobin’s Q r -0.127 -0.133 .215* -.287** .431** .248* 0.18 .443** 1
N 101 101 101 101 101 101 101 101 101
* Correlation is significant at the 0.05 level (2-tailed).
4.2.7 Financial Characteristic Variables and Performance of Commercial and Service Firms
Table 8 presents the findings of correlation analysis between financial characteristics and performance of listed
commercial and service firms at NSE. The findings showed that investments, leverage and liquidity had a weak
positive correlation with both ROA and Tobin’s Q of listed commercial and service firms in NSE. Only Investments
had a strong correlation with Tobin’s Q.

International Journal of Business and Social Science Vol. 10 • No. 3 • March 2019 doi:10.30845/ijbss.v10n3p2
20
Table 8: FC Variables and Performance of Commercial and Service Firms
Investments Leverage Liquidity ROA Tobin’s Q
Investments r 1
Leverage r 0.153 1
Liquidity r -.649** -0.097 1
ROA r .428** 0.128 .423** 1
Tobin’s Q r .529** 0.155 .317** .443** 1
N 101 101 101 101 101
*Correlation is significant at the 0.05 level (2-tailed).
4.2.8 Macroeconomic Factors and Performance in Commercial and Service Sector
Table 9 presents the correlation analysis of macroeconomic variables and performance indicators of commercial and
service firms listed at NSE. The results presented showed that GDP growth rates, interest rates and inflation rates had a
weak correlation with both ROA and Tobin’s Q of listed commercial and service firms in Kenya.
Table 9: Macroeconomic Factors and Performance in Commercial and Service Sector
GDP Interest Rate Inflation Rate ROA Tobin’s Q
GDP Growth Rate r 1
Interest Rate r -0.151 1
Inflation Rate r -.262** -0.126 1
ROA r 0.053 -0.078 0.09 1
Tobin’s Q r 0.085 -0.121 -0.079 .443** 1
N 101 101 101 101 101
** Correlation is significant at the 0.01 level (2-tailed).
4.3 Regression Analysis
4.3.1 Corporate Governance Variables and Performance of Firms in Commercial & Service Sector
Table 10 presents the findings of effect of corporate governance variables on performance of listed firms in commercial
& service sector in Kenya. The results revealed models used to link corporate governance variables to ROA (Prob>Chi2
=0.000) and Tobin’s Q (Prob>Chi2 =0.0000) were statistically significant which implied that corporate governance
variables were significant predictor of performance of listed firms in commercial & service sector in Kenya.
Table 10: Corporate Governance Variables and Performance of Firms in Commercial Service Sector
Model 1 Model 2
ROA Tobin's Q
Board Independence 0.6678778 (p=0.100) -1.822017 (p=0.147)
Gender Diversity -0.098762 (p=0.529) -0.1167565 (p=0.81)
Occupational Expertise 0.0055278 (p=0.839) -0.0881041 (p=0.295)
Board Age -0.032219 (p=0.002) -0.0992268 (p=0.002)
Board Size -0.0066115 (p=0.828) 0.0986653 (p=0.296)
Board Tenure -0.0879642 (p=0.304) -0.6929814 (p=0.009)
Board Ownership -0.7732351 (p=0.073) -3.588354 (p=0.007)
Board Tools 0.1628597 (p=0.005) 0.3286377 (p=0.065)
Board Meetings -0.1011612 (p=0.001) -0.0406569 (p=0.673)
Number of board committees 0.0078687 (p=0.884) 0.2153269 (p=0.198)
Committee Meetings 0.0079789 (p=0.409) 0.0355971 (p=0.234)
Board Remuneration 0.0059472 (p=0.824) 0.0783469 (p=0.345)
_cons 1.798316 (p=0.015) 9.67475 (p=0.000)
Wald chi2 (12)= 81.44 Wald chi2(12)= 79.88
Prob> chi2 = 0.0000 Prob> chi2 = 0.0000
R-sq:= 0.4806 R-sq:= 0.4758
ISSN 2219-1933 (Print), 2219-6021 (Online) ©Center for Promoting Ideas, USA www.ijbssnet.com
21
Board independence, occupational expertise, board tools, number of board committees, committee meetings and board
remuneration were found to be positively related to ROA of listed firms in commercial & service sector in Kenya.
However, only board tools were found to be significant. Gender diversity, board age, board size, board tenure, board
ownership and board meetings were found to be negatively related to ROA of listed firms in commercial & service
sector in Kenya. Board age and board meetings were found to be significantly and negatively related to ROA of listed
firms in commercial & service sector in Kenya. On the other hand, board size, board tools, number of board
committees, committee meetings and board remuneration were found to be positively related to Tobin’s Q of listed
firms in commercial & service sector in Kenya. Board independence, gender diversity, occupational expertise, board
age, board tenure, board ownership and board meetings were found to negatively affect Tobin’s Q of listed firms in
commercial & service sector in Kenya. However, board age, board tenure and board ownership had a significant effect
on Tobin’s Q of listed firms in commercial & service sector in Kenya.
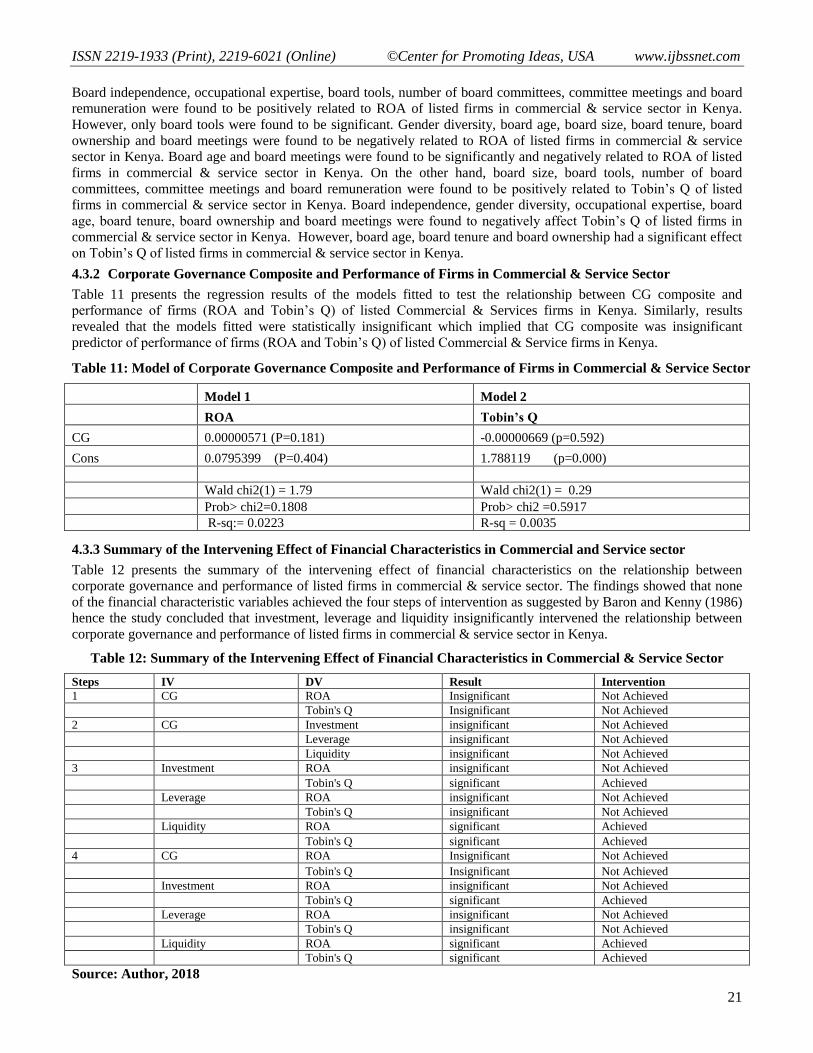
4.3.2 Corporate Governance Composite and Performance of Firms in Commercial & Service Sector
Table 11 presents the regression results of the models fitted to test the relationship between CG composite and
performance of firms (ROA and Tobin’s Q) of listed Commercial & Services firms in Kenya. Similarly, results
revealed that the models fitted were statistically insignificant which implied that CG composite was insignificant
predictor of performance of firms (ROA and Tobin’s Q) of listed Commercial & Service firms in Kenya.
Table 11: Model of Corporate Governance Composite and Performance of Firms in Commercial & Service Sector
Model 1 Model 2
ROA Tobin’s Q
CG 0.00000571 (P=0.181) -0.00000669 (p=0.592)
Cons 0.0795399 (P=0.404) 1.788119 (p=0.000)
Wald chi2(1) = 1.79 Wald chi2(1) = 0.29
Prob> chi2=0.1808 Prob> chi2 =0.5917
R-sq:= 0.0223 R-sq = 0.0035
4.3.3 Summary of the Intervening Effect of Financial Characteristics in Commercial and Service sector
Table 12 presents the summary of the intervening effect of financial characteristics on the relationship between
corporate governance and performance of listed firms in commercial & service sector. The findings showed that none
of the financial characteristic variables achieved the four steps of intervention as suggested by Baron and Kenny (1986)
hence the study concluded that investment, leverage and liquidity insignificantly intervened the relationship between
corporate governance and performance of listed firms in commercial & service sector in Kenya.
Table 12: Summary of the Intervening Effect of Financial Characteristics in Commercial & Service Sector
Steps IV DV Result Intervention
1 CG ROA Insignificant Not Achieved
Tobin's Q Insignificant Not Achieved
2 CG Investment insignificant Not Achieved
Leverage insignificant Not Achieved
Liquidity insignificant Not Achieved
3 Investment ROA insignificant Not Achieved
Tobin's Q significant Achieved
Leverage ROA insignificant Not Achieved
Tobin's Q insignificant Not Achieved
Liquidity ROA significant Achieved
Tobin's Q significant Achieved
4 CG ROA Insignificant Not Achieved
Tobin's Q Insignificant Not Achieved
Investment ROA insignificant Not Achieved
Tobin's Q significant Achieved
Leverage ROA insignificant Not Achieved
Tobin's Q insignificant Not Achieved
Liquidity ROA significant Achieved
Tobin's Q significant Achieved
Source: Author, 2018

International Journal of Business and Social Science Vol. 10 • No. 3 • March 2019 doi:10.30845/ijbss.v10n3p2
22
4.3.4 Moderating effect of Macroeconomic Variables in Commercial & Service Sector
This section presents the findings of sectoral model fitting for moderating effect of macroeconomic variables on the
relationship between corporate governance variables and performance of commercial & services firms listed at NSE in
Kenya.
Table 12: Step One: Models Fitting for Moderating effect of Macroeconomic Factors in Commercial & Service
Sector
Model 1 Model 2
ROA Tobin’s Q
CG 0.00000553 (P=0.182) -0.00000871 (P=0.482)
GDP Growth Rate 0.0085053 (P=0.527) 0.0202893 (P=0.581)
Interest Rate -0.0069949 (P=0.554) -0.0555139 (P=0.087)
Inflation Rate 0.0068003 (P=0.409) -0.0297795 (P=0.187)
_cons 0.0964341 (P=0.683) 2.773831 (P=0.000)
Wald chi2(4)= 3.40 Wald chi2(4)= 5.97
Prob> chi2 = 0.4938 Prob> chi2 =0.2014
R-sq:= 0.0406 R-sq:= 0.0213
Table 13: Step Two: Models Fitting for Moderating effect of Macroeconomic Variables in Commercial &
Service Sector
Model 1 Model 2
ROA Tobin’s Q
CG 0.0000484 (P=0.406) -0.0000797 (P=0.628)
GDP Growth Rate 0.0142956 (P=0.307) 0.0188491 (P=0.632)
Interest Rate -0.0143149 (P=0.238) -0.0687618 (P=0.044)
Inflation Rate 0.0108396 (P=0.207) -0.0343803 (P=0.155)
IT1 -0.0000126 (P=0.115) -0.00000253 (P=0.912)
IT2 0.00000651 (P=0.017) 0.0000057 (P=0.466)
IT3 -0.00000953 (P=0.028) 0.000000424 (P=0.973)
Cons 0.1266062 (P=0.597) 2.98536 (P=0.000)
Wald chi2(7)= 10.62 Wald chi2(7)= 7.79
Prob>chi2= 0.1562 Prob>chi2= 0.3518
R-sq:= 0.0537 R-sq:= 0.0348
Table 12 and Table 13 show that macroeconomic factors increased the explanatory power of corporate governance on
performance of listed commercial & service firms. The results revealed that R-squared increased from 0.0406 to 0.0537
in the first model while increased from 0.0213 to 0.0348 in the second model with the inclusion of the interaction
variables. Inflation rate and interest rate significantly moderated the relationship between corporate governance and
ROA of listed commercial & service firms while the moderating effects of GDP growth rate was insignificant. None of
the macroeconomic factors had significant moderating effect on the relationship between corporate governance and
Tobin’s Q of listed commercial & service firms in Kenya
4.3.5 Joint Effect of Corporate Governance, Financial Characteristics, Macroeconomic Factors on Performance
of Commercial & Service Firms
This section presents the findings on effect of corporate governance, financial characteristics, and macroeconomic
factors on performance of listed commercial & service firms in Kenya. During the period of the study NSE had listed
10 commercial & service firms hence the data for these firms were adequate in conducting analysis.

ISSN 2219-1933 (Print), 2219-6021 (Online) ©Center for Promoting Ideas, USA www.ijbssnet.com
23
Table 14: Joint Effect of CG, FC, Macroeconomic Factors on Performance of Commercial & Service Firms
Model 1 Model 2
ROA Tobin's Q
CG 0.00000023 (p=0.431) -0.00000019 (p=0.080)
Investments 0.159 (p=0.246) -2.629 (p=0.000)
Leverage -0.004 (p=0.571) -0.020 (p=0.494)
Liquidity 0.886 (p=0.000) -0.135 (p=0.729)
GDP Growth rate -0.006 (p=0.634) 0.056 (p=0.218)
Interest Rate -0.024 (p=0.026) -0.048 (p=0.230)
Inflation Rate -0.001 (p=0.853) -0.022 (p=0.434)
_Cons 0.388 (p=0.064) 3.947 (p=0.000)
Wald chi2(7)=16.700 Wald chi2(7)=6.898
Prob> chi2= 0.000 Prob> chi2 = 0.000
R-sq:within = 0.524 R-sq: within = 0.292
Table 15 shows both model 1 linking CG, FC, macroeconomic factors and ROA (Prob>chi2=0.000), and Model 2
linking CG, FC, macroeconomic variables and Tobin’s Q (Prob>chi2=0.000) were statistically significant. These
findings implied that CG, FC, macroeconomic factors were good predictors of listed commercial & service firms
performance. The research findings revealed that Liquidity (β=0.886, p=0.000) and Interest Rate (β=-0.024, p=0.026)
significantly affect ROA while CG (β=0.00000023, p=0.431), Investments (β=0.159, p=0.246), Leverage (β=-0.004,
p=0.571), GDP Growth rate (β=-0.006, p=0.634) and Inflation Rate (β=-0.001, p=0.853) had an insignificant effect on
ROA of listed commercial & service firms. The results further revealed that only firm Investments (β=-2.629, p=0.000)
was significantly related to Tobin’s Q of listed commercial & service firms in Kenya. CG (β=-0.00000019, p=0.080),
Leverage (β=-0.020, p=0.494), Liquidity (β=-0.135, p=0.729), GDP Growth rate (β=0.056, p=0.218), Interest Rate (β=-
0.048, p=0.230) and Inflation Rate (β=-0.022, p=0.434) were found to have insignificant effects on Tobin’s Q of listed
commercial & service firms.
Model 1
FPit (ROA) = 0.388 + 0.00000023 CGit + 0.159INit-1+ -0.004LEit-1 + 0.886LIit-1+-0.006GDPit-1+-0.024INRit-1+-
0.001IFRit-1+ci +έit
Model 2
FPit(Tobin’s Q) = 3.947 + -0.00000019 CGit + -2.629 INit-1+ -0.020LEit-1 + -0.135LIit-1 + --0.056GDPit-1+-0.048INRit-
1+-0.022IFRit-1+ci +έit
Where;
CG =Corporate Governance
IN = Firm Investments
LE= Firm Leverage
LI= Firm Liquidity
GDP = GDP growth Rate
INR = Interest Rate
IFR= Inflation Rate
ε =Error Term
5.0 Conclusion
The study concluded that commercial and service listed firms in Kenya adopted corporate governance practices as part
of the requirements of the regulating authority which had no impact on the specific firm’s performance. The study
established that most of the corporate governance practices adopted by commercial and service listed firms in Kenya
had an insignificant effect on the performance of listed firms. The study concluded that commercial and service listed
firms in Kenya strengthened their corporate governance due to poor performance, further the study concluded that

International Journal of Business and Social Science Vol. 10 • No. 3 • March 2019 doi:10.30845/ijbss.v10n3p2
24
corporate governance practices used by commercial and service listed firms failed to impact on performance. The study
also concluded that listed commercial and service firms in Kenya continued to record poor performance despite
corporate governance investments. The study finally concluded that commercial and service listed firms that focused on
enhancing their corporate governance, financial characteristics and operated in favorable macroeconomic environment
were likely to increase their performance since jointly; corporate governance, financial characteristics and favorable
macroeconomic conditions were found to account for the highest performance in both ROA and Tobin’s Q of the listed
firms in Kenya.
6.0 Recommendations
Based on the findings, the study recommended that commercial and service listed firms should revisit their corporate
governance practices to ensure that leverage on board structures and board activities that improve performance while
obsolete corporate governance practices should be eradicated. The shareholders of commercial and service listed firms
may adopt the findings of this study to restructure their corporate governance by implementing board structures and
board activities that will improve performance of their firms or realign the corporate governance practices to make
them more effective. The stakeholders may also use the findings of this study to open inquiry on effectiveness of
corporate governance in their respective firms for future improvement. Based on these findings, it was recommended
that management of commercial and service listed firms should restructure and optimize their financial characteristics
to achieve higher level performance of their firms.
References
Abu-Tapanje, D.M. (2007). Good corporate governance mechanism and firms' operating and financial performance:
insight from the perspective of Jordanian industrial companies. Academy of Management Review, 12 (3), 231-
279.
Aduda, J., Chogii, R. & Magutu, P. O. (2013). An empirical test of competing corporate governance theories on
Performance of firms listed at the Nairobi securities exchange. European Scientific Journal, IX (13), 107-137
Aghouei, M. V. & Moradi, M. (2015).A study of the relationship of firm characteristics and corporate governance
with the difference between declared and final taxes in Iran. Mediterranean Journal of Social Sciences, 6(4),
488
Badriyah, N., Sari, N. S. & Basri, Y. M. (2015). The effect of corporate governance and firm characteristics on
Performance of firms and risk management as an intervening variable. Procedia Economics and Finance
31(20125), 868-875
Baldwin, C, Bagley, C., & Quinn, J. (2003).M&A legal context: Basic framework for corporate governance. Harvard
Business School Press, 9-803-200
Bantel , K. A. & Jackson,S. E. (1989). Top management and innovations in banking: does the composition of the top
team make a difference? Strategic Management Journal, 10,107-124
Baysinger, B. & Butler, H. (1985). Corporate governance and the board of directors: Performance effects of changes in
board composition. Journal of Law, Economics and Organizations, 1(1), 101-124
Boussouara, M. & Deakins, D (2000). Market based learning, entrepreneurship and the high technology small firm.
International Journal of Entrepreneurial Bahaviour and Research, 5(4), 204-223
Brickley, J.A., Lease, D. & Smith, R.C.W. (1988).Ownership structure and voting on anti-takeover amendments. Journal of Financial Economics, 20(1), 267–291
Bryaman, A. & Cramer, D. (1997). Quantitative Data Analysis with SPSS for Windows: A guide for Social Scientists.
London: Routledge
Buvanendra, S., Sridharan, P. & Thiyagarajan, S. (2017). Firm characteristics, corporate governance and capital
structure adjustments: a comparative study of listed firms in Sri Lanka and India. Journal of IIMB
Management Review, 29(4), 245-258
Carpenter, M., Geletkanycz, M. & Sanders, W. (2004). Upper echelons research revisited: Antecedents, elements, and
consequences of top management team composition. Journal of Management, 30(6), 747-778
Carter, D., Simkins, B. & Simpson, W. (2003).Corporate governance, board diversity, and firm value. The Financial
Review, 38, 33-53
Dalton, D., Daily, C., Ellstrand, A. & Johnson, J. (1998) Meta-analytic reviews of board composition, leadership
structure, and financial performance. Strategic Management Journal, 19, 269-290
Deloof, M. (2003). Does working capital management affect profitability of Belgium firms? Journal of Business finance and Accounting, 30 (3-4), 573-588.

ISSN 2219-1933 (Print), 2219-6021 (Online) ©Center for Promoting Ideas, USA www.ijbssnet.com
25
Faizul, H. & Thankom , G. A. (2016). Corporate governance and financial performance; an emerging economy
perspective. Journal of Investment, Management and Innovations, 13(3).228-236
Gachoki S. & Rotich, G. (2013). Influence of corporate governance on the performance of public organizations in
Kenya (a case of Kenya ports authority). Research Journal of Finance and Accounting. 4 (6), 205-215
Gallagher, M. (2011). The effect of inflation of housing prices from http://homeguides.sfgate.com/effect-inflation-
housing-prices-2161.html
Hillier, D., Jaffe, J., Jordan, B., Ross, S., & Westerfield, R. (2010). Corporate finance, 1st European Edition, McGraw-
Hill Edition
Hillman, A.J. & Keim, G. D. (2001).Shareholder value, stakeholder management and social issues. What’s the bottom
line? Journal of Strategic Management, 22,125-139
Hillman, A.J., Canella, A. A. & Paetzold, R. L. (2000). The resource dependency role of corporate directors: strategic
adaptation of board composition in response to environmental change. Journal of Management Studies, 37(2),
235-255
Ibe, H. C. A., Ugwuanyi, G. O. & Okanya, O. C. (2017). Effects of corporate governance mechanisms on financial
performance of insurance companies in Nigeria, Journal of Finance and Accounting, 5(3),93-103
Iraya, C., Mwangi, M. & Muchoki, G. W. (2015). The effect of corporate governance practices on earnings
management of companies listed at the Nairobi securities exchange. European Scientific Journal, 11 (1), 1857
– 7881
Jacob, S. (2015). Effects of macroeconomic forces on corporate governance performance of Indian companies: an
exploratory study. International Journal of Marketing, Financial Services & Management Research.4 (3),
149-176
Jensen, M. (1986).Agency Costs of Free Cash Flow, Corporate Finance, and Takeovers. American Economic Review,
76(2) 323-329
Jensen, M. C. & Murphy, K. J. (2010). CEO incentives-it is not how much you pay, but how. Journal of Applied
Corporate Finance, 22(1), 64-76
Johnson, J.L., Daily, C.M. and Ellstrand, A.E. (1996). Boards of directors: a review of research agenda. Journal of
Management, 22(3), 409-438
Jones, T. M., &Felps, W. (2013). Shareholder wealth maximization and social welfare: A utilitarian critique. Business
Ethics Quarterly, 23(2), 207-238
Khanchel, I. (2007). Corporate governance: measurement and determinant analysis. Managerial Auditing Journal, 22
(8), 740-760
Klein, A .(2002). Audit committee, board of director characteristics, and earnings management. Journal of Finance and
Economics. 33(3), 374-440
Koori M. J. (2014). Financial flexibility and corporate investment among non-financial companies listed on Nairobi
Securities Exchange, Kenya. (PhD Thesis, Kenyatta University)
Lekaram , V. (2014). Relationship of corporate governance and financial performance of manufacturing firms listed in
the Nairobi securities exchange. International Journal of Business and Commerce, 3, (12), 30-57
Liow, K.H., Ibrahim, M.F. & Huang, Q. (2006). Macroeconomic risk influences in the property stock market. Journal of property investment and finance, 24(4).
Lipton, J. & Lorsch, J. (1992). A modest proposal for improved corporate governance, Business Laywer, 48(1), 59-77
management policies on firm’s profitability and value: evidence from Iranian
Mathew H., Paul H., Kamel M. & Cherif, G. (2010). Short-term versus long-term impact of managers: evidence
from the football industry. British Journal of Management, 21, 571–589
Michelberger, K. J. (2017). Impact of corporate governance of firm performance and total shareholder return of
German listed companies. (PhD Thesis, University of Lativa)
Mudida, R. & Ngene, G. (2010).Financial management, Nairobi: Focus Publishers Ltd
Mulili, B. M. & Wong, P. (2011). Corporate governance practices in developing countries: The case for Kenya.
International Journal of Business Administration, 2 (1), 14-27
Nandi, S. & Ghosh, S. K. (2012). Corporate governance attributes, firm characteristics and the level of corporate
disclosure: evidence from the Indian listed firms. Decision Science Letters, 2, 45–58
Okioga, C. K. (2013). The contribution of good corporate governance practices on the flow of investor into Nairobi
securities exchange. International Journal of Current Research,5(8), 2391-2398
Ombayo, J. O. (2011). The effect of corporate governance on a firm's financial performance: a case study of companies
listed on the Nairobi Stock Exchange (PhD Thesis, University of Nairobi)
Ondigo, H. O. (2016). Corporate governance, risk management, firm characteristics and financial performance of
commercial bank in Kenya. (PhD Thesis, University of Nairobi)
International Journal of Business and Social Science Vol. 10 • No. 3 • March 2019 doi:10.30845/ijbss.v10n3p2
26
Ongore, V. O. & K’Obonyo, P. O. (2011). Effects of selected corporate governance characteristics on Performance of
firms: empirical evidence from Kenya. International Journal of Economics and Financial Issues, 1(3), 99-122
Pfeffer, J. & Salancik, G. R. (1978), The External Control of Organizations: A Resource Dependence Perspective,
Harper & Row, New York
Posner, R. A. (1983). The economics of justice. Harvard University Press
Rambo, C. M. (2013). Influence of the capital markets authority’s corporate governance guidelines on financial
performance of commercial banks in Kenya. The International Journal of Business and Finance Research, 7
(3), 7-91
Ribeiro, A., Cerqueira, A., & Brandão, E. (2015).The determinants of effective tax rates: firms' characteristics and
corporate governance: Working Paper, FEP- UP, School of Economics and Management, University of
Porto
Rose, C. (2007). Does female board representation influence firm performance? The Danish evidence, corporate
governance. An International Review, 15(2), 404-413
Ruigrok, W., Peck, S. & Tacheva, S. (2007). Nationality and gender diversity on Swiss corporate boards,” Corporate
Governance, 15 (4), 546-557
Santoni, G. J. (1986). The effects of inflation on commercial banks: Federal Reserve
Sharp P., Ainslie T., Hamphil A., Hobsin S., Merrman C., Ong P and Roche J. (2005) Monitoring.
http://www.practicebasedlearning.org/resources/materials/docs/Brooks%20final.pdf
Souha, S. B., & Anis, J. (2016). Corporate governance and firm characteristics as explanatory factors of shareholder
activism: validation through the French context. Cogent Economics & Finance, 4(1), 1-19
Tricker, R. B., & Tricker, R. I. (2015).Corporate governance: Principles, policies, and practices. Oxford University
Press, USA
Vahid, T. K., Mohsen, A. K. & Mohammadreza, E. (2012). The impact of working capital
Van-Ness, R. K., Miesing, P., & Kang, J. (2010).Board of director composition and financial performance in a
sarbanes-oxley world.Academy of Business and Economics Journal, 10(5), 56-74
Vo, D. H., & Nguyen, T. M. (2014). The impact of corporate governance on performance of firms: Empirical study in
Vietnam. International Journal of Economics and Finance, 6(6), 1-13
Wakaisuka, J. I.,Aduda J., Wainaina, G., Iraya, M. & Ntim C. G. (2016). Corporate governance, firm characteristics,
external environment and performance of financial institutions in Uganda. A review of literature. Cogent
Business & Management, 3(1),1-14
Wang, C. J. (2014). The impact of macroeconomic and corporate governance factors on firm value of Taiwanese green
technology industry: a consideration of differential slope. International Journal of Economics and Finance, 6
(7),1916- 9728
Waweru, N. M. & Riro, G. K. (2013).Corporate governance, firm characteristics and earnings management in an
emerging economy.JAMAR.11(1)
Windsor, D., & Boatright, J. R. (2010).Shareholder wealth maximization. Finance ethics: Critical issues in theory and practice, 437-455
Wright, P., Ferris, S., Sarin, A. & Awasthi, V. (1996). Impact of corporate insider, block holder, and institutional equity
ownership on firm risk taking. Academy of Management Journal, 39,441-463