Corporate Governance and Firm’s Exporting Decision ... · iii CERTIFICATE OF APPROVAL Corporate...
88
i Corporate Governance and Firm’s Exporting Decision: Evidence from Pakistan Stock Exchange. By Ahmed Hassan Kanju (MM 141042) MASTER OF SCIENCE IN MANAGEMENT SCIENCES (FINANCE) FACULTY OF MANAGEMENT AND SOCIAL SCIENCES CAPITAL UNIVERSITY OF SCIENCE AND TECHNOLOGY ISLAMABAD OCTOBER 2016
Transcript of Corporate Governance and Firm’s Exporting Decision ... · iii CERTIFICATE OF APPROVAL Corporate...
i
Corporate Governance and Firm’s Exporting Decision: Evidence from
Pakistan Stock Exchange.
By
Ahmed Hassan Kanju
(MM 141042)
MASTER OF SCIENCE IN MANAGEMENT SCIENCES
(FINANCE)
FACULTY OF MANAGEMENT AND SOCIAL SCIENCES
CAPITAL UNIVERSITY OF SCIENCE AND TECHNOLOGY
ISLAMABAD
OCTOBER 2016

ii
Corporate Governance and Firm’s Exporting Decision: Evidence from
Pakistan Stock Exchange.
By
Ahmed Hassan Kanju
(MM 141042)
A research thesis submitted to the Department of Management sciences,
Capital University of Science and Technology, Islamabad
In partial fulfillment of the requirements for the degree of
MASTER OF SCIENCE IN MANAGEMENT SCIENCES
(FINANCE)
DEPARTMENT OF MANAGEMENT SCIENCES
CAPITAL UNIVERSITY OF SCIENCE & TECHNOLOGY
ISLAMABAD
OCTOBER 2016

iii
CERTIFICATE OF APPROVAL
Corporate Governance and Firm’s Exporting Decision: Evidence from
Pakistan Stock Exchange.
By
Ahmed Hassan Kanju
(MM 141042)
THESIS EXAMINING COMMITTEE
S No Examiner Name Organization
(a) External Examiner Dr. Muhammad Khalid Sohail COMSATS, Islamabad
(b) Internal Examiner Mr. Ahmad Fraz CUST, Islamabad
(c) Supervisor Mr. Shujahat Haider Hashmi CUST, Islamabad
________________________________
Mr. Shujahat Haider Hashmi
Thesis Supervisor
October 2016
CAPITAL UNIVERSITY OF SCIENCE & TECHNOLOGY
ISLAMABAD
______________________________
Dr. Sajid Bashir
Head
Department of Management and Social Sciences
Dated : October 2016
___________________________
Dr. Arshad Hassan
Dean
Faculty of Management and Social Sciences
Dated : October 2016

iv
Copyright © By Mr. Ahmed Hassan Kanju
All rights reserved. No part of material protected by this copyright notice may be replaced or
utilized in any form or by any means, electronic or mechanical, including photocopy, recording
or by any information storage and retrieval system without the permission from author.

v
Certificate
This is to certify that Mr. Ahmed Hassan Kanju has incorporated all observations, suggestions
and comments made by the external evaluators as well as the internal examiners and thesis
supervisor. The title of his Thesis is: Corporate governance and Firm’s exporting decision:
Evidence from Pakistan Stock Exchange.
Forwarded for necessary action
Mr. Shujahat Haider Hashmi
(Thesis Supervisor)

vi
Dedication
Dedicated from core of my heart to my beloved parents Mr. & Mrs. Mian Shauket Javed Kanju
and my adorable and very supportive sisters.

vii
Table of Contents
Chapter 01 ....................................................................................................................................... 1
INTRODUCTION .......................................................................................................................... 1
1.1 Background of the study .................................................................................................. 1
1.2. Theoretical Background ................................................................................................... 7
1.2.1 Agency Theory.......................................................................................................... 7
1.3. Problem Statement ........................................................................................................... 8
1.4. Research Question ............................................................................................................ 9
1.5. Research Objective ........................................................................................................... 9
1.6. Significance of the Study ............................................................................................... 10
1.7. Organization of the Study .............................................................................................. 11
Chapter 02 ..................................................................................................................................... 12
LITERATURE REVIEW ............................................................................................................. 12
2.1 Brief Review of Literature ............................................................................................. 12
2.2 Hypothesis Development ............................................................................................... 33
2.3 Theoretical Framework .................................................................................................. 33
Chapter 03 ..................................................................................................................................... 35
DATA DESCRIPTION AND METHODOLOGY ....................................................................... 35
3.1 Sample and Data Source ................................................................................................ 35
3.2 Variables of Study and Measurement ............................................................................ 36
3.2.1 Dependent Variable ................................................................................................ 37
3.2.2 Independent Variables ............................................................................................ 37
3.2.3 Control Variables .................................................................................................... 39
3.3 Model Specification ....................................................................................................... 41
3.4 Panel Data Regression .................................................................................................... 43
3.5 Pooled Dummy Variables .............................................................................................. 45
3.4.6 Sector Analysis ........................................................................................................... 46

viii
Chapter 04 ..................................................................................................................................... 47
EMPIRICAL RESULTS AND DISCUSSION ............................................................................ 47
4.1 Empirical Results ........................................................................................................... 47
4.1.1 Descriptive Results ................................................................................................. 47
4.2 Multicollinearity Checks ............................................................................................ 52
4.3. Regression Analysis ................................................................................................... 55
4.1.4. Pooled Dummy Regression Analysis...................................................................... 61
4.2. Discussion of Results ..................................................................................................... 62
Chapter 05 ..................................................................................................................................... 64
CONCLUSION AND POLICY RECOMMENDATIONS ...................................................... 64
5.1 Conclusion .................................................................................................................. 64
5.2 Policy Recommendations ........................................................................................... 65
5.3 Limitations .................................................................................................................. 66
5.4 Future Research Directions ........................................................................................ 67
References: .................................................................................................................................... 68

ix
List of Tables
Table 1.1 Year Wise Exports ....................................................................................................... 05
Table 1.2 Sector Wise Exports...................................................................................................... 06
Table 3.1 Sample Classification ................................................................................................... 36
Table 3.2 Variable’s Description .................................................................................................. 42
Table 4.1: Descriptive Statistics ................................................................................................... 49
Table 4.2: Correlation Matrix ....................................................................................................... 53
Table 4.3: Variance Inflaton Factor .............................................................................................. 54
Table 4.4: Common Effect Model ................................................................................................ 55
Table 4.5: Likelihood Ratio Test .................................................................................................. 57
Table 4.6: Random Effect Model.................................................................................................. 57
Table 4.7: Hausman Test .............................................................................................................. 59
Table 4.8: Fixed Effect Model ...................................................................................................... 60
Table 4.9: Pooled Dummy Regression ......................................................................................... 61

x
ACKNOWLEDGEMENTS
All the praises are for the Allah Almighty; the most beneficent and the most merciful;
who granted man with knowledge. All salutations are upon the Prophet (P.B.U.H.) whose
teachings enlighten my thought and thrive my ambitions.
I sincerely wish to express my profound gratitude and appreciation to my supervisor Mr.
Shujahat Haider Hashmi for his support in all research activities. Without his help my Mphill
thesis was next to impossible.
I am extremely grateful to my parents Mr. & Mrs Mian Shauket Javed Kanju and my
supportive sisters. My whole academic career till now would have not been possible without the
love and support of my family, who believed in me blindly and they kept me going and were the
force behind me.
I would also like to thanks my friends and class fellows who helped me a lot in academia
as well as in other disciplines of life.
Thanks to all of you !
xi
Corporate Governance and Firm’s Exporting
Decision: Evidence from Pakistan Stock Exchange.
ABSTRACT
The study is focused to check the effect of ownership structure and corporate governance on
firm’s exporting decision. A set of 100 non-financial listed companies were selected from
Pakistan Stock Exchange. The data were collected from annual reports of selected companies
from year 2005 to 2014. Ownership structure is measured by managerial ownership and
institutional ownership, corporate governance is measured by board size and by independent
directors in board of directors. Exporting decision of firm is measured by export intensity.
Panel data regression model is being applied for analysis and fixed effect model is applied.
Results indicate a significant and positive relationship between firm’s exporting decisions and
corporate governance but not significant with ownership structure.
Key Words: Export intensity, Managerial ownership, Institutional ownership and Corporate
Governance.
1
Chapter 01
INTRODUCTION
1.1 Background of the study
For many decades due to globalization, the internationalization of business activities has
been broadly researched phenomenon in developed countries as well as developing countries.
Internationalization of business operations incorporates extensive variety of procedures and
measures which include licensing, franchising, foreign direct investment and global outsourcing
etc. Globalization creates rapid growth in demand and supply across boundaries which ultimately
increase the internationalization of firm’s activities in transition economies like India, China and
Eastern European nations. Swapping good and services across borders has been playing very
vital role and became a dominant approach of international market participation as a number of
studies in past suggests that by participating in foreign markets improves firm’s performance,
profitability and long run existence scenarios (Greenaway, Guariglia, and Kneller, 2007; Park et
al., 2010).
Encouraging the internationalization of business activities has been eye-catching strategy
in many countries, specifically transition economies as well as developing economies (Buck et
al., 2000) which has been done usually via exports. Next example is the exemplary case of
export-led improvement achievements of the countries which are also known as Asian Tigers
(World Bank, 1993).
2
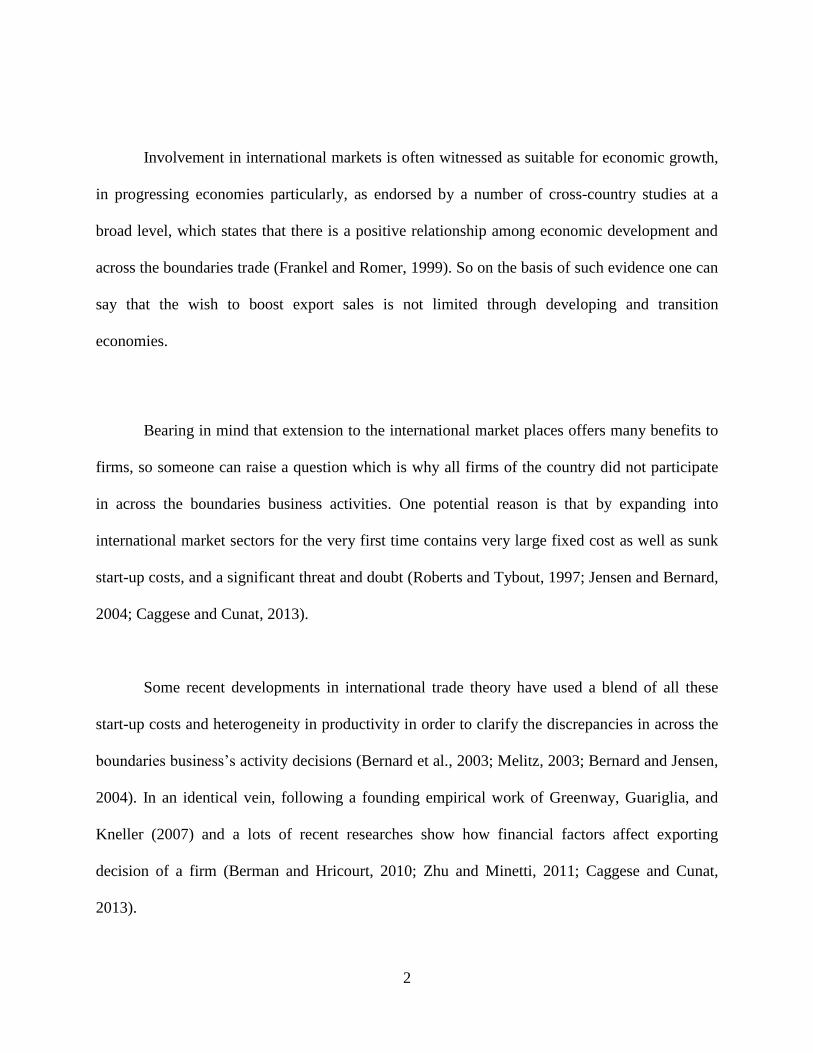
Involvement in international markets is often witnessed as suitable for economic growth,
in progressing economies particularly, as endorsed by a number of cross-country studies at a
broad level, which states that there is a positive relationship among economic development and
across the boundaries trade (Frankel and Romer, 1999). So on the basis of such evidence one can
say that the wish to boost export sales is not limited through developing and transition
economies.
Bearing in mind that extension to the international market places offers many benefits to
firms, so someone can raise a question which is why all firms of the country did not participate
in across the boundaries business activities. One potential reason is that by expanding into
international market sectors for the very first time contains very large fixed cost as well as sunk
start-up costs, and a significant threat and doubt (Roberts and Tybout, 1997; Jensen and Bernard,
2004; Caggese and Cunat, 2013).
Some recent developments in international trade theory have used a blend of all these
start-up costs and heterogeneity in productivity in order to clarify the discrepancies in across the
boundaries business’s activity decisions (Bernard et al., 2003; Melitz, 2003; Bernard and Jensen,
2004). In an identical vein, following a founding empirical work of Greenway, Guariglia, and
Kneller (2007) and a lots of recent researches show how financial factors affect exporting
decision of a firm (Berman and Hricourt, 2010; Zhu and Minetti, 2011; Caggese and Cunat,
2013).

3
Corporate governance incorporates the processes of controlling organization. It helps to
overcome agency problem (Daily & Dalton, 2003). In simple words when managers start
working for their own interest instead of what shareholders want is known as agency problem.
To overcome and control this dilemma corporate governance plays a vital role. Corporate
governance enhances effectiveness, efficiency and profitability of firm (Boubakri, Cosset &
Guedhami, 2004). However, good governance is also required to attract more investors as poor
governance limits the outsider investors (Khow, Stulz & Warnock, 2008). Firm’s exporting
decision is one of the strategic decisions which are the integral part of corporate governance.
However, this study further explains the relation of corporate governance and firm’s exporting
decisions.
A large number of empirical studies explored the impact of managerial incentives and
corporate governance mechanisms on performance of the firm and some other tools of corporate
governance which includes research and development and investment in physical assets. The
interest alignment hypothesis of Jensson and Meckling (1976) suggests that managerial
ownership along managerial incentives with shareholders interest is the only ingredient which
provides incentives to top management in order to undertake some risky projects or investments
and make such decisions which maximize the wealth of shareholder. Amihud and Lev (1981) &
May (1995) proposed a counter argument and suggests that when shares holding of managers
become large then managers avoid risky investment and opt those projects or policies which
reduces the idiosyncratic risk of the firm at the expense of interest of shareholder. With
managerial incentives some other related variables of corporate governance such as institutional
ownership or board structure also shown some impact on firm exporting behavior.

4
According to Doidgea, Karolyi and Stulzb (2005) corporate governance has different
impact across different countries and different firms. The Securities and Exchange Commission
of Pakistan, since it took over the responsibilities and powers of the Corporate Law Authority in
1999 has been acutely alive to the changes taking place in the international business
environment, which directly and indirectly impact local businesses. As part of its
multidimensional strategy to enable Pakistan's corporate sector meet the challenges raised by the
changing global business scenario and to build capacity, the SECP has focused, in part, on
encouraging businesses to adopt good corporate governance practices. This is expected to
provide transparency and accountability in the corporate sector and to safeguard the interests of
stakeholders, including protection of minority shareholders' rights and strict audit compliance. In
Pakistan governance reforms took place in 2002 which motivates organization to promote
corporate governance. Better governed firms must enhance, motivates and increases the interest
of the board and management, it also improves monitoring, controlling and efficiency of the
firm. It also increases the confidence of the investors and performance of the firm. However,
corporate governance in Pakistan is still not in its best form as compared to other emerging
economies.
1.1.2 International Trading Environment in Pakistan
During last ten years from 2005 to 2014, Pakistan exports recorded very bouncing and
rapid growth. In 2004 total exports of Pakistan were US$ 12,313 billion which becomes US$

5
23,667 billion in 2014 as shown in the table 1.1. In 2015 Pakistan’s exports are showing negative
growth as there is a declining trend. International trade without any quota system has started
since few years and it has created opportunities for developing countries to export without any
restriction. Neighboring countries like India, Srilanka and Bangladesh doubled their exports but
unfortunately Pakistan didn’t took advantage of restriction free trade across boundaries.
Table 1.1: Year Wise Exports
Year Exports(US$ billion)
2004 12313
2005 14391
2006 16451
2007 16976
2008 19052
2009 17688
2010 19290
2011 24810
2012 23624
2013 24460
2014 25110
2015 23667
However, it is also observed that since last couple of year’s sluggish progress of global
economy has also affected exports of countries especially regional countries like Pakistan and

6
India. India’s exports declined by 17.2% in 2014 as compared to 1.3% decline in 2013. On the
other hand the major sector of Pakistan’s export which is textile sector as it has 60 % share in
total exports is majorly affected by tough competition given by Bangaladesh.
Generalized Scheme of Preferences (GSP) Plus status has been given to Pakistan in 2013
by European Union (EU). This status actually enables duty free textile exports to all 27 states of
EU till 2017. During this period due to lack of planning Pakistan’s textile exports could made
significant growth as it grew US$ 6.21 billion to US$ 7.54 billion which is only 21.5% but
Bangladesh’s textile exports were significantly increased by 38%.
The major sectors of Pakistan’s exports are food related commodities which is 24%. This
sector includes export of food related commodities like rice, wheat, sugar etc. Textile industry
has also very big contributor in exports of Pakistan. Table 1.2 shows the sector wise contribution
in total exports of Pakistan. Mineral fuels and manufacturing goods are contributing 19% each in
total exports while other sectors food, crude material, chemical, machinery and miscellaneous
are contributing 24%, 11%, 11%, 8%, 8% respectively
Table 1.2: Sector Wise Exports
Sector Percentage
Mineral Fuels 19
Manufactured Goods 19
Food 24
Crude Materials 11

7
Chemicals 11
Machinery 8
Miscellaneous 8
Total 100
1.2. Theoretical Background
This section has two things. First one is the relevant theories which were discussed in
detail then justification of topic i-e the relationship between Corporate Governance and Firm’s
exporting decision will proceed.
1.2.1 Agency Theory
In last few decades world has seen many recessions. Therefore, corporate governance
gets more importance and attention. In many past researches importance of corporate governance
related to firm’s outcome and performance is analyzed. However, very few researches show the
relation of corporate governance and firm’s exporting decisions. Corporate governance has
influence on internal management. If the control on internal management is weak then it
promotes agency problem in the firm.
This relation of corporate governance and firm’s exporting decisions has theoretical
support of different theories like “agency theory” and “International trade Theory”. Agency
theory Jenson and Meckling (1973) or principle agent problem arises when managers start

8
exploiting the rights of shareholders by focusing on their own interest rather than shareholders.
Many researches show that corporate governance minimized agency problem and individual as
well as institutional investor always prefer well governed firm. However, institutional and
managerial ownership also mitigates the agency problem as they have to protect their investment
and control.
1.3. Problem Statement
The purposes of this research it to identify a relationship between corporate governance
and firm’s exporting decision. The literature on international trade has mostly ignored the effects
of managerial ownership and other tools of corporate governance on exporting decisions of firm,
which has revealed that above mentioned variables significantly affecting some other features of
firm’s performance in the literature of business finance. An enormous number of theoretical and
empirical studies studied the effects of ownership structure and corporate governance tools on
several types of business decisions which include investment in fixed asset or physical assets and
in new research and development (R&D).
In Pakistan very few researches have ever been done which explains the importance of
corporate governance and its impact on exporting behavior. Moreover, literature is weaker on
relation with ownership structure. To elaborate its importance and to fulfill the gap this research
is conducted. Therefore, the finding of this research will play very significant role in the
literature as well as in Pakistan’s corporate sector.

9
1.4. Research Question
This study attempts to address a generic question that whether the corporate governance
affect or influence the firm’s exporting behavior. In order to examine the relationship the
following question is formulated
What is the impact of corporate governance on Pakistani listed firm’s exporting decision.
What is the impact of ownership structure on Pakistani listed firm’s exporting decision.
1.5. Research Objective
The main objective of this study is as following.
To determine the relationship between board independence and export intensity of
Pakistani listed firms.
To determine the relationship between board size and export intensity of Pakistani listed
firms.
To determine the relationship between managerial ownership and export intensity of
Pakistani listed firms.
To determine the relationship between institutional ownership and export intensity of
Pakistani listed firms.
10
1.6. Significance of the Study
This study not only provides valuable information to the manager and academicians but also
very helpful for regulatory bodies to understand the role of ownership structure and corporate
governance in exporting decision of firms. First of all, this study will help managers to
understand factors affecting exporting decision.
This study will contribute significantly to the body of knowledge by explaining the
relationship of managerial ownership and corporate governance on export intensity of PSX listed
companies. A number of different researches have already been done on this particular topic for
instance, Dixon, Guariglia Vijayakumaran (2015) in China. However, in different regions and
economies the standards of corporate governance and ownership structure are different. This
study is conducted on 100 listed firms and also according to the limited standards of corporate
governance in Pakistan as compared to the other emerged economies.
This study will also contribute in the literature of exporting decision by including
mechanisms of corporate governance as new components, with the determination of improved
description and thorough explanation of factors or elements which affects firm’s export intensity.
This study will also contribute to the body of ownership structure specifically managerial
incentives, in context of exporting decisions of firms in emerging and developing economies.

11
1.7. Organization of the Study
The first chapter talks about detailed introduction of topic and detailed literature review will
proceed in second chapter. The further study approaches the following manner. Third chapter is
comprises of methodology and fourth chapter elaborates results and descriptive statistics. Fifth
chapter concludes and gives recommendations. All the references are mentioned at the end of the
document.

12
Chapter 02
LITERATURE REVIEW
2.1 Brief Review of Literature
This section of study includes the review of literature on agency theory and impact of
managerial decisions on firm’s decisions to participate in foreign market and to develop testable
hypothesis. As discussed in chapter 01, that the trade across boundaries has been made
significant development in explaining the firm’s exporting behavior and decisions of
participating in international market. There are certain some factors which plays very vital role to
determine these exporting decisions such as sunk cost, developing new market channels, new
product development according to the taste of foreign customers, and market research on
international markets and to deal with laws and procedures of host country (Greenaway and
Kneller, 2007). So to deal with above problems one can only say that only large and heavy
profits making firms can go to international market to get enough profits and to minimize start up
as well as sunk costs.
Yet on the other hand, it is also observed that the literature on firm’s exporting decisions
has widely ignored the other important factors like ownership structure of firm and components
of corporate governance and its characteristics, which are universal in each and feature of any
firm like financing and investing decisions of firms (Jensen and Meckling, 1976; Fama 1980;
Fama and Jensen, 1983; Shleifer and Vishny, 1997). Entering in international market is also one
of the financing and investing decision of the firm because it requires a large amount of funds in

13
account of sunk cost. On the other hand one can say that this type of investment is also known as
investment in intangible assets Melitz (2003). The sunk cost is another name of uncertainty and
risk (Dixit, 1989; Roberts and Tybout, 1997) which includes a probability of bankruptcy or
bankruptcy risk (Caggese and Cunat, 2013).
Sunk cost and bankruptcy risk reflects that there is a complexity as well as asymmetry of
information between mangers of firm and shareholders (Morck and Yeung, 1991), and also
between lenders and firms (Caggese and Cunat, 2013). So in the light of relationship between
investment decision and exporting decision, there are some arguments by researchers.
Researchers argued that there are a significant impact of managerial incentives and corporate
governance characteristics on the corporate investment, so this means that difference in
managerial incentives and in corporate governance can be observed or may be leads to the
difference in exporting behavior of firm. So it is very possible that those firms which have strong
and healthy corporate governance structures are able to participate in international trade or can
engage it in across the boundaries activities. On the other hand weak governance structure
prevents top managers from entering in international or foreign trade. Therefore, by investigating
how issues in governance and ownership structure of firm effects firm’s exporting decisions, new
dimension of corporate governance is added to the theory of international trade.
Only a very limited number of researchers documented the relation between corporate
governance and exporting decisions of firm. Examples of such studies are (Hobdari, Gregoric,
and Sinani, 2011) who examined the Estonian and Slovenian firms and found that those firms
exports more which are fully under control of managers, and those firms exports less which are

14
control by state. Along same lines another study by Filatotchev, Isachenkova, and Mickiewicz
(2007) analyzed that independence of managers and foreign shareholders has positive impact of
exporting decisions in Hungarian and Polish firms (Buck et al., 2000; Filatotchev et al., 2001).
Filatotchev, Stephan, and Jindra (2008) concluded in their study that independence of manager
as well as ownership of manager simply improves the intensity on firms especially in emerging
economies. Moreover, Calabro, Mussolino, and Hus ( 2009) and Calabro and Mussolino, (2013)
shows that in Norway there is an important impact of board characteristics on exporting
decisions of family owned business.
There are only a limited number of studies that focused on relationships between
exporting decision and corporate governance in the environment of China. (Lu, Xu, and Liu,
2009) researched on listed firms of china over period of 4 years from 2002 to 2005 and found
that Chief Executive officer’s share in possession and the percentage of outside members of
board has positive relationship with exporting decisions of firms while on the other hand
concentration of ownership has negative relationship. (Fu, Wu and Tang, 2010) researched on
Chinese non listed firms from the year 1999 to 2003 and found that those firms who are in joint
ventures with foreign firms or firms which are wholly owned by foreign investors have higher
exports as compared to domestic firms or those firms which are joint ventures with foreign firms
but with domestic control. (Yi, 2014) and (Yi and Wang, 2012) used data of 30,000 Chinese
firms of 3 years from 2001 to 2003 and found that foreign shareholders has positive relationship
with exporting behavior especially in the case of small and medium enterprises.
15
Sometime a situation arises when there is a lack of perfectly observation by shareholders
to the investment opportunities and managerial actions so this situation leads to incomplete
contract between choices of policies and managers. So to solve or overcome this problem the
only way is to motivate managers by giving incentives in form of equity (Jenson and Meckling,
1976). This type of ownership or incentive resolves or minimizes the moral hazards of managers
by aligning the interest of shareholders with the interest of managers. Later on Agarwal and
Mandelker (1987) said in their research that by giving equity to motivate managers to make
valuable investment strategies and also in order to get their interest aligned with the interest of
shareholders is the ultimate solution to reduce agency problem. On the similar line Denis and
Sarin, (1997) argued that there is a positive and significant relationship among managerial stock
ownership and decisions making for value maximization of shareholders wealth. Recently Coles,
Daniel and Naveen (2006) stated that those managers who had equity options with incentives
tend to make more risky investments in projects as well as in research and development as
compared to those managers who had no equity options.
Though these are USA based researches but their findings and results are possible to
apply to Pakistani case as well as Chinese. Lin, Ma and Su (2009) confirmed in their study that
firm’s efficiency and performance is positive associated with managerial ownership. It is also
confirmed by using data from the year 2007 to 2008 of 985 listed firms of China Liu, Uchida and
Yang (2012) that there is a positive and significant relationship among firm’s performance and
managerial ownership.

16
In literature, there are some counter arguments against positive and significant
relationship among managerial ownership and profitability of firm. One counter argument
(Amihud and Lev, 1981; May, 1995) is that managerial ownership is helpful in increasing the
value of shareholder’s wealth but to the certain level. When this certain level meets then
managers become risk averse and they get started by engaging themselves in risk sinking or less
riskier activities by implementing those financing and investing policy choices which leads to the
decrease in idiosyncratic risk of firm at the cost of stakeholder’s concern. John, Litov & Yeung,
(2008) also present a counter argument that the manager who had large ownership in equity and
stocks of firms may select conservative policies in context of investment. Even he /she can
ignore those risky projects which have high positive NPV (Net Present Value).
Moreover, La Porta Silanes and Shleifer (1999) argued that when ownership of managers
reaches at verge or at a threshold, then further increase will made manager entrenched, this may
cause to corruption and exploitation of interest of shareholder, instead of opting value increasing
projects. Another study based on USA listed firms data, Morch, Shleifer and Vishny(1988)
suggested a non-monotonic relationship between firm performance and manager’s shareholding
on the basis of empirical evidence. They used a linear model known as piecewise. According to
this direct model they establish that when ownership of managers touches 5% then advance
increase effects in greater performance of firm or firm value of firm (increase in Tobin’s Q),
however, when managerial ownership is between 6% to 25% then further increase effects
negatively on firm performance and value as managers become risk averse and finally there is a
very slightly increase in firm performance as well as firm value if insider ownership increases
from 25%. Reasons and logics given by Morck, Shleifer, and Vishny (1988) for above

17
mentioned relationship is managers are human beings and they have a normal intensity to
pamper their own priorities and preferences on the cost of shareholders. The result of this study
is consistent with Jensen and Mickling’s, (1976) hypothesis that if an increase in ownership at
lower levels of managerial shareholding then managers align their interests with the interests of
shareholders or investors and they really work hard to generate profits and to maximize firm
profitability as well as shareholders value. This study also suggests that increasing insider
ownership is not only gives rights to managers to claim in profit but on the other hand they also
raise their controls like voting rights and defending them from other punishing powers which
make them engrained.
Moving further in review of literature, there are some studies which investigated to which
extent the managerial shareholding effects Pakistani listed firm’s decisions to participate in
exports or in international trade. So in this study there is a expectation of alignment with other
studies that to a certain point or percentage of managerial shareholding is better for firm but after
that certain point or threshold further increase in managerial shareholding may have negative
relationship due to agency problems.
This study next examines the ownership types and there is a review of literature on
ownership structure of a firm. In particular this study will focus on the only two components of
ownership structure which is managerial ownership and other one is institutional ownership.
Institutional ownership in Pakistan is represented by ownership of local institutions such
as banks, mutual funds, insurance companies and government agencies. Too many studies

18
contributed in the literature of institutional ownership and suggested that institutional ownership
is beneficial for firm because they have large stake in the firm so they monitor manager’s
policies and course of actions in order to improve and enhance profitability or performance of
firm (Cornett et al., 2007). Institutional investors can also support managers to opt risky projects
which also include exporting decisions (George and Prabhu, 2000).
Due to larger stake of institutional investors their influence is also on firm’s strategies
through private and public engagement (Tihanyi et al., 2003). In general, the institutional
investors remain present for longer time period so their longer tenure leads to the adoption of
longer investment prospects. So this longer tenure lessons the conservative investments and leads
towards higher efficiency of investments. In particular case of listed firms in China, limited
number of studies shows that institutional ownership has positive and significant relationship
with performance of firm because institutional owners have diverse and different professional
backgrounds and on the other hand they are also the largest shareholders of the business (Sun
and Tong, 2003). Another study is done in China on 1200 listed firms by Yuan, Xiao and Zou,
(2008) which recorded a positive and significant impact of institutional ownership on firm’s
performance.
Institutional ownership in firm’s stock also increases the performance of the firm as well
as of the shares as small time investors follow institutions. Another reason is for institutional
ownership is that it enhances the governance and financial processes that attracts more investors.
As discussed by Javed and Iqbal (2007) better ownership means better firm performance as they
are long term investors and always concerned about the firms they have invested their stakes in.

19
Institutional owners bring either negative or positive changes in any strategic decision
making of the firm (Hoskisson, Hitt, Johnson & Grossman, 2002). Institutional ownership has a
strong impact on strategic decision making of the firm (Ozer, Alakent, & Ahsan, 2010). A study
done by Ullah, Fida and Khan (2012) further explains that all the firms having institutional
owners and foreign investor have higher dividend payout which leads company to acquire fewer
opportunities. Another study done by Afza and Mirza (2010) shows that dividend policy is
significantly influenced by ownership structure of the firm. However, this same study further
elaborates that institutional ownership prefer less dividend paying firm and also control agency
problem and minimizes the agency cost. Therefore, it is understandable that institutional
ownership affects both firm’s performance and its strategic decision making in different ways at
the same time. However, this study focuses on the effect of corporate governance and
institutional ownership on each other.
In this study the relation of exporting decision behavior of firm and institutional
ownership is analyzed. It is assumed that it is a two ways process, not just corporate governance
affects institutional ownership however; institutional ownership also has a strong impact on
corporate governance thus, there is possibility of endogeneity issue. According to Najjar (2009)
corporate governance and institutional investors share strong positive relationship. Ferreiraa and
Matos (2008) found that all the institutional investors preferred better governed firms as it has
ability to perform better. Study on corporate governance also shows that larger number of
owners offer better governance in the firm (Dharwadkar, Goranova, Brandes, & Khan, 2008).
However, institutional investors furthermore decrease the monitoring cost of the firm for all
20
investors and that lead towards better control of managers and implement good governance as
well (Gillan & Starks, 2003).
It is also derived that institutional ownership not just affect corporate governance policies
however, it also works like corporate governance and minimizes the agency cost of the firm
(Gul, Sajid, & Afzal, 2012). Moreover, Crutchleya, Jensena, Jahera, and Raymond (1997) also
shows the same finding that institutional ownership decreased the agency cost and enhances the
governance mechanisms of the firm. Institutional ownership enhances the corporate governance
as it pressurized the manager to perform effectively, responsibly and efficiently (Elyasiani & Jia,
2009). Moreover, institutional owners use their rights of ownership to inspire managers to work
in the interest of investors (Cornett, Saunders & Tehranian, 2007). Therefore, institutional
ownership share strong relation with corporate governance and also works in same domains.
Institutional owners always try to create close relations with its managers. Many past
researches have shown that institutional owner give incentive to the risk averse managers
(Aghion, Reene & Zingales, 2007). Institutional ownership further minimizes the misreporting,
as it enhances monitoring and control in the firm (Burns, Kedia & Lipson, 2010). Accordingly, a
study done by Chen, Dub, Li, and Ouyang (2012) also shows that institutional ownership also
increases the liquidity of the firm and also increases its returns. That also shows that institutional
ownership and corporate governance both enhances not just management but also the
performance of the company.
21
However, in Pakistan institutional ownership is just started to grow its roots. Most
recently, Afza and Mirza (2011) discussed that in Pakistan institutional investors are improving
the performance of companies which increases the firm value and investor’s confidence. In
Pakistan so far only majority shareholders have right to take legal actions against managers. If
the shareholder have less than 20% share than it has no power to apply in court for legal actions
(Ibrahim 2005). In Pakistan mostly market is dominant by family oriented businesses which
mean companies are not just controlled by shareholders but also governed by shareholder.
Therefore, it is really important to find out how institutional ownership effect corporate
governance in the emerging and unpredictable market like Pakistan. A study conducted by
Duggal and Miller 1999 shows that there is no significant relation exist in institutional ownership
and corporate control. Another study represents the negative relationship between institutional
ownership and financial reporting (Burns, Kedia & Lipson, 2006). Hence, it shows that there is
possibility of different results in different markets as ownership structure is different.
However, study done by Hasan and Butt (2009) shows that corporate governance and
ownership structure has a strong and significant implications on financial decision making. This
study elaborates that ownership structure has same impact on financial structure identical to
corporate governance. Though, the standards of corporate governance are not followed in true
manners in Pakistan. The study also shows that ownership structure plays an important role
company’s capital structure and financial policies.

22
However, the implication or the impact of ownership structure is not always plays
positive role or enhance the good financial policies in the firm and control agency problem. As
the study conducted by Stouraitis and Wu (2004) showed the findings that institutional
ownership is very sensitive as they have larger stakes in the firms. These investors are always
willing to create and maintain good relationship with manager. Therefore, they misuse their
voting rights and choose manager of their own choice. This type of behavior leads the firm
towards bad performance and agency problems.
Hence, the role of ownership structure plays very important part in any kind of firm
decisions and performance. Thus, there are also some aspects and important decisions that
affects institutional investors and corporate governance as well. Anyhow, to actually understand
the relationship between corporate governance and institutional ownership it’s very important to
choose some exogenous variables as well. These variables impact the model however, not
getting influenced by the model. Corporate governance and institutional ownership are treated as
an endogenous variable and both of these variables affect each other’s performance. All these
aspects show the importance of this study and its scope in future, which make this study very
interesting.
Therefore, to understand the impact of corporate governance on institutional ownership
and their relationship this study has been conducted. In this study to understand the role of
institutional ownership and its relation with corporate governance only four types of institutions
are analyzed which are insurance companies, banks, mutual funds and financial institutes as
Pakistan’s market is not that matured and mostly firms are family owned. In family owned
23
businesses mostly shares are controlled by family members and very little rights are given to the
outsiders that lead to violate the rights of shareholders and also increases the risk for the
investors. Thus, only few types of institutions are taking part.
In counter argument, some researchers gave empirical evidence that institutional owners
likes banks insurance companies and mutual funds are often hold partial or full ownership in
different level of firm which ultimately leads to or which may ignite agency problems that in
return it may be imply that lessor value maximizing and risky investment decisions. On similar
lines (Wei, Xie and Zhang, 2005) documented a negative relationship among firm performance
and institutional ownership which is dignified by Tobin’s Q. so from the above counter
arguments one cannot decide or predict the relationship or effect of institutional ownership
and/on exporting decisions of any firm.
Literature has also identifies some other type of ownerships and one of them is shares
held by foreign investors. Foreign investors may include individual or it may be institutional
investors. Literature justified that participation on foreign investor on board of domestics firm
can increase the probability of expanding firms activities across boundaries. There are five
mechanisms mainly which illuminate this valuation. First one firm’s have foreign investor on
their floor are more likely to implement worldwide accepted standards of business practices and
corporate governance, which can make easy for firm to enter in foreign markets (Jakson and
Strange, 2008). Second one is, those firms which are exporting they possess state of the art and
most advanced technology, skills and competences, brands names and distribution networks in
markets, which can simply provide a competitive advantage to others in foreign markets. Third

24
one is, as international or foreign investor has usually a well-managed portfolios and excellent
skills of monitoring so they are more likely to inspire firms to participate in risky projects and
ventures such as exporting to other countries (Filatotchev, Isachenkova and Mickiewicz, 2007).
On the fourth number, foreign shareholder are added some extra pressure on board of members
to employ well qualified and experienced chief executive managers who had some international
experience also. So this type of CEO may favor the firm in across the boundaries activities of
firm. Finally on the fifth number, multinational firms often goes to transition economies like
China and use it as a platform to serve their domestic or international market (Fu, Wu and Tang,
2010) and this research also recorded a positive relationship between ownership of foreign
shareholders and intensity of export sales. It also suggests that those firms which are fully or
partially owned by foreign investors have higher percentage of export intensity as compared to
other firms that are with domestic or local control. Similarly another researches (Yi, 2014; Yi
and Wang, 2012) uses a data of 30,000 Chinese listed firms form the period of 3 years from 2001
to 2003 and found that overseas ownership is positively linked with firm’s exporting decisions
especially in a case of small and medium enterprises.
There are some old-fashioned arguments (Fama, 1980; Fama and Jensen, 1983; Jensen,
1993) and recent development in economic theories of corporate governance and board of
directors (Raheja, 2005; Haris and Raviv, 2008) and some other number of studies claims that
BOD are very helpful in resolving management and governance issues that are inherent in firm.
In fact board of directors has ultimate power of firing and hiring, performance based evaluation
and compensation of top management of the firm controls their behavior of value maximizing.
Though it is anticipated that board of directors can reduce agency cost which is linked with the

25
partition of control and ownership and improving the firm performance and, subsequently wealth
of shareholder. In this regard in most of the countries, their corporate law obliges that firm
should be controlled by board of directors. Here one question is arises that how composition and
size of board are effective in reducing agency problem in order to improve firm performance.
On the other hand, size of the board plays a very vital role and this is a very important
mechanism among other mechanisms of corporate governance as it affects the ability of board to
guide and monitor. Monks and Minow (2004) also suggest in their research that larger numbers
of board members are further able to make more energy and time in order to preside and give
direction to management, monitoring by board improves the worth of managerial decision
making increases which indications to the excellent performance of firm and value of firm also.
A study conducted by Boonea, Field, Karpoff, and Raheja (2007) proves that board size
is positively related to the firm growth and performance. Institutional owner always prefer a
well-organized board as board is their eyes in the organization. Investor control organization
with the help of board. Therefore, institutional investors always concerned about board size as it
works as a bridge and also takes care of their interests.
For that reason, it is really important to make a good and efficient board. More members
does not mean it will perform better, large group can increase agency problem as there are more
members means more diverse opinion (Yasser, Entebang & Mansor, 2011). However, it depends
on information and the role of duties and if the monitoring of information demands more

26
members on board in larger firms than larger board size is preferably more important (Sanders,
and Carpenter, 1998).
As Adams and Mehran (2003) claims on the basis of empirical evidence that the larger
the board the better board monitoring will be as well as there will be a greater board advice and
expertise. Coles, Daniel & Naveen, (2008) argued that those firms which are complex on the
basis of their size of firm and firm’s business might get some benefit by placing larger number of
members in boards, so this means that the larger or more complex the firm then it will need
better board expertise as well as board advise. They supported their argument on the basis of
empirical evidence that in case of big firms and complex firms and large firms then the value of
Tobin’s Q increases when number of members of board increases. But on the other hand this
argument counters in case of small and medium sized enterprises because it is negatively linked
with small sized firms. Similarly on the same line Lipton & Lorsch (1992) and Jensen (1993)
argues that the larger members of boards are not very effective in formulation and
implementation of strategies and in decision making in cases of small sized enterprises and
medium sized enterprises.
The logic behind above mentioned argument is if the size of board is larger or there are
too many members in it then it will become hard for all members to agree on single point
because each and every human being has his own perspective of thoughts so they cannot agree
on a single point or on a one decision. Previous studies suggested that the larger number of
members in board can leads to the reduction in motivational level of every individual which will
badly effect the commitment and effectiveness of members in decision making. Later on (Dalton

27
et al., 1999). Yermack (1996) and Eisenberg, Sundgren & Wells (1998) supported above
argument through empirical evidence that smaller boards enhances the performance as well as
value of the firm.
However, these researches vary in different market as Harris and Raviv (2006) analyzed
that there is no relation exist between board size and profit. Mak and Kusnadi (2004) also
identify that board size and firm value has inverse relation. Smaller board size also means all the
information related to firm is shared between smaller numbers of people which means control of
information and smaller group can also leads to nonprofessional relations (Kaymak & Bektas,
2008). For instance, Azrbaijani and San, (2012) found evidence in Malaysian economy that
larger number of directors on board puts more pressure on managers to increase firm’s
performance.
Therefore, board size has different impact in different market. Pakistan on the other hand
is an emerging economy with family owned businesses. These aspects add new and interesting
points into the study and its finding. However, study done by Garg (2007) in India shows that
board size has an opposite relation with firm as bad performance increase the size of the board
and bigger board leads towards more bad performances and in India efficient board size is 6.
As far as Pakistani context is concerned the last set of argument may likely to apply.
Similar to this set of arguments, Li et al. (2007) and He & Conyon (2012), researched on Chinese
listed firms and claims on the basis of empirical evidence that larger members of boards are not
very effective and they are insignificant in some cases specifically such actions like assessing

28
CEO enactment and determining his compensation plan. Huyghebaert and Wang (2012) claims
that larger boards are risker because in larger boards only powerful directors dominate. They also
claims that although board size does matter but on the other hand it doesn’t affect similar
transactions but on the other hand it is also connected with terminations of labor in case of listed
firms of China. They also stated in their research that large members of boards might gave extra
benefit to the expropriation of small number of investors and stakeholders. If this happens then it
will increase the agency problems which are linked with big boards for an example entrenchment
of managers, free riding and tunneling of directors. So these factors has a negative impact on
export intensity of Chinese firms.
Because of the independence of board of directors and their fear to keep their status in the
outside market, non-executive or independent directors will magnificently screen the actions and
strategies of the executive and dependent directors and top managers in order to confirm that
they are implementing such strategies which are well-suited for the welfares of investors and
shareholders and also complement the top management’s knowledge (Fama, 1980; Fama and
Jensen, 1983; Cadbury, 1992). Researchers also claimed that the non-executive or independent
directors may play an important role because of prior knowledge, education, past experience and
social networks with others. They can also assist managers in making strategic decisions (Zahra,
2003).
Board structure is a structure of board of directors elected or appointed to supervise the
activities of an organization. Corporate board structure and its impact on firm performance is one
the most important and discussed part of corporate governance however, board structure is

29
different for different size of firms (Lincka, Nettera, & Yang, 2007). Therefore, Board structure
defines the culture of an organization. As Abdelsalam El-Masry & Elsegini (2008) discussed that
a significant role played by a corporate board is sustaining and disciplining the organization’s
management.
However, it is really important to have an independent board to practice true corporate
governance (Mcgee, 2008). Independent board structure is not only efficient for governance but
it can also increase quality, protection to minority shareholders as well as institutional
shareholders and stock performance of an organization (Chung & kim, 2008). As McKnight and
Weir (2008) discussed that the board lacking independent directors means its lacking expert
decision making and unbiased knowledge.
For that reason, even the emerging economies like Pakistan has set the criteria that
organization must comprises 25% of non-executive board members and also appreciate the
representative for minority shareholders. Moreover, outsider board directors also enhance
spending on R&D and positively participate in firm’s performance (Baysinger, Kosnik and Turk,
1991). Mak & Li (2001) explained that ownership and board composition are dependent on each
other as better ownership leads toward better board structure.
As board of directors directly participates in financial data, processing of information,
structuring the organization and most importantly maintains the relation of the firm with
ownership (Rezaeia, Delghandy & Miri, 2012). Therefore, institutional investors prefer
independent board as it affects firm’s performance and efficiently supervises the problems

30
related to firm’s strategy. Institutional investors favor independent board since they are able to
provide independent judgment when dealing with the matters.
As discussed by Li, (1994) that ownership structure has a significant effect on board that
may leads towards negative consequences of institutional ownership as owners can become
biased and make a board that is influenced by them therefore, it also creates and enhance agency
problems in the firm (Pound, 1988).
Board structure is not only varying market to market however; it also changes with the
firm size and environment. Linck, Netter, and Yang (2007), found that firms with more
opportunity and high stock returns always prefer smaller board however, larger firms prefer
larger and more independent board.
In Pakistan board structure mostly includes family members. Board independence is not
appreciated as it creates hindrance in decision making and strategic policies. To fulfill the SECP
recommendations fake or known and influenced people are announced to be the part of the
boards. Therefore, this study will lead towards new and out of the ordinary findings.
Firm size is use for control variable in regression because, as documented in earlier
studies, smaller firms have more information asymmetries than larger firms. The reason for more
information asymmetries is that, in small firms it is easier for single manager to know a
significant portion of information (Jeng et al., 2003). In existing literature different proxies are
used to measure the firm size. Rajan et al. (1995) used sales as proxy for size while Ataullah et
31
al. (2014) used the total assets and in Fidrmuc et al. (2006) study firm size is appeared as the
market capitalization of firm in some specification as well as natural log of number of employees
in others specifications. Some studies also used the total sales as measure of firm size.
Current study is measuring firm size as natural logarithm of market capitalization of each
firm. There are following reasons to use market capitalization as measure of firm size. First one
is that it is believed that total assets are booked on cost and the value of two firms incorporated
in different years in stock market may have different value of assets due to time value of money.
Suppose assets purchased by one company in 1980 and another company purchased in 2008,
both will have different cost due to time value of money so comparing these two companies on
assets cost will not be a good proxy for firm size.
Secondly, sales are in the control of management and they may manipulate these sales as
they want, so it should not be a proxy of firm size. Furthermore, growing companies have more
sales than matured companies. However, the market capitalization is the result of market forces
(i.e. demand and supply forces) and through the interaction of buyer and sellers hence this
process is out of the control of management. So it could be argued that market capitalization is
better measure of firm size relative to other proxies.
Firm leverage is also use for control variable because high leveraged firms are considered
to be monitored by debt holders that reduce the information asymmetries (Harris et al., 1991).
Pachori and Totala (2012) have documented that leverage is measures the financial risk taken by

32
the firm because if high level of financial leverage allows shareholders to get higher return on
equity but on the other hand it also leads to the risk of bankruptcy. In existing literature different
proxies are used to measure the firms’ leverage. Titman and Wessels (1988) used book value of
debt divided by book value of debt plus market value of equity measure of financial leverage.
However, Rajan et al. (1995) used a different approach to measure the financial leverage
of the firms. They used book value of debt divided by book value of debt plus book value of
equity. This study used a ratio of interest behavior debt over total market value of equity as
measure of firms’ control because in Pakistan the source of debt is usually commercial banks
rather bond market. The reason is that in Pakistan bond market is not established as in developed
countries.

33
2.2 Hypothesis Development
The research proposed following hypotheses which explain the relation between corporate
governance and firm’s exporting decision.
H1: There is a significant relationship between managerial ownership and firm’s
exporting decision.
H2: There is a negative relationship between institutional ownership and firm’s
exporting intensity.
H3: There is a negative relationship between the size of the board and firm’s
exporting intensity.
H4: There is no any relationship between the proportion of outside directors in the
board and firm’s exporting intensity
2.3 Theoretical Framework
This section demonstrates the overall awareness about the influence of ownership
structure, corporate governance and firm’s exporting decisions. Hypothetical frame work of this
study comprises of two main variables namely dependent variable and independent variable
respectively. In this research export intensity is taken as dependent variable while on the other
hand independent variables are institutional ownership, managerial ownership, board size and

34
board independence. Some control variables are also included in this research like firm size,
growth rate and leverage ratio.
In order to understand graphically, the theoretical frame work of above mentioned
dependent and independent variables are shown in diagram and also in form of equation.
Research Model
Figure 2.1
This figure shows that ownership structure and corporate governance are independent variables
and firms export intensity is dependent variables
Firm’s Exporting Decision
-Export Intensity
Corporate Governance:
-Board Size
-Board Independence
-Managerial Ownership
-Institutional Ownership
Control Variables:
-Firm Size
-Leverage
-Growth

35
Chapter 03
DATA DESCRIPTION AND METHODOLOGY
This section of study represents research methodology that is used to conduct the study
and the source of data. For the determination of empirical analysis, this study uses a descriptive
analysis, correlation and regression models. A descriptive analysis of data is performed to get
sample characteristics. The panel data regression analysis is conducted on dependent variable,
export intensity (EI) to check the association among the variables of ownership structure such as
managerial ownership (MO), institutional ownership (INO) and corporate governance such as
board size (BS) and board independence (BI).
3.1 Sample and Data Source
The current study aims to explore exporting decision of firm in the presence of both
ownership structure and corporate governance for non-financial companies listed at Pakistan
Stock Exchange. 100 companies were selected from 7 different industrial groups through
stratified sampling technique. Each strata represents different industry like textile, food and
Engineering etc. Companies were selected through non probability sampling technique from
each strata on the basis of market capitalization. For-example 34 companies were selected from
Textile industry as textile industry contributes more than around 50% of total exports. So from
each industry each company is selected on the basis of market capitalization. The sample period
is of 10 years from 2005 to 2014. Sample period starts from 2005 because corporate governance
36
mechanism is implemented in Pakistan after the reporting and highlighting of corporate scandals
such as Tyco, Enron and World.com in 2000. According to corporate governance mechanism
disclosure is mandatory for public limited companies.
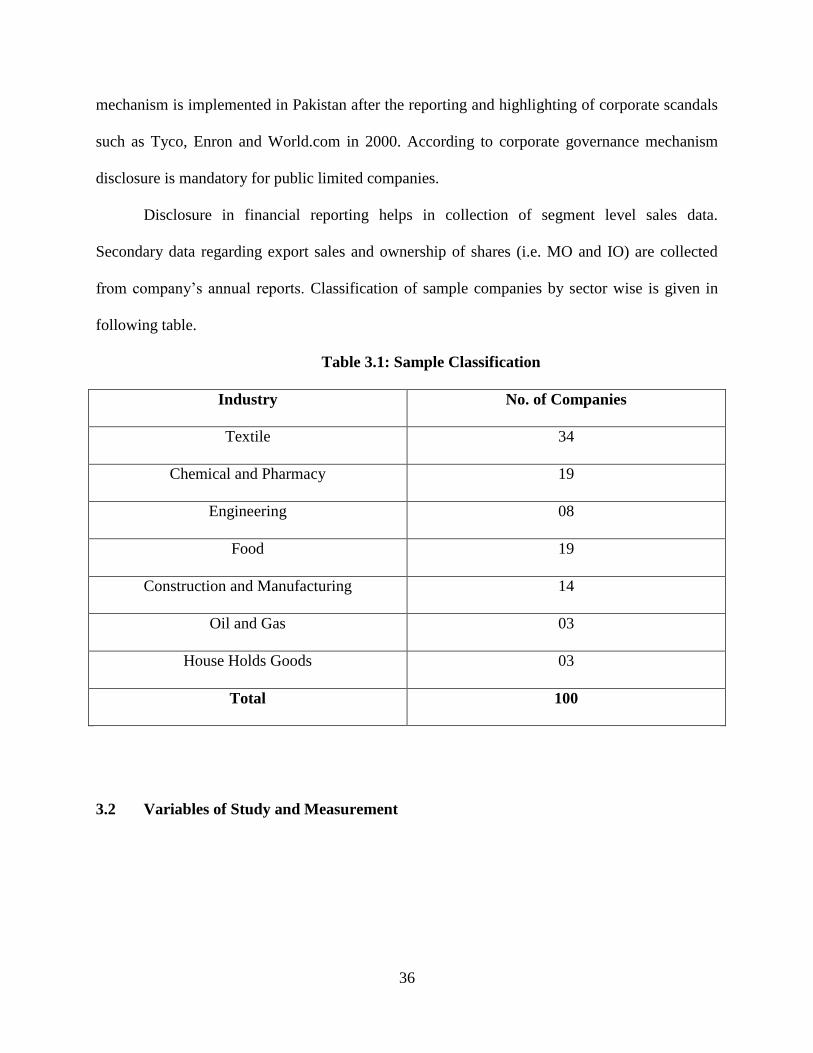
Disclosure in financial reporting helps in collection of segment level sales data.
Secondary data regarding export sales and ownership of shares (i.e. MO and IO) are collected
from company’s annual reports. Classification of sample companies by sector wise is given in
following table.
Table 3.1: Sample Classification
Industry No. of Companies
Textile 34
Chemical and Pharmacy 19
Engineering 08
Food 19
Construction and Manufacturing 14
Oil and Gas 03
House Holds Goods 03
Total 100
3.2 Variables of Study and Measurement

37
The purpose of conducting this research is to examine the effect of corporate governance
and ownership structure on firm exporting decision. The result of data would check whether CG
and OS specific variables are effecting positively or negatively on exporting decision of firm.
3.2.1 Dependent Variable
3.2.1.1 Export Intensity
Export intensity is taken as dependent variable. In case of exporting firm the intensity is
value is ratio of exports sales to total sales (Dixon, Guariglia Vijayakumaran, 2015). On the other
hand in the case non exporting firm the value of intensity will be zero.
3.2.2 Independent Variables
3.2.2.1 Managerial Ownership
The managerial ownership is measured in terms of the proportion of outstanding shares
possessed by management in the firm. Managerial ownership is basically the shareholders of

38
company in which they have interest or shares. Lappalainen and Niskanen (2013) considered that
key elements of growth are board structure and ownership structure.
Dixon, Guariglia Vijayakumaran (2015) argued that managerial ownership is positive and
significant associated with export intensity but up to some certain level of percentage.
3.2.2.2 Institutional Ownership
Institutional ownership ratio in this study is measured as the number of shares held by
institutional investors to the total number of shares outstanding. McConnell & Servaes (1990)
gave empirical evidence that institutional ownership has negative relationship between export
intensity of firm.
3.2.2.4 Board Size
Number of members in the board is used to measured board size. MAK and Kusnadi
(2005) discussed that there is direct association between board size and performance of the firm.
Yermack (1996), examined Finland companies and Liang and Li (1999), examined Chinese
companies, both conclude that board size is negatively related with exports of firm.

39
3.2.2.5 Board Independence
In Pakistan recent reforms of SECP recommends board with non-executive directors and
according to Pakistan’s standards of corporate governance 25% of board should comprises of
independent manager. So in this study board independence is taken as proportion of independent
board members as past. There is no any relationship between board independence and export
intensity in Chinese context Dixon, Guariglia Vijayakumaran (2015).
3.2.3 Control Variables
It is important to control the variables other than focus variables that may influence the
insider trading to overcome omitted variable bias (Davidson et al., 2004). Following are the
control variables in this study because existing literature has been documented that these
variables have influence on exporting decision of firm.
3.2.3.1 Leverage
Leverage is calculated by dividing long term debt to shareholders’ equity. Different
proxies are used in different studies to calculate leverage. Like total debt is also used in place of
long term debt. Total capitalization which account for long term debt and shareholders’ equity is
also used in the denominator. But in this study long term debt and shareholders’ equity are used
as proxy of leverage and these are also taken at book value.
40
3.2.3.2 Growth
Growth rate can be measured through assets, sales and number of employees but in this
study growth rate is measured by taking the difference between current sales and previous year
sales of the firm Dixon, Guariglia Vijayakumaran (2015). Previous literature shows positive
relationship with exports and proved that those firms who had higher growth ratio have a higher
probability to export in foreign markets and have a higher ratio of export intensity as it rises with
growth.
3.2.3.3 Firm Size
Firm size is one of the most frequently used variables in different studies whether used as
dependent or independent variable or the control variable. It may be calculated in other ways as
well but in this study firm size has been calculated by taking the natural log of total sales as used
by Burke et al. (1986) and Jiraporn et al. (2014)

41
3.3 Model Specification
Econometrically, regression equation for panel data regression models is expressed as follows:
………………………………………………… (A)
Where,
= Export intensity.
= Managerial ownership.
= Institutional Ownership.
= Board Size.
= Board Independence.
= Firm size.
= Firm leverage
= Growth.
= Coefficient or Marginal Effect
= Error Term

42
Table 3.2: Variable’s Description
Variable Description Measurement
EXP_INT Export Intensity Ratio of export sales to total
sales.
MO Managerial Ownership Percentage of shares owned by
managers.
IO Institutional Ownership Shares held by other
institutions.
BS Board Size Total number of directors on
the board of directors.
BI Board Independence Proportion of independent
board members.
FS Firm Size Logarithm of total sales.
LEV Leverage Ratio of total debt to total
shareholder’s equity.
GRW Growth Difference of sales from
previous year.
43
3.4 Panel Data Regression
The situation often arises in financial modeling where we have data comprising both time
series and cross-sectional elements, and such a dataset is called as a panel or longitudinal data.
The simplest way to deal with such data is to estimate a regression, which would involve
estimating a single equation on all the data together, so that the dataset for y is loaded up into a
single column containing all the cross-sectional and time-series observations, and similarly all of
the observations on each explanatory variable would be loaded up into single columns in the x
matrix. Then this equation would be estimated in the usual fashion using OLS.
3.4.1 Common Effect Model
The main assumption of this model is that there is no distinction among the intercept of
all cross sections which means Beta is same for all cross sections. Let assume that if the data is
homogenous then intercept will be same for all cross sections, so common effect will be the best
model for the analysis. The model of common effect can be written as
………….. (Eq A)
44
3.4.2. Fixed Effect Model
The assumption behind this model is intercept will be not same for each and every cross
section but will be different. A separate dummy is included in this method to show the extent of
dissimilarity between the intercepts of each cross section unit. It is also called least square
dummy variable. For example, if there is a diversity in data, intercept will different for each unit,
hence the best model for panel data estimation would be fixed effect model. The hypothesis of
the same intercept would be rejected when the standard F-statistics is significant and hence fixed
effect model will be applied, otherwise common effect model will be used for the estimation.
The model of fixed effect can be written as
………….. (Eq B)
3.4.3. Random Effect Model
This model is same as fixed effect model, it is used when intercept is different for all
cross sections as well as time period, but here in this model we want to check whether intercept
follow a systematic pattern or not. It assumes that Beta is not meaningful here because it follows
a random path. The model of the fixed effect can be written as
………….. (Eq c)
45
To chooses between fixed and random effect model we can use Hausman test to decide the most
appropriate model among both of them. If the Hausman test is significant then fixed effect model
will be used otherwise, random effect model will be used for estimation.
3.5 Pooled Dummy Variables
Pooled data incorporates the data for different cross sections over the time. Technically, it
includes both the cross sectional and time series data. Panel data assumes that all the variables
included in the panel contains common parameters. Simply it could be taken into the way that
panel data is the pooling which provides average of the individual parameters.
Panel data comes up with certain advantages which time series data do not adequately
address. An explanation of the aforementioned issue is the adequacy of number of observations
which may be less in time series data, hence creating difficulty in obtaining significant t-ratio of
F-statistics. Pooling of different cross sections over the time may provide large number of
observations. Panel data estimations can be made by different methods based on the nature of
data. Simple panel data estimation assumes that all the data set in the panel is homogenous
means that constant and coefficient is common across the unit. It could be shown b equation
shown below:
………….. (Eq D)
Where all the variables in the data set contains same constant and coefficients over the
time. Results of the common coefficient model as reported in the chapter of results were
significant stating that assuming common intercept across companies exporting decision is

46
explained by the level of corporate governance in Pakistan. However data may vary in terms of
different cross sectional units means that there could be difference in coefficients of different
cross sectional units which may provide biased results. This problem could be addressed by
estimating fixed effect model which assumes different cross sectional units by creating dummies
of each data set.
3.4.6 Sector Analysis
In this study different sector has been analyzed to check the export intensity of each
sector. Different dummies for each sector have been used to find out the effect of CG on export
intensity of each sector. For seven different sectors seven different estimations has been used in
the study in next chapter.

47
Chapter 04
EMPIRICAL RESULTS AND DISCUSSION
This specific chapter exhibits the empirical analysis and exploration carried out with in
the data which is shown and displayed in previous chapter. The particular analysis and
exploration is based on research methodology revealed in chapter 03 also. To evaluate the impact
of corporate governance and ownership structure on the exporting decision, a sample was taken
out from companies which are listed at Pakistan Stock Exchange. The first two sections elaborate
the descriptive statistics and the correlation matrix. The third section introduces and discusses the
econometric models and also explains how the models specified are predictable and evaluated.
The fourth and last section presents an interpretation of the experimental results.
4.1 Empirical Results
4.1.1 Descriptive Results
The descriptive statistics presents overview of data that include mean, medium, mode,
maximum, minimum, standard deviation, skewness and Kurtosis etc. Mean value provides
average of data while mode shows most repeated value and medium shows middle value of raw
data. Standard deviation provides spread and dispersion of data from the mean. Standard
deviation and mean is meaning less if used separately. Skewness tells about the positive or
negative spread of data while Kurtosis is about the flatness of data spread. In case of Kurtosis, if

48
the value is equal to 3 then normal distribution and pattern is called mesokurtic. If the value is >
3 then pattern is called leptokurtic that are associated with simultaneously peaked and fat tail.
But when value of kurtosis is less than 3 it is called platykurtic and is associated with
simultaneously less peaked and have thinner tail.

49
Table 4.1: Descriptive Statistics
EXPT_INT BI BSIZE MO INST F_SIZE LEV GRO
Mean 0.219 0.299 8.208 0.186 0.167 10.012 0.184 0.091
Median 0.175 0.286 8.000 0.189 0.171 8.307 0.123 0.067
Maximum 0.585 0.500 13.000 0.333 0.353 25.034 1.896 0.351
Minimum 0.000 0.125 4.000 0.004 0.014 5.116 0.006 -0.167
Std. Dev. 0.191 0.067 1.975 0.090 0.073 5.049 0.210 0.134
Skewness 0.435 0.285 0.416 -0.136 -0.110 1.765 3.076 0.390
Kurtosis 1.722 3.854 3.010 1.772 2.244 4.636 16.079 2.713
Jarque-Bera 89.617 39.564 25.937 59.352 23.241 567.438 7833.482 25.879
Probability 0.000 0.000 0.000 0.000 0.000 0.000 0.000 0.000
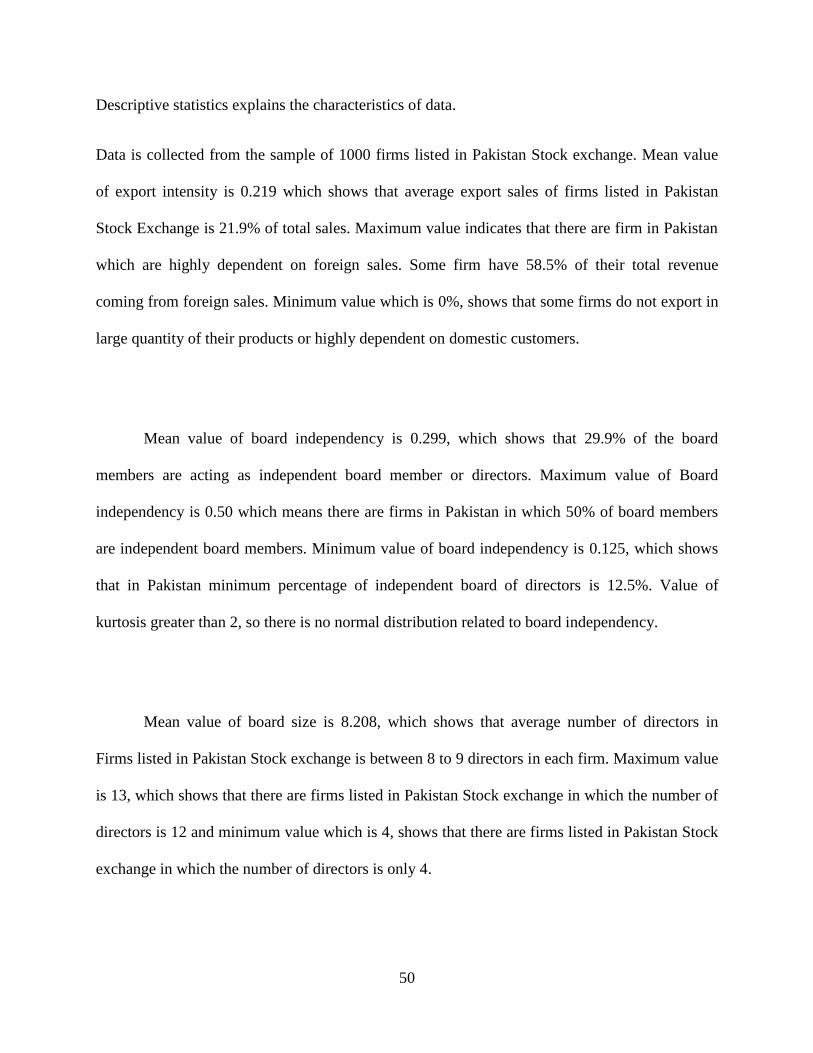
50
Descriptive statistics explains the characteristics of data.
Data is collected from the sample of 1000 firms listed in Pakistan Stock exchange. Mean value
of export intensity is 0.219 which shows that average export sales of firms listed in Pakistan
Stock Exchange is 21.9% of total sales. Maximum value indicates that there are firm in Pakistan
which are highly dependent on foreign sales. Some firm have 58.5% of their total revenue
coming from foreign sales. Minimum value which is 0%, shows that some firms do not export in
large quantity of their products or highly dependent on domestic customers.
Mean value of board independency is 0.299, which shows that 29.9% of the board
members are acting as independent board member or directors. Maximum value of Board
independency is 0.50 which means there are firms in Pakistan in which 50% of board members
are independent board members. Minimum value of board independency is 0.125, which shows
that in Pakistan minimum percentage of independent board of directors is 12.5%. Value of
kurtosis greater than 2, so there is no normal distribution related to board independency.
Mean value of board size is 8.208, which shows that average number of directors in
Firms listed in Pakistan Stock exchange is between 8 to 9 directors in each firm. Maximum value
is 13, which shows that there are firms listed in Pakistan Stock exchange in which the number of
directors is 12 and minimum value which is 4, shows that there are firms listed in Pakistan Stock
exchange in which the number of directors is only 4.
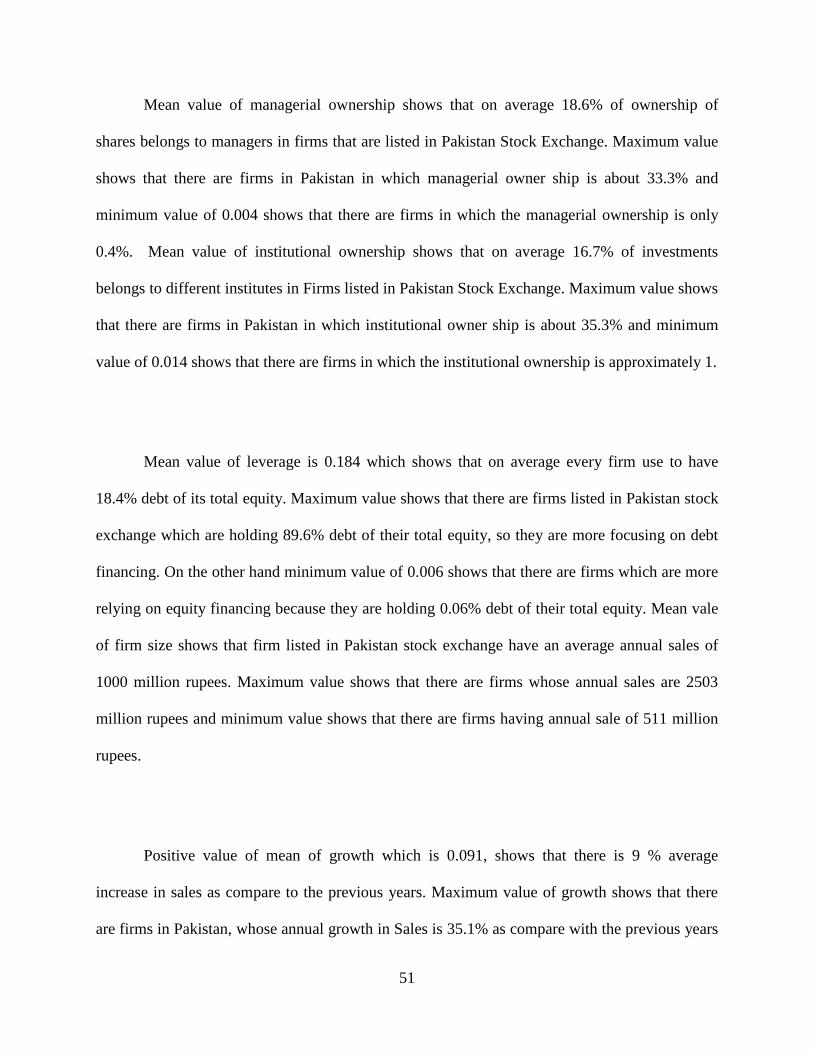
51
Mean value of managerial ownership shows that on average 18.6% of ownership of
shares belongs to managers in firms that are listed in Pakistan Stock Exchange. Maximum value
shows that there are firms in Pakistan in which managerial owner ship is about 33.3% and
minimum value of 0.004 shows that there are firms in which the managerial ownership is only
0.4%. Mean value of institutional ownership shows that on average 16.7% of investments
belongs to different institutes in Firms listed in Pakistan Stock Exchange. Maximum value shows
that there are firms in Pakistan in which institutional owner ship is about 35.3% and minimum
value of 0.014 shows that there are firms in which the institutional ownership is approximately 1.
Mean value of leverage is 0.184 which shows that on average every firm use to have
18.4% debt of its total equity. Maximum value shows that there are firms listed in Pakistan stock
exchange which are holding 89.6% debt of their total equity, so they are more focusing on debt
financing. On the other hand minimum value of 0.006 shows that there are firms which are more
relying on equity financing because they are holding 0.06% debt of their total equity. Mean vale
of firm size shows that firm listed in Pakistan stock exchange have an average annual sales of
1000 million rupees. Maximum value shows that there are firms whose annual sales are 2503
million rupees and minimum value shows that there are firms having annual sale of 511 million
rupees.
Positive value of mean of growth which is 0.091, shows that there is 9 % average
increase in sales as compare to the previous years. Maximum value of growth shows that there
are firms in Pakistan, whose annual growth in Sales is 35.1% as compare with the previous years

52
and negative value of -0.167 which shows that instead of growth there are some firms showing
decrease in sales as compare to the previous years.
4.2 Multicollinearity Checks
Correlation indicates the strength of relationship between two variables. All variables have
significant correlation relationship with export intensity except Board size and export intensity
has insignificant relation with board size as the value of correlation is greater than 2. Export
intensity has positive relationship with board independence. This means that if there is positive
change in export intensity, on the same time there will be positive change in board independence
too. Board size, managerial ownership, institutional ownership, firm size, leverage and growth
has negative correlation with export intensity as there is a negative sign, which means that
positive change in export intensity will bring negative change in all these other variables.
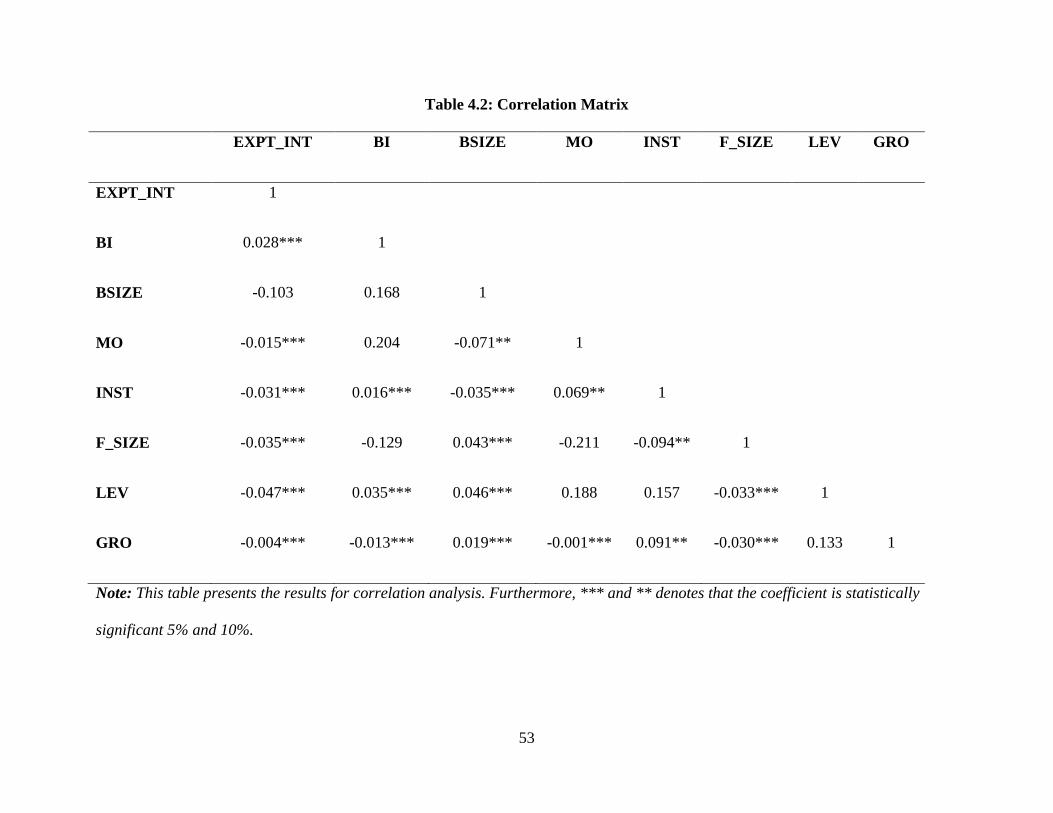
53
Table 4.2: Correlation Matrix
EXPT_INT BI BSIZE MO INST F_SIZE LEV GRO
EXPT_INT 1
BI 0.028*** 1
BSIZE -0.103 0.168 1
MO -0.015*** 0.204 -0.071** 1
INST -0.031*** 0.016*** -0.035*** 0.069** 1
F_SIZE -0.035*** -0.129 0.043*** -0.211 -0.094** 1
LEV -0.047*** 0.035*** 0.046*** 0.188 0.157 -0.033*** 1
GRO -0.004*** -0.013*** 0.019*** -0.001*** 0.091** -0.030*** 0.133 1
Note: This table presents the results for correlation analysis. Furthermore, *** and ** denotes that the coefficient is statistically
significant 5% and 10%.

54
Table 4.3: Variance Inflation Factors
Coefficient Uncentered Centered
Variable Variance VIF VIF
C 0.002267 43.87899 NA
BI 0.012572 22.83115 1.091759
BS 1.39E-05 19.19634 1.049397
MO 0.007199 5.931862 1.134362
INST 0.001784 1.752978 1.040729
FS 2.16E-06 5.242855 1.065549
LEV 0.001895 1.38268 1.080790
GROWTH 0.002267 43.87899 1.025417
For further confirmation, variance inflation factors (VIFs) are computed as VIF q = 1 / (1 - q),
where q is the correlation coefficient obtained from regressing explanatory variable, q, on all the
remaining explanatory variables in the model. VIF’s results are essentially free from any serious
multicollinearity among the explanatory variables. The variance inflation factors reported in
above table, ranging from 1.008623 to 5.412356, are evidence that there is no significant
multicollinearity among these explanatory variables.

55
4.3. Regression Analysis
Selection of model for export intensity as dependent variable
Model selection is based on two criterions; likelihood ratio and Hausman test in this study.
4.3.1. Common Effect Model
Table 4.4: Common Effect Model
Dependent Variable: EXP_INT
Variable Coefficient Std. Error t-Statistic Prob.
C 0.132 0.043 3.060 0.002
BI 0.117 0.094 1.242 0.215
BSIZE -0.007 0.003 -2.356 0.019
MO 0.020 0.072 0.273 0.785
INST 0.786 0.085 9.262 0.000
FIRM_SIZE -0.001 0.001 -0.952 0.341
LEVERAGE -0.057 0.030 -1.913 0.056
GROWTH -0.005 0.046 -0.112 0.911
R-squared 0.106 Mean dependent var 0.219
Adj R-squared 0.099 S.D. dependent var 0.191

56
S.E. of regression 0.181 Akaike info criterion -0.570
Sum squared resid 29.272 Schwarz criterion -0.527
Log likelihood 264.548 Hannan-Quinn criter. -0.554
F-statistic 15.051 Durbin-Watson stat 0.379
Prob(F-statistic) 0.000
Note: This table depicts the results for linear panel data model using both the firm and year fixed effects.
The dependent variable is the export intensity ratio and the independent variables are firm specific
attributes. Furthermore, ***, **, * denotes that the coefficient is statistically significant at 1%, 5% and
10%, respectively.
Above table reports the results for firm’s exporting decision and firm specific attributes by using
panel regression analysis. A linear panel data model with the firm common-effects to estimate
the results is used. The coefficient of the explanatory board independence is positive and
significant while board size is negative and significantly different from zero. The value of
adjusted R² = 0.099 shows that about 9 % of variation in firm’s exporting decision is caused by
stated explanatory variables collectively. In other words, firm’s exporting decision is 9 %
explained by stated explanatory variables collectively.
4.3.2. Likelihood Ratio Test
Here,
Null hypothesis: Common effect is more appropriate
Alternate hypothesis: Fixed effect is more appropriate

57
Table 4.5: Likelihood Test
Effects Test
Statistic d.f. Prob.
Cross-section F
48 -99793 0.000
Cross-section Chi-square 1772 99 0.000
Results in table 4.6 show the significant cross-section Chi-square with p-value of 0.0000 and
hence the fixed effect model is more appropriate.
4.3.3. Random Effect
Table 4.6: Random Effect Model
Dependent Variable: EXP_INT
Variable Coefficient Std. Error t-Statistic Prob.
C 0.179 0.045 3.991 0.000
BI 0.161 0.060 2.689 0.007
BSIZE 0.000 0.003 0.008 0.993
MO 0.013 0.046 0.291 0.771
INST 0.040 0.059 0.675 0.500
F_SIZE -0.002 0.003 -0.600 0.549
LEV 0.004 0.016 0.277 0.782
GRO -0.025 0.019 -1.325 0.185
R-squared 0.012 Mean dependent var
0.031
Adj R-squared 0.004 S.D. dependent var
0.072
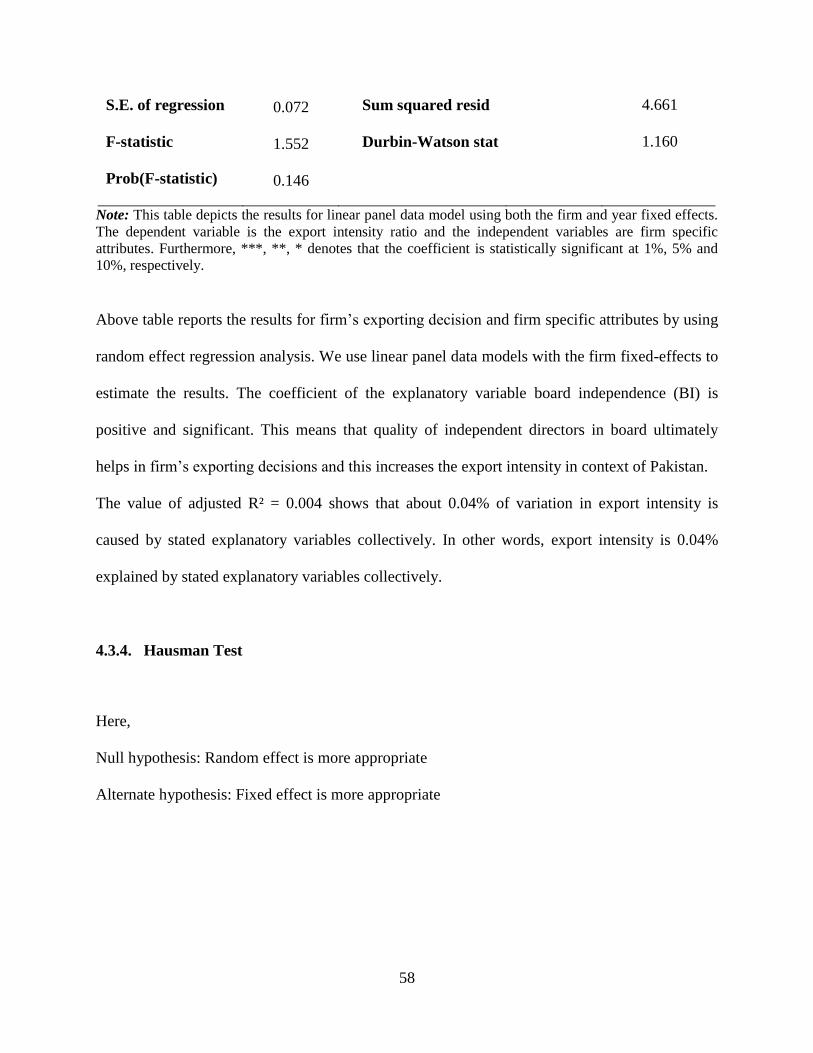
58
S.E. of regression 0.072 Sum squared resid
4.661
F-statistic 1.552 Durbin-Watson stat
1.160
Prob(F-statistic) 0.146
Note: This table depicts the results for linear panel data model using both the firm and year fixed effects.
The dependent variable is the export intensity ratio and the independent variables are firm specific
attributes. Furthermore, ***, **, * denotes that the coefficient is statistically significant at 1%, 5% and
10%, respectively.
Above table reports the results for firm’s exporting decision and firm specific attributes by using
random effect regression analysis. We use linear panel data models with the firm fixed-effects to
estimate the results. The coefficient of the explanatory variable board independence (BI) is
positive and significant. This means that quality of independent directors in board ultimately
helps in firm’s exporting decisions and this increases the export intensity in context of Pakistan.
The value of adjusted R² = 0.004 shows that about 0.04% of variation in export intensity is
caused by stated explanatory variables collectively. In other words, export intensity is 0.04%
explained by stated explanatory variables collectively.
4.3.4. Hausman Test
Here,
Null hypothesis: Random effect is more appropriate
Alternate hypothesis: Fixed effect is more appropriate
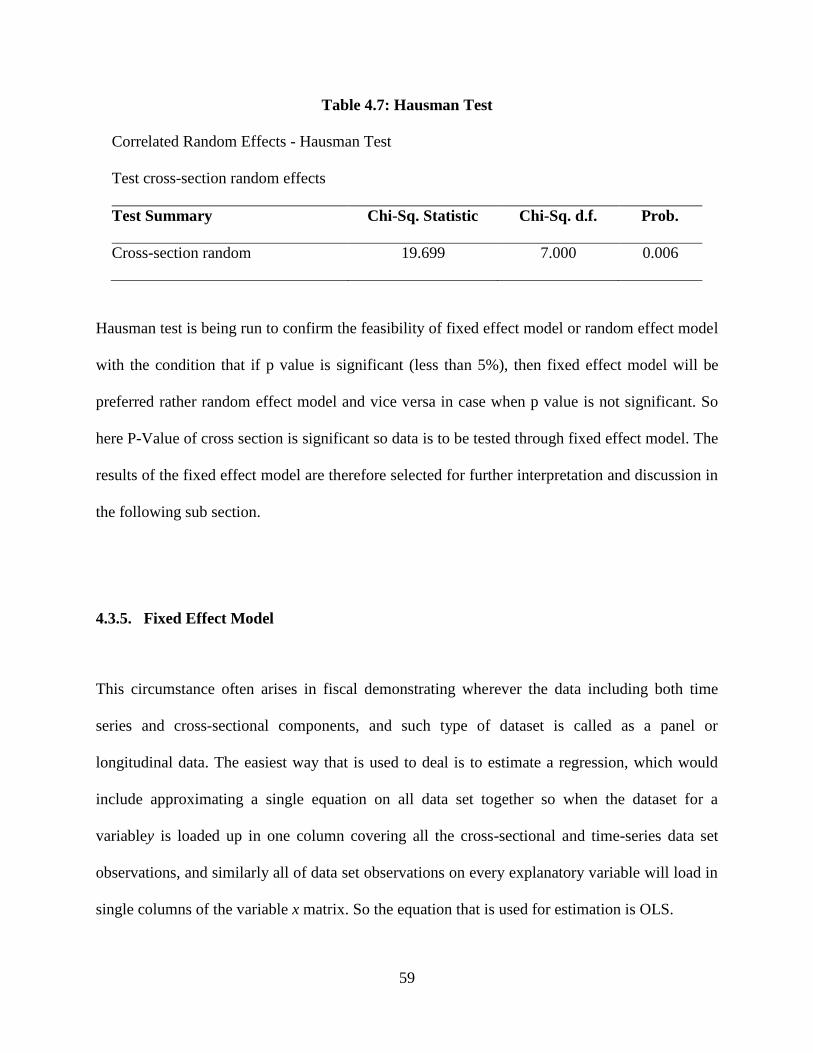
59
Table 4.7: Hausman Test
Correlated Random Effects - Hausman Test
Test cross-section random effects
Test Summary Chi-Sq. Statistic Chi-Sq. d.f. Prob.
Cross-section random 19.699 7.000 0.006
Hausman test is being run to confirm the feasibility of fixed effect model or random effect model
with the condition that if p value is significant (less than 5%), then fixed effect model will be
preferred rather random effect model and vice versa in case when p value is not significant. So
here P-Value of cross section is significant so data is to be tested through fixed effect model. The
results of the fixed effect model are therefore selected for further interpretation and discussion in
the following sub section.
4.3.5. Fixed Effect Model
This circumstance often arises in fiscal demonstrating wherever the data including both time
series and cross-sectional components, and such type of dataset is called as a panel or
longitudinal data. The easiest way that is used to deal is to estimate a regression, which would
include approximating a single equation on all data set together so when the dataset for a
variabley is loaded up in one column covering all the cross-sectional and time-series data set
observations, and similarly all of data set observations on every explanatory variable will load in
single columns of the variable x matrix. So the equation that is used for estimation is OLS.

60
Table 4.8: Fixed Effect Model
Dependent Variable: EXP_INT
Variable Coefficient Std. Error t-Statistic Prob.
C 0.164 0.054 3.061 0.002
BI 0.157 0.061 2.566 0.011
BSIZE 0.002 0.004 0.509 0.611
MO 0.021 0.047 0.435 0.664
INST -0.013 0.061 -0.214 0.831
FIRM_SIZE -0.001 0.004 -0.176 0.860
LEVERAGE 0.006 0.016 0.379 0.705
GROWTH -0.026 0.019 -1.367 0.172
R-squared 0.875 Mean dependent var
0.219
Adj R-squared 0.858 S.D. dependent var
0.191
S.E. of reg 0.072 Akaike info criterion
-2.319
Sum sq resid 4.086 Schwarz criterion
-1.748
Log likelihood 1150.620 Hannan-Quinn criter.
-2.101
F-statistic 52.443 Durbin-Watson stat
1.310
Prob(F-statistic) 0.000
Note: This table depicts the results for linear panel data model using both the firm and year fixed effects.
The dependent variable is the export intensity ratio and the independent variables are firm specific
attributes. Furthermore, ***, **, * denotes that the coefficient is statistically significant at 1%, 5% and
10%, respectively.
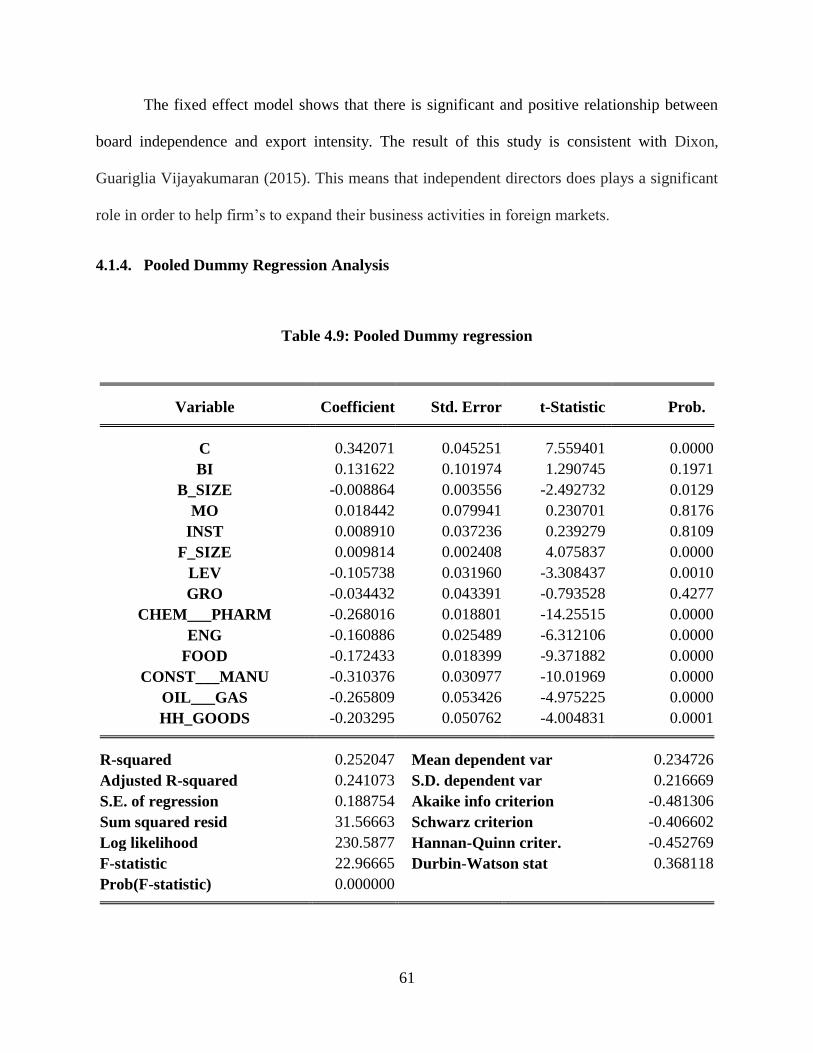
61
The fixed effect model shows that there is significant and positive relationship between
board independence and export intensity. The result of this study is consistent with Dixon,
Guariglia Vijayakumaran (2015). This means that independent directors does plays a significant
role in order to help firm’s to expand their business activities in foreign markets.
4.1.4. Pooled Dummy Regression Analysis
Table 4.9: Pooled Dummy regression
Variable Coefficient Std. Error t-Statistic Prob.
C 0.342071 0.045251 7.559401 0.0000
BI 0.131622 0.101974 1.290745 0.1971
B_SIZE -0.008864 0.003556 -2.492732 0.0129
MO 0.018442 0.079941 0.230701 0.8176
INST 0.008910 0.037236 0.239279 0.8109
F_SIZE 0.009814 0.002408 4.075837 0.0000
LEV -0.105738 0.031960 -3.308437 0.0010
GRO -0.034432 0.043391 -0.793528 0.4277
CHEM___PHARM -0.268016 0.018801 -14.25515 0.0000
ENG -0.160886 0.025489 -6.312106 0.0000
FOOD -0.172433 0.018399 -9.371882 0.0000
CONST___MANU -0.310376 0.030977 -10.01969 0.0000
OIL___GAS -0.265809 0.053426 -4.975225 0.0000
HH_GOODS -0.203295 0.050762 -4.004831 0.0001
R-squared 0.252047 Mean dependent var 0.234726
Adjusted R-squared 0.241073 S.D. dependent var 0.216669
S.E. of regression 0.188754 Akaike info criterion -0.481306
Sum squared resid 31.56663 Schwarz criterion -0.406602
Log likelihood 230.5877 Hannan-Quinn criter. -0.452769
F-statistic 22.96665 Durbin-Watson stat 0.368118
Prob(F-statistic) 0.000000

62
Above table shows the results of pooled dummy variable in which one out of seven sectors had
been used as based sector and observed the behavior of coefficients for remaining six sectors.
Base sector had been taken as Textile and showed that from remaining 6 sectors all sectors are
significantly different from each other in P-Value as well as different in terms of coefficient
measured. Base sector which is Textile had coefficient of 0.316007 which is different from all
other industries coefficient. The above model has value of adjusted R2 is 0.241 which tells that
all theses variables brings only 24.1% variation in export intensity of firm. The model is good fit
as value of F-Stat is 0.
4.2. Discussion of Results
According to likelihood ratio test and Hausman test, fixed effect model is more
appropriate or the best fit model for estimation in this study as the P-value of both tests is less
than 0.05. Therefore, results of both tests suggested for application of fixed effect test for
analysis of panel data. On the basis of results of these tests, the hypotheses are verified.
The acceptance of alternate hypothesis is based on empirical results of fixed effect model.
The results show that value of Adjusted R2 in fixed effect model is 0.858 which means that all
independent variables bring 85.8 % in dependent variable. In other words we can say that fitness
of fixed effect model is 85.8%.
The study shows insignificant and positive relationship between board size and export
intensity of firm. Also result of this variable is consistent with Dixon, Guariglia Vijayakumaran
(2015). This means that there is a positive but insignificant relationship between size of board
and exporting decision of firm. While on the other hand managerial ownership does have

63
insignificant and positive relationship with exporting decision of firm as the value of P is 0.664
because they are the key persons who are at driving seat of the firm.
Institutional ownership has negative and insignificant relationship with export intensity as
P-value of institutional is 0.831 which is greater than 0.10 and it is insignificant. Results are
consistent with prior studies as Park et al. (2010).
As per results, firm size and growth has insignificant but negative relationship with
export intensity which means that the larger the firm the lesser it will export. The results
contradicts with general perception that larger firms are more likely to be exporters because they
sufficient resources, they avail economies of scale while they have also access to external
financial resources. But in Pakistan more and extra intention is given to small and medium
enterprises and to encourage SME’s to participate in foreign market. Results of firm size and
growth are consistent with the context of Pakistani economy.
Leverage has also positive as well as insignificant relationship with export intensity of
firm which means if firms participates in foreign markets it will ultimately help in growth of net
profits as well as revenues of a firm.

64
Chapter 05
CONCLUSION AND POLICY RECOMMENDATIONS
5.1 Conclusion
The focus of this study is to explain the effect of managerial ownership and corporate
governance on the exporting decisions of the firm. As this study consists of 100 firms from
different sector and the data was collected form firms annual reports. The exporting decision of
firm is measured by one proxy that is export intensity. On the basis of empirical evidence
provided in this study with respect to export intensity results showed that exporting decision of
firm is majorly affected by board independency because they have significant relationship with
export intensity and export intensity has insignificant relation with growth and managerial
ownership, institutional ownership, board size, leverage, growth and firm size
As far as export intensity is concerned which is export sales to total sales, results are similar
as compared to previous studies Dixon, Guariglia Vijayakumaran (2015) is being affected by
board independence which means the more interdependence in the board the more firm will
export and same case will happen with board size. But on the other hand ownership structure
doesn’t play any important role as the managerial ownership and institutional ownership has
insignificant and negative relationship between export intensity. This means that the neither
institutional ownership nor managerial ownership effects exporting decision of the firm. So here
arises a question why managerial ownership has insignificant but negative relationship with

65
export intensity? The answer is in Pakistan managers are the owners as well as major
shareholders because of concentrated ownership problem due to family owned firms in Pakistan.
Size of firm also does matter in exporting decision as well as in exporting activities.
Previous studies Dixon, Guariglia Vijayakumaran (2015) and this study shows that the smaller or
younger the firm the more exports it will make because younger and smaller firms take risk of
start-up and sunk cost as compared to larger and older firms. While on the other hand the
relationship between leverage and export intensity is significant as well as positive in nature.
Growth has insignificant and negative relationship with exporting decision of firm.
So from above discussion we conclude that there is a significant relationship between
corporate governance and firm’s exporting decision but there is a negative as well as
insignificant relationship between ownership structure and exporting decision of firm. On the
basis of empirical results only one hypothesis H2 is accepted as empirical results showed
negative and insignificant relationship between institutional ownership and exporting decision of
firm. While on the other hand on the basis of empirical results 3 out of 4 hypotheses are being
rejected which are H1, H3 and H4.
5.2 Policy Recommendations
Before any recommendation, it should be kept in mind that according to this research
corporate governance only produces 86.2 % variation in firm’s exporting decisions. Remaining
13.8 % variation is produced by other factors such as exchange rate, political and international

66
relations with other countries etc. it should also kept in mind that according to recent Survey of
Pakistan 2016 exports of Pakistan decreased by 7% as compared to 2013 due to some socio
economic factors. Particularly this reduction is observed after the lifting of export ban by
European Union in 2013 when Pakistan got status of GSP Plus from EU.
As per previous discussion drawn from chapter 1 to conclusion in this study, the
following recommendations or suggestions are planned
In order to encourage international participation of Pakistani listed firms, government
should take some serious steps like establishing international relations to promote export
sales for example China Pakistan Economic Corridor.
Managerial ownership should be at optimal level in order to reduce agency problem as
well as concentrated ownership
To increase export intensity, firms should encouraged smaller size of board of directors
as the larger the size of board the more complex will be decision making.
Firms should also pay attention on the quality of independent directors in their board of
directors.
5.3 Limitations
A lot of effort is made to conduct this study in a way that it can be useful for the readers
and practitioners; however there is some limitation to the current study. This study takes into
account only listed companies on PST that issue financial reports on regular basis. Furthermore,

67
this study considers only non-financial firm that are listed in PST. Another limitation is that this
study only considered the companies that are listed only on Pakistan Stock Exchange, not a
single company is selected from any other stock exchange. Finally the study is limited only to
Pakistan and results can be generalized for the non- financial companies operating in Pakistan.
5.4 Future Research Directions
More contribution can be added by increasing number of firms in data collection as this
research only taken 100 listed firms from PST in order to get more clear results. Secondly this
study didn’t focus on the top management especially CEO’s quality like export experience as
well as education. Another direction is comparative analysis of managerial ownership and
corporate governance in order to explore to what extent managerial ownership is optimal to raise
export intensity.
68
References:
Adams, R., and H. Mehran. 2003. “Is Corporate Governance Different for Bank Holding
Companies?” Economic Policy Review 9 (1): 123–142.
Agrawal, A., and G. N. Mandelker. 1987. “Managerial Incentives and Corporate Investment
and Financing Decisions.” The Journal of Finance 42 (4): 823–837.
Amihud, Y., and B. Lev. 1981. “Risk Reduction as a Managerial Motive for Conglomerate
Mergers.” The Bell Journal of Economics 12 (2): 605–617.
Berman, N., and J. Héricourt. 2010. “Financial Factors and the Margins of Trade: Evidence
from Cross-Country Firm-Level Data.” Journal of Development Economics 93 (2): 206–
217.
Bernard, A. B., J. Eaton, J. Bradford Jensen, and S. Kortum. 2003. “Plants and Productivity
in International Trade.” American Economic Review 93 (4): 1268–1290.
Bernard, A. B., and J. B. Jensen. 2004. “Why Some Firms Export.” Review of Economics and
Statistics 86 (2): 561–569.
Boubakri, N., Cosset, J. C., & Guedhami, O. (2004). Liberalization, corporate governance
and the performance of privatized firms in developing countries.Journal of Corporate
Finance, 11(5), 767-790.
Buck, T., I. Filatotchev, M.Wright, and N. Demina. 2000. “Exporting Activity in Transitional
Economies: An Enterprise Level Study.” Journal of Development Studies 37 (2): 44–66.

69
Cadbury, A. 1992. Report of the Committee on the Financial Aspects of Corporate
Governance. London:
Daily, C. & Dalton, D. (2003). Corporate Governance: Decades of Dialogue and Data. The
Academy of Management Review, 28(3), 371-382
Dixon, R., Guariglia, A., & Vijayakumaran, R. (2015). Managerial ownership, corporate
governance and firms' exporting decisions: evidence from Chinese listed companies. The
European Journal of Finance, 1-39.
Gee. Caggese, A., and V. Cunat. 2013. “Financing Constraints, Firm Dynamics, Export
Decisions, and Aggregate Productivity.” Review of Economic Dynamics 16 (1): 177–193.
Calabro, A., and D. Mussolino. 2013. “How Do Boards of Directors Contribute to Family
SME Export Intensity? The Role of Formal and Informal Governance Mechanisms.”
Journal of Management and Governance 17 (2): 363–403.
Calabro, A., D. Mussolino, and M. Huse. 2009. “The Role of Board of Directors in the
Internationalization Process of Small and Medium Sized Family Businesses.”
International Journal of Globalisation and Small Business 3 (4):393–411.
Chen, J., E. Mahmoud, and E. Cai. 2011. “Managerial Power Theory, Tournament Theory,
and Executive Pay in China.” Journal of Corporate Finance 17 (4): 1176–1199.
Coles, J., N. Daniel, and L. Naveen. 2006. “Managerial Incentives and Risk-Taking.”
Journal of Financial Economics 79 (2): 431–468.
Coles, J., N. Daniel, and L. Naveen. 2008. “Boards: Does One Size Fit for All?” Journal of
Financial Economics 87 (2): 329–356.

70
Conyon, M. J., and L. He. 2011. “Executive Compensation and Corporate Governance in
China.” Journal of Corporate Finance 17 (4): 1158–1175.
Conyon, M. J., and L. He. 2012. “CEO Compensation and Corporate Governance in China.”
Corporate Governance: An International Review 20 (6): 575–592.
Cornett, M., A. J. Marcus, A. Saunders, and H. Tehranian. 2007. “The Impact of Institutional
Ownership on Corporate Operating Performance.” Journal of Banking and Finance 31
(6): 1771–1794.
Dalton, D. R., C. M. Daily, J. L. Johnson, and A. E. Ellstrand. 1999. “Number of Directors
and Financial Performance A Meta-Analysis.” Academy of Management Journal 42 (6):
674–686.
Denis, D. J., D. K. Denis, and A. Sarin. 1997. “Agency Problems, Equity Ownership, and
Corporate Diversification.” The Journal of Finance 52 (1): 135–160.
Dixit, A. 1989. “Entry and Exit Decisions Under Uncertainty.” Journal of Political Economy
97 (3): 620–638.
Doidge, C., Karolyi, G. A., & Stulz, R. M. (2005). The valuation premium for non-US stocks
listed in US markets. Rotman School of Managenet, University of Toronto, Working
Paper.
Eisenberg, T., S. Sundgren, and M.Wells. 1998. “Larger Board Size and Decreasing Firm
Value in Small Firms.” Journal of Financial Economics 48 (1): 35–54.
Fama, E. 1980. “Agency Problems and the Theory of the Firm.” Journal of Political
Economy 88 (2): 288–307.

71
Fama, E., and M. C. Jensen. 1983. “Separation of Ownership and Control.” The Journal of
Law and Economics 26 (2): 301–326.
Filatotchev, I., N. Demina, M. Wright, and T. Buck. 2001. “Strategic Choices, Export
Orientation and Corporate Governance in Privatized Firms in Russia, Ukraine and
Belarus: Theory and Empirical Evidence.” Journal of International Business Studies 32
(4): 853–871.
Filatotchev, I., N. Isachenkova, and T. Mickiewicz. 2007. “Corporate Governance,
Managers’ Independence, Exporting, and Performance of Firms in Transition
Economies.” Emerging Markets Finance and Trade 43 (5): 62–77.
Filatotchev, I., J. Stephan, and B. Jindra. 2008. “Ownership Structure, Strategic Controls and
Export Intensity of Foreign-Invested Firms in Transition Economies.” Journal of
International Business Studies 39 (7): 1133–1148.
Frankel, J. A., and D. Romer. 1999. “Does Trade Cause Growth?” American Economic
Review 89 (3): 379–399.
Fu, D., Y. Wu, and Y. Tang. 2010. The Effects of Ownership Structure and Industry
Characteristics on Export Performance. Discussion Paper No.10.09. The University of
Western Australia.
George, G., and G. Prabhu. 2000. “Developmental Financial Institutions as Catalysts of
Entrepreneurship in Emerging Economies.” Academy of Management Review 25 (3):
620–630.

72
Greenaway, D., A. Guariglia, and R. Kneller. 2007. “Financial Factors and Exporting
Decisions.” Journal of International Economics 73 (2): 377–395.
Greenaway, D., and R. Kneller. 2007. “Firm Heterogeneity, Exporting and Foreign Direct
Investment.” Economic Journal 117 (517): F134–F161.
Harris, M., and A. Raviv. 2006. “A Theory of Board Control and Size.” Review of Financial
Studies 21 (4): 1797–1832.
Hobdari, B., A. Gregoric, and E. Sinani. 2011. “The Role of Firm Ownership on
Internationalization: Evidence from Two Transition Economies.” Journal of Governance
and Management 15 (3): 393–413.
Huyghebaert, N., and L.Wang. 2012. “Expropriation of Minority Investors in Chinese Listed
Firms: The Role of Internal and External Corporate Governance.” Corporate
Governance: An International Review 20 (3): 308–332.
Jakson, G., and R. Strange. 2008. Corporate Governance and International Business.
Basingstoke: Palgrave Jensen, M. 1993. “The Modern Industrial Revolution, Exit, and the
Failure of Internal Control Systems.” The Journal of Finance 48 (3): 831–880.
Jensen, M. C., and W. H. Meckling. 1976. “Theory of the Firm: Managerial Behavior,
Agency Costs and Ownership Structure.” Journal of Financial Economics 3 (4): 305–
360.
John, K., L. Litov, and B. Yeung. 2008. “Corporate Governance and Risk-Taking.” The
Journal of Finance 63 (4): 1679–1728.
73
KHO, B. C., Stulz, R. M., & Warnock, F. E. (2009). Financial globalization, governance, and
the evolution of the home bias. Journal of Accounting Research, 47(2), 597-635.
Li, D., F. Moshirian, P. Nguyen, and L.-W. Tan. 2007. “Corporate Governance or
Globalization: What Determines CEO Compensation in China?” Research in
International Business and Finance 21 (1): 32–49.
Li, D., F. Moshirian, P. Nguyen, and L.-W. Tan. 2007. “Managerial Ownership and Firm
Performance: Evidence from China’s Privatizations.” Research in International Business
and Finance 21 (3): 396–413.
Lin, C., Y. Ma, and D. Su. 2009. “Corporate Governance and Firm Efficiency: Evidence
from China’s Publicly Listed Firms.” Managerial and Decision Economics 30 (3): 193–
209.
Lipton, M., and J. Lorsch. 1992. “A Modest Proposal for Improved Corporate Governance.”
Business Lawyer 48: 59–77.
Lu, J., B. Xu, and X. Liu. 2009. “The Effects of Corporate Governance and Institutional
Environment on Export Behavior in Emerging Economies: Evidence from China.”
Management International Review 49 (4): 455–478.
May, D. 1995. “Do Managerial Motives Influence Firm Risk Reduction Strategies?” The
Journal of Finance 50 (4): 1291–1308.
Melitz, M. 2003. “The Impact of Trade on Intra-Industry Reallocations and Aggregate
Industry Productivity.” Econometrica 71 (6): 1695–1725.

74
Minetti, R., and S. C. Zhu. 2011. “Credit Constraints and Firm Export: Microeconomic
Evidence from Italy.” Journal of International Economics 83 (2): 109–125.
Monks, R., and N. Minow. 2004. Corporate Governance. 3rd ed. Boston, MA: Blackwell.
Morck, R., A. Shleifer, and R. W. Vishny. 1988. “Management Ownership and Corporate
Performance: An Empirical Analysis.” Journal of Financial Economics 20: 293–315.
Morck, R., and B. Yeung. 1991. “Why Investors Value Multinationality?” The Journal of
Business 64 (2): 165–187.
Park, A., D. Yang, X. Shi, and Y. Jiang. 2010. “Exporting and Firm Performance: Chinese
Exporters and the Asian Financial Crisis.” Review of Economics and Statistic 92 (4):
822–842.
Peng, M. X. 2004. “Outside Directors and Firm Performance During Institutional
Transitions.” Strategic Management Journal 25 (5): 453–471.
Qian, Y. 1996. “Enterprise Reform in China: Agency Problems and Political Control.” The
Economics of Transition 4 (2): 427–447.
Raheja, C. 2005. “Determinants of Board Size and Composition: A Theory of Corporate
Boards.” Journal of Financial and Quantitative Analysis 40 (2): 283–306.
Roberts, M., and J. Tybout. 1997. “An Empirical Model of Sunk Costs and the Decision to
Export.” American Economic Review 87 (4): 545–564.
75
Rose, N. L., and A. Shepard. 1997. “Firm Diversification and CEO Compensation:
Managerial Ability or Executive Entrenchment?” The RAND Journal of Economics 28
(3): 489–514.
Schott, P. 2008. “The Relative Sophistication of Chinese Exports.” Economic Policy 23 (53):
5–49.
Shleifer, A. 1998. “State Versus Private Ownership.” Journal of Economic Perspectives 12
(4): 133–150.
Shleifer, A., and R. W. Vishny. 1997. “A Survey of Corporate Governance.” The Journal of
Finance 52 (2): 737–783.
Su, D. 2005. “Corporate Finance and State Enterprise Reform in China.” China Economic
Review 16 (2): 118–148.
Sun, Q., and W. H. S. Tong. 2003. “China Share Issue Privatization: The Extent of Its
Success.” Journal of Financial Economics 70 (2): 183–222.
Tian, L., and S. Estrin. 2008. “Retained State Ownership in Chinese PLCs: Does
Government Ownership Always Reduce Corporate Value?” Journal of Comparative
Economics 36 (1): 74–89.
Tihanyi, L., R. A. Johnson, R. E. Hoskisson, and M. A. Hitt. 2003. “Institutional Ownership
Differences and International Diversification: The Effect of Boards of Directors and
Technological Opportunity.” Academy of Management Journal 46 (2): 195–211.

76
Todo, Y., Y. Inui, and Y. Yuan. 2014. “Effects of Privatization on Exporting Decisions:
Firm–Level Evidence from Chinese State-Owned Enterprises.” Comparative Economic
Studies 56 (4): 536–555.
Verhoeven, W. 1988. “The Export Performance of Small and Medium-Sized Enterprises in
the Netherlands.” International Small Business Journal 6 (2): 20–33.
Wagner, J. 2010. “Exports and Firm Characteristics – First Evidence from Fractional Probit
Panel Estimates.” Empirical Economics Letters 9 (10): 935–940.
Wakeling, K. 1998. “Innovation and Export Behavior at the Firm Level.” Research Policy 26
(7): 829–841.
Walder, A. 2011. “From Control to Ownership: China’s Managerial Revolution.”
Management and Organization Review 7 (1): 19–38.
Wei, Z., F. Xie, and S. Zhang. 2005. “Ownership Structure and Firm Value in China’s
Privatized Firms: 1991–2001.” Journal of Financial and Quantitative Analysis 40 (1):
87–108.
World Bank. 1993. The East Asian Miracle: Economic Growth and Public Policy.
Washington, DC: Oxford University Press.
Yasser, Q. R., Entebang, H. A., & Mansor, S. A. (2011). Corporate governance and firm
performance in Pakistan: The case of Karachi Stock Exchange (KSE)-30. Journal of
economics and international finance, 3(8), 482-491.
Yermack, D. 1996. “Higher Market Valuation of Companies with a Small Board of
Directors.” Journal of Financial Economics 40 (2): 185–211.

77
Yi, J. 2014. “Firm Heterogeneity, Sunk Costs, Spatial Characteristics and Export Market
Participation: Evidence from China.” Journal of International Trade & Economic
Development: An International and Comparative Review 23 (3): 361–386.
Yi, J., and C. Wang. 2012. “The Decision to Export: Firm Heterogeneity, Sunk Costs, and
Spatial Concentration.” International Business Review 21 (5): 766–781.
Yuan, R., J. Z. Xiao, and H. Zou. 2008. “Mutual Funds’ Ownership and Performance:
Evidence from China.” Journal of Banking and Finance 32 (8): 1552–1565.
Zahra, S. 2003. “International Expansion of US Manufacturing Family Businesses: The
Effect of Ownership and Involvement.” Journal of Business Venturing 18 (4): 495–512.