CORPORATE FINANCE SYLLABUS AND OUTLINE SPRING 2016 Aswath Damodaran 1.

Aswath Damodaran! 1!
Corporate Finance: Spring 2010
Aswath Damodaran

Aswath Damodaran! 2!
Ponderous Thoughts… (or maybe not)
There are few facts and lots of opinions… The real world is a messy place… The model is your tool… Not the other way around… Change is the only constant…

Aswath Damodaran! 3!
The Breakdown in the Classical Objective Function
STOCKHOLDERS
Managers put their interests above stockholders
Have little control over managers
BONDHOLDERS Lend Money
Bondholders can get ripped off
FINANCIAL MARKETS
SOCIETY Managers
Delay bad news or provide misleading information
Markets make mistakes and can over react
Significant Social Costs
Some costs cannot be traced to firm

Aswath Damodaran! 4!
I. Where does the power lie?
Aswath Damodaran! 5!
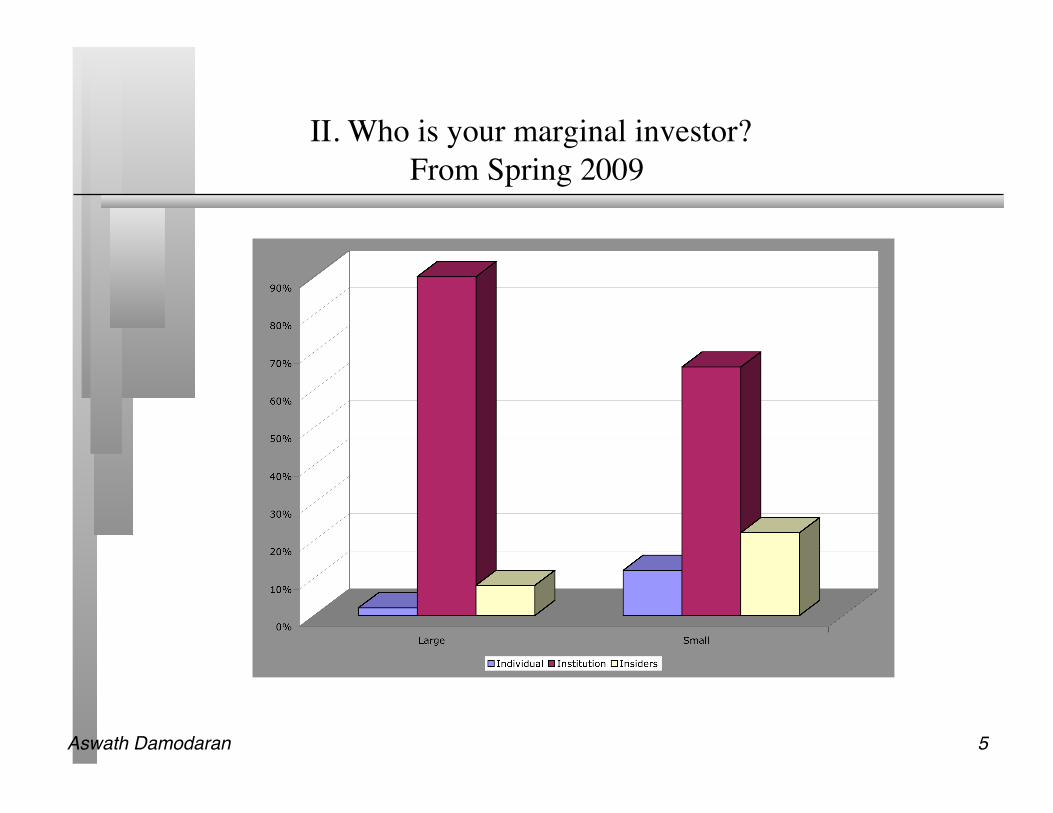
II. Who is your marginal investor?���From Spring 2009

Aswath Damodaran! 6!
III. Risk Profiles and Costs of Equity

Aswath Damodaran! 7!
Beta: The Standard Approach

Aswath Damodaran! 8!
Regression Estimation Approaches
Typical reasons 1. My company is unique 2. My company is in only one line of business 3. My bottom-up beta is too different from my regression beta
Aswath Damodaran! 9!
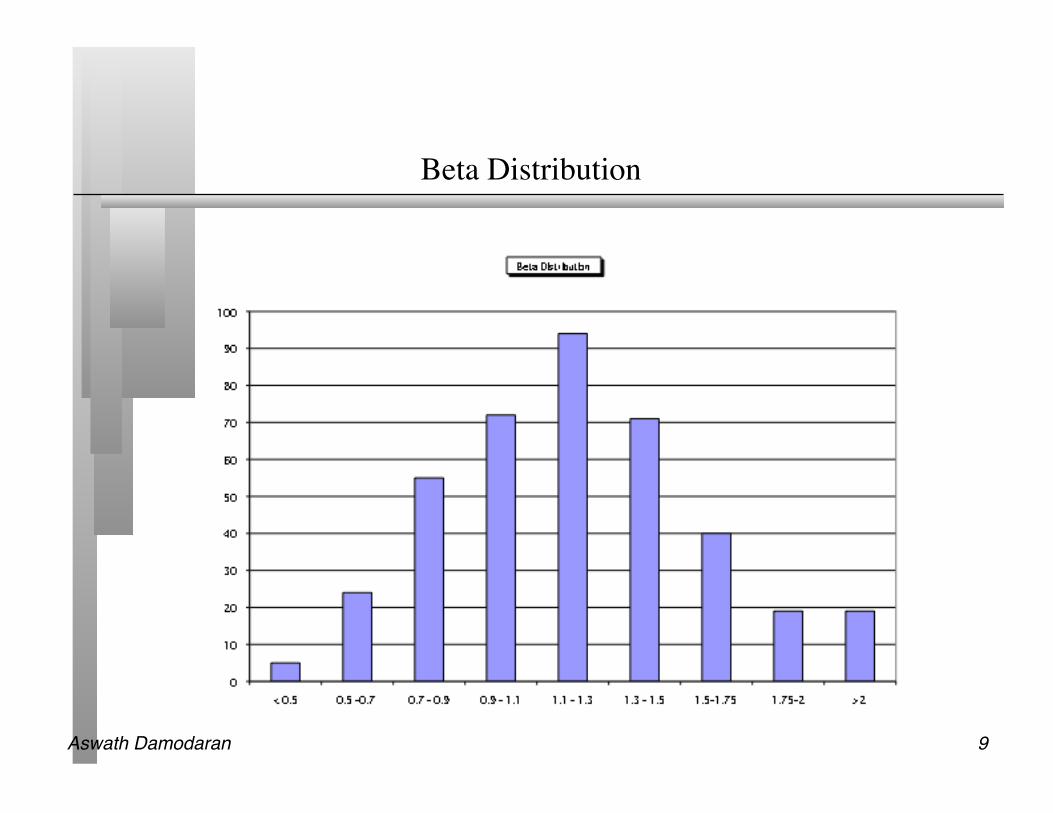
Beta Distribution

Aswath Damodaran! 10!
Jensen’s Alpha Distribution

Aswath Damodaran! 11!
R Squared
Aswath Damodaran! 12!
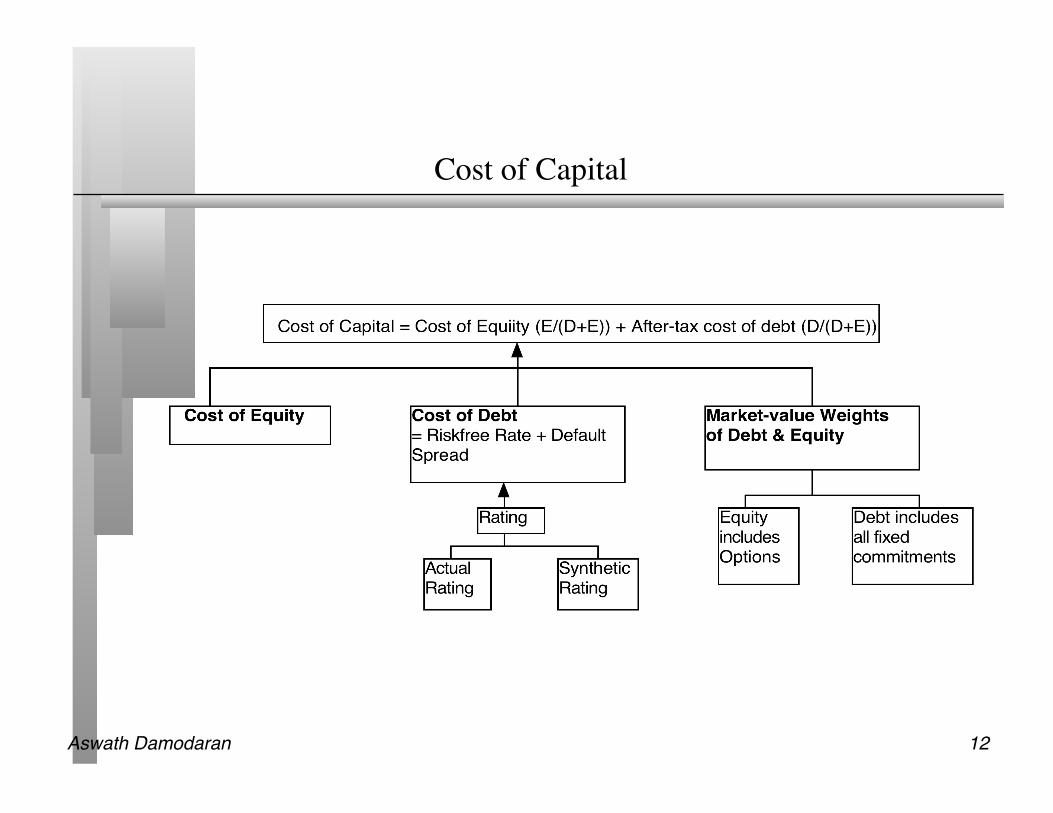
Cost of Capital

Aswath Damodaran! 13!
Distribution of Current Market Value Debt Ratios

Aswath Damodaran! 14!
IV. The Quality of Investments: The Firm View

Aswath Damodaran! 15!
ROC versus Cost of Capital

Aswath Damodaran! 16!
ROE versus Cost of Equity
Aswath Damodaran! 17!
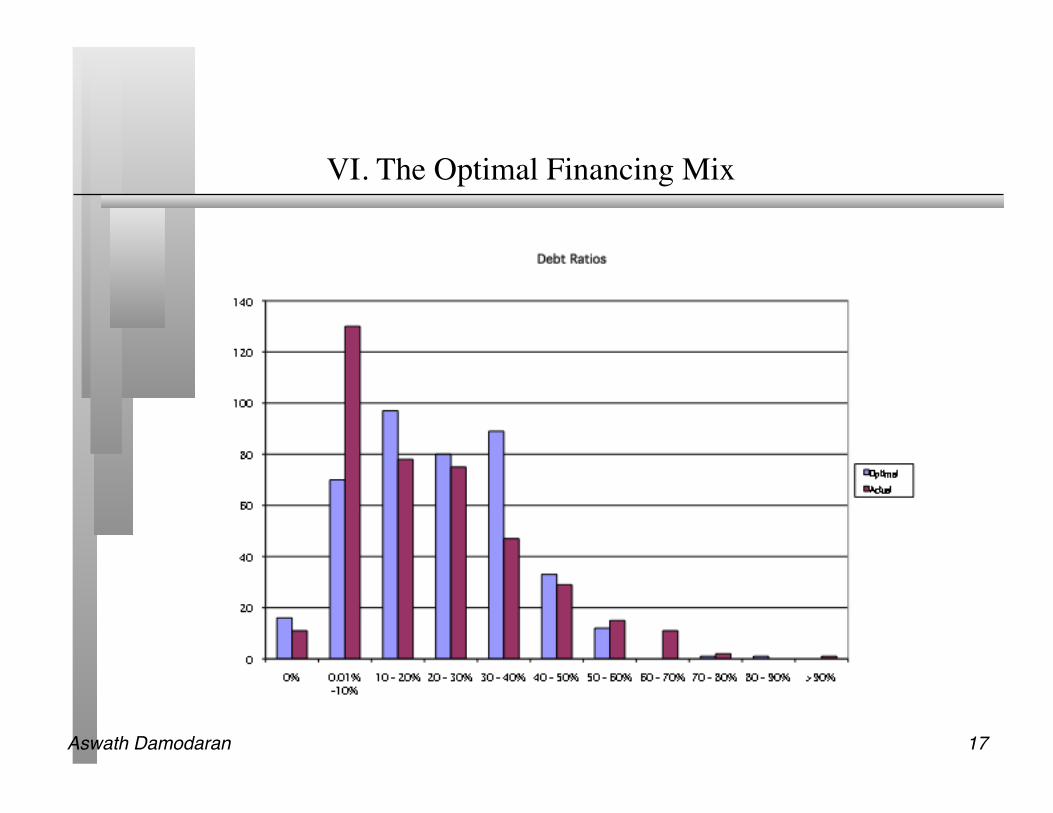
VI. The Optimal Financing Mix

Aswath Damodaran! 18!
Under versus Over Levered Firms

Aswath Damodaran! 19!
Change in Cost of Capital
Drop in WACC
0
10
20
30
40
50
60
0% or less 0-0.20% 0.20-0.40% 0.40-0.60% 0.60%-0.80% 0.80%-1.00% >1.0%WACC Drop
Num
ber
of
Firm
s
Aswath Damodaran! 20!
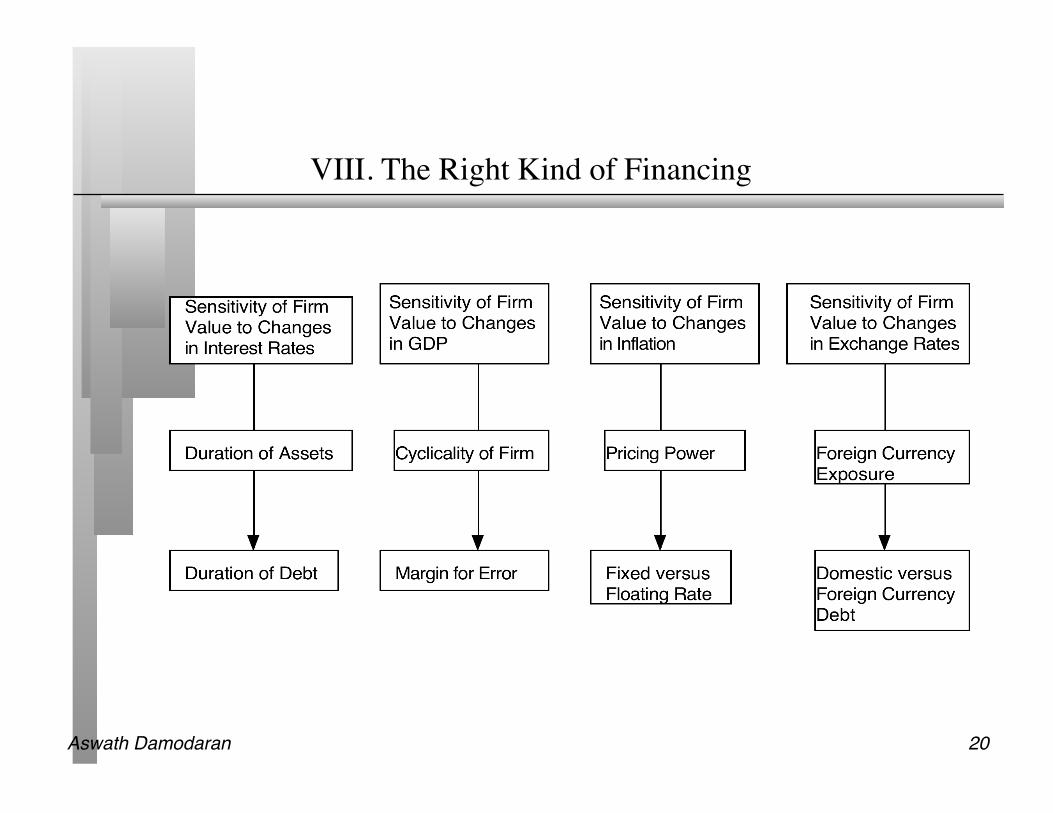
VIII. The Right Kind of Financing
Aswath Damodaran! 21!
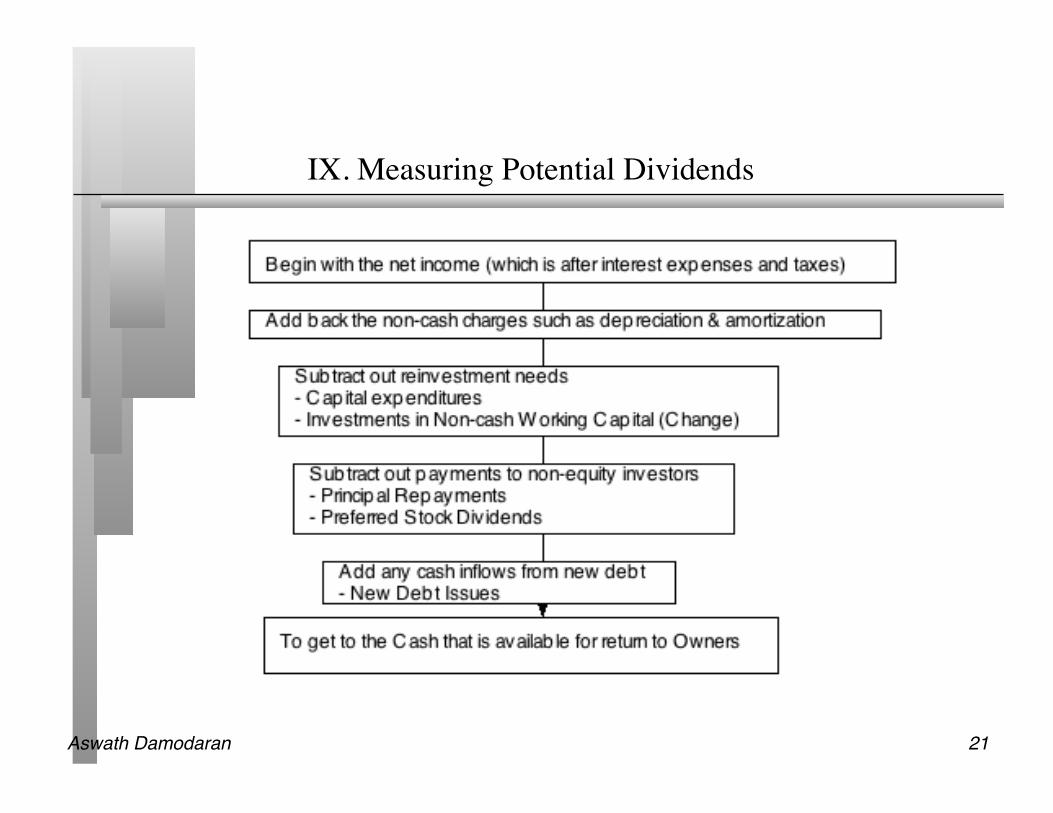
IX. Measuring Potential Dividends

Aswath Damodaran! 22!
Dividends versus FCFE

Aswath Damodaran! 23!
X. Valuation: ���Match up cashflows and discount rates…

Aswath Damodaran! 24!
Getting to equity value per share
Approach used To get to equity value per share Discount dividends per share at the cost of equity
Present value is value of equity per share
Discount aggregate FCFE at the cost of equity
Present value is value of aggregate equity. Subtract the value of equity options given to managers and divide by number of shares.
Discount aggregate FCFF at the cost of capital
PV = Value of operating assets + Cash & Near Cash investments + Value of minority cross holdings - Debt outstanding = Value of equity - Value of equity options =Value of equity in common stock / Number of shares

Aswath Damodaran! 25!
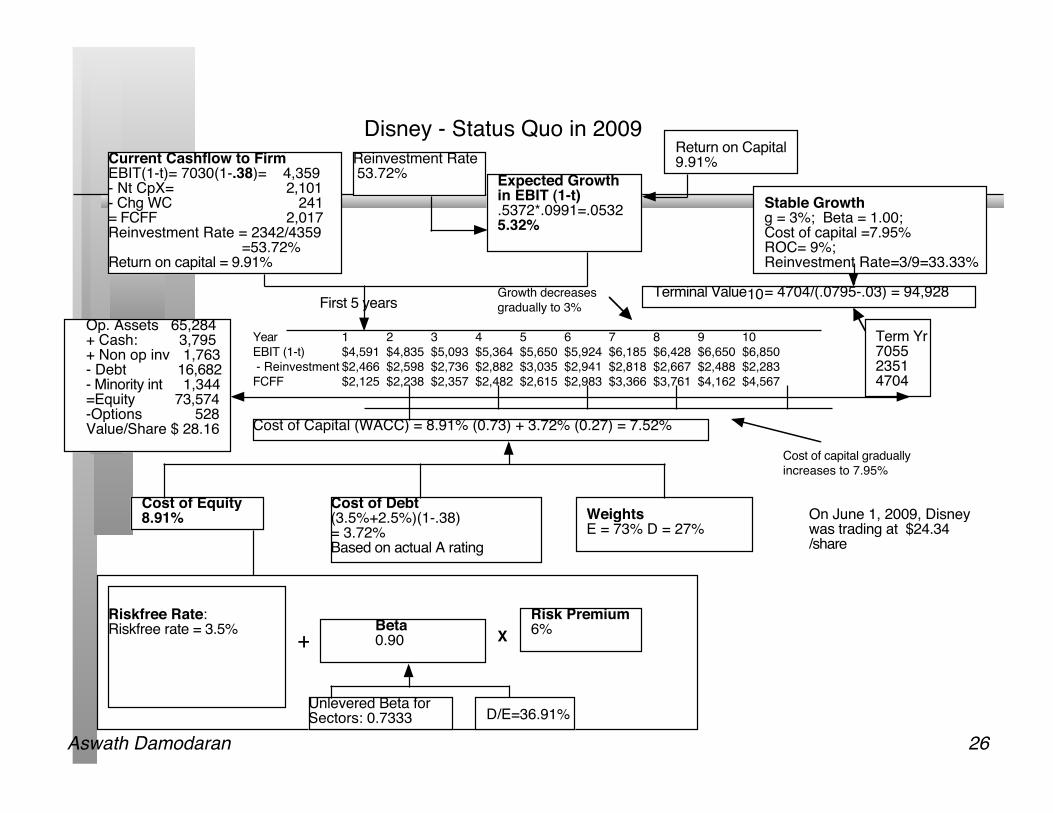
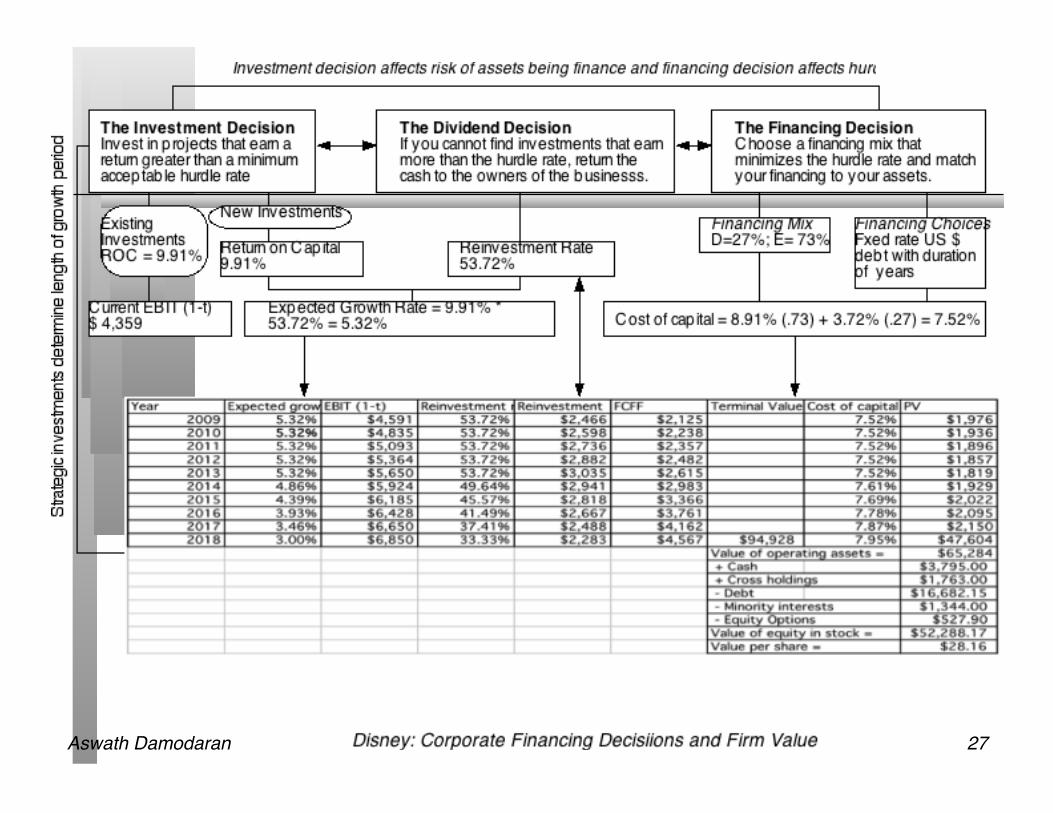
Disney: Inputs to Valuation
Aswath Damodaran! 26!
Current Cashflow to FirmEBIT(1-t)= 7030(1-.38)= 4,359- Nt CpX= 2,101 - Chg WC 241= FCFF 2,017Reinvestment Rate = 2342/4359
=53.72%Return on capital = 9.91%
Expected Growth in EBIT (1-t).5372*.0991=.05325.32%
Stable Growthg = 3%; Beta = 1.00;Cost of capital =7.95% ROC= 9%; Reinvestment Rate=3/9=33.33%
Terminal Value10= 4704/(.0795-.03) = 94,928
Cost of Equity8.91%
Cost of Debt(3.5%+2.5%)(1-.38)= 3.72%Based on actual A rating
WeightsE = 73% D = 27%
Cost of Capital (WACC) = 8.91% (0.73) + 3.72% (0.27) = 7.52%
Op. Assets 65,284+ Cash: 3,795+ Non op inv 1,763- Debt 16,682- Minority int 1,344=Equity 73,574-Options 528Value/Share $ 28.16
Riskfree Rate:Riskfree rate = 3.5% +
Beta 0.90 X
Risk Premium6%
Unlevered Beta for Sectors: 0.7333
Disney - Status Quo in 2009Reinvestment Rate 53.72%
Return on Capital9.91%
Term Yr705523514704
On June 1, 2009, Disney was trading at $24.34 /share
First 5 yearsGrowth decreases gradually to 3%
D/E=36.91%
Year 1 2 3 4 5 6 7 8 9 10EBIT (1-t) $4,591 $4,835 $5,093 $5,364 $5,650 $5,924 $6,185 $6,428 $6,650 $6,850 - Reinvestment $2,466 $2,598 $2,736 $2,882 $3,035 $2,941 $2,818 $2,667 $2,488 $2,283 FCFF $2,125 $2,238 $2,357 $2,482 $2,615 $2,983 $3,366 $3,761 $4,162 $4,567
Cost of capital gradually increases to 7.95%
Aswath Damodaran! 27!

Aswath Damodaran! 28!
Ways of changing value…
Cashflows from existing assetsCashflows before debt payments, but after taxes and reinvestment to maintain exising assets
Expected Growth during high growth period
Growth from new investmentsGrowth created by making new investments; function of amount and quality of investments
Efficiency GrowthGrowth generated by using existing assets better
Length of the high growth periodSince value creating growth requires excess returns, this is a function of- Magnitude of competitive advantages- Sustainability of competitive advantages
Stable growth firm, with no or very limited excess returns
Cost of capital to apply to discounting cashflowsDetermined by- Operating risk of the company- Default risk of the company- Mix of debt and equity used in financing
How well do you manage your existing investments/assets?
Are you investing optimally forfuture growth? Is there scope for more
efficient utilization of exsting assets?
Are you building on your competitive advantages?
Are you using the right amount and kind of debt for your firm?

Aswath Damodaran! 29!
Current Cashflow to FirmEBIT(1-t)= 7030(1-.38)= 4,359- Nt CpX= 2,101 - Chg WC 241= FCFF 2,017Reinvestment Rate = 2342/4359
=53.72%Return on capital = 9.91%
Expected Growth in EBIT (1-t).5372*.12=.06456.45%
Stable Growthg = 3%; Beta = 1.00;Cost of capital =7.19% ROC= 9%; Reinvestment Rate=3/9=33.33%
Terminal Value10= 5067/(.0719-.03) = 120,982
Cost of Equity9.74%
Cost of Debt(3.5%+2.5%)(1-.38)= 3.72%Based on synthetic A rating
WeightsE = 60% D = 40%
Cost of Capital (WACC) = 9.74% (0.60) + 3.72% (0.40) = 7.33%
Op. Assets 81,089+ Cash: 3,795+ Non op inv 1,763- Debt 16,682- Minority int 1,344=Equity 68621-Options 528Value/Share $ 36.67
Riskfree Rate:Riskfree rate = 3.5% +
Beta 1.04 X
Risk Premium6%
Unlevered Beta for Sectors: 0.7333
Disney - RestructuredReinvestment Rate 53.72%
Return on Capital12%
Term Yr760025335067
On June 1, 2009, Disney was trading at $24.34 /share
First 5 yearsGrowth decreases gradually to 3%
D/E=66.67%
Cost of capital gradually decreases to 7.19%
Year 1 2 3 4 5 6 7 8 9 10EBIT (1-t) $4,640 $4,939 $5,257 $5,596 $5,957 $6,300 $6,619 $6,909 $7,164 $7,379 - Reinvestment $2,492 $2,653 $2,824 $3,006 $3,200 $3,127 $3,016 $2,866 $2,680 $2,460 FCFF $2,147 $2,286 $2,433 $2,590 $2,757 $3,172 $3,603 $4,043 $4,484 $4,919

Aswath Damodaran! 30!
Value versus Price

Aswath Damodaran! 31!
So, how do you explain the price? Its all relative..
Company Name Ticker Symbol PE
Expected Growth Rate PEG
Point 360 PTSX 10.62 5.00% 2.12 Fox Entmt Group Inc FOX 22.03 14.46% 1.52 Belo Corp. 'A' BLC 25.65 16.00% 1.60 Hearst-Argyle Television Inc HTV 26.72 12.90% 2.07 Journal Communications Inc. JRN 27.94 10.00% 2.79 Saga Communic. 'A' SGA 28.42 19.00% 1.50 Viacom Inc. 'B' VIA/B 29.38 13.50% 2.18 Pixar PIXR 29.80 16.50% 1.81 Disney (Walt) DIS 29.87 12.00% 2.49 Westwood One WON 32.59 19.50% 1.67 World Wrestling Ent. WWE 33.52 20.00% 1.68 Cox Radio 'A' Inc CXR 33.76 18.70% 1.81 Beasley Broadcast Group Inc BBGI 34.06 15.23% 2.24 Entercom Comm. Corp ETM 36.11 15.43% 2.34 Liberty Corp. LC 37.54 19.50% 1.92 Ballantyne of Omaha Inc BTNE 55.17 17.10% 3.23 Regent Communications Inc RGCI 57.84 22.67% 2.55 Emmis Communications EMMS 74.89 16.50% 4.54 Cumulus Media Inc CMLS 94.35 23.30% 4.05 Univision Communic. UVN 122.76 24.50% 5.01 Salem Communications Corp SALM 145.67 28.75% 5.07 Average for sector 47.08 17.17% 2.74

Aswath Damodaran! 32!
Most undervalued stocks!!

Aswath Damodaran! 33!
The Triple Whammy: Underlevered, Cash Build-up and Under valued?
Current Debt ratio Optimal Debt Ratio Dividends FCFE Value/share Price/Share Exxon Mobil 4.96% 40.00% 34,711 68,549 $76.01 $67.77 Frisch Restaurants 28.88% 40.00% 0.91442 2,495.79 $25.72 $22.80 Apple 1.00% 20.00% 0 7946 $295.00 $261.09 Amgen 15.63% 30.00% 4430 6786 $65.10 $57.31 Hansen's 0.40% 30.00% 86.2 208.83 $50.21 $44.15
Boston Beer Company 1.19% 20.00% $9.26 $9.44 65.02 57.01 MDR 1.27% 50.00% 0 94.81 $31.67 $27.76 Google 0.97% 30.00% 0 120.83 $602.70 $525.70 McCormick 17.62% 40.00% $207 $369 $45 $39 Apple 0.66% 20.00% 0 $1,163 $301.95 $261.09 Sysco 13.28% 50.00% $981.32 $1,093.51 $36.56 $31.54 Game Stop 25.50% 40.00% 594 $29.30 $24.99 General Mills 20.53% 50.00% 1500 7200 84.02 71.16 Nutrisystem 1.48% 30.00% $21 $28.00 $22.98 $19.33 Best Buy 30.42% 50.00% $1,025.17 $2,435 $54.13 $45.52 Apple 0.00% 30.00% 0 2228.38 $312.90 $261.60 Yum! Brands 25.87% 40.00% 273 1149 $46.13 $38.33 Netflix 5.20% 20.00% 0 98.8 $74.90 $60.90 Pepsi 7.60% 40.00% 2739 4645 $80.67 $65.22 Research In Motion 0.45% 30.00% 1200 1818.772 $88.39 $68.48 Tim Hortons 14.69% 40.00% $207.27 $215.70 $44.54 $32.99 Viacom 30.00% 60.00% 1133.33 1432.67 $53.00 $39.01 HJ Heinz Co. 28.08% 40.00% 470 702 $64.27 $46.87
Archer Daniels Midland 33.00% 50.00% 447 580 $34.00 $24.34 Hormel 6.79% 50.00% 139.5 231 $58.62 $40.61 Microsoft 2.92% 40.00% 13821 19350 $42.30 $29.16 ConAgra Foods 27.00% 40.00% $702.00 $1,045.60 $37.67 $25.06 Toyota 48.74% 60.00% 3449.00% 1012 $55.60 $36.69 Gamestop 23.48% 50.00% 0 149.4 $37.53 $24.31 Chevron 5.71% 20.00% 5032 6632.6 $131.34 $81.44 First Solar 2.40% 20.00% 0 847 $216.77 $133.87 Magna International 16.24% 50.00% 125 159 $88.25 $53.26 Ross Stores 20.36% 50.00% $269.73 $283 $92.91 $56.00 Sysco Corp. 7.47% 20.00% 658 1061 $52.79 $31.41 Dreamworks 0.72% 20.00% 0 411.9 $66.87 $39.71 Google 1.16% 20.00% 0 1520.1 $897.09 $525.70 Google 1.16% 20.00% 0 1520.1 $897.09 $525.70 Cardinal Health 23.36% 60.00% 200.4 466.5 $61.03 $35.57 Apple Inc. 0.66% 40.00% $- $19,327.40 $464.51 $263.00 ConAgra Foods 27.00% 40.00% $702.00 $1,045.60 $44.41 $25.06 GT Solar 0.00% 40.00% 0 107.21 $11.06 5.85 First Solar 1.36% 30.00% 0 152.99 $258.06 134.32 Dreamworks 3.67% 20.00% 0 264.9 79.99 41.38 General Mills 22.84% 50.00% 435.6 1086 $155.45 $71.16 Coca Cola 8.47% 30.00% $4,993.00 $10,163.60 $151.15 $53.45 Hansen's 0.01% 40.00% 0 48.16 $125.58 $44.15 GT Solar 0.00% 40.00% 0 9.11 $17.76 $5.82 Starbucks 16.72% 40.00% $365.71 $933.40 $79.99 $25.98 Starbucks 16.72% 40.00% $365.71 $933.40 $79.99 $25.98 BP 39.06% 90.00% $8,795 $14,008 $209.97 $54.15 Trina Solar 29.00% 40.00% 0 17.68 $107.66 25.7

Aswath Damodaran! 34!
First Principles
Aswath Damodaran! 35!
Objectives of this class
If you get the big picture, the details will come (sooner or later) Tools are useful but only in the larger context of answering bigger questions. Corporate finance is not so bad !!!
Aswath Damodaran! 36!
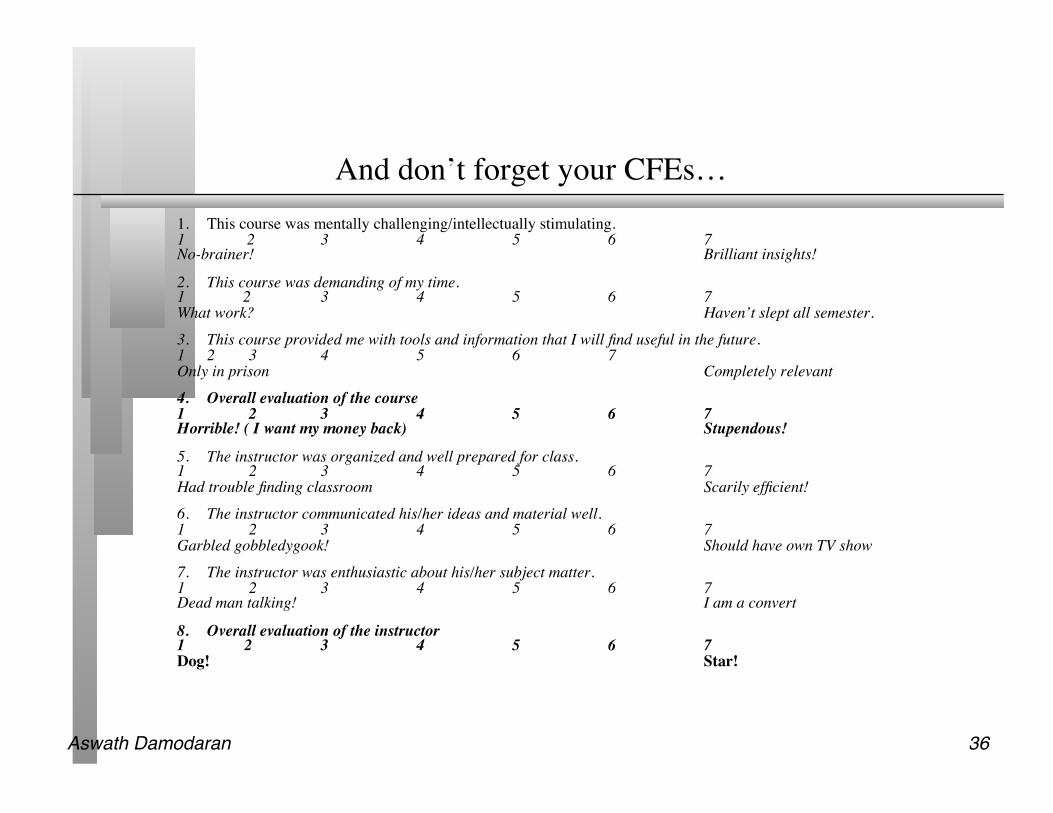
And don’t forget your CFEs… 1. This course was mentally challenging/intellectually stimulating. 1 2 3 4 5 6 7 No-brainer! Brilliant insights!
2. This course was demanding of my time. 1 2 3 4 5 6 7 What work? Haven’t slept all semester.
3. This course provided me with tools and information that I will find useful in the future. 1 2 3 4 5 6 7 Only in prison Completely relevant
4. Overall evaluation of the course 1 2 3 4 5 6 7 Horrible! ( I want my money back) Stupendous!
5. The instructor was organized and well prepared for class. 1 2 3 4 5 6 7 Had trouble finding classroom Scarily efficient!
6. The instructor communicated his/her ideas and material well. 1 2 3 4 5 6 7 Garbled gobbledygook! Should have own TV show
7. The instructor was enthusiastic about his/her subject matter. 1 2 3 4 5 6 7 Dead man talking! I am a convert
8. Overall evaluation of the instructor 1 2 3 4 5 6 7 Dog! Star!