CORPORATE FINANCE LECTURE NOTE PACKET 2 CAPITAL...
262
CORPORATE FINANCE LECTURE NOTE PACKET 2 CAPITAL STRUCTURE, DIVIDEND POLICY AND VALUATION Aswath Damodaran Spring 2016 Aswath Damodaran 1
Transcript of CORPORATE FINANCE LECTURE NOTE PACKET 2 CAPITAL...

CORPORATEFINANCELECTURENOTEPACKET2CAPITALSTRUCTURE,DIVIDENDPOLICYANDVALUATION
AswathDamodaran Spring2016
Aswath Damodaran 1

CAPITALSTRUCTURE:THECHOICESANDTHETRADEOFF“Neitheraborrowernoralenderbe”Someonewhoobviouslyhatedthispartofcorporate finance
Aswath Damodaran 2

3
Firstprinciples
Aswath Damodaran
3

4
TheChoicesinFinancing
Aswath Damodaran
4
¨ Thereareonlytwowaysinwhichabusiness canraisemoney.¤ Thefirstisdebt.Theessence ofdebt isthatyoupromise tomakefixed
paymentsinthefuture (interestpaymentsandrepayingprincipal). Ifyoufailtomakethosepayments,youlosecontrolofyourbusiness.
¤ Theother isequity.Withequity,youdogetwhatever cashflowsareleftoverafteryouhavemadedebtpayments.

5
GlobalPatternsinFinancing…
Aswath Damodaran
5

6
AndamuchgreaterdependenceonbankloansoutsidetheUS…
Aswath Damodaran
6

7
Assessingtheexistingfinancingchoices:Disney,Vale,TataMotors,Baidu &Bookscape
Aswath Damodaran
7

8

9
TheTransitionalPhases..
Aswath Damodaran
9
¨ Thetransitionsthatweseeatfirms– fromfullyownedprivatebusinessestoventurecapital,fromprivatetopublicandsubsequentseasonedofferingsareallmotivatedprimarilybytheneedforcapital.
¨ Ineachtransition,though,therearecostsincurredbytheexistingowners:¤ Whenventurecapitalistsenter thefirm,theywilldemandtheir fair
shareandmoreoftheownershipofthefirmtoprovideequity.¤ Whenafirmdecides togopublic,ithastotradeoffthegreateraccess
tocapitalmarketsagainsttheincreased disclosure requirements (thatemanate frombeingpubliclylists),lossofcontrolandthetransactionscostsofgoingpublic.
¤ Whenmakingseasoned offerings, firmshavetoconsider issuancecostswhilemanagingtheirrelationswithequityresearch analystsandrat

10
Measuringafirm’sfinancingmix…
Aswath Damodaran
10
¨ Thesimplestmeasureofhowmuchdebtandequityafirmisusingcurrentlyistolookattheproportionofdebtinthetotalfinancing.Thisratioiscalledthedebttocapitalratio:DebttoCapitalRatio=Debt/(Debt+Equity)
¨ Debtincludesallinterestbearingliabilities,shorttermaswellaslongterm.Itshouldalsoincludeothercommitmentsthatmeetthecriteriafordebt:contractuallypre-setpaymentsthathavetobemade,nomatterwhatthefirm’sfinancialstanding.
¨ Equitycanbedefinedeitherinaccountingterms(asbookvalueofequity)orinmarketvalueterms(baseduponthecurrentprice).Theresultingdebtratioscanbeverydifferent.

11
TheFinancingMixQuestion
Aswath Damodaran
11
¨ Indecidingtoraisefinancingforabusiness,isthereanoptimalmixofdebtandequity?¤ Ifyes,whatisthetradeoffthatletsusdeterminethisoptimalmix?
n Whatarethebenefits ofusingdebtinsteadofequity?n Whatarethecostsofusingdebtinsteadofequity?
¤ Ifnot,whynot?

12
TheIllusoryBenefitsofDebt
¨ Atfirstsight,thebenefitofdebtseemsobvious.Thecostofdebtislowerthanthecostofequity.
¨ Thatbenefitisanillusion,though,becausedebtischeaperthanequityforasimplereason.Thelendergetsbothfirstclaimonthecashflowsandacontractuallypre-setcashflow.Theequityinvestorislastinlineandhastodemandahigherrateofreturnthanthelenderdoww.
¨ Byborrowingmoneyatalowerrate,youarenotmakingabusinessmorevaluable,butjustmovingtheriskaround.
Aswath Damodaran
12

13
CostsandBenefitsofDebt
Aswath Damodaran
13
¨ BenefitsofDebt¤ TaxBenefits:Thetaxcodeistiltedinfavorofdebt,withinterestpaymentsbeingtaxdeductible inmostpartsoftheworld,whilecashflowstoequity arenot.
¤ Addsdisciplinetomanagement:Whenmanagersaresloppyintheirprojectchoices,borrowingmoneymaymake themlessso.
¨ CostsofDebt¤ BankruptcyCosts:Borrowingmoneywill increaseyourexpectedprobability andcostofbankruptcy.
¤ AgencyCosts:What’sgoodforstockholders isnotalwayswhat’sgoodforlenders andthatcreatesfrictionandcosts.
¤ LossofFutureFlexibility:Usingupdebtcapacitytodaywillmeanthatyouwillnotbeabletodrawonitinthefuture.

14
TaxBenefitsofDebt
Aswath Damodaran
14
¨ Whenyouborrowmoney,youareallowedtodeductinterestexpensesfromyourincometoarriveattaxableincome.Thisreducesyourtaxes.Whenyouuseequity,youarenotallowedtodeductpaymentstoequity(suchasdividends)toarriveattaxableincome.
¨ Thedollartaxbenefitfromtheinterestpaymentinanyyearisafunctionofyourtaxrateandtheinterestpayment:¤ Taxbenefiteachyear=TaxRate*InterestPaymentThecaveatisthatyouneedtohave theincometocoverinterestpaymentstogetthistaxbenefit.
¨ Proposition1:Otherthingsbeingequal,thehigherthemarginaltaxrateofabusiness,themoredebtitwillhaveinitscapitalstructure.

15
TheEffectsofTaxes
Aswath Damodaran
15
¨ Youarecomparingthedebtratiosofrealestatecorporations,whichpaythecorporatetaxrate,andrealestateinvestmenttrusts,whicharenottaxed,butarerequiredtopay95%oftheirearningsasdividendstotheirstockholders.Whichofthesetwogroupswouldyouexpecttohavethehigherdebtratios?
a. Therealestatecorporationsb. Therealestateinvestmenttrustsc. Cannottell,withoutmoreinformation

16
Debtaddsdisciplinetomanagement
Aswath Damodaran
16
¨ Ifyouaremanagersofafirmwithnodebt,andyougeneratehighincomeandcashflowseachyear,youtendtobecomecomplacent.Thecomplacencycanleadtoinefficiencyandinvestinginpoorprojects.Thereislittleornocostbornebythemanagers
¨ Forcingsuchafirmtoborrowmoneycanbeanantidotetothecomplacency.Themanagersnowhavetoensurethattheinvestmentstheymakewillearnatleastenoughreturntocovertheinterestexpenses.Thecostofnotdoingsoisbankruptcyandthelossofsuchajob.

17
DebtandDiscipline
Aswath Damodaran
17
¨ Assumethatyoubuyintothisargumentthatdebtaddsdisciplinetomanagement.Whichofthefollowingtypesofcompanieswillmostbenefitfromdebtaddingthisdiscipline?
a. Conservativelyfinanced(verylittledebt),privatelyownedbusinesses
b. Conservativelyfinanced,publiclytradedcompanies,withstocksheldbymillionsofinvestors,noneofwhomholdalargepercentofthestock.
c. Conservativelyfinanced,publiclytradedcompanies,withanactivistandprimarilyinstitutionalholding.

18
BankruptcyCost
Aswath Damodaran
18
¨ Theexpectedbankruptcycostisafunctionoftwovariables--¤ theprobabilityofbankruptcy,whichwilldependuponhowuncertain
youareaboutfuturecashflows¤ thecostofgoingbankrupt
n directcosts:LegalandotherDeadweightCostsn indirectcosts:Costsarisingbecause peopleperceive youtobeinfinancialtrouble
¨ Proposition2:Firmswithmorevolatileearningsandcashflowswillhavehigherprobabilitiesofbankruptcyatanygivenlevelofdebtandforanygivenlevelofearnings.
¨ Proposition3:Otherthingsbeingequal,thegreatertheindirectbankruptcycost,thelessdebtthefirmcanaffordtouseforanygivenlevelofdebt.

19
Debt&BankruptcyCost
Aswath Damodaran
19
¨ Rankthefollowingcompaniesonthemagnitudeofbankruptcycostsfrommosttoleast,takingintoaccountbothexplicitandimplicitcosts:
a. AGroceryStoreb. AnAirplaneManufacturerc. HighTechnologycompany

20
AgencyCost
Aswath Damodaran
20
¨ Anagencycostarises whenever youhiresomeone elsetodosomethingforyou.Itarisesbecauseyourinterests(as theprincipal)maydeviate fromthoseofthepersonyouhired(astheagent).
¨ Whenyoulendmoneytoabusiness, youareallowingthestockholders tousethatmoneyinthecourseofrunningthatbusiness. Stockholdersinterestsaredifferent fromyourinterests, because¤ You(aslender)areinterested ingettingyourmoneyback¤ Stockholders areinterestedinmaximizing theirwealth
¨ Insomecases, theclashofinterestscanleadtostockholders¤ Investinginriskierprojects thanyouwouldwantthemto¤ Payingthemselves largedividends whenyouwouldratherhavethemkeepthecash
inthebusiness.¨ Proposition4:Otherthingsbeingequal,thegreatertheagencyproblems
associatedwithlendingtoafirm,thelessdebtthefirmcanaffordtouse.

21
DebtandAgencyCosts
Aswath Damodaran
21
¨ Assumethatyouareabank.Whichofthefollowingbusinesseswouldyouperceivethegreatestagencycosts?
a. ATechnologyfirmb. ALargeRegulatedElectricUtilityc. ARealEstateCorporation¨ Why?
22
Lossoffuturefinancingflexibility
Aswath Damodaran
22
¨ Whenafirmborrowsuptoitscapacity,itlosestheflexibilityoffinancingfutureprojectswithdebt.
¨ Thus,ifthefirmisfacedwithanunexpectedinvestmentopportunityorabusinessshortfall,itwillnotbeabletodrawondebtcapacity,ifithasalreaduseditup.
¨ Proposition5:Otherthingsremainingequal,themoreuncertainafirmisaboutitsfuturefinancingrequirementsandprojects,thelessdebtthefirmwilluseforfinancingcurrentprojects.

23
Whatmanagersconsiderimportantindecidingonhowmuchdebttocarry...
Aswath Damodaran
23
¨ AsurveyofChiefFinancialOfficersoflargeU.S.companiesprovidedthefollowingranking(frommostimportanttoleastimportant)forthefactorsthattheyconsideredimportantinthefinancingdecisionsFactor Ranking (0-5)1.Maintainfinancialflexibility 4.552.Ensurelong-term survival 4.553.MaintainPredictable SourceofFunds 4.054.Maximize StockPrice 3.995.Maintainfinancial independence 3.886.Maintainhighdebtrating 3.567.Maintaincomparabilitywithpeergroup 2.47

24
Debt:Summarizingthetradeoff
Aswath Damodaran
24

25
TheTradeoffforDisney,Vale,TataMotorsandBaidu
Aswath Damodaran
25
Debt trade off Discussion of relative benefits/costs Tax benefits Marginal tax rates of 40% in US (Disney & Bookscape), 32.5% in India (Tata
Motors), 25% in China (Baidu) and 34% in Brazil (Vale), but there is an offsetting tax benefit for equity in Brazil (interest on equity capital is deductible).
Added Discipline
The benefits should be highest at Disney, where there is a clear separation of ownership and management and smaller at the remaining firms.
Expected Bankruptcy Costs
Volatility in earnings: Higher at Baidu (young firm in technology), Tata Motors (cyclicality) and Vale (commodity prices) and lower at Disney (diversified across entertainment companies). Indirect bankruptcy costs likely to be highest at Tata Motors, since it’s products (automobiles) have long lives and require service and lower at Disney and Baidu.
Agency Costs Highest at Baidu, largely because it’s assets are intangible and it sells services and lowest at Vale (where investments are in mines, highly visible and easily monitored) and Tata Motors (tangible assets, family group backing). At Disney, the agency costs will vary across its business, higher in the movie and broadcasting businesses and lower at theme parks.
Flexibility needs
Baidu will value flexibility more than the other firms, because technology is a shifting and unpredictable business, where future investment needs are difficult to forecast. The flexibility needs should be lower at Disney and Tata Motors, since they are mature companies with well-established investment needs. At Vale, the need for investment funds may vary with commodity prices, since the firm grows by acquiring both reserves and smaller companies. At Bookscape, the difficulty of accessing external capital will make flexibility more necessary.

26
6 ApplicationTest:Wouldyouexpectyourfirmtogainorlosefromusingalotofdebt?
Aswath Damodaran
26
¨ Considering,foryourfirm,¤ Thepotentialtaxbenefitsofborrowing¤ Thebenefitsofusingdebtasadisciplinarymechanism¤ Thepotentialforexpectedbankruptcycosts¤ Thepotentialforagencycosts¤ Theneedforfinancialflexibility
¨ Wouldyouexpectyourfirmtohaveahighdebtratiooralowdebtratio?
¨ Doesthefirm’scurrentdebtratiomeetyourexpectations?

27
AHypotheticalScenario
Aswath Damodaran
27
Assumethatyouliveinaworldwhere(a)Therearenotaxes(b)Managershavestockholderinterestsatheartanddowhat’sbestforstockholders.(c)Nofirmevergoesbankrupt(d)Equityinvestorsarehonestwithlenders;thereisnosubterfugeorattempttofindloopholesinloanagreements.(e)Firmsknowtheirfuturefinancingneedswithcertainty
¨Whathappenstothetradeoffbetweendebtandequity?Howmuchshouldafirmborrow?

28
TheMiller-ModiglianiTheorem
Aswath Damodaran
28
¨ Inanenvironment, where therearenotaxes,defaultriskoragencycosts,capitalstructure isirrelevant.
¨ IftheMillerModiglianitheoremholds:¤ Afirm'svaluewillbedetermined thequalityofitsinvestments andnot
byitsfinancingmix.¤ Thecostofcapitalofthefirmwillnotchangewithleverage. Asafirm
increases itsleverage, thecostofequitywillincrease justenough tooffsetanygainstotheleverage.

29
Whatdofirmslookatinfinancing?
Aswath Damodaran
29
¨ Therearesomewhoarguethatfirmsfollowafinancinghierarchy,withretainedearningsbeingthemostpreferredchoiceforfinancing,followedbydebtandthatnewequityistheleastpreferredchoice.Inparticular,¤ Managersvalueflexibility.Managersvaluebeingabletousecapital(onnewinvestments orassets)withoutrestrictionsonthatuseorhavingtoexplain itsusetoothers.
¤ Managersvaluecontrol.Managerslikebeingabletomaintaincontroloftheirbusinesses.
¨ Withflexibilityandcontrolbeingkeyfactors:¤ Would youratheruseinternalfinancing (retainedearnings)orexternalfinancing?
¤ Withexternalfinancing,wouldyouratherusedebtorequity?

30
Preferencerankingslong-termfinance:Resultsofasurvey
Aswath Damodaran
30
Ranking Source Score
1 Retained Earnings 5.61
2 Straight Debt 4.88
3 Convertible Debt 3.02
4 External Common Equity 2.42
5 Straight Preferred Stock 2.22
6 Convertible Preferred 1.72

31
Andtheunsurprisingconsequences..
Aswath Damodaran
31
0%
10%
20%
30%
40%
50%
60%
70%
80%
90%
100%
% o
f Fin
anci
ng fr
om D
iffer
ent S
ourc
es
Year
External and Internal Financing at US Firms
External Financing from Debt
External Financing from Common and Preferred Stock
Internal Financing
In

32
FinancingChoices
Aswath Damodaran
32
¨ YouarereadingtheWallStreetJournalandnoticeatombstoneadforacompany,offeringtosellconvertiblepreferredstock.Whatwouldyouhypothesizeaboutthehealthofthecompanyissuingthesesecurities?
a. Nothingb. Healthierthantheaveragefirmc. Inmuchmorefinancialtroublethantheaverage
firm

CAPITALSTRUCTURE:FINDINGTHERIGHTFINANCINGMIX
Youcanhavetoomuchdebt…ortoolittle..
Aswath Damodaran 33

34
TheBigPicture..
Aswath Damodaran
34

35
PathwaystotheOptimal
Aswath Damodaran
35
1. TheCostofCapitalApproach:Theoptimaldebtratioistheonethatminimizesthecostofcapitalforafirm.
2. TheEnhancedCostofCapitalapproach:Theoptimaldebtratioistheonethatgeneratesthebestcombinationof(low)costofcapitaland(high)operatingincome.
3. TheAdjustedPresentValueApproach:Theoptimaldebtratioistheonethatmaximizestheoverallvalueofthefirm.
4. TheSectorApproach:Theoptimaldebtratioistheonethatbringsthefirmclosestoitspeergroupintermsoffinancingmix.
5. TheLifeCycleApproach:Theoptimaldebtratioistheonethatbestsuitswherethefirmisinitslifecycle.

36
I.TheCostofCapitalApproach
Aswath Damodaran
36
¨ ValueofaFirm=PresentValueofCashFlowstotheFirm,discountedbackatthecostofcapital.
¨ Ifthecashflowstothefirmareheldconstant,andthecostofcapitalisminimized,thevalueofthefirmwillbemaximized.

37
MeasuringCostofCapital
Aswath Damodaran
37
¨ Recappingourdiscussionofcostofcapital:¨ Thecostofdebtisthemarket interest ratethatthefirmhastopayonits
longtermborrowing today,netoftaxbenefits. Itwillbeafunctionof:(a)Thelong-term riskfree rate(b)Thedefaultspread forthecompany, reflecting itscreditrisk(c)Thefirm’smarginal taxrate
¨ Thecostofequityreflects theexpected returndemanded bymarginalequityinvestors. Iftheyarediversified, onlytheportionoftheequityriskthatcannotbediversified away(betaorbetas)willbepriced intothecostofequity.
¨ Thecostofcapitalisthecostofeachcomponentweightedbyitsrelativemarketvalue.Costofcapital=Costofequity(E/(D+E)) +After-tax costofdebt(D/(D+E))

38
CostsofDebt&Equity
Aswath Damodaran
38
¨ AnarticleinanAsianbusinessmagazinearguedthatequitywascheaperthandebt,becausedividendyieldsaremuchlowerthaninterestratesondebt.Doyouagreewiththisstatement?
a. Yesb. No¨ Canequityeverbecheaperthandebt?a. Yesb. No

39
ApplyingCostofCapitalApproach:TheTextbookExample
Aswath Damodaran
39
Assume the firm has $200 million in cash flows, expected to grow 3% a year forever.

40
TheU-shapedCostofCapitalGraph…
Aswath Damodaran
40

41
CurrentCostofCapital:Disney
¨ ThebetaforDisney’s stockinNovember 2013was1.0013.TheT.bondrateatthattimewas2.75%.Usinganestimatedequity riskpremium of5.76%,weestimated thecostofequityforDisney tobe8.52%:CostofEquity=2.75%+1.0013(5.76%)=8.52%
¨ Disney’sbondratinginMay2009wasA,andbasedonthisrating,theestimatedpretaxcostofdebtforDisney is3.75%.Usingamarginal taxrateof36.1,theafter-taxcostofdebtforDisney is2.40%.After-TaxCostofDebt =3.75%(1– 0.361)=2.40%
¨ Thecostofcapitalwascalculatedusingthese costsandtheweightsbasedonmarket valuesofequity(121,878)anddebt(15.961):Costofcapital=
Aswath Damodaran

42
MechanicsofCostofCapitalEstimation
Aswath Damodaran
42
1.EstimatetheCostofEquityatdifferentlevelsofdebt:¤ Equitywillbecome riskier ->Betawill increase->CostofEquitywill increase.
¤ Estimationwilluseleveredbetacalculation2.EstimatetheCostofDebtatdifferentlevelsofdebt:
¤ Defaultriskwillgoupandbondratingswill godownasdebtgoesup->CostofDebtwill increase.
¤ Toestimatingbondratings,wewillusetheinterestcoverageratio(EBIT/Interestexpense)
3.EstimatetheCostofCapitalatdifferentlevelsofdebt4.CalculatetheeffectonFirmValueandStockPrice.

43
Layingthegroundwork:1.Estimatetheunleveredbetaforthefirm
¨ TheRegressionBeta:Oneapproachistouse theregressionbeta(1.25)andthenunlever, usingtheaveragedebttoequityratio(19.44%)duringtheperiodoftheregression toarriveatanunlevered beta.
Unlevered beta==1.25/(1+(1- 0.361)(0.1944))=1.1119¨ TheBottomupBeta:Alternatively, wecanbacktothesourceand
estimate itfromthebetasofthebusinesses.
Aswath Damodaran
Business Revenues EV/SalesValueofBusiness
ProportionofDisney
Unleveredbeta Value Proportion
MediaNetworks $20,356 3.27 $66,580 49.27% 1.03 $66,579.81 49.27%Parks&Resorts $14,087 3.24 $45,683 33.81% 0.70 $45,682.80 33.81%StudioEntertainment $5,979 3.05 $18,234 13.49% 1.10 $18,234.27 13.49%ConsumerProducts $3,555 0.83 $2,952 2.18% 0.68 $2,951.50 2.18%Interactive $1,064 1.58 $1,684 1.25% 1.22 $1,683.72 1.25%DisneyOperations $45,041 $135,132 100.00% 0.9239 $135,132.11 100.00%

44
2.GetDisney’scurrentfinancials…
Aswath Damodaran

45
I.CostofEquity
Levered Beta = 0.9239 (1 + (1- .361) (D/E))Cost of equity = 2.75% + Levered beta * 5.76%
Aswath Damodaran

46
EstimatingCostofDebt
Startwiththemarketvalueofthefirm==121,878+$15,961=$137,839millionD/(D+E) 0.00% 10.00% DebttocapitalD/E 0.00% 11.11% D/E=10/90=.1111$Debt $0 $13,784 10%of$137,839
EBITDA $12,517 $12,517 Sameas0%debtDepreciation $ 2,485 $ 2,485 Sameas0%debtEBIT $10,032 $10,032 Sameas0%debtInterest $0 $434 Pre-taxcostofdebt*$Debt
Pre-taxInt.cov ∞ 23.10 EBIT/ InterestExpensesLikelyRating AAA AAA FromRatings tablePre-taxcostofdebt 3.15% 3.15% Riskless Rate+Spread
Aswath Damodaran

47
TheRatingsTable
T.Bond rate =2.75%
Aswath Damodaran
Interest coverage ratio is Rating is Spread is Interest rate> 8.50 Aaa/AAA 0.40% 3.15%
6.5 – 8.5 Aa2/AA 0.70% 3.45%5.5 – 6.5 A1/A+ 0.85% 3.60%4.25 – 5.5 A2/A 1.00% 3.75%3 – 4.25 A3/A- 1.30% 4.05%2.5 -3 Baa2/BBB 2.00% 4.75%
2.25 –2.5 Ba1/BB+ 3.00% 5.75%2 – 2.25 Ba2/BB 4.00% 6.75%1.75 -2 B1/B+ 5.50% 8.25%
1.5 – 1.75 B2/B 6.50% 9.25%1.25 -1.5 B3/B- 7.25% 10.00%0.8 -1.25 Caa/CCC 8.75% 11.50%0.65 – 0.8 Ca2/CC 9.50% 12.25%0.2 – 0.65 C2/C 10.50% 13.25%
<0.2 D2/D 12.00% 14.75%

48
ATest:Canyoudothe30%level?
Aswath Damodaran
Iteration 1
(Debt @AAA rate) Iteration 2
(Debt @AA rate) D/(D + E) 20.00% 30.00% 30.00% D/E 25.00% $ Debt $27,568 EBITDA $12,517 Depreciation $2,485 EBIT $10,032 Interest expense $868 Interest coverage ratio 11.55 Likely rating AAA Pretax cost of debt 3.15%

49
BondRatings,CostofDebtandDebtRatios
Aswath Damodaran

50
StatedversusEffectiveTaxRates
¨ Youneedtaxableincomeforinteresttoprovideataxsavings.NotethattheEBITatDisney is$10,032million.Aslongasinterestexpenses arelessthan$10,032million, interestexpenses remainfullytax-deductible andearnthe36.1%taxbenefit. Atan60%debtratio,theinterestexpenses are$9,511millionandthetaxbenefit istherefore36.1%ofthisamount.
¨ Ata70%debtratio,however, theinterestexpensesballoon to$11,096million,whichisgreaterthantheEBITof$10,032million.Weconsider thetaxbenefit ontheinterestexpenses uptothisamount:¤ MaximumTaxBenefit=EBIT*MarginalTaxRate=$10,032million*0.361
=$3,622million¤ AdjustedMarginalTaxRate=MaximumTaxBenefit/InterestExpenses=
$3,622/$11,096 =32.64%
Aswath Damodaran

51
Disney’scostofcapitalschedule…
Aswath Damodaran

52
Disney:CostofCapitalChart
Aswath Damodaran
!

53
Disney:CostofCapitalChart:1997
Aswath Damodaran
53
10.50%&
11.00%&
11.50%&
12.00%&
12.50%&
13.00%&
13.50%&
14.00%&
0.00%&
10.00%
&
20.00%
&
30.00%
&
40.00%
&
50.00%
&
60.00%
&
70.00%
&
80.00%
&
90.00%
&
Cost%of%C
apita
l%
Debt%Ra/o%
Note the kink in the cost of capital graph at 60% debt. What is causing it?

54
ThecostofcapitalapproachsuggeststhatDisneyshoulddothefollowing…
¨ Disneycurrentlyhas$15.96billionindebt.Theoptimaldollardebt(at40%)isroughly$55.1billion.Disneyhasexcessdebtcapacityof39.14billion.
¨ Tomovetoitsoptimalandgaintheincreaseinvalue,Disneyshouldborrow$39.14billionandbuybackstock.
¨ Giventhemagnitudeofthisdecision,youshouldexpecttoanswerthreequestions:¤ Whyshouldwedoit?¤ Whatifsomething goeswrong?¤ Whatifwedon’twant(orcannot)buybackstockandwanttomake investments withtheadditionaldebtcapacity?
Aswath Damodaran

55
Whyshouldwedoit?EffectonFirmValue– FullValuationStep1:Estimate thecashflowstoDisneyasafirm
EBIT(1– TaxRate)=10,032(1– 0.361)= $6,410+Depreciationandamortization= $2,485– Capitalexpenditures= $5,239– Changeinnoncashworkingcapital $0Freecashflowtothefirm= $3,657
¨Step2:Backouttheimplied growthrateinthecurrentmarketvalueCurrententerprisevalue=$121,878+15,961- 3,931=133,908Valueoffirm=$133,908=
Growthrate=(FirmValue*CostofCapital– CFtoFirm)/(FirmValue+CFtoFirm)=(133,908*0.0781– 3,657)/(133,908+3,657)=0.0494or4.94%
¨Step3:Revaluethefirmwiththenewcostofcapital¤Firmvalue=
¤Increaseinfirmvalue=$172,935- $133,908=$39,027million
FCFF0 (1+g)(Cost of Capital -g)
=3, 657(1+g)(.0781 -g)
FCFF0 (1+g)(Cost of Capital -g)
=3, 657(1.0494)
(.0716 -0.0484)= $172, 935 million
Aswath Damodaran

56
EffectonValue:Incrementalapproach
¨ Inthisapproach,westartwiththecurrentmarketvalueandisolatetheeffect ofchangingthecapitalstructureonthecashflowandtheresultingvalue.EnterpriseValuebeforethechange=$133,908millionCostoffinancingDisneyatexistingdebtratio=$133,908*0.0781=$10,458millionCostoffinancingDisneyatoptimaldebtratio=$133,908*0.0716=$9,592millionAnnualsavingsincostoffinancing=$10,458million– $9,592million=$866million
Enterprisevalueafterrecapitalization=Existingenterprisevalue+PVofSavings=$133,908+$19,623=$153,531million
Aswath Damodaran
Increase in Value= Annual Savings next year(Cost of Capital - g)
=$866
(0.0716 - 0.0275)= $19, 623 million

57
Fromfirmvaluetovaluepershare:TheRationalInvestorSolution
¨ Becausetheincreaseinvalueaccruesentirelytostockholders,wecanestimatetheincreaseinvaluepersharebydividingbythetotalnumberofsharesoutstanding(1,800million).¤ IncreaseinValueperShare=$19,623/1800=$10.90¤ NewStockPrice=$67.71+$10.90=$78.61
¨ Implicitinthiscomputationistheassumptionthattheincreaseinfirmvaluewillbespreadevenlyacrossboththestockholderswhoselltheirstockbacktothefirmandthosewhodonotandthatiswhywetermthisthe“rational”solution,sinceitleavesinvestorsindifferentbetweensellingbacktheirsharesandholdingontothem.
Aswath Damodaran

58
Themoregeneralsolution,givenabuybackprice¨ Startwiththebuybackpriceandcomputethenumberof
sharesoutstandingafterthebuyback:¤ Increase inDebt=Debtatoptimal– CurrentDebt¤ #Sharesafterbuyback=#Sharesbefore–
¨ Thencomputetheequityvalueaftertherecapitalization,startingwiththeenterprisevalueattheoptimal,addingbackcashandsubtractingoutthedebtattheoptimal:¤ Equityvalueafterbuyback=OptimalEnterprise value+Cash– Debt
¨ Dividetheequityvalueafterthebuybackbythepost-buybacknumberofshares.¤ Valuepershareafterbuyback=Equityvalueafterbuyback/Numberof
sharesafterbuyback
Aswath Damodaran
Increase in DebtShare Price

59
Let’stryaprice:Whatifcanbuysharesbackattheoldprice($67.71)?
¨ Startwiththebuybackpriceandcomputethenumberofsharesoutstandingafterthebuyback¤ Debtissued=$55,136- $15,961=$39,175million¤ #Sharesafterbuyback=1800- $39,175/$67.71=1221.43m
¨ Thencomputetheequityvalueaftertherecapitalization,startingwiththeenterprisevalueattheoptimal,addingbackcashandsubtractingoutthedebtattheoptimal:¤ Optimal EnterpriseValue=$153,531¤ Equityvalueafterbuyback=$153,531+$3,931– $55,136=$102,326
¨ Dividetheequityvalueafterthebuybackbythepost-buybacknumberofshares.¤ Valuepershareafterbuyback=$102,326/1221.43=$83.78
Aswath Damodaran

60
Backtotherationalprice($78.61):Hereistheproof
¨ Startwiththebuybackpriceandcomputethenumberofsharesoutstandingafterthebuyback¤ #Sharesafterbuyback=1800- $39,175/$78.61=1301.65m
¨ Thencomputetheequityvalueaftertherecapitalization,startingwiththeenterprisevalueattheoptimal,addingbackcashandsubtractingoutthedebtattheoptimal:¤ Optimal EnterpriseValue=$153,531¤ Equityvalueafterbuyback=$153,531+$3,931– $55,136=$102,326
¨ Dividetheequityvalueafterthebuybackbythepost-buybacknumberofshares.¤ Valuepershareafterbuyback=$102,326/1301.65=$78.61
Aswath Damodaran

61
2.Whatifsomethinggoeswrong?TheDownsideRisk
Aswath Damodaran
61
¨ Sensitivity toAssumptionsA.“Whatif” analysis
Theoptimaldebtratioisafunctionofourinputsonoperatingincome,taxratesandmacrovariables.Wecouldfocusononeortwokeyvariables–operatingincomeisanobviouschoice– andlookathistoryforguidanceonvolatilityinthatnumberandaskwhatifquestions.B.“EconomicScenario” Approach
Wecandeveloppossiblescenarios,baseduponmacrovariables,andexaminetheoptimaldebtratioundereachone.Forinstance,wecouldlookattheoptimaldebtratioforacyclicalfirmunderaboomeconomy,aregulareconomyandaneconomyinrecession.
¨ ConstraintonBondRatings/BookDebtRatiosAlternatively,wecanputconstraintsontheoptimaldebtratiotoreduceexposuretodownsiderisk.Thus,wecouldrequirethefirmtohaveaminimumrating,attheoptimaldebtratioortohaveabookdebtratiothatislessthana“specified”value.

62
Disney’sOperatingIncome:History
Aswath Damodaran
Recession Decline in Operating Income2009 Drop of 23.06%2002 Drop of 15.82%1991 Drop of 22.00%1981-82 Increased by 12%Worst Year Drop of 29.47%
Standard deviation in % change in EBIT = 19.17%

63
Disney:SafetyBuffers?
Aswath Damodaran

64
ConstraintsonRatings
¨ Managementoftenspecifiesa'desiredrating'belowwhichtheydonotwanttofall.
¨ Theratingconstraintisdrivenbythreefactors¤ itisonewayofprotectingagainstdownside riskinoperatingincome (sodonotdoboth)
¤ adropinratingsmightaffectoperatingincome¤ thereisanegofactorassociatedwithhighratings
¨ Caveat:Everyratingconstrainthasacost.¤ Thecostofaratingconstraintisthedifference between theunconstrainedvalueandthevalueofthefirmwiththeconstraint.
¤ Managersneedtobemadeawareofthecostsoftheconstraintstheyimpose.
Aswath Damodaran

65
RatingsConstraintsforDisney
¨ Atitsoptimaldebtratioof40%,DisneyhasanestimatedratingofA.
¨ IfmanagersinsistedonaAArating,theoptimaldebtratioforDisneyisthen30%andthecostoftheratingsconstraintisfairlysmall:CostofAARatingConstraint=Valueat40%Debt– Valueat30%Debt=$153,531m– $147,835m=$5,696million
¨ IfmanagersinsistedonaAAArating,theoptimaldebtratiowoulddropto20%andthecostoftheratingsconstraintwouldrise:CostofAAAratingconstraint=Valueat40%Debt– Valueat20%Debt=$153,531m– $141,406m=$12,125million
Aswath Damodaran

66
3.Whatifyoudonotbuybackstock..
Aswath Damodaran
66
¨ Theoptimaldebtratioisultimatelyafunctionoftheunderlyingriskinessofthebusinessinwhichyouoperateandyourtaxrate.
¨ Willtheoptimalbedifferentifyouinvestedinprojectsinsteadofbuyingbackstock?¤ No.Aslongastheprojectsfinancedareinthesamebusinessmixthatthecompanyhasalwaysbeeninandyourtaxratedoesnotchangesignificantly.
¤ Yes,iftheprojectsareinentirelydifferenttypesofbusinessesorifthetaxrateissignificantlydifferent.

67
Extensiontoafamilygroupcompany:TataMotor’sOptimalCapitalStructure
Tata Motors looks like it is over levered (29% actual versus 20% optimal), perhaps because it is drawing on the debt capacity of other companies in the Tata Group.
Aswath Damodaran

68
Extensiontoafirmwithvolatileearnings:Vale’sOptimalDebtRatio
Aswath Damodaran
Replacing Vale’s current operating income with the average over the last three years pushes up the optimal to 50%.
69
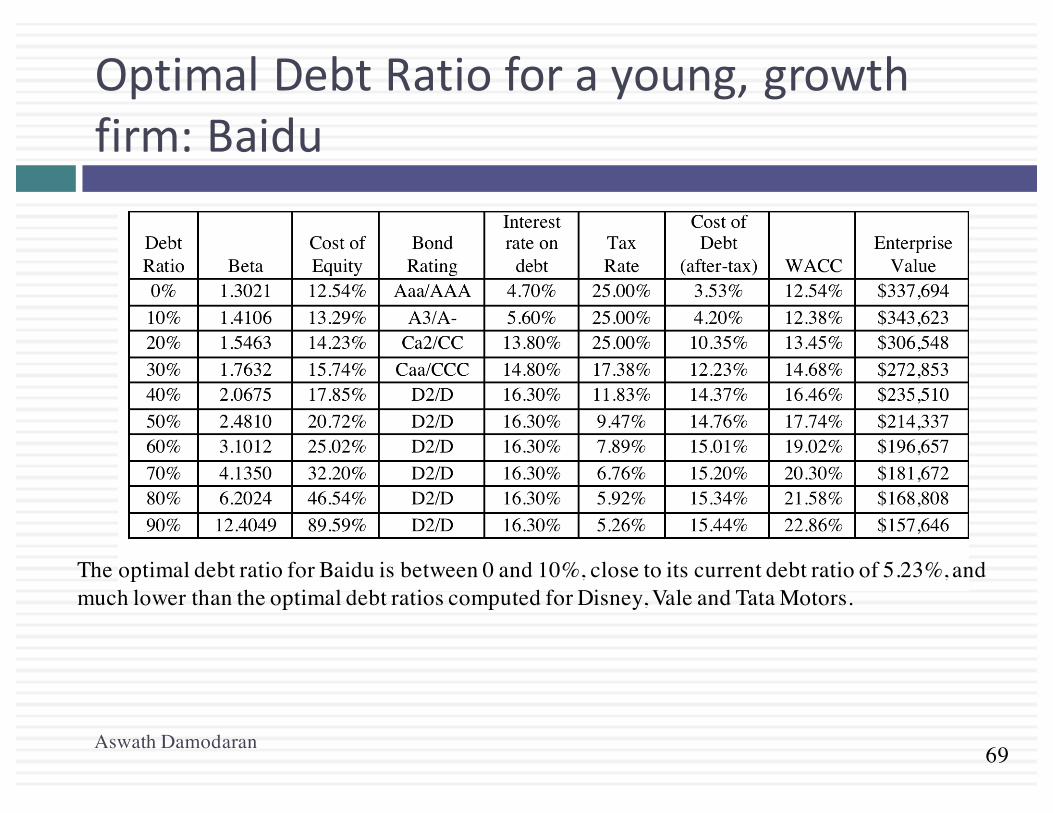
OptimalDebtRatioforayoung,growthfirm:Baidu
Aswath Damodaran
The optimal debt ratio for Baidu is between 0 and 10%, close to its current debt ratio of 5.23%, and much lower than the optimal debt ratios computed for Disney, Vale and Tata Motors.

70
ExtensiontoaprivatebusinessOptimalDebtRatioforBookscape
Aswath Damodaran
The firm value is maximized (and the cost of capital is minimized) at a debt ratio of 30%. At its existing debt ratio of 27.81%, Bookscape is at its optimal.
Debt value of leases = $12,136 million (only debt)Estimated market value of equity = Net Income * Average PE for Publicly Traded Book Retailers = 1.575 * 20 = $31.5 million Debt ratio = 12,136/(12,136+31,500) = 27.81%

71
LimitationsoftheCostofCapitalapproach
Aswath Damodaran
71
¨ Itisstatic:Themostcriticalnumberintheentireanalysisistheoperatingincome.Ifthatchanges,theoptimaldebtratiowillchange.
¨ Itignoresindirectbankruptcycosts:Theoperatingincomeisassumedtostayfixedasthedebtratioandtheratingchanges.
¨ BetaandRatings:Itisbaseduponrigidassumptionsofhowmarketriskanddefaultriskgetborneasthefirmborrowsmoremoneyandtheresultingcosts.

72
II.EnhancedCostofCapitalApproach
Aswath Damodaran
72
¨ Distresscostaffectedoperatingincome:Intheenhancedcostofcapitalapproach,theindirectcostsofbankruptcyarebuiltintotheexpectedoperatingincome.Astheratingofthefirmdeclines,theoperatingincomeisadjustedtoreflectthelossinoperatingincomethatwilloccurwhencustomers,suppliersandinvestorsreact.
¨ Dynamicanalysis:Ratherthanlookatasinglenumberforoperatingincome,youcandrawfromadistributionofoperatingincome(thusallowingfordifferentoutcomes).

73
EstimatingtheDistressEffect- Disney
Aswath Damodaran
73
Rating Drop in EBITDA (Low)
Drop in EBITDA (Medium)
Drop in EBITDA (High)
To A No effect No effect 2.00% To A- No effect 2.00% 5.00% To BBB 5.00% 10.00% 15.00% To BB+ 10.00% 20.00% 25.00% To B- 15.00% 25.00% 30.00% To C 25.00% 40.00% 50.00% To D 30.00% 50.00% 100.00%

74
TheOptimalDebtRatiowithIndirectBankruptcyCosts
Aswath Damodaran
74
The optimal debt ratio stays at 40% but the cliff becomes much steeper.
Debt Ratio BetaCost of Equity
Bond Rating
Interest rate on debt Tax Rate
Cost of Debt (after-tax) WACC
Enterprise Value
0% 0.9239 8.07% Aaa/AAA 3.15% 36.10% 2.01% 8.07% $122,633 10% 0.9895 8.45% Aaa/AAA 3.15% 36.10% 2.01% 7.81% $134,020 20% 1.0715 8.92% Aaa/AAA 3.15% 36.10% 2.01% 7.54% $147,739 30% 1.1769 9.53% Aa2/AA 3.45% 36.10% 2.20% 7.33% $160,625 40% 1.3175 10.34% A2/A 3.75% 36.10% 2.40% 7.16% $172,933 50% 1.5573 11.72% C2/C 11.50% 31.44% 7.88% 9.80% $35,782 60% 1.9946 14.24% Caa/CCC 13.25% 22.74% 10.24% 11.84% $25,219 70% 2.6594 18.07% Caa/CCC 13.25% 19.49% 10.67% 12.89% $21,886 80% 3.9892 25.73% Caa/CCC 13.25% 17.05% 10.99% 13.94% $19,331 90% 7.9783 48.72% Caa/CCC 13.25% 15.16% 11.24% 14.99% $17,311

75
ExtendingthisapproachtoanalyzingFinancialServiceFirms
Aswath Damodaran
75
¨ Interestcoverageratiospreads,whicharecritical indeterminingthebondratings,havetobeestimated separately forfinancialservice firms; applyingmanufacturing companyspreadswill resultinabsurdlylowratingsforeventhesafestbanksandverylowoptimaldebtratios.
¨ Itisdifficulttoestimate thedebtonafinancialservice company’sbalancesheet.Giventhemixofdeposits, repurchaseagreements,short-term financing, andotherliabilities thatmayappearonafinancial service firm’sbalancesheet,onesolution istofocusonlyonlong-termdebt,defined tightly,andtouseinterestcoverageratiosdefinedusingonlylong-term interestexpenses.
¨ Financialservice firmsareregulatedandhavetomeet capitalratiosthataredefined intermsofbookvalue.If,intheprocessofmovingtoanoptimalmarket valuedebtratio,thesefirmsviolate thebookcapitalratios,theycouldputthemselves injeopardy.

76
CapitalStructureforabank:ARegulatoryCapitalApproach¨ Considerabankwith$100millioninloansoutstandingandabookvalueof
equityof$6million.Furthermore,assumethattheregulatoryrequirementisthatequitycapitalbemaintainedat5%ofloansoutstanding.Finally,assumethatthisbankwantstoincreaseitsloanbaseby$50millionto$150millionandtoaugmentitsequitycapitalratioto7%ofloansoutstanding.LoansoutstandingafterExpansion =$150millionEquityafterexpansion =7%of$150 =$10.5millionExistingEquity =$6.0millionNewEquityneeded =$4.5million
¨ Yourneedfor“external”equityasabank/financialservicecompanywilldependupona.Yourgrowthrate:Highergrowth->Moreexternalequityb.ExistingcapitalizationvsTargetcapitalization:Undercapitalized->Moreexternalequityc.Currentearnings:Lessearnings->Moreexternalequityd.Currentdividends:Moredividends->Moreexternalequity
Aswath Damodaran

77
DeutscheBank’sFinancialMix
Current 1 2 3 4 5Asset Base 439,851 €453,047 €466,638 €480,637 €495,056 €509,908 €Capital ratio 15.13% 15.71% 16.28% 16.85% 17.43% 18.00%Tier 1 Capital 66,561 € 71,156 € 75,967 € 81,002 € 86,271 € 91,783 €Change in regulatory capital 4,595 € 4,811 € 5,035 € 5,269 € 5,512 €Book Equity 76,829 € 81,424 € 86,235 € 91,270 € 96,539 € 102,051 €
ROE -1.08% 0.74% 2.55% 4.37% 6.18% 8.00%Net Income -716 € 602 € 2,203 € 3,988 € 5,971 € 8,164 €- Investment in Regulatory Capital 4,595 € 4,811 € 5,035 € 5,269 € 5,512 €FCFE -3,993 € -2,608 € -1,047 € 702 € 2,652 €
Aswath Damodaran
77
The cumulative FCFE over the next 5 years is -4,294 million Euros. Clearly, it does not make the sense to pay dividends or buy back stock.

78
FinancingStrategiesforafinancialinstitution
Aswath Damodaran
78
¨ TheRegulatoryminimum strategy:Inthisstrategy,financialservicefirmstrytostaywiththebareminimum equity capital,asrequiredbytheregulatoryratios.Inthemostaggressive versionsofthisstrategy,firmsexploit loopholes intheregulatory framework toinvestinthosebusinesses whereregulatory capitalratiosaresettoolow(relative totheriskofthesebusinesses).
¨ TheSelf-regulatory strategy:Theobjectiveforabankraisingequityisnottomeet regulatory capitalratiosbuttoensurethatlossesfromthebusiness canbecoveredbytheexistingequity. Ineffect,financial service firmscanassesshowmuchequity theyneedtoholdbyevaluating theriskiness oftheirbusinesses andthepotentialforlosses.
¨ Combination strategy:Inthisstrategy,theregulatory capitalratiosoperateasafloorforestablishedbusinesses, withthefirmaddingbuffersforsafetywhereneeded..

79
DeterminantsoftheOptimalDebtRatio:1.Themarginaltaxrate
Aswath Damodaran
79
¨ Theprimarybenefitofdebtisataxbenefit.Thehigherthemarginaltaxrate,thegreaterthebenefittoborrowing:

80
2.Pre-taxCashflowReturn
Aswath Damodaran
80
Company EBITDA EBIT Enterprise Value EBITDA/EV EBIT/EV
Optimal Debt
Optimal Debt Ratio
Disney $12,517 $10,032 $133,908 9.35% 7.49% $55,136 40.00% Vale $20,167 $15,667 $112,352 17.95% 13.94% $35,845 30.00% Tata Motors 250,116₹ 166,605₹ 1,427,478₹ 17.52% 11.67% 325,986₹ 20.00% Baidu ¥13,073 ¥10,887 ¥342,269 3.82% 3.18% ¥35,280 10.00% Bookscape $4,150 $2,536 $42,636 9.73% 5.95% $13,091 30.00%
Higher cash flows, as a percent of value, give you a higher debt capacity, though less so in emerging markets with substantial country risk.

81
3.OperatingRisk
Aswath Damodaran
81
¨ Firmsthatfacemoreriskoruncertaintyintheiroperations(andmorevariableoperatingincomeasaconsequence)willhaveloweroptimaldebtratiosthanfirmsthathavemorepredictableoperations.
¨ Operatingriskentersthecostofcapitalapproachintwoplaces:¤ Unlevered beta:Firmsthatfacemoreoperatingriskwilltendtohavehigherunlevered betas.Astheyborrow,debtwillmagnifythisalready largeriskandpushupcostsofequitymuchmoresteeply.
¤ Bondratings:Foranygivenlevel ofoperatingincome, firmsthatfacemoreriskinoperationswillhavelowerratings.Theratingsarebaseduponnormalized income.

82
4.Theonlymacrodeterminant:EquityvsDebtRiskPremiums
Aswath Damodaran
82
0.00
1.00
2.00
3.00
4.00
5.00
6.00
7.00
8.00
9.00
0.00%
1.00%
2.00%
3.00%
4.00%
5.00%
6.00%
7.00%
ERP
/ B
aa S
prea
d
Pre
miu
m (
Sp
read
)
Figure 16: Equity Risk Premiums and Bond Default Spreads
ERP/Baa Spread Baa - T.Bond Rate ERP

83
6 ApplicationTest:Yourfirm’soptimalfinancingmix
Aswath Damodaran
83
¨ Usingtheoptimalcapitalstructurespreadsheetprovided:1. Estimatetheoptimaldebtratioforyourfirm2. Estimatethenewcostofcapitalattheoptimal3. Estimatetheeffectofthechangeinthecostofcapitalon
firmvalue4. Estimatetheeffectonthestockprice
¨ Intermsofthemechanics,whatwouldyouneedtodotogettotheoptimalimmediately?

84
III.TheAPVApproachtoOptimalCapitalStructure
Aswath Damodaran
84
¨ Intheadjustedpresentvalueapproach,thevalueofthefirmiswrittenasthesumofthevalueofthefirmwithoutdebt(theunleveredfirm)andtheeffectofdebtonfirmvalueFirmValue=UnleveredFirmValue+(TaxBenefitsofDebt-
ExpectedBankruptcyCostfromtheDebt)
¨ Theoptimaldollardebtlevelistheonethatmaximizesfirmvalue

85
ImplementingtheAPVApproach
Aswath Damodaran
85
¨ Step1:Estimate theunlevered firmvalue.Thiscanbedoneinoneoftwoways:¤ Estimatingtheunleveredbeta,acostofequitybasedupontheunlevered
betaandvaluingthefirmusingthiscostofequity(whichwillalsobethecostofcapital,withanunleveredfirm)
¤ Alternatively,UnleveredFirmValue=CurrentMarketValueofFirm- TaxBenefitsofDebt(Current)+ExpectedBankruptcycostfromDebt
¨ Step2:Estimate thetaxbenefits atdifferent levelsofdebt.Thesimplest assumption tomake isthatthesavingsareperpetual, inwhichcase¤ Taxbenefits=DollarDebt*TaxRate
¨ Step3:Estimateaprobability ofbankruptcyateachdebtlevel,andmultiplybythecostofbankruptcy (includingbothdirectandindirectcosts)toestimate theexpectedbankruptcycost.

86
EstimatingExpectedBankruptcyCost
Aswath Damodaran
86
¨ ProbabilityofBankruptcy¤ Estimate thesyntheticratingthatthefirmwillhaveateachlevelof
debt¤ Estimate theprobabilitythatthefirmwillgobankruptover time,at
thatlevelofdebt(Usestudies thathaveestimated theempiricalprobabilitiesofthisoccurringover time- Altmandoesanupdateeveryyear)
¨ CostofBankruptcy¤ Thedirectbankruptcycostistheeasiercomponent. Itisgenerally
between 5-10%offirmvalue,baseduponempirical studies¤ Theindirectbankruptcycostismuchtougher. Itshouldbehigherfor
sectorswhereoperatingincomeisaffected significantlybydefaultrisk(likeairlines)andlowerforsectorswhereitisnot(likegroceries)

87
RatingsandDefaultProbabilities:ResultsfromAltmanstudyofbonds
Aswath Damodaran
87
Rating Likelihood ofDefaultAAA 0.07%AA 0.51%A+ 0.60%A 0.66%A- 2.50%BBB 7.54%BB 16.63%B+ 25.00%B 36.80%B- 45.00%CCC 59.01%CC 70.00%C 85.00%D 100.00%
Altman estimated these probabilities by looking at bonds in each ratings class ten years prior and then examining the proportion of these bonds that defaulted over the ten years.

88
Disney:EstimatingUnleveredFirmValue
Aswath Damodaran
88
CurrentValueoffirm=$121,878+$15,961 =$137,839- TaxBenefitonCurrentDebt=$15,961*0.361 =$5,762+ExpectedBankruptcyCost=0.66%*(0.25*137,839)=$227Unlevered ValueofFirm= =$132,304
¤ CostofBankruptcyforDisney=25%offirmvalue¤ ProbabilityofBankruptcy=0.66%,basedonfirm’scurrentratingofA
¤ TaxRate=36.1%

89
Disney:APVatDebtRatios
Aswath Damodaran
89
The optimal debt ratio is 40%, which is the point at which firm value is maximized.
Debt Ratio $ Debt Tax RateUnlevered Firm Value Tax Benefits Bond Rating
Probability of Default
Expected Bankruptcy
Cost
Value of Levered
Firm0% $0 36.10% $132,304 $0 AAA 0.07% $23 $132,281
10% $13,784 36.10% $132,304 $4,976 Aaa/AAA 0.07% $24 $137,256 20% $27,568 36.10% $132,304 $9,952 Aaa/AAA 0.07% $25 $142,231 30% $41,352 36.10% $132,304 $14,928 Aa2/AA 0.51% $188 $147,045 40% $55,136 36.10% $132,304 $19,904 A2/A 0.66% $251 $151,957 50% $68,919 36.10% $132,304 $24,880 B3/B- 45.00% $17,683 $139,501 60% $82,703 36.10% $132,304 $29,856 C2/C 59.01% $23,923 $138,238 70% $96,487 32.64% $132,304 $31,491 C2/C 59.01% $24,164 $139,631 80% $110,271 26.81% $132,304 $29,563 Ca2/CC 70.00% $28,327 $133,540 90% $124,055 22.03% $132,304 $27,332 Caa/CCC 85.00% $33,923 $125,713

90
IV.RelativeAnalysis
Aswath Damodaran
90
¨ The“safest” placeforanyfirmtobeisclosetotheindustryaverage
¨ Subjectiveadjustmentscanbemadetotheseaveragestoarriveattherightdebtratio.¤ Highertaxrates->Higherdebtratios(Taxbenefits)¤ Lowerinsiderownership->Higherdebtratios(Greaterdiscipline)
¤ Morestableincome->Higherdebtratios(Lowerbankruptcycosts)
¤ Moreintangibleassets->Lowerdebtratios(Moreagencyproblems)

91
Comparingtoindustryaverages
Aswath Damodaran
91
Debt to Capital Ratio
Net Debt to Capital Ratio Debt to Capital
Ratio Net Debt to Capital
Ratio
Company Book value
Market value
Book value
Market value
Comparable group
Book value
Market value
Book value
Market value
Disney 22.88% 11.58% 17.70% 8.98% US Entertainment 39.03% 15.44% 24.92% 9.93%
Vale 39.02% 35.48% 34.90% 31.38%
Global Diversified Mining & Iron Ore (Market cap> $1 b)
34.43% 26.03% 26.01% 17.90%
Tata Motors 58.51% 29.28% 22.44% 19.25%
Global Autos (Market Cap> $1 b)
35.96% 18.72% 3.53% 0.17%
Baidu 32.93% 5.23% 20.12% 2.32% Global Online Advertising 6.37% 1.83% -27.13% -2.76%

92
Gettingpastsimpleaverages
Aswath Damodaran
92
Step1:Runaregressionofdebtratiosonthevariablesthatyoubelievedeterminedebtratiosinthesector.Forexample,
DebtRatio=a+b(Taxrate)+c(EarningsVariability) +d(EBITDA/FirmValue)
Checkthisregressionforstatisticalsignificance(tstatistics)andpredictiveability(Rsquared)Step2:Estimatethevaluesoftheproxiesforthefirmunderconsideration.Pluggingintothecrosssectionalregression,wecanobtainanestimateofpredicteddebtratio.Step3:Comparetheactualdebtratiotothepredicteddebtratio.

93
ApplyingtheRegressionMethodology:GlobalAutoFirms
Aswath Damodaran
93
¨ Usingasampleof56globalautofirms,wearrivedatthefollowingregression:
Debttocapital=0.09+0.63(Effective TaxRate)+1.01(EBITDA/ EnterpriseValue) - 0.93(CapEx/Enterprise Value)¨ TheRsquaredoftheregressionis21%.ThisregressioncanbeusedtoarriveatapredictedvalueforTataMotorsof:
PredictedDebtRatio=0.09+0.63(0.252)+1.01(0.1167)- 0.93(0.1949)=.1854or18.54%¨ Baseduponthecapitalstructureofotherfirmsintheautomobileindustry,TataMotorsshouldhaveamarketvaluedebtratioof18.54%.Itisoverleveredatitsexistingdebtratioof29.28%.

94
Extendingtotheentiremarket
Aswath Damodaran
94
¨ Using2014dataforUSlistedfirms,welookedatthedeterminantsofthemarketdebttocapitalratio.Theregressionprovidesthefollowingresults–
DFR= 0.27- 0.24ETR-0.10g– 0.065INST-0.338CVOI+0.59E/V(15.79) (9.00) (2.71) (3.55) (3.10)(6.85)
DFR =Debt/(Debt+MarketValueofEquity)ETR=Effective taxrateinmostrecenttwelvemonthsINST=%ofSharesheldbyinstitutionsCVOI=StddevinOIinlast10years/AverageOIinlast10yearsE/V =EBITDA/(MarketValueofEquity+Debt- Cash)
TheregressionhasanR-squared of8%.

95
ApplyingtheRegression
Aswath Damodaran
95
¨ Disney hadthefollowingvaluesforthese inputs in2014.Estimate theoptimaldebtratiousingthedebtregression.Effective TaxRate(ETR) =31.02%ExpectedRevenue Growth =6.45%InstitutionalHolding%(INST) =70.2%Coeff ofVariation inOI(CVOI) =0.0296EBITDA/Value offirm(E/V) =9.35%
OptimalDebtRatio=0.27- 0.24(.3102)-0.10(.0645)– 0.065(.702)-0.338(.0296)+0.59(.0935)=0.1886or18.86%¨ Whatdoesthisoptimaldebtratiotellyou?
¨ Whymight itbedifferentfromtheoptimalcalculated usingtheweightedaveragecostofcapital?

96
Summarizingtheoptimaldebtratios…
Aswath Damodaran
96
Disney Vale Tata Motors Baidu
Actual Debt Ratio 11.58% 35.48% 29.28% 5.23%
Optimal
I. Operating income 35.00% — -
II. Standard Cost of capital 40.00% 30.00% (actual)
50.00% (normalized)
20.00% 10.00%
III. Enhanced Cost of Capital 40.00% 30.00% (actual)
40.00% (normalized)
10.00% 10.00%
IV. APV 40.00% 30.00% 20.00% 20.00%
V. Comparable
To industry 28.54% 26.03% 18.72% 1.83%
To market 18.86% — -

GETTINGTOTHEOPTIMAL:TIMINGANDFINANCINGCHOICES
Youcantakeitslow..Orperhapsnot…
Aswath Damodaran 97

98
BigPicture…
Aswath Damodaran
98
The Investment DecisionInvest in assets that earn a
return greater than the minimum acceptable hurdle
rate
The Financing DecisionFind the right kind of debt for your firm and the right mix of debt and equity to
fund your operations
The Dividend DecisionIf you cannot find investments
that make your minimum acceptable rate, return the cash
to owners of your business
The hurdle rate should reflect the riskiness of the investment and the mix of debt and equity used
to fund it.
The return should reflect the magnitude and the timing of the
cashflows as well as all side effects.
The optimal mix of debt and equity
maximizes firm value
The right kind of debt
matches the tenor of your
assets
How much cash you can
return depends upon
current & potential
investment opportunities
How you choose to return cash to the owners will
depend on whether they
prefer dividends or buybacks
Maximize the value of the business (firm)

99
Nowthatwehaveanoptimal..Andanactual..Whatnext?
Aswath Damodaran
99
¨ Attheendoftheanalysisoffinancingmix(usingwhatevertoolortoolsyouchoosetouse),youcancometooneofthreeconclusions:1. Thefirmhastherightfinancingmix2. Ithastoolittledebt(itisunderlevered)3. Ithastoomuchdebt(itisoverlevered)
¨ Thenextstepintheprocessis¤ Decidinghowmuchquicklyorgraduallythefirmshouldmovetoitsoptimal
¤ Assumingthatitdoes,therightkindoffinancingtouseinmakingthisadjustment

100
AFrameworkforGettingtotheOptimal
Aswath Damodaran
100
Is the actual debt ratio greater than or lesser than the optimal debt ratio?
Actual > OptimalOverlevered
Actual < OptimalUnderlevered
Is the firm under bankruptcy threat? Is the firm a takeover target?
Yes No
Reduce Debt quickly1. Equity for Debt swap2. Sell Assets; use cashto pay off debt3. Renegotiate with lenders
Does the firm have good projects?ROE > Cost of EquityROC > Cost of Capital
YesTake good projects withnew equity or with retainedearnings.
No1. Pay off debt with retainedearnings.2. Reduce or eliminate dividends.3. Issue new equity and pay off debt.
Yes No
Does the firm have good projects?ROE > Cost of EquityROC > Cost of Capital
YesTake good projects withdebt.
No
Do your stockholders likedividends?
YesPay Dividends No
Buy back stock
Increase leveragequickly1. Debt/Equity swaps2. Borrow money&buy shares.

101
Disney:ApplyingtheFramework
Is the actual debt ratio greater than or lesser than the optimal debt ratio?
Actual > OptimalOverlevered
Actual < OptimalActual (11.58%) < Optimal (40%)
Is the firm under bankruptcy threat? Is the firm a takeover target?
Yes No
Reduce Debt quickly1. Equity for Debt swap2. Sell Assets; use cashto pay off debt3. Renegotiate with lenders
Does the firm have good projects?ROE > Cost of EquityROC > Cost of Capital
YesTake good projects withnew equity or with retainedearnings.
No1. Pay off debt with retainedearnings.2. Reduce or eliminate dividends.3. Issue new equity and pay off debt.
Yes No. Large mkt cap & positive Jensen’s α
Does the firm have good projects?ROE > Cost of EquityROC > Cost of Capital
Yes. ROC > Cost of capitalTake good projectsWith debt.
No
Do your stockholders likedividends?
YesPay Dividends No
Buy back stock
Increase leveragequickly1. Debt/Equity swaps2. Borrow money&buy shares.
102
6 ApplicationTest:GettingtotheOptimal
Aswath Damodaran
102
¨ Baseduponyouranalysisofboththefirm’scapitalstructureandinvestmentrecord,whatpathwouldyoumapoutforthefirm?
a. Immediatechangeinleverageb. Gradualchangeinleveragec. Nochangeinleverage¨ Wouldyourecommendthatthefirmchangeitsfinancingmixby
a. Payingoffdebt/Buyingbackequityb. Takeprojectswithequity/debt

103
TheMechanicsofChangingDebtRatioquickly…
Aswath Damodaran
103
Assets Liabilities
Opearing Assets in place
Debt
EquityGrowth Assets
Cash
To decrease the debt ratio
To increase the debt ratio
Borrow money and buy back stock or pay a large special dividend
Sell operating assets and use cash to buy back stock or pay or special dividend
Issue new stock to retire debt or get debt holders to accept equity in the firm.
Sell operating assets and use cash to pay down debt.

104
Themechanicsofchangingdebtratiosovertime…gradually…
Aswath Damodaran
104
¨ Tochangedebtratiosovertime,youusethesamemixoftoolsthatyouusedtochangedebtratiosgradually:¤ Dividends andstockbuybacks:Dividends andstockbuybackswillreducethevalueofequity.
¤ Debtrepayments:will reducethevalueofdebt.¨ Thecomplicationofchangingdebtratiosovertimeisthatfirmvalueisitselfamovingtarget.¤ Ifequity isfairlyvaluedtoday,theequity valueshouldchangeovertimetoreflecttheexpectedpriceappreciation:
¤ ExpectedPriceappreciation=Costofequity– Dividend Yield¤ Debtwillalsochangeovertime,inconjunctionasfirmvaluechanges.

105
DesigningDebt:TheFundamentalPrinciple
Aswath Damodaran
105
¨ Theobjectiveindesigningdebtistomakethecashflowsondebtmatchupascloselyaspossiblewiththecashflowsthatthefirmmakesonitsassets.
¨ Bydoingso,wereduceourriskofdefault,increasedebtcapacityandincreasefirmvalue.

106
Firmwithmismatcheddebt
Aswath Damodaran
106
Firm Value
Value of Debt

107
FirmwithmatchedDebt
Aswath Damodaran
107
Firm Value
Value of Debt
108
Designtheperfectfinancinginstrument
Aswath Damodaran
108
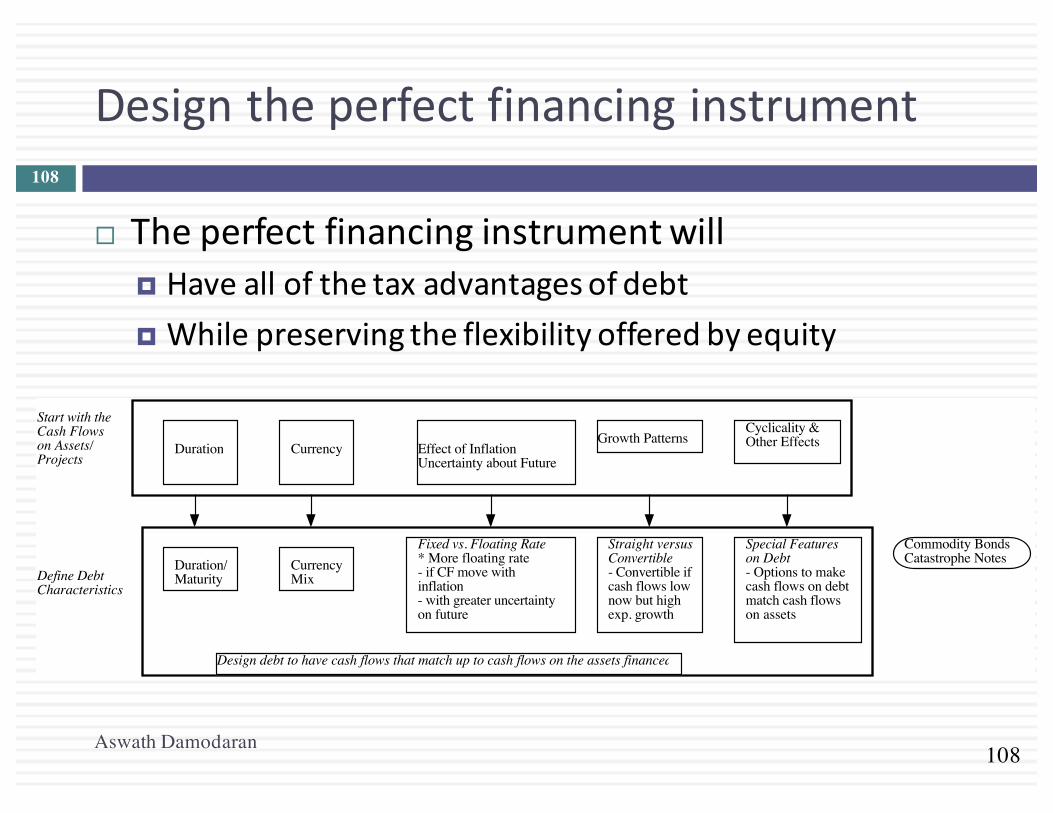
¨ Theperfectfinancinginstrumentwill¤ Haveallofthetaxadvantagesofdebt¤ Whilepreservingtheflexibilityofferedbyequity
Duration Currency Effect of InflationUncertainty about Future
Growth PatternsCyclicality &Other Effects
Define DebtCharacteristics
Duration/Maturity
CurrencyMix
Fixed vs. Floating Rate* More floating rate - if CF move with inflation- with greater uncertainty on future
Straight versusConvertible- Convertible ifcash flows low now but highexp. growth
Special Featureson Debt- Options to make cash flows on debt match cash flows on assets
Start with the Cash Flowson Assets/Projects
Commodity BondsCatastrophe Notes
Design debt to have cash flows that match up to cash flows on the assets financed

109
Ensuringthatyouhavenotcrossedthelinedrawnbythetaxcode
Aswath Damodaran
109
¨ Allofthisdesignworkislost,however,ifthesecuritythatyouhavedesigneddoesnotdeliverthetaxbenefits.
¨ Inaddition,theremaybeatradeoffbetweenmismatchingdebtandgettinggreatertaxbenefits.
Overlay taxpreferences
Deductibility of cash flowsfor tax purposes
Differences in tax ratesacross different locales
If tax advantages are large enough, you might override results of previous step
Zero Coupons

110
Whilekeepingequityresearchanalysts,ratingsagenciesandregulatorsapplauding
Aswath Damodaran
110
¨ Ratingsagencieswantcompaniestoissueequity,sinceitmakesthemsafer.
¨ Equityresearchanalystswantthemnottoissueequitybecauseitdilutesearningspershare.
¨ Regulatoryauthoritieswanttoensurethatyoumeettheirrequirementsintermsofcapitalratios(usuallybookvalue).
¨ Financingthatleavesallthreegroupshappyisnirvana.
Consider ratings agency& analyst concerns
Analyst Concerns- Effect on EPS- Value relative to comparables
Ratings Agency- Effect on Ratios- Ratios relative to comparables
Regulatory Concerns- Measures used
Can securities be designed that can make these different entities happy?
Operating LeasesMIPsSurplus Notes

111
DebtorEquity:TheStrangeCaseofTrustPreferred
Aswath Damodaran
111
¨ Trustpreferredstockhas¤ Afixeddividendpayment,specifiedatthetimeoftheissue¤ Thatistaxdeductible¤ Andfailingtomakethepaymentcangivetheseshareholdersvotingrights
¨ Whentrustpreferredwasfirstcreated,ratingsagenciestreateditasequity.Astheyhavebecomemoresavvy,ratingsagencieshavestartedgivingfirmsonlypartialequitycreditfortrustpreferred.

112
Debt,EquityandQuasiEquity
Aswath Damodaran
112
¨ Assumingthattrustpreferredstockgetstreatedasequitybyratingsagencies,whichofthefollowingfirmsisthemostappropriatefirmtobeissuingit?a. Afirmthatisunderlevered,buthasaratingconstraint
thatwouldbeviolatedifitmovedtoitsoptimalb. Afirmthatisoverleveredthatisunabletoissuedebt
becauseoftheratingagencyconcerns.

113
Soothebondholderfears
Aswath Damodaran
113
¨ Therearesomefirmsthatfaceskepticismfrombondholderswhentheygoouttoraisedebt,because¤ Oftheirpasthistoryofdefaultsorotheractions¤ Theyaresmallfirmswithoutanyborrowinghistory
¨ Bondholderstendtodemandmuchhigherinterestratesfromthesefirmstoreflecttheseconcerns.
Factor in agencyconflicts between stockand bond holders
Observability of Cash Flowsby Lenders- Less observable cash flows lead to more conflicts
Type of Assets financed- Tangible and liquid assets create less agency problems
Existing Debt covenants- Restrictions on Financing
If agency problems are substantial, consider issuing convertible bonds
ConvertibilesPuttable BondsRating Sensitive
NotesLYONs

114
Anddonotlockinmarketmistakesthatworkagainstyou
Aswath Damodaran
114
¨ Ratingsagenciescansometimesunderrateafirm,andmarketscanunderpriceafirm’sstockorbonds.Ifthisoccurs,firmsshouldnotlockinthesemistakesbyissuingsecuritiesforthelongterm.Inparticular,¤ Issuingequityorequitybasedproducts(includingconvertibles),whenequityisunderpricedtransferswealth fromexistingstockholders tothenewstockholders
¤ Issuinglongtermdebtwhenafirmisunder ratedlocksinratesatlevels thatarefartoohigh,giventhefirm’sdefaultrisk.
¨ Whatisthesolution¤ Ifyouneedtouseequity?¤ Ifyouneedtousedebt?
115
DesigningDebt:Bringingitalltogether
Aswath Damodaran
115
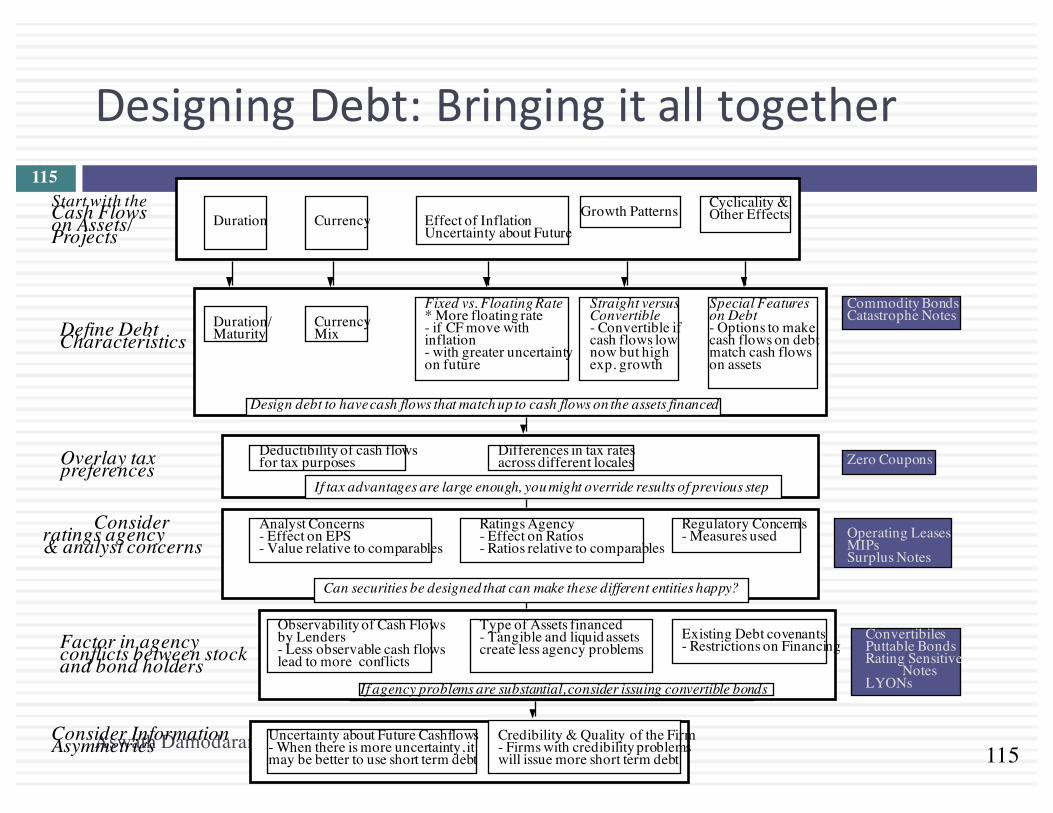
Duration Currency Effect of InflationUncertainty about Future
Growth Patterns Cyclicality &Other Effects
Define DebtCharacteristicsDuration/Maturity
CurrencyMix
Fixed vs. Floating Rate* More floating rate - if CF move with inflation- with greater uncertainty on future
Straight versusConvertible- Convertible ifcash flows low now but highexp. growth
Special Featureson Debt- Options to make cash flows on debt match cash flows on assets
Start with the Cash Flowson Assets/Projects
Overlay taxpreferencesDeductibility of cash flowsfor tax purposes
Differences in tax ratesacross different locales
Consider ratings agency& analyst concernsAnalyst Concerns- Effect on EPS- Value relative to comparables
Ratings Agency- Effect on Ratios- Ratios relative to comparables
Regulatory Concerns- Measures used
Factor in agencyconflicts between stockand bond holders
Observability of Cash Flowsby Lenders- Less observable cash flows lead to more conflicts
Type of Assets financed- Tangible and liquid assets create less agency problems
Existing Debt covenants- Restrictions on Financing
Consider Information Asymmetries Uncertainty about Future Cashflows- When there is more uncertainty, itmay be better to use short term debt
Credibility & Quality of the Firm- Firms with credibility problemswill issue more short term debt
If agency problems are substantial, consider issuing convertible bonds
Can securities be designed that can make these different entities happy?
If tax advantages are large enough, you might override results of previous step
Zero Coupons
Operating LeasesMIPsSurplus Notes
ConvertibilesPuttable BondsRating Sensitive
NotesLYONs
Commodity BondsCatastrophe Notes
Design debt to have cash flows that match up to cash flows on the assets financed

116
ApproachesforevaluatingAssetCashFlows
Aswath Damodaran
116
I.IntuitiveApproach¤ Aretheprojects typicallylongtermorshort term?Whatisthecash
flowpatternonprojects?¤ Howmuchgrowthpotentialdoes thefirmhaverelative tocurrent
projects?¤ Howcyclicalarethecashflows?Whatspecific factorsdetermine the
cashflowsonprojects?II.ProjectCashFlowApproach
¤ Estimateexpectedcashflowsonatypicalprojectforthefirm¤ Doscenarioanalysesonthesecashflows,basedupondifferentmacro
economicscenariosIII.HistoricalData
¤ OperatingCashFlows¤ FirmValue

117
I.IntuitiveApproach- Disney
Aswath Damodaran
117
Business Project Cash Flow Characteristics Type of Financing
Studio
entertainment
Movie projects are likely to • Be short-term • Have cash outflows primarily in dollars (because Disney makes most of its
movies in the U.S.), but cash inflows could have a substantial foreign currency component (because of overseas revenues)
• Have net cash flows that are heavily driven by whether the movie is a hit, which is often difficult to predict
Debt should be 1. Short-term 2. Mixed currency debt,
reflecting audience make-up.
3. If possible, tied to the success of movies.
Media networks Projects are likely to be 1. Short-term 2. Primarily in dollars, though foreign component is growing, especially for ESPN. 3. Driven by advertising revenues and show success (Nielsen ratings)
Debt should be 1. Short-term 2. Primarily dollar debt 3. If possible, linked to
network ratings Park resorts Projects are likely to be
1. Very long-term 2. Currency will be a function of the region (rather than country) where park is
located. 3. Affected by success of studio entertainment and media networks divisions
Debt should be 1. Long-term 2. Mix of currencies, based
on tourist makeup at the park.
Consumer products
Projects are likely to be short- to medium-term and linked to the success of the movie division; most of Disney’s product offerings and licensing revenues are derived from their movie productions
Debt should be 1. Medium-term 2. Dollar debt
Interactive Projects are likely to be short-term, with high growth potential and significant risk. While cash flows will initially be primarily in US dollars, the mix of currencies will shift as the business ages.
Debt should be short-term, convertible US dollar debt.

118
6 ApplicationTest:ChoosingyourFinancingType
Aswath Damodaran
118
¨ Baseduponthebusinessthatyourfirmisin,andthetypicalinvestmentsthatitmakes,whatkindoffinancingwouldyouexpectyourfirmtouseintermsofa. Duration(longtermorshortterm)b. Currencyc. FixedorFloatingrated. StraightorConvertible

119
II.ProjectSpecificFinancing
Aswath Damodaran
119
¨ Withprojectspecificfinancing,youmatchthefinancingchoicestotheprojectbeingfunded.Thebenefitisthatthethedebtistrulycustomizedtotheproject.
¨ Projectspecificfinancingmakesthemostsensewhenyouhaveafewlarge,independentprojectstobefinanced.Itbecomesbothimpracticalandcostlywhenfirmshaveportfoliosofprojectswithinterdependentcashflows.

120
DurationofDisneyThemePark
Aswath Damodaran
120
Duration of the Project = 62,355/3296 = 18.92 years

121
Theperfectthemeparkdebt…
Aswath Damodaran
121
¨ Theperfectdebtforthisthemeparkwouldhaveadurationofroughly19yearsandbeinamixofLatinAmericancurrencies(sinceitislocatedinBrazil),reflectingwherethevisitorstotheparkarecomingfrom.
¨ Ifpossible,youwouldtietheinterestpaymentsonthedebttothenumberofvisitorsatthepark.

122
III.Firm-widefinancing
Aswath Damodaran
122
¨ Ratherthanlookatindividualprojects,youcouldconsiderthefirmtobeaportfolioofprojects.Thefirm’spasthistoryshouldthenprovidecluesastowhattypeofdebtmakesthemostsense.
¨ OperatingCashFlowsn Thequestionofhowsensitiveafirm’sassetcashflowsaretoavarietyoffactors,suchasinterestrates,inflation,currencyratesandtheeconomy,canbedirectlytestedbyregressingchangesintheoperatingincomeagainstchangesinthesevariables.
n Thisanalysisisusefulindeterminingthecoupon/interestpaymentstructureofthedebt.
¨ FirmValuen Thefirmvalueisclearlyafunctionofthelevelofoperatingincome,butitalsoincorporatesotherfactorssuchasexpectedgrowth&costofcapital.
n Thefirmvalueanalysisisusefulindeterminingtheoverallstructureofthedebt,particularlymaturity.

123
Disney:HistoricalData123
Date Operating Income Enterprise Value (V) % Chg in OI % Chg in V
2013 9450 $126,815 6.62% 21.09%2012 8863 $104,729 13.91% 56.85%2011 7781 $66,769 15.69% -9.19%2010 6726 $73,524 18.06% 22.84%2009 5697 $59,855 -23.06% -18.11%2008 $7,404 $73,091 8.42% -6.27%2007 $6,829 $77,980 27.53% 2.98%2006 $5,355 $75,720 30.39% 27.80%2005 $4,107 $59,248 1.46% 2.55%2004 $4,048 $57,776 49.21% 9.53%2003 $2,713 $52,747 13.80% 20.45%2002 $2,384 $43,791 -15.82% -9.01%2001 $2,832 $48,128 12.16% -45.53%2000 $2,525 $88,355 -22.64% 35.67%1999 $3,264 $65,125 -15.07% -5.91%1998 $3,843 $69,213 -2.59% 6.20%1997 $3,945 $65,173 30.46% 18.25%1996 $3,024 $55,116 33.69% 77.65%1995 $2,262 $31,025 25.39% 39.75%1994 $1,804 $22,200 15.64% 9.04%1993 $1,560 $20,360 21.21% 6.88%1992 $1,287 $19,049 28.19% 23.89%1991 $1,004 $15,376 -21.99% 26.50%1990 $1,287 $12,155 16.05% -23.64%1989 $1,109 $15,918 40.56% 101.93%1988 $789 $7,883 11.60% -23.91%1987 $707 $10,360 53.03% 83.69%1986 $462 $5,640 25.20% 61.23%1985 $369 $3,498 157.99% 24.37%

124
TheMacroeconomicData124
Date Change in T.Bond rate % Chg in GDP % Change in CPI % Change in US $
2013 1.07% 1.83% 1.18% 4.89%2012 -0.11% 2.20% -1.03% 2.75%2011 -1.37% 1.81% 1.48% -4.59%2010 -0.53% 2.39% 1.97% -3.64%2009 1.29% -3.07% -3.98% 5.79%2008 -1.44% -1.18% -4.26% 10.88%2007 -0.65% 2.93% 2.19% -11.30%2006 0.30% 3.40% -1.84% -2.28%2005 0.16% 3.68% 0.66% 3.98%2004 0.13% 3.72% 1.34% -3.92%2003 0.05% 4.32% -0.65% -14.59%2002 -0.97% 2.80% 1.44% -11.17%2001 -0.18% -0.04% -2.50% 7.45%2000 -0.98% 2.24% 0.96% 7.73%1999 1.56% 4.70% 1.04% 1.68%1998 -1.03% 4.51% 0.11% -4.08%1997 -0.63% 4.33% -1.43% 9.40%1996 0.80% 4.43% 0.31% 4.14%1995 -2.09% 2.01% -0.08% -0.71%1994 1.92% 4.12% 0.27% -5.37%1993 -0.83% 2.50% -0.72% 0.56%1992 -0.02% 4.15% 0.64% 6.89%1991 -1.26% 1.09% -2.89% 0.69%1990 0.12% 0.65% 0.43% -8.00%1989 -1.11% 2.66% 0.51% 2.04%1988 0.26% 3.66% 0.60% 1.05%1987 1.53% 4.49% 2.54% -12.01%1986 -1.61% 2.83% -2.33% -15.26%1985 -2.27% 4.19% 3.89% -13.51%

125
I.SensitivitytoInterestRateChanges
Aswath Damodaran
125
¨ Howsensitiveisthefirm’svalueandoperatingincometochangesinthelevelofinterestrates?
¨ Theanswertothisquestionisimportantbecauseit¤ itprovidesameasureofthedurationofthefirm’sprojects¤ itprovidesinsightintowhetherthefirmshouldbeusingfixedorfloatingratedebt.

126
FirmValueversusInterestRateChanges
Aswath Damodaran
126
¨ Regressingchangesinfirmvalueagainstchangesininterestratesoverthisperiodyieldsthefollowingregression–ChangeinFirmValue=0.1790– 2.3251(Change inInterest Rates)
(2.74) (0.39)
¤Tstatisticsareinbrackets.
¨ Thecoefficientontheregression(-2.33)measureshowmuchthevalueofDisneyasafirmchangesforaunitchangeininterestrates.

127
Whythecoefficientontheregressionisduration..
Aswath Damodaran
127
¨ Thedurationofastraightbondorloanissuedbyacompanycanbewrittenintermsofthecoupons(interestpayments)onthebond(loan)andthefacevalueofthebondtobe–
¨ Thedurationofabondmeasureshowmuchthepriceofthebondchangesforaunitchangeininterestrates.
¨ Holdingotherfactorsconstant,thedurationofabondwillincreasewiththematurityofthebond,anddecreasewiththecouponrateonthebond.
Duration of Bond = dP/Pdr/r
=
t*Coupont
(1+r)tt=1
t=N
∑ +N*Face Value
(1+r)N
"
#$
%
&'
Coupont
(1+r)tt=1
t=N
∑ +Face Value
(1+r)N
"
#$
%
&'

128
Duration:ComparingApproaches
Aswath Damodaran
128
δP/δr=Percentage Change in Value for apercentage change in Interest Rates
Traditional DurationMeasures
Regression:δP = a + b (δr)
Uses:1. Projected Cash FlowsAssumes:1. Cash Flows are unaffected by changes in interest rates2. Changes in interest rates are small.
Uses:1. Historical data on changes in firm value (market) and interest ratesAssumes:1. Past project cash flows are similar to future project cash flows.2. Relationship between cash flows and interest rates is stable.3. Changes in market value reflect changes in the value of the firm.

129
OperatingIncomeversusInterestRates
Aswath Damodaran
129
¨ Regressingchangesinoperatingcashflowagainstchangesininterestratesoverthisperiodyieldsthefollowingregression–
ChangeinOperating Income=0.1698– 7.9339(Change inInterestRates)(2.69a) (1.40)
Conclusion:Disney’soperatingincomehasbeenaffectedalotmorethanitsfirmvaluehasbychangesininterestrates.

130
II.SensitivitytoChangesinGDP/GNP
Aswath Damodaran
130
¨ Howsensitiveisthefirm’svalueandoperatingincometochangesintheGNP/GDP?
¨ Theanswertothisquestionisimportantbecause¤ itprovides insightintowhether thefirm’scashflowsarecyclicaland
¤ whether thecashflowsonthefirm’sdebtshouldbedesignedtoprotectagainstcyclicalfactors.
¨ Ifthecashflowsandfirmvaluearesensitivetomovementsintheeconomy,thefirmwilleitherhavetoissuelessdebtoverall,oraddspecialfeaturestothedebttotiecashflowsonthedebttothefirm’scashflows.

131
RegressionResults
Aswath Damodaran
131
¨ RegressingchangesinfirmvalueagainstchangesintheGDPoverthisperiodyieldsthefollowingregression–
ChangeinFirmValue= 0.0067+6.7000(GDPGrowth)(0.06) (2.03a)
Conclusion:Disneyissensitivetoeconomicgrowth¨ RegressingchangesinoperatingcashflowagainstchangesinGDPoverthisperiodyieldsthefollowingregression–
ChangeinOperating Income= 0.0142+6.6443(GDPGrowth)(0.13) (2.05a)
Conclusion:Disney’soperatingincomeissensitivetoeconomicgrowthaswell.

132
III.SensitivitytoCurrencyChanges
Aswath Damodaran
132
¨ Howsensitiveisthefirm’svalueandoperatingincometochangesinexchangerates?
¨ Theanswertothisquestionisimportant,because¤ itprovidesameasureofhowsensitivecashflowsandfirmvaluearetochangesinthecurrency
¤ itprovidesguidanceonwhetherthefirmshouldissuedebtinanothercurrencythatitmaybeexposedto.
¨ Ifcashflowsandfirmvaluearesensitivetochangesinthedollar,thefirmshould¤ figureoutwhichcurrencyitscashflowsarein;¤ andissuedsomedebtinthatcurrency

133
RegressionResults
Aswath Damodaran
133
¨ Regressing changesinfirmvalueagainstchangesinthedollaroverthisperiod yields thefollowing regression–
ChangeinFirmValue= 0.1774– 0.5705(ChangeinDollar)(2.76) (0.67)
Conclusion: Disney’s valueissensitive toexchange ratechanges,decreasingasthedollarstrengthens.However, theeffectisstatisticallyinsignificant.
¨ Regressing changesinoperating cashflowagainstchangesinthedollaroverthisperiod yields thefollowing regression –
ChangeinOperating Income=0.1680– 1.6773(Change inDollar)(2.82a) (2.13a )
Conclusion: Disney’soperatingincome ismorestronglyimpactedbythedollarthanitsvalue is.Astrongerdollarseems tohurtoperatingincome.

134
IV.SensitivitytoInflation
Aswath Damodaran
134
¨ Howsensitiveisthefirm’svalueandoperatingincometochangesintheinflationrate?
¨ Theanswertothisquestionisimportant,because¤ itprovidesameasureofwhethercashflowsarepositivelyornegativelyimpactedbyinflation.
¤ itthenhelpsinthedesignofdebt;whetherthedebtshouldbefixedorfloatingratedebt.
¨ Ifcashflowsmovewithinflation,increasing(decreasing)asinflationincreases(decreases),thedebtshouldhavealargerfloatingratecomponent.

135
RegressionResults
Aswath Damodaran
135
¨ Regressing changesinfirmvalueagainstchangesininflationoverthisperiod yields thefollowing regression–
ChangeinFirmValue= 0.1855+2.9966(Change inInflationRate)(2.96) (0.90)
Conclusion:Disney’sfirmvaluedoesseemtoincreasewithinflation,butnotbymuch(statisticalsignificanceislow)
¨ Regressing changesinoperating cashflowagainstchangesininflationoverthisperiod yields thefollowing regression –
ChangeinOperating Income=0.1919+8.1867(Change inInflationRate)(3.43a) (2.76a )
Conclusion: Disney’soperatingincome increases inperiodswheninflationincreases, suggesting thatDisneydoeshavepricingpower.

136
Summarizing…
Aswath Damodaran
136
¨ Lookingatthefourmacroeconomicregressions,wewouldconcludethat¤ Disney’sassetscollectivelyhaveadurationofabout2.33years
¤ Disneyisincreasinglyaffectedbyeconomiccycles¤ Disneyishurtbyastrongerdollar¤ Disney’soperatingincometendstomovewithinflation
¨ Alloftheregressioncoefficientshavesubstantialstandarderrorsassociatedwiththem.Onewaytoreducetheerror(alabottomupbetas)istousesector-wideaveragesforeachofthecoefficients.

137
Bottom-upEstimates
Aswath Damodaran
137These weights reflect the estimated values of the businesses

138
RecommendationsforDisney
Aswath Damodaran
138
¨ Thedebtissuedshouldbelongtermandshouldhavedurationofabout4.3years.
¨ Asignificantportionofthedebtshouldbefloatingratedebt,reflectingDisney’scapacitytopassinflationthroughtoitscustomersandthefactthatoperatingincometendstoincreaseasinterestratesgoup.
¨ GivenDisney’ssensitivitytoastrongerdollar,aportionofthedebtshouldbeinforeigncurrencies.ThespecificcurrencyusedandthemagnitudeoftheforeigncurrencydebtshouldreflectwhereDisneymakesitsrevenues.Basedupon2013numbersatleast,thiswouldindicatethatabout18%ofitsdebtshouldbeinforeigncurrencies(andperhapsmore,sinceeventheirUSdollarincomecanbeaffectedbycurrencymovements).

139
AnalyzingDisney’sCurrentDebt
Aswath Damodaran
139
¨ Disneyhas$14.3billionininterest-bearing debtwithaface-valueweightedaveragematurityof7.92years.Allowingforthefactthatthematurityofdebtishigherthantheduration,thiswouldindicatethatDisney’sdebtmaybealittlelongerthanwouldbeoptimal,butnotbymuch.
¨ Ofthedebt,about5.49%ofthedebtisinnon-USdollarcurrencies (Indianrupees andHongKongdollars),buttherestisinUSdollarsandthecompanyhasnoEurodebt.Basedonouranalysis,wewouldsuggestthatDisneyincrease itsproportionofEurodebttoabout12%andtiethechoiceofcurrencyonfuturedebtissues toitsexpansionplans.
¨ Disneyhasnoconvertibledebtandabout5.67%ofitsdebtisfloatingratedebt,whichlookslow,giventhecompany’spricingpower.Whilethemixofdebtin2013maybereflective ofadesire tolockinlowlong-terminterest ratesondebt,asratesrise, thecompanyshouldconsiderexpanding itsuseofforeigncurrencydebt.

140
AdjustingDebtatDisney
Aswath Damodaran
140
¨ Itcanswapsomeofitsexistingfixedrate,dollardebtforfloatingrate,foreigncurrencydebt.GivenDisney’sstandinginfinancialmarketsanditslargemarketcapitalization,thisshouldnotbedifficulttodo.
¨ IfDisneyisplanningnewdebtissues,eithertogettoahigherdebtratioortofundnewinvestments,itcanuseprimarilyfloatingrate,foreigncurrencydebttofundthesenewinvestments.Althoughitmaybemismatchingthefundingontheseinvestments,itsdebtmatchingwillbecomebetteratthecompanylevel.

141
DebtDesignforBookscape&Vale
Aswath Damodaran
141
¨ Bookscape: GivenBookscape’s dependence onrevenues atitsNewYorkbookstore,wewoulddesignthedebttobeRecommendation: Long-term,dollardenominated, fixed ratedebtActual:Longtermoperating leaseonthestore
¨ Vale: Vale’sminesarespreadaroundtheworld,anditgeneratesalargeportionofitsrevenues inChina(37%).Itsminestypicallyhavevery longlivesandrequire largeup-frontinvestments, andthecostsareusuallyinthelocalcurrencies butitsrevenues areinUSdollars.¤Recommendation: Longterm,dollar-denominated debt(withhedgingoflocalcurrencyriskexposure)andifpossible, tiedtocommodityprices.¤Actual:TheexistingdebtatVale isprimarilyUSdollardebt(65.48%),withanaveragematurityof14.70years.Allofthedebt,asfaraswecanassess, isfixedrateandthereisnocommodity-linked debt.
142
AndforTataMotorsandBaidu
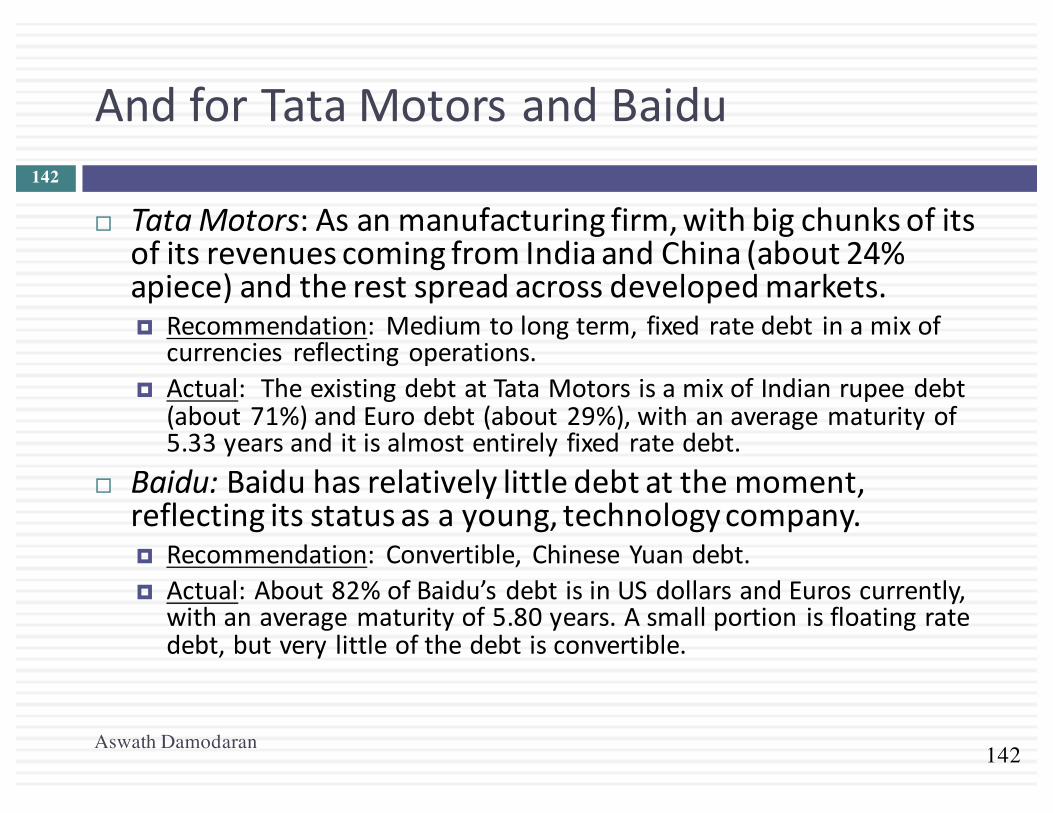
¨ TataMotors:Asanmanufacturingfirm,withbigchunksofitsofitsrevenuescomingfromIndiaandChina(about24%apiece)andtherestspreadacrossdevelopedmarkets.¤ Recommendation:Mediumtolongterm, fixed ratedebt inamixof
currencies reflectingoperations.¤ Actual:TheexistingdebtatTataMotorsisamixofIndianrupeedebt
(about71%)andEurodebt(about29%),withanaveragematurityof5.33yearsanditisalmostentirelyfixed ratedebt.
¨ Baidu: Baiduhasrelativelylittledebtatthemoment,reflectingitsstatusasayoung,technologycompany.¤ Recommendation: Convertible, ChineseYuandebt.¤ Actual:About82%ofBaidu’sdebtisinUSdollarsandEuroscurrently,
withanaveragematurityof5.80years.Asmallportion isfloatingratedebt,butverylittleofthedebtisconvertible.
Aswath Damodaran
142

RETURNINGCASHTOTHEOWNERS:DIVIDENDPOLICY“Companiesdon’thavecash.Theyholdcashfortheirstockholders.”
Aswath Damodaran 143

144
FirstPrinciples
Aswath Damodaran
144

145
StepstotheDividendDecision…ifequityistreatedasaresidualclaim
Aswath Damodaran
145

146
TheRootsofDividendDysfunction
¨ Inpractice,dividendpolicyisdysfunctionalanddoesnotfollowthelogicalprocessofstartingwithyourinvestmentopportunitiesandworkingyourwaydowntoresidualcash.
¨ Thetwodominantfactorsdrivingdividendpolicyaroundtheworldare:¤ Inertia:Companiesseemtohatetoletoftheirpast,whenitcomestodividendpolicy.
¤ Me-too-ism:Companieswanttobehaveliketheirpeergroup.
Aswath Damodaran
146

147
I.Dividendsaresticky
Aswath Damodaran
147
0.00%
10.00%
20.00%
30.00%
40.00%
50.00%
60.00%
70.00%
80.00%
1988
1989
1990
1991
1992
1993
1994
1995
1996
1997
1998
1999
2000
2001
2002
2003
2004
2005
2006
2007
2008
2009
2010
2011
2012
2013
2014
2015
DividendChangesatUScompanies
Increase
Decrease
Nochange

148
Thelastquarterof2008putstickinesstothetest..NumberofS&P500companiesthat…
Aswath Damodaran
148
Quarter Dividend Increase Dividend initiated Dividend decrease Dividend suspensionsQ1 2007 102 1 1 1Q2 2007 63 1 1 5Q3 2007 59 2 2 0Q4 2007 63 7 4 2Q1 2008 93 3 7 4Q2 2008 65 0 9 0Q3 2008 45 2 6 8Q4 2008 32 0 17 10

149
II.Dividendstendtofollowearnings
Aswath Damodaran
149
0.00%
10.00%
20.00%
30.00%
40.00%
50.00%
60.00%
70.00%
80.00%
0.00
20.00
40.00
60.00
80.00
100.00
120.00
19601961196219631964196519661967196819691970197119721973197419751976197719781979198019811982198319841985198619871988198919901991199219931994199519961997199819992000200120022003200420052006200720082009201020112012201320142015
Earnings/D
ividen
ds
S&P500:DividendsandEarnings- 1960to2015
Earnings Dividends PayoutRatio

III.Areaffectedbytaxlaws…
In2003 Inthelastquarterof2012¨ Asthepossibilityoftaxrates
revertingbacktopre-2003levelsrose,233companiespaidout$31billionindividends.
¨ Ofthesecompanies,101hadinsiderholdingsinexcessof20%oftheoutstandingstock.

151
IV.MoreandmoreUSfirmsarebuyingbackstock,ratherthanpaydividends...
Aswath Damodaran
151
0.00%
10.00%
20.00%
30.00%
40.00%
50.00%
60.00%
70.00%
80.00%
0.00
100.00
200.00
300.00
400.00
500.00
600.00
700.00
800.00
1988
1989
1990
1991
1992
1993
1994
1995
1996
1997
1998
1999
2000
2001
2002
2003
2004
2005
2006
2007
2008
2009
2010
2011
2012
2013
2014
2015
Proportionofca
shfrom
buybacks
DividendsandBu
ybacks(inbillio
ns)
DividendsandBuybacks- USCompanies
StockBuybacks Dividends Proportion fromBuybacks

152
Anditsgoingglobal..
Aswath Damodaran
152
The 2015 Numbers

153
V.Andtherearedifferencesacrosscountries…
Aswath Damodaran
153

154
MeasuresofDividendPolicy
Aswath Damodaran
154
¨ DividendPayout=Dividends/NetIncome¤ Measuresthepercentageofearningsthatthecompanypaysindividends
¤ Ifthenetincomeisnegative,thepayoutratiocannotbecomputed.
¨ DividendYield=Dividendspershare/Stockprice¤ Measuresthereturnthataninvestorcanmakefromdividendsalone
¤ Becomespartoftheexpectedreturnontheinvestment.

155
DividendPayoutRatio:January2016
Aswath Damodaran
155
0.00%
2.00%
4.00%
6.00%
8.00%
10.00%
12.00%
14.00%
16.00%
18.00%
<10% 10-20% 20-30% 30-40% 40-50% 50-60% 60-70% 70-80% 80-90% 90-100% >100%
DividendPayoutRatio:USandGlobal
US
Global

156
DividendYields:January2016
Aswath Damodaran
156
0.00%
2.00%
4.00%
6.00%
8.00%
10.00%
12.00%
14.00%
16.00%
<.5% .5-1% 1-1.5%1.5-2%2-2.5%2.5-3%3-3.5%3.5-4%4-4.5%4.5-5%5-5.5%5.5-6%6-6.6%6.5-7%7-7.5%7/5-8% >8%
DividendYields: USandGlobalCompanies
US
Global

Aswath Damodaran157

158
DividendYieldsandPayoutRatios:GrowthClasses
Aswath Damodaran
158
0.00%
0.50%
1.00%
1.50%
2.00%
2.50%
3.00%
3.50%
4.00%
0.00%
5.00%
10.00%
15.00%
20.00%
25.00%
30.00%
35.00%
40.00%
45.00%
50.00%
0-3% 3-5% 5-10% 10-15% 15-20% 20-25% >25%
DividendYieldsandPayoutRatios:ByGrowthClass
DividendPayoutratio
DividendYield

159
DividendPolicy:Disney,Vale,TataMotors,Baidu andDeutscheBank
Aswath Damodaran
159
Disney Vale Tata Motors Baidu Deutsche Bank Dividend Yield - Last 12 months 1.09% 6.56% 1.31% 0.00% 1.96% Dividend Payout ratio - Last 12 months 21.58% 113.45% 16.09% 0.00% 362.63% Dividend Yield - 2008-2012 1.17% 4.01% 1.82% 0.00% 3.14% Dividend Payout - 2008-2012 17.11% 37.69% 15.53% 0.00% 37.39%

160
ThreeSchoolsOfThoughtOnDividends
1. Iftherearenotaxdisadvantagesassociatedwithdividends& companiescanissuestock,atnoissuancecost,toraiseequity,wheneverneeded
Dividendsdonotmatter,anddividendpolicydoesnotaffectvalue.
2. Ifdividendscreateataxdisadvantageforinvestors(relativetocapitalgains)
Dividendsarebad,andincreasingdividendswillreducevalue3. Ifdividendscreateataxadvantageforinvestors
(relativetocapitalgains)and/orstockholderslikedividends
Dividendsaregood,andincreasingdividendswillincreasevalue
Aswath Damodaran

161
Thebalancedviewpoint
Aswath Damodaran
161
¨ Ifacompanyhasexcesscash,andfewgoodinvestmentopportunities(NPV>0),returningmoneytostockholders(dividendsorstockrepurchases)isgood.
¨ Ifacompanydoesnothaveexcesscash,and/orhasseveralgoodinvestmentopportunities(NPV>0),returningmoneytostockholders(dividendsorstockrepurchases)isbad.

162
TheDividendsdon’tmatterschoolTheMillerModiglianiHypothesis
Aswath Damodaran
162
¨ TheMiller-Modigliani Hypothesis:Dividends donotaffect value¨ Basis:
¤ Ifafirm's investmentpolicies(andhencecashflows)don't change,thevalueof thefirmcannotchangeasitchangesdividends.
¤ Ifafirmpaysmore individends, itwillhavetoissuenewequity tofund thesameprojects.Bydoing so,itwillreduceexpectedpriceappreciationon thestockbut itwillbeoffsetbyahigherdividend yield.
¤ Ifweignorepersonal taxes,investorshavetobeindifferent toreceivingeitherdividends orcapitalgains.
¨ UnderlyingAssumptions:(a)Thereareno taxdifferences toinvestorsbetweendividends andcapitalgains.(b) Ifcompaniespaytoomuchincash,theycanissuenewstock,withnoflotation costsorsignalingconsequences, toreplacethiscash.(c)Ifcompaniespaytoo littleindividends, theydonotusetheexcesscashforbadprojectsoracquisitions.

163
II.TheDividendsare“bad” school:Andtheevidencetobackthemup…
Aswath Damodaran
163
0.00%
10.00%
20.00%
30.00%
40.00%
50.00%
60.00%
70.00%
80.00%
90.00%
100.00%
191619181920192219241926192819301932193419361938194019421944194619481950195219541956195819601962196419661968197019721974197619781980198219841986198819901992199419961998200020022004200620082010201120132015
Figure10.10:TaxratesonDividendsandCapitalGains- US
Dividendtaxrate Capitalgainstaxrate
Difference betweendividendtaxrate&capitalgainspeaksat66%in1950s.
Dividends&capital gainstaxedatsameratesince2003.

164
Whatdoinvestorsinyourstockthinkaboutdividends?Cluesontheex-dividendday!
Aswath Damodaran
164
¨ Assumethatyouaretheownerofastockthatisapproachinganex-dividenddayandyouknowthatdollardividendwithcertainty.Inaddition,assumethatyouhaveownedthestockforseveralyears.
P=Priceatwhichyouboughtthestocka“while” backPb=Pricebefore thestockgoesex-dividendPa=Priceafter thestockgoesex-dividendD=Dividends declaredonstockto,tcg =Taxes paidonordinaryincomeandcapitalgainsrespectively
Ex-dividend day
Dividend = $ D
Initial buyAt $P
Pb Pa

165
CashflowsfromSellingaroundEx-DividendDay
Aswath Damodaran
165
¨ Thecashflowsfromsellingbeforeex-dividenddayare:Pb - (Pb - P)tcg
¨ Thecashflowsfromsellingafterex-dividenddayare:Pa - (Pa - P)tcg +D(1-to)
¨ Sincetheaverageinvestorshouldbeindifferentbetweensellingbeforetheex-dividenddayandsellingaftertheex-dividendday-Pb - (Pb - P)tcg =Pa - (Pa - P)tcg +D(1-to)
¨ Somebasicalgebraleadsustothefollowing:
€
Pb −PaD
=1− to1− tcg

166
IntuitiveImplications
Aswath Damodaran
166
¨ Therelationshipbetweenthepricechangeontheex-dividenddayandthedollardividendwillbedeterminedbythedifferencebetweenthetaxrateondividendsandthetaxrateoncapitalgainsforthetypicalinvestorinthestock.
Tax Rates Ex-dividend day behavior
If dividends and capital gains are taxed equally
Price change = Dividend
If dividends are taxed at a higher rate than capital gains
Price change < Dividend
If dividends are taxed at a lower rate than capital gains
Price change > Dividend

167
Theempiricalevidence…
Aswath Damodaran
167
•Ordinarytaxrate=70%•Capitalgainsrate=28%•Pricechangeas%ofDividend=78%
1966-1969
•Ordinarytaxrate=50%•Capitalgainsrate=20%•Pricechangeas%ofDividend=85%
1981-1985
•Ordinarytaxrate=28%•Capitalgainsrate=28%•Pricechangeas%ofDividend=90%
1986-1990

168
DividendArbitrage
Aswath Damodaran
168
¨ Assumethatyouareataxexemptinvestor,andthatyouknowthatthepricedropontheex-dividenddayisonly90%ofthedividend.Howwouldyouexploitthisdifferential?a. Investinthestockforthelongtermb. Sellshortthedaybeforetheex-dividendday,buyonthe
ex-dividenddayc. Buyjustbeforetheex-dividendday,andsellafter.d. ______________________________________________

169
Exampleofdividendcapturestrategywithtaxfactors
Aswath Damodaran
169
¨ XYZcompanyissellingfor$50atcloseoftradingMay3.OnMay4,XYZgoesex-dividend;thedividendamountis$1.Thepricedrop(frompastexaminationofthedata)isonly90%ofthedividendamount.
¨ Thetransactionsneededbyatax-exemptU.S.pensionfundforthearbitrageareasfollows:¤ 1.Buy1million sharesofXYZstockcum-dividend at$50/share.¤ 2.Waittillstockgoesex-dividend; Sellstockfor$49.10/share(50- 1*0.90)
¤ 3.Collectdividendonstock.¨ Netprofit=- 50million+49.10million+1million=$0.10million

170
Twobadreasonsforpayingdividends1.Thebirdinthehandfallacy
Aswath Damodaran
170
¨ Argument:Dividendsnowaremorecertainthancapitalgainslater.Hencedividendsaremorevaluablethancapitalgains.Stocksthatpaydividendswillthereforebemorehighlyvaluedthanstocksthatdonot.
¨ Counter:Theappropriatecomparisonshouldbebetweendividendstodayandpriceappreciationtoday.Thestockpricedropsontheex-dividendday.

171
2.Wehaveexcesscashthisyear…
Aswath Damodaran
171
¨ Argument:Thefirmhasexcesscashonitshandsthisyear,noinvestmentprojectsthisyearandwantstogivethemoneybacktostockholders.
¨ Counter:Sowhynotjustrepurchasestock?Ifthisisaone-timephenomenon,thefirmhastoconsiderfuturefinancingneeds.Thecostofraisingnewfinancinginfutureyears,especiallybyissuingnewequity,canbestaggering.
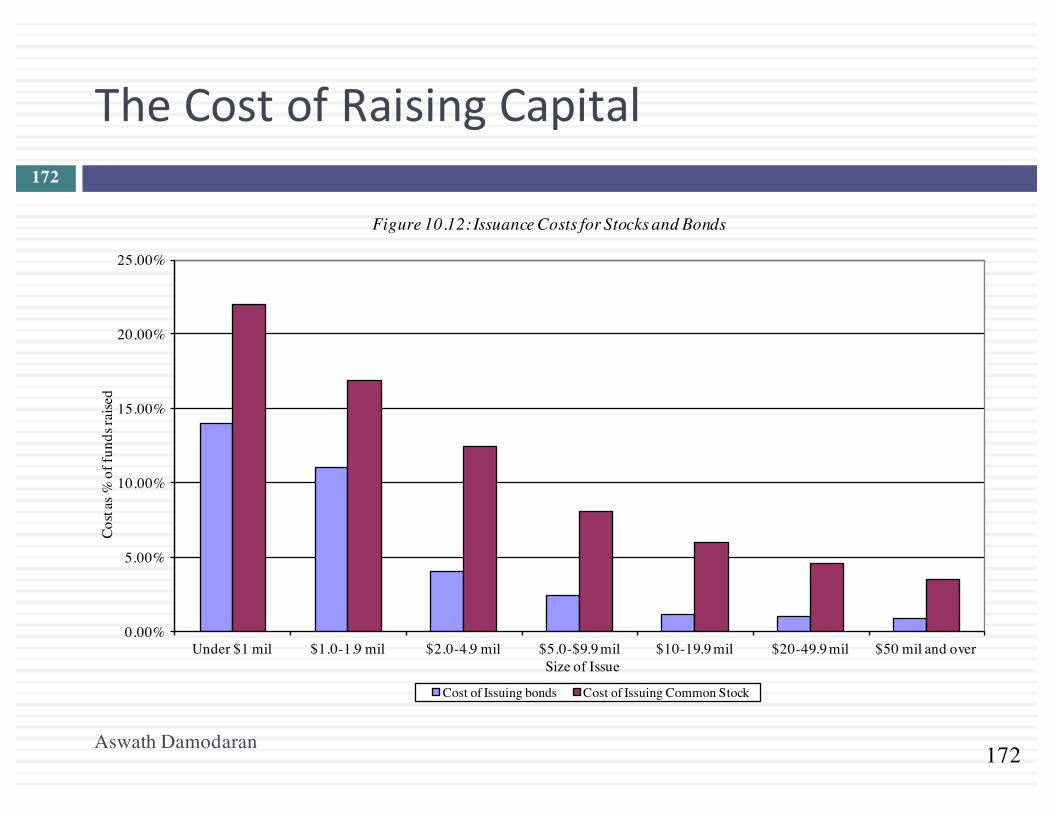
172
TheCostofRaisingCapital
Aswath Damodaran
172
0.00%
5.00%
10.00%
15.00%
20.00%
25.00%
Under $1 mil $1.0-1.9 mil $2.0-4.9 mil $5.0-$9.9 mil $10-19.9 mil $20-49.9 mil $50 mil and over
Cost
as %
of f
unds
raise
d
Size of Issue
Figure 10.12: Issuance Costs for Stocks and Bonds
Cost of Issuing bonds Cost of Issuing Common Stock

173
Three“good” reasonsforpayingdividends…
Aswath Damodaran
173
¨ ClienteleEffect:Theinvestorsinyourcompanylikedividends.
¨ TheSignallingStory:Dividendscanbesignalstothemarketthatyoubelievethatyouhavegoodcashflowprospectsinthefuture.
¨ TheWealthAppropriationStory:Dividendsareonewayoftransferringwealthfromlenderstoequityinvestors(thisisgoodforequityinvestorsbutbadforlenders)

174
1.TheClienteleEffectThe“strangecase” ofCitizen’sUtility
Aswath Damodaran
174
Class A shares pay cash dividend
Class B shares offer the same amount as a stock dividend & can be converted to class A shares

175
EvidencefromCanadianfirms
Aswath Damodaran
175
Company Premium for cash dividend sharesConsolidated Bathurst + 19.30%Donfasco + 13.30%Dome Petroleum + 0.30%Imperial Oil +12.10% Newfoundland Light & Power + 1.80%Royal Trustco + 17.30%Stelco + 2.70%TransAlta +1.10%Average across companies + 7.54%

176
Aclientelebasedexplanation
Aswath Damodaran
176
¨ Basis:Investorsmayformclientelesbasedupontheirtaxbrackets.Investorsinhightaxbracketsmayinvestinstockswhichdonotpaydividendsandthoseinlowtaxbracketsmayinvestindividendpayingstocks.
¨ Evidence:Astudyof914investors'portfolioswascarriedouttoseeiftheirportfoliopositionswereaffectedbytheirtaxbrackets.Thestudyfoundthat¤ (a)Olderinvestorsweremorelikelytoholdhighdividendstocksand
¤ (b)Poorerinvestorstendedtoholdhighdividendstocks

ResultsfromRegression:ClienteleEffect
DividendYieldt= a+ bbt+ c Aget+ d Incomet+ eDifferential Tax Ratet+et
Variable Coefficient Implies
Constant 4.22%
BetaCoefficient -2.145 Higher betastocks pay lower dividends.
Age/100 3.131 Firms witholder investors pay higher
dividends.
Income/1000 -3.726 Firms withwealthier investors pay lower
dividends.
Differential Tax Rate -2.849 If ordinary incomeis taxedatahigher rate
thancapital gains, thefirmpays less
dividends.

178
DividendPolicyandClientele
Aswath Damodaran
178
¨ Assumethatyourunaphonecompany,andthatyouhavehistoricallypaidlargedividends.Youarenowplanningtoenterthetelecommunicationsandmediamarkets.Whichofthefollowingpathsareyoumostlikelytofollow?
a. Courageouslyannouncetoyourstockholdersthatyouplantocutdividendsandinvestinthenewmarkets.
b. Continuetopaythedividendsthatyouusedto,anddeferinvestmentinthenewmarkets.
c. Continuetopaythedividendsthatyouusedto,maketheinvestmentsinthenewmarkets,andissuenewstocktocovertheshortfall
d. Other

179
2.Dividendssendasignal”Increasesindividendsaregoodnews..
Aswath Damodaran
179

180
Buthigherornewdividendsmaysignalbadnews(notgood)
Aswath Damodaran
180
0.00%
5.00%
10.00%
15.00%
20.00%
25.00%
30.00%
35.00%
40.00%
45.00%
-4 -3 -2 -1 1 2 3 4
Annu
alEa
rningsGrowthRate
Yearrelativetodividendinitiation(Beforeandafter)
DividendInitiationsandEarningsGrowth

Bothdividendincreasesanddecreasesarebecominglessinformative…
-6.00%
-5.00%
-4.00%
-3.00%
-2.00%
-1.00%
0.00%
1.00%
1962-1974 1975-1987 1988-2000
Market Reaction to Dividend Changes over time: US companies
DividendIncreases
DividendDecreases

3.Dividendincreasesmaybegoodforstocks…butbadforbonds..
-2
-1.5
-1
-0.5
0
0.5
t:-15
-12 -9 -6 -3 0 3 6 9 12 15
CAR (Div Up)
CAR (Div down)
EXCESS RETURNS ON STOCKS AND BONDS AROUND DIVIDEND CHANGES
Day (0: Announcement date)
CAR
Bond price drops
Stock price rises

183
Whatmanagersbelieveaboutdividends…
Aswath Damodaran
183

ASSESSINGDIVIDENDPOLICY:ORHOWMUCHCASHISTOOMUCH?
ItismycashandIwantitnow…
Aswath Damodaran 184

185
TheBigPicture…
Aswath Damodaran
185
The Investment DecisionInvest in assets that earn a
return greater than the minimum acceptable hurdle
rate
The Financing DecisionFind the right kind of debt for your firm and the right mix of debt and equity to
fund your operations
The Dividend DecisionIf you cannot find investments
that make your minimum acceptable rate, return the cash
to owners of your business
The hurdle rate should reflect the riskiness of the investment and the mix of debt and equity used
to fund it.
The return should reflect the magnitude and the timing of the
cashflows as well as all side effects.
The optimal mix of debt and equity
maximizes firm value
The right kind of debt
matches the tenor of your
assets
How much cash you can
return depends upon
current & potential
investment opportunities
How you choose to return cash to the owners will
depend on whether they
prefer dividends or buybacks
Maximize the value of the business (firm)

186
AssessingDividendPolicy
Aswath Damodaran
186
¨ Approach1:TheCash/TrustNexus¤ Assesshowmuchcashafirmhasavailabletopayindividends,relativewhatitreturnstostockholders.Evaluatewhetheryoucantrustthemanagersofthecompanyascustodiansofyourcash.
¨ Approach2:PeerGroupAnalysis¤ Pickadividendpolicyforyourcompanythatmakesitcomparabletootherfirmsinitspeergroup.

187
I.TheCash/TrustAssessment
Aswath Damodaran
187
Step1:Howmuchdidthethecompanyactuallypayoutduringtheperiodinquestion?Step2:Howmuchcouldthecompanyhavepaidoutduringtheperiodunderquestion?Step3:HowmuchdoItrustthemanagementofthiscompanywithexcesscash?
¤ Howwelldidtheymakeinvestmentsduringtheperiodinquestion?
¤ Howwellhasmystockperformedduringtheperiodinquestion?

188
Howmuchhasthecompanyreturnedtostockholders?
Aswath Damodaran
188
¨ Asfirmsincreasingusestockbuybacks,wehavetomeasurecashreturnedtostockholdersasnotonlydividendsbutalsobuybacks.
¨ Forinstance,forthefivecompaniesweareanalyzingthecashreturnedlookedasfollows.
Disney Vale TataMotors Baidu DeutscheBankYear Dividends Buybacks Dividends Buybacks Dividends Buybacks Dividends Buybacks Dividends Buybacks2008 $648 $648 $2,993 $741 7,595₹ 0₹ ¥0 ¥0 2,274€ 0€2009 $653 $2,669 $2,771 $9 3,496₹ 0₹ ¥0 ¥0 309€ 0€2010 $756 $4,993 $3,037 $1,930 10,195₹ 0₹ ¥0 ¥0 465€ 0€2011 $1,076 $3,015 $9,062 $3,051 15,031₹ 0₹ ¥0 ¥0 691€ 0€2012 $1,324 $4,087 $6,006 $0 15,088₹ 970₹ ¥0 ¥0 689€ 0€
2008-12 $4,457 $15,412 $23,869 $5,731 51,405₹ 970₹ ¥0 ¥0 ¥4,428 ¥0

189
AMeasureofHowMuchaCompanyCouldhaveAffordedtoPayout:FCFE
Aswath Damodaran
189
¨ TheFreeCashflow toEquity(FCFE)isameasureofhowmuchcashisleftinthebusiness afternon-equity claimholders (debtandpreferred stock)havebeenpaid,andafteranyreinvestmentneeded tosustainthefirm’sassetsandfuturegrowth.
NetIncome+Depreciation&Amortization=CashflowsfromOperationstoEquityInvestors- PreferredDividends- CapitalExpenditures- WorkingCapitalNeeds=FCFEbeforenetdebtcashflow(Owner’sEarnings)+NewDebtIssues- DebtRepayments=FCFEafternetdebtcashflow

190
EstimatingFCFEwhenLeverageisStable
Aswath Damodaran
190
¨ Thecashflowfromdebt(debt issue,nettedoutagainstrepayment)canbeavolatilenumber, creatingbigincreases ordecreases inFCFE,dependingupontheperiodexamined.
¨ Toprovideamorebalancedmeasure, youcanestimateaFCFE,assumingastabledebtratiohadbeenusedtofundreinvestment overtheperiod.NetIncome- (1- DebtRatio)(CapitalExpenditures- Depreciation)- (1- DebtRatio)WorkingCapitalNeeds=FreeCashflowtoEquityDebtRatio=Debt/CapitalRatio(eitheranactualoratarget)

191
Disney’sFCFEandCashReturned:2008–2012
Aswath Damodaran
2012 2011 2010 2009 2008 Aggregate
Net Income $6,136 $5,682 $4,807 $3,963 $3,307 $23,895
- (Cap. Exp - Depr) $604 $1,797 $1,718 $397 $122 $4,638
- ∂ Working Capital ($133) $940 $950 $308 ($109) $1,956
Free CF to Equity (pre-debt) $5,665 $2,945 $2,139 $3,258 $3,294 $17,301
+ Net Debt Issued $1,881 $4,246 $2,743 $1,190 ($235) $9,825
= Free CF to Equity (actual debt) $7,546 $7,191 $4,882 $4,448 $3,059 $27,126
Free CF to Equity (target debt ratio) $5,720 $3,262 $2,448 $3,340 $3,296 $18,065
Dividends $1,324 $1,076 $756 $653 $648 $4,457
Dividends + Buybacks $5,411 $4,091 $5,749 $3,322 $1,296 $19,869
Disney returned about $1.5 billion more than the $18.1 billion it had available as FCFE with a normalized debt ratio of 11.58% (its current debt ratio).

192
Howcompaniesgetbigcashbalances:Microsoftin1996…
Aswath Damodaran
192
¨ Consider thefollowinginputsforMicrosoft in1996.¤ NetIncome=$2,176Million¤ CapitalExpenditures =$494Million¤ Depreciation =$480Million¤ ChangeinNon-CashWorkingCapital=$35Million¤ Debt=None
FCFE= NetIncome - (Capex- Depr)– Change innon-cashWC– DebtCF= $2,176 - (494- 480)- $35 - 0= $2,127Million
¨ Bythisestimation,Microsoft couldhavepaid$2,127Millionindividends/stock buybacksin1996.Theypaidnodividendsandboughtbacknostock.Wherewillthe$2,127millionshowupinMicrosoft’sbalancesheet?

193
FCFEforaBank?
¨ Weredefine reinvestment asinvestment inregulatorycapital.
FCFEBank=Net Income– Increase inRegulatoryCapital (BookEquity)¨ Considerabankwith$10billion inloansoutstanding andbookequityof$750
million. Ifitmaintains itscapitalratioof7.5%,intends togrowits loanbaseby10%(to$11andexpects togenerate$150million innet income:
FCFE=$150million – (11,000-10,000)*(.075)=$75million
Aswath Damodaran
Deutsche Bank: FCFE estimates (November 2013)Current 1 2 3 4 5
Risk Adjusted Assets (grows 3% each year) 439,851 € 453,047 € 466,638 € 480,637 € 495,056 € 509,908 €Tier 1 as % of Risk Adj assets 15.13% 15.71% 16.28% 16.85% 17.43% 18.00%Tier 1 Capital 66,561 € 71,156 € 75,967 € 81,002 € 86,271 € 91,783 €Change in regulatory capital 4,595 € 4,811 € 5,035 € 5,269 € 5,512 €Book Equity 76,829 € 81,424 € 86,235 € 91,270 € 96,539 € 102,051 €ROE (increases to 8%) -1.08% 0.74% 2.55% 4.37% 6.18% 8.00%Net Income -716 € 602 € 2,203 € 3,988 € 5,971 € 8,164 €- Investment in Regulatory
Capital 4,595 € 4,811 € 5,035 € 5,269 € 5,512 €FCFE -3,993 € -2,608 € -1,047 € 702 € 2,652 €

194
DividendsversusFCFE:Acrosstheglobe
0.00%
10.00%
20.00%
30.00%
40.00%
50.00%
60.00%
70.00%
Australia,NZandCanada
DevelopedEurope
EmergingMarkets
Japan UnitedStates Global
Figure11.2:DividendsversusFCFEin2014
FCFE<0,Nodividends
FCFE<0,Dividends
FCFE>0,FCFE<Dividends
FCFE>0,Nodividends
FCFE>0,FCFE>Dividends
Aswath Damodaran

195
CashBuildupandInvestorBlowback:Chryslerin1994
Aswath Damodaran
195
Chrysler: FCFE, Dividends and Cash Balance
($500)
$0
$500
$1,000
$1,500
$2,000
$2,500
$3,000
1985 1986 1987 1988 1989 1990 1991 1992 1993 1994
Yea r
Cash
Fl
ow
$0
$1,000
$2,000
$3,000
$4,000
$5,000
$6,000
$7,000
$8,000
$9,000
Cash
Ba
lanc
e
= Free CF to Equity = Cash to Stockholders Cumulated Cash

196
6 ApplicationTest:Estimatingyourfirm’sFCFE
Aswath Damodaran
196
¨ InGeneral, IfcashflowstatementusedNetIncome NetIncome+Depreciation&Amortization +Depreciation&Amortization- CapitalExpenditures +CapitalExpenditures- Change inNon-CashWorkingCapital +ChangesinNon-cashWC- Preferred Dividend +Preferred Dividend- PrincipalRepaid +Increase inLTBorrowing+NewDebtIssued +Decrease inLTBorrowing
+ChangeinSTBorrowing=FCFE =FCFE
¨ ComparetoDividends (Common) CommonDividend+StockBuybacks StockBuybacks

197
APracticalFrameworkforAnalyzingDividendPolicy
Aswath Damodaran
197
How much did the firm pay out? How much could it have afforded to pay out?What it could have paid out What it actually paid outNet Income Dividends- (Cap Ex - Depr’n) (1-DR) + Equity Repurchase- Chg Working Capital (1-DR)= FCFE
Firm pays out too littleFCFE > Dividends Firm pays out too much
FCFE < Dividends
Do you trust managers in the company withyour cash?Look at past project choice:Compare ROE to Cost of Equity
ROC to WACC
What investment opportunities does the firm have?Look at past project choice:Compare ROE to Cost of Equity
ROC to WACC
Firm has history of good project choice and good projects in the future
Firm has historyof poor project choice
Firm has good projects
Firm has poor projects
Give managers the flexibility to keep cash and set dividends
Force managers to justify holding cash or return cash to stockholders
Firm should cut dividends and reinvest more
Firm should deal with its investment problem first and then cut dividends

198
ADividendMatrix
Aswath Damodaran
198
Quality of projects taken: Excess ReturnsPoor projects Good projects
Cash Surplus + Good ProjectsMaximum flexibility in setting dividend policy
Cash Surplus + Poor ProjectsSignificant pressure to pay out more to stockholders as dividends or stock buybacks
Cash Deficit + Good ProjectsReduce cash payout, if any, to stockholders
Cash Deficit + Poor ProjectsReduce or eliminate cash return but real problem is in investment policy.
Cas
h R
etur
ned,
rela
tive
to F
ree
Cas
h flo
w to
Equ
ity
Cas
h R
etur
n <
FCFE
Cas
h re
turn
> F
CFE

199
MoreonMicrosoft
Aswath Damodaran
199
¨ Microsofthadaccumulatedacashbalanceof$43billionby2002bypayingoutnodividendswhilegeneratinghugeFCFE.Attheendof2003,therewasnoevidencethatMicrosoftwasbeingpenalizedforholdingsuchalargecashbalanceorthatstockholderswerebecomingrestiveaboutthecashbalance.Therewasnohueandcrydemandingmoredividendsorstockbuybacks.Why?
¨ In2004,Microsoftannouncedahugespecialdividendof$33billionandmadeclearthatitwouldtrytoreturnmorecashtostockholdersinthefuture.Whatdoyouthinkchanged?

200
Case1:Disneyin2003
Aswath Damodaran
200
¨ FCFEversusDividends¤ Between 1994&2003,Disneygenerated$969millioninFCFEeach
year.¤ Between 1994&2003,Disneypaidout$639millionindividendsand
stockbuybackseachyear.¨ CashBalance
¤ Disneyhadacashbalance inexcessof$4billionattheendof2003.¨ Performancemeasures
¤ Between 1994and2003,Disneyhasgeneratedareturnonequity,onit’sprojects,about2%less thanthecostofequity,onaverageeachyear.
¤ Between 1994and2003,Disney’sstockhasdelivered about3%lessthanthecostofequity,onaverageeachyear.
¤ Theunderperformance hasbeenprimarilypost1996(after theCapitalCitiesacquisition).

201
CanyoutrustDisney’smanagement?
Aswath Damodaran
201
¨ GivenDisney’strackrecordbetween1994and2003,ifyouwereaDisneystockholder,wouldyoubecomfortablewithDisney’sdividendpolicy?
a. Yesb. No¨ DoesthefactthatthecompanyisrunbyMichaelEisner,theCEOforthelast10yearsandtheinitiatoroftheCapCitiesacquisitionhaveaneffectonyourdecision.
a. Yesb. No

202
TheBottomLineonDisneyDividendsin2003
Aswath Damodaran
202
¨ Disneycouldhaveaffordedtopaymoreindividendsduringtheperiodoftheanalysis.
¨ Itchosenotto,andusedthecashforacquisitions(CapitalCities/ABC)andillfatedexpansionplans(Go.com).
¨ Whilethecompanymayhaveflexibilitytosetitsdividendpolicyadecadeago,itsactionsoverthatdecadehavefritteredawaythisflexibility.
¨ Bottomline:Largecashbalanceswouldnotbetoleratedinthiscompany.Expecttofacerelentlesspressuretopayoutmoredividends.

203
Followingup:Disneyin2009
¨ Between2004and2008,Disneymadesignificantchanges:¤ Itreplaced itsCEO,MichaelEisner,withanewCEO,BobIger,whoat
leastonthesurface seemedtobemorereceptive tostockholderconcerns.
¤ Itsstockpriceperformance improved(positive Jensen’salpha)¤ Itsprojectchoiceimproved (ROCmoved frombeingwellbelowcostof
capitaltoabove)¨ Thefirmalsoshiftedfromcashreturned<FCFEtocash
returned>FCFEandavoidedmakinglargeacquisitions.¨ Ifyouwereastockholderin2009andIgermadeapleato
retaincashinDisneytopursueinvestmentopportunities,wouldyoubemorereceptive?a. Yesb. No
Aswath Damodaran

204
Finaltwist:Disneyin2013
¨ Disneydidreturntoholdingcashbetween2008and2013,withdividendsandbuybacksamountingto$2.6billionlessthantheFCFE(withatargetdebtratio)overthisperiod.
¨ Disneycontinuestoearnareturnoncapitalwellinexcessofthecostofcapitalanditsstockhasdoubledoverthelasttwoyears.
¨ Now,assumethatBobIger asksyouforpermissiontowithholdevenmorecashtocoverfutureinvestmentneeds.Areyoulikelytogoalong?
a. Yesb. No
Aswath Damodaran

205
Case2:Vale– DividendsversusFCFE
Aswath Damodaran
Aggregate AverageNet Income $57,404 $5,740 Dividends $36,766 $3,677 Dividend Payout Ratio $1 $1 Stock Buybacks $6,032 $603 Dividends + Buybacks $42,798 $4,280 Cash Payout Ratio $1 Free CF to Equity (pre-debt) ($1,903) ($190)Free CF to Equity (actual debt) $1,036 $104
Free CF to Equity (target debt ratio) $19,138 $1,914
Cash payout as % of pre-debt FCFE FCFE negativeCash payout as % of actual FCFE 4131.08%Cash payout as % of target FCFE 223.63%

206
Vale:Itsyourcall..
¨ Vale’smanagershaveasked youforpermission tocutdividends (tomoremanageable levels).Areyoulikely togoalong?a. Yesb. No
¨ ThereasonsforVale’sdividendproblem lieinit’sequitystructure.LikemostBraziliancompanies,Valehastwoclassesofshares-common shareswithvotingrightsandpreferred shareswithoutvotingrights.However, Valehascommittedtopayingout35%ofitsearnings asdividends tothepreferred stockholders. Iftheyfailtomeetthisthreshold,thepreferred sharesgetvotingrights.Ifyouownthepreferred shares,wouldyouranswertothequestionabovechange?a. Yesb. No
Aswath Damodaran

207
MandatedDividendPayouts
Aswath Damodaran
207
¨ Assumenowthatthegovernmentdecidestomandateaminimumdividendpayoutforallcompanies.GivenourdiscussionofFCFE,whattypesofcompanieswillbehurtthemostbysuchamandate?
a. Largecompaniesmakinghugeprofitsb. Smallcompanieslosingmoneyc. Highgrowthcompaniesthatarelosingmoneyd. Highgrowthcompaniesthataremakingmoney¨ Whatifthegovernmentmandatesacaponthedividendpayoutratio(andarequirementthatallcompaniesreinvestaportionoftheirprofits)?

208
Case3:BP:SummaryofDividendPolicy:1982-1991
Aswath Damodaran
208
Summary of calculationsAverage Standard Deviation Maximum Minimum
Free CF to Equity $571.10 $1,382.29 $3,764.00 ($612.50)Dividends $1,496.30 $448.77 $2,112.00 $831.00Dividends+Repurchases $1,496.30 $448.77 $2,112.00 $831.00
Dividend Payout Ratio 84.77%Cash Paid as % of FCFE 262.00%
ROE - Required return -1.67% 11.49% 20.90% -21.59%

209
BP:JustDesserts!
Aswath Damodaran
209

210
Managingchangesindividendpolicy
Aswath Damodaran
210
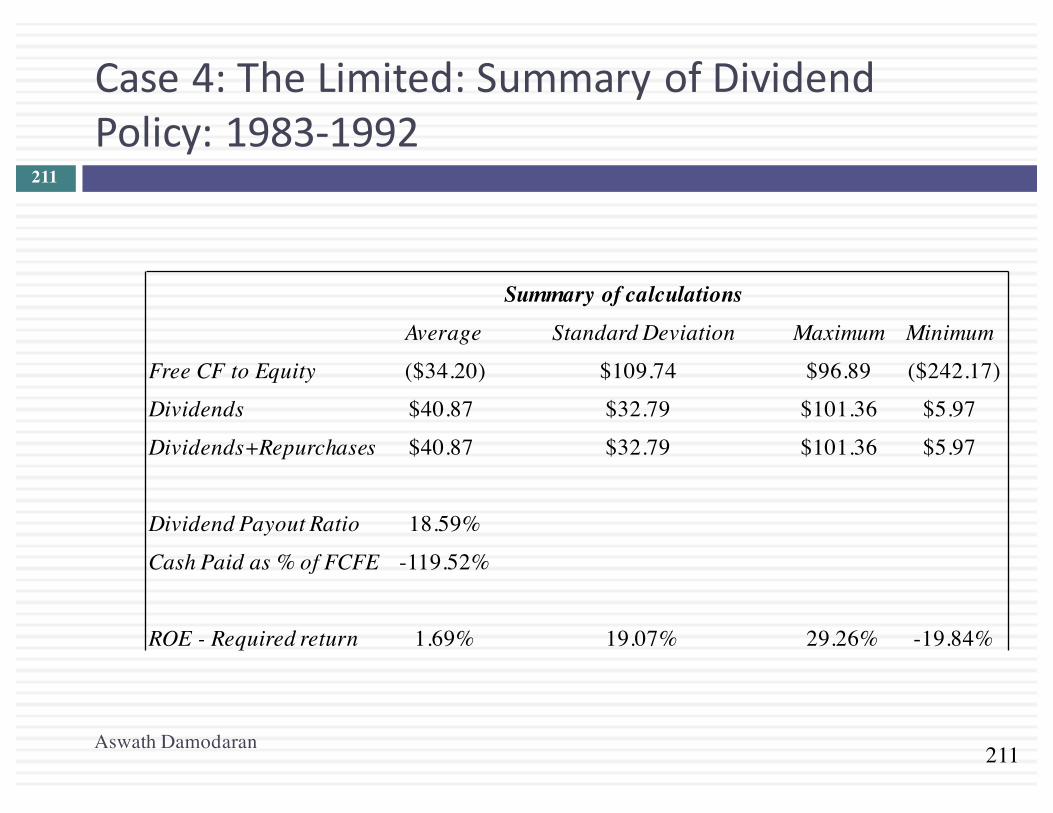
211
Case4:TheLimited:SummaryofDividendPolicy:1983-1992
Aswath Damodaran
211
Summary of calculationsAverage Standard Deviation Maximum Minimum
Free CF to Equity ($34.20) $109.74 $96.89 ($242.17)Dividends $40.87 $32.79 $101.36 $5.97
Dividends+Repurchases $40.87 $32.79 $101.36 $5.97
Dividend Payout Ratio 18.59%
Cash Paid as % of FCFE -119.52%
ROE - Required return 1.69% 19.07% 29.26% -19.84%

212
GrowthFirmsandDividends
Aswath Damodaran
212
¨ Highgrowthfirmsaresometimesadvisedtoinitiatedividendsbecauseitsincreasesthepotentialstockholderbaseforthecompany(sincetherearesomeinvestors- likepensionfunds- thatcannotbuystocksthatdonotpaydividends)and,byextension,thestockprice.Doyouagreewiththisargument?
a. Yesb. No¨ Why?

213
5.TataMotors
Negative FCFE, largely because of acquisitions.
Aswath Damodaran
Aggregate AverageNet Income $421,338.00 $42,133.80 Dividends $74,214.00 $7,421.40 Dividend Payout Ratio 17.61% 15.09%Stock Buybacks $970.00 $97.00 Dividends + Buybacks $75,184.00 $7,518.40 Cash Payout Ratio 17.84%Free CF to Equity (pre-debt) ($106,871.00) ($10,687.10)Free CF to Equity (actual debt) $825,262.00 $82,526.20 Free CF to Equity (target debt ratio) $47,796.36 $4,779.64 Cash payout as % of pre-debt FCFE FCFE negativeCash payout as % of actual FCFE 9.11%Cash payout as % of target FCFE 157.30%

214
Summingup…
Aswath Damodaran
214
Cas
h Su
rplu
sC
ash
Defi
cit
Divid
ends
pai
d ou
t rel
ative
to F
CFE
Quality of projects taken: ROE versus Cost of EquityPoor projects Good projects
Cash Surplus + Good ProjectsMaximum flexibility in setting dividend policy
Cash Surplus + Poor ProjectsSignificant pressure to pay out more to stockholders as dividends or stock buybacks
Cash Deficit + Good ProjectsReduce cash payout, if any, to stockholders
Cash Deficit + Poor ProjectsCut out dividends but real problem is in investment policy.
Disney
Vale
Baidu
Deutsche Bank
Tata Mtrs

215
6 ApplicationTest:Assessingyourfirm’sdividendpolicy
Aswath Damodaran
215
¨ Compareyourfirm’sdividendstoitsFCFE,lookingatthelast5yearsofinformation.
¨ Baseduponyourearlieranalysisofyourfirm’sprojectchoices,wouldyouencouragethefirmtoreturnmorecashorlesscashtoitsowners?
¨ Ifyouwouldencourageittoreturnmorecash,whatformshouldittake(dividendsversusstockbuybacks)?

216
II.ThePeerGroupApproach
Aswath Damodaran
¨ Inthepeergroupapproach,youcompareyourcompanytosimilarcompanies(usuallyinthesamemarketandsector)toassesswhetherandifyes,howmuchtopayindividends.
DividendYield DividendPayoutCompany 2013 Average2008-12 2013 Average2008-12 ComparableGroup DividendYield DividendPayoutDisney 1.09% 1.17% 21.58% 17.11% US Entertainment 0.96% 22.51%
Vale 6.56% 4.01% 113.45% 37.69%
Global Diversified Mining & Iron Ore (Market cap> $1 b) 3.07% 316.32%
TataMotors 1.31% 1.82% 16.09% 15.53%Global Autos (Market
Cap> $1 b) 2.13% 27.00%
Baidu 0.00% 0.00% 0.00% 0.00%Global Online Advertising 0.09% 8.66%
DeutscheBank 1.96% 3.14% 362.63% 37.39% European Banks 1.96% 79.32%

217
AcloserlookatDisney’speergroup
Aswath Damodaran
217
Company Market
Cap Dividends Dividends +
Buybacks Net
Income FCFE Dividend
Yield Dividend Payout
Cash Return/FCFE
The Walt Disney Company $134,256 $1,324 $5,411 $6,136 $1,503 0.99% 21.58% 360.01% Twenty-First Century Fox, Inc. $79,796 $415 $2,477 $7,097 $2,408 0.52% 6.78% 102.87% Time Warner Inc $63,077 $1,060 $4,939 $3,019 -$4,729 1.68% 27.08% NA Viacom, Inc. $38,974 $555 $5,219 $2,395 -$2,219 1.42% 23.17% NA The Madison Square Garden Co. $4,426 $0 $0 $142 -$119 0.00% 0.00% NA Lions Gate Entertainment Corp $4,367 $0 $0 $232 -$697 0.00% 0.00% NA Live Nation Entertainment, Inc $3,894 $0 $0 -$163 $288 0.00% NA 0.00% Cinemark Holdings Inc $3,844 $101 $101 $169 -$180 2.64% 63.04% NA MGM Holdings Inc $3,673 $0 $59 $129 $536 0.00% 0.00% 11.00% Regal Entertainment Group $3,013 $132 $132 $145 -$18 4.39% 77.31% NA DreamWorks Animation SKG Inc. $2,975 $0 $34 -$36 -$572 0.00% NA NA AMC Entertainment Holdings $2,001 $0 $0 $63 -$52 0.00% 0.00% NA World Wrestling Entertainment $1,245 $36 $36 $31 -$27 2.88% 317.70% NA SFX Entertainment Inc. $1,047 $0 $0 -$16 -$137 0.00% NA NA Carmike Cinemas Inc. $642 $0 $0 $96 $64 0.00% 0.00% 0.27% Rentrak Corporation $454 $0 $0 -$23 -$13 0.00% NA NA Reading International, Inc. $177 $0 $0 -$1 $15 0.00% 0.00% 0.00% Average $20,462 $213 $1,083 $1,142 -$232 0.85% 41.28% 79.02% Median $3,673 $0 $34 $129 -$27 0.00% 6.78% 5.63%

218
Goingbeyondaverages…Lookingatthemarket
Aswath Damodaran
218
¨ Regressingdividend yield andpayoutagainstexpectedgrowthacrossallUScompanies inJanuary2014yields:
PYT=DividendPayoutRatio=Dividends/NetIncomeYLD=DividendYield=Dividends/CurrentPriceBETA=Beta(RegressionorBottomup)forcompanyEGR=Expectedgrowthrateinearningsovernext5years(analystestimates)DCAP=TotalDebt/(TotalDebt+MarketValueofequity)

219
UsingthemarketregressiononDisney
Aswath Damodaran
219
¨ Toillustratetheapplicability ofthemarket regression inanalyzingthedividend policyofDisney,weestimate thevaluesoftheindependent variables intheregressions forthefirm.¤ BetaforDisney(bottomup) =1.00¤ Disney’sexpectedgrowthinearningspershare=14.73%(analyst
estimate)¤ Disney’smarketdebttocapitalratio=11.58%
¨ Substitutingintotheregressionequations forthedividend payoutratioanddividendyield,weestimateapredictedpayoutratio:¤ PredictedPayout=.649– 0.296(1.00)-.800 (.1473)+.300(.1158)=.2695¤ PredictedYield=0.0324– .0154(1.00)-.038 (.1473)+.023(.1158) =.0140
¤ Basedonthisanalysis,Disneywithitsdividend yieldof1.09%andapayoutratioofapproximately 21.58%ispayingtoolittleindividends. Thisanalysis, however, failstofactorinthehugestockbuybacksmadebyDisneyoverthelastfewyears.

VALUATIONCynic:Apersonwhoknowsthepriceofeverythingbutthevalueofnothing..OscarWilde
Aswath Damodaran 220

221
FirstPrinciples
Aswath Damodaran
221

222
Threeapproachestovaluation
Aswath Damodaran
222
¨ Intrinsicvaluation:Thevalueofanassetisafunctionofitsfundamentals– cashflows,growthandrisk.Ingeneral,discountedcashflowmodelsareusedtoestimateintrinsicvalue.
¨ Relativevaluation:Thevalueofanassetisestimatedbaseduponwhatinvestorsarepayingforsimilarassets.Ingeneral,thistakestheformofvalueorpricemultiplesandcomparingfirmswithinthesamebusiness.
¨ Contingentclaimvaluation:Whenthecashflowsonanassetarecontingentonanexternalevent,thevaluecanbeestimatedusingoptionpricingmodels.

223
Onetoolforestimatingintrinsicvalue:DiscountedCashFlowValuation
Aswath Damodaran
223
Cash flows from existing assetsThe base earnings will reflect the
earnings power of the existing assets of the firm, net of taxes and
any reinvestment needed to sustain the base earnings.
Value of growthThe future cash flows will reflect expectations of how quickly earnings will grow in the future (as a positive) and how much the company will have to reinvest to generate that growth (as a negative). The net effect will determine the value of growth.
Expected Cash Flow in year t = E(CF) = Expected Earnings in year t - Reinvestment needed for growth
Risk in the Cash flowsThe risk in the investment is captured in the discount rate as a beta in the cost of equity and the default spread in the cost
of debt.
Steady stateThe value of growth comes from the capacity to generate excess
returns. The length of your growth period comes from the strength & sustainability of your competitive
advantages.

224
EquityValuation
Aswath Damodaran
224
¨ Thevalueofequity isobtainedbydiscountingexpectedcashflowstoequity, i.e.,theresidualcashflowsaftermeetingallexpenses, taxobligations andinterestandprincipal payments,atthecostofequity, i.e.,therateofreturnrequiredbyequity investorsinthefirm.
where,CFtoEquityt =ExpectedCashflowtoEquityinperiodtke=CostofEquity
¨ Thedividenddiscountmodel isaspecialized caseofequityvaluation, andthevalueofastockisthepresentvalueofexpectedfuturedividends.
Value of Equity= CF to Equityt
(1+ke )tt=1
t=n
∑

225
FirmValuation
Aswath Damodaran
225
¨ Thevalueofthefirmisobtainedbydiscountingexpectedcashflowstothefirm,i.e.,theresidualcashflowsaftermeetingalloperatingexpensesandtaxes,butpriortodebtpayments,attheweightedaveragecostofcapital,whichisthecostofthedifferentcomponentsoffinancingusedbythefirm,weightedbytheirmarketvalueproportions.
where,CFtoFirm t=Expected CashflowtoFirminperiod tWACC=WeightedAverageCostofCapital
Value of Firm= CF to Firmt
(1+WACC)tt=1
t=n
∑

226
ChoosingaCashFlowtoDiscount
Aswath Damodaran
226
¨ Whenyoucannotestimatethefreecashflowstoequityorthefirm,theonlycashflowthatyoucandiscountisdividends.Forfinancialservicefirms,itisdifficulttoestimatefreecashflows.ForDeutscheBank,wewillbediscountingdividends.
¨ Ifafirm’sdebtratioisnotexpectedtochangeovertime,thefreecashflowstoequitycanbediscountedtoyieldthevalueofequity.ForTataMotors,wewilldiscountfreecashflowstoequity.
¨ Ifafirm’sdebtratiomightchangeovertime,freecashflowstoequitybecomecumbersometoestimate.Here,wewoulddiscountfreecashflowstothefirm.ForValeandDisney,wewilldiscountthefreecashflowtothefirm.

227
TheIngredientsthatdeterminevalue.
Aswath Damodaran
227

228
I.EstimatingCashFlows
Aswath Damodaran
228

229
DividendsandModifiedDividendsforDeutscheBank
Aswath Damodaran
229
¨ In2007,DeutscheBankpaidoutdividendsof2,146millionEurosonnetincomeof6,510millionEuros. Inearly2008,wevaluedDeutscheBankusingthedividends itpaidin2007.Inmy2008valuationIamassumingthedividendsarenotonlyreasonable butsustainable.
¨ InNovember 2013,Deutsche Bank’sdividendpolicywasinflux.Notonlydiditreport lossesbutitwasonapathwaytoincrease itsregulatorycapitalratio.Rather thanfocusonthedividends (whichweresmall),weestimated thepotentialdividends (byestimatingthefreecashflowstoequityafterinvestments inregulatorycapital)
Current 2014 2015 2016 2017 2018 Steady stateAsset Base 439,851 € 453,047 € 466,638 € 480,637 € 495,056 € 509,908 € 517,556 €Capital ratio 15.13% 15.71% 16.28% 16.85% 17.43% 18.00% 18.00%Tier 1 Capital 66,561 € 71,156 € 75,967 € 81,002 € 86,271 € 91,783 € 93,160 €Change in regulatory capital 4,595 € 4,811 € 5,035 € 5,269 € 5,512 € 1,377 €Book Equity 76,829 € 81,424 € 86,235 € 91,270 € 96,539 € 102,051 € 103,605 €
ROE -1.08% 0.74% 2.55% 4.37% 6.18% 8.00% 8.00%Net Income -716 € 602 € 2,203 € 3,988 € 5,971 € 8,164 € 8,287 €- Investment in Regulatory Capital 4,595 € 4,811 € 5,035 € 5,269 € 5,512 € 1,554 €FCFE -3,993 € -2,608 € -1,047 € 702 € 2,652 € 6,733 €

230
EstimatingFCFE(past):TataMotors
Aswath Damodaran
230
Year Net IncomeCap Ex Depreciatio
nChange in
WCChange in
DebtEquity
Reinvestment
Equity Reinvestment
Rate2008-09 -25,053₹ 99,708₹ 25,072₹ 13,441₹ 25,789₹ 62,288₹ -248.63%2009-10 29,151₹ 84,754₹ 39,602₹ -26,009₹ 5,605₹ 13,538₹ 46.44%2010-11 92,736₹ 81,240₹ 46,510₹ 50,484₹ 24,951₹ 60,263₹ 64.98%2011-12 135,165₹ 138,756₹ 56,209₹ 22,801₹ 30,846₹ 74,502₹ 55.12%2012-13 98,926₹ 187,570₹ 75,648₹ 680₹ 32,970₹ 79,632₹ 80.50%Aggregate 330,925₹ 592,028₹ 243,041₹ 61,397₹ 120,160₹ 290,224₹ 87.70%

231
EstimatingFCFF:Disney
¨ InthefiscalyearendedSeptember 2013,Disneyreported thefollowing:¤ Operating income(adjusted for leases)=$10,032million¤ Effectivetaxrate=31.02%¤ CapitalExpenditures (including acquisitions) =$5,239million¤ Depreciation &Amortization =$2,192million¤ Changeinnon-cashworkingcapital=$103million
¨ Thefreecashflowtothefirmcanbecomputedasfollows:After-taxOperating Income =10,032 (1-.3102) =$6,920- NetCapExpenditures =$5,239 - $2,192 =$3,629 - ChangeinWorking Capital = =$103=FreeCashflow toFirm(FCFF) = =$3,188
¨ Thereinvestment andreinvestment rateareasfollows:¤ Reinvestment=$3,629+$103=$3,732million¤ ReinvestmentRate=$3,732/$6,920=53.93%
Aswath Damodaran

232
II.DiscountRates
Aswath Damodaran
232
¨ Criticalingredientindiscountedcashflow valuation.Errorsinestimatingthediscountrateormismatchingcashflowsanddiscountratescanleadtoseriouserrorsinvaluation.
¨ Atanintuitivelevel,thediscountrateusedshouldbeconsistentwithboththeriskinessandthetypeofcashflow beingdiscounted.
¨ Thecostofequityistherateatwhichwediscountcashflowstoequity(dividendsorfreecashflowstoequity).Thecostofcapitalistherateatwhichwediscountfreecashflowstothefirm.

233
CostofEquity:DeutscheBank2008versus2013
Aswath Damodaran
233
¨ Inearly2008,weestimatedabetaof1.162forDeutscheBank,whichusedinconjunctionwiththeEurorisk-freerateof4%(inJanuary2008)andanequityriskpremiumof4.50%,yieldedacostofequityof9.23%.CostofEquityJan2008=RiskfreeRate Jan2008+Beta*MatureMarketRiskPremium
=4.00%+1.162(4.5%)=9.23%¨ InNovember2013,theEuroriskfreeratehaddroppedto1.75%andtheDeutsche’sequityriskpremiumhadrisento6.12%:Costofequity Nov’13=Riskfree RateNov‘13 +Beta(ERP)
=1.75%+1.1516(6.12%)=8.80%

234
CostofEquity:TataMotors
Aswath Damodaran
234
¨ WewillbevaluingTataMotorsinrupeeterms.Thatisachoice.Anycompanycanbevaluedinanycurrency.
¨ Earlier,weestimatedaleveredbetaforequityof1.1007forTataMotor’soperatingassets.SincewewillbediscountingFCFEwiththeincomefromcashincludedinthecash,werecomputedabetaforTataMotorsasacompany(withcash):LeveredBetaCompany=1.1007(1428/1630)+0(202/1630)=0.964
¨ Withanominalrupeerisk-freerateof6.57percentandanequityriskpremiumof7.19%forTataMotors,wearriveatacostofequityof13.50%.
CostofEquity=6.57%+0.964(7.19%)=13.50%

235
CurrentCostofCapital:Disney
¨ ThebetaforDisney’s stockinNovember 2013was1.0013.TheT.bondrateatthattimewas2.75%.Usinganestimatedequity riskpremium of5.76%,weestimated thecostofequityforDisney tobe8.52%:CostofEquity=2.75%+1.0013(5.76%)=8.52%
¨ Disney’sbondratinginMay2009wasA,andbasedonthisrating,theestimatedpretaxcostofdebtforDisney is3.75%.Usingamarginal taxrateof36.1,theafter-taxcostofdebtforDisney is2.40%.After-TaxCostofDebt =3.75%(1– 0.361)=2.40%
¨ Thecostofcapitalwascalculatedusingthese costsandtheweightsbasedonmarket valuesofequity(121,878)anddebt(15.961):Costofcapital=
Aswath Damodaran
8.52% 121,878(15,961+121,878)
+ 2.40% 15,961(15,961+121,878)
= 7.81%

236
Butcostsofequityandcapitalcanandshouldchangeovertime…
Aswath Damodaran
Year BetaCostofEquity
After-taxCostofDebt DebtRatio Costofcapital
1 1.0013 8.52% 2.40% 11.50% 7.81%2 1.0013 8.52% 2.40% 11.50% 7.81%3 1.0013 8.52% 2.40% 11.50% 7.81%4 1.0013 8.52% 2.40% 11.50% 7.81%5 1.0013 8.52% 2.40% 11.50% 7.81%6 1.0010 8.52% 2.40% 13.20% 7.71%7 1.0008 8.51% 2.40% 14.90% 7.60%8 1.0005 8.51% 2.40% 16.60% 7.50%9 1.0003 8.51% 2.40% 18.30% 7.39%10 1.0000 8.51% 2.40% 20.00% 7.29%

237
III.ExpectedGrowth
Aswath Damodaran
237
Expected Growth
Net Income Operating Income
Retention Ratio=1 - Dividends/Net Income
Return on EquityNet Income/Book Value of Equity
XReinvestment Rate = (Net Cap Ex + Chg in WC/EBIT(1-t)
Return on Capital =EBIT(1-t)/Book Value of Capital
X
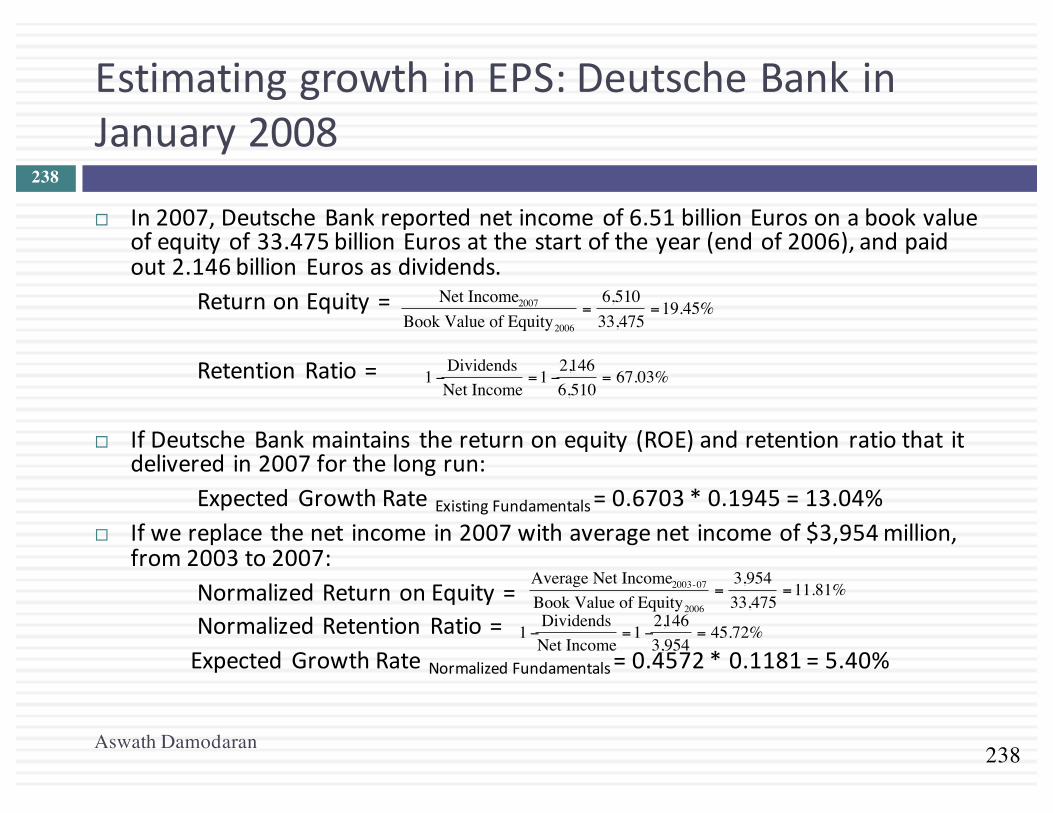
238
EstimatinggrowthinEPS:DeutscheBankinJanuary2008
Aswath Damodaran
238
¨ In2007,Deutsche Bankreportednetincome of6.51billionEurosonabookvalueofequityof33.475billionEurosatthestartoftheyear(endof2006),andpaidout2.146billion Eurosasdividends.
ReturnonEquity=
Retention Ratio=
¨ IfDeutsche Bankmaintains thereturnonequity(ROE)andretention ratiothat itdelivered in2007forthelongrun:
ExpectedGrowthRateExistingFundamentals=0.6703*0.1945=13.04%¨ Ifwereplacethenet incomein2007withaveragenet incomeof$3,954million,
from2003to2007:NormalizedReturnonEquity=NormalizedRetention Ratio=ExpectedGrowthRateNormalizedFundamentals=0.4572*0.1181=5.40%
€
Net Income2007
Book Value of Equity2006
=6,51033,475
=19.45%
€
1 −Dividends
Net Income=1 −
2,1466,510
= 67.03%
€
Average Net Income2003-07
Book Value of Equity2006
=3,95433,475
=11.81%
€
1 −Dividends
Net Income=1 −
2,1463,954
= 45.72%

239
EstimatinggrowthinNetIncome:TataMotors
Aswath Damodaran
239
Year Net IncomeCap Ex Depreciation Change in
WCChange in
DebtEquity
Reinvestment
Equity Reinvestment
Rate2008-09 -25,053₹ 99,708₹ 25,072₹ 13,441₹ 25,789₹ 62,288₹ -248.63%2009-10 29,151₹ 84,754₹ 39,602₹ -26,009₹ 5,605₹ 13,538₹ 46.44%2010-11 92,736₹ 81,240₹ 46,510₹ 50,484₹ 24,951₹ 60,263₹ 64.98%2011-12 135,165₹ 138,756₹ 56,209₹ 22,801₹ 30,846₹ 74,502₹ 55.12%2012-13 98,926₹ 187,570₹ 75,648₹ 680₹ 32,970₹ 79,632₹ 80.50%Aggregate 330,925₹ 592,028₹ 243,041₹ 61,397₹ 120,160₹ 290,224₹ 87.70%
Year NetIncomeBVofEquityatstartoftheyear ROE
2008-09 -25,053₹ 91,658₹ -27.33%2009-10 29,151₹ 63,437₹ 45.95%2010-11 92,736₹ 84,200₹ 110.14%2011-12 135,165₹ 194,181₹ 69.61%2012-13 98,926₹ 330,056₹ 29.97%Aggregate 330,925₹ 763,532₹ 43.34%
2013value
Averagevalues:2008-2013
Reinvestmentrate 80.50% 87.70%ROE 29.97% 43.34%Expectedgrowth 24.13% 38.01%

240
ROEandLeverage
Aswath Damodaran
240
¨ AhighROE,otherthingsremainingequal,shouldyieldahigherexpectedgrowthrateinequityearnings.
¨ TheROEforafirmisafunctionofboththequalityofitsinvestmentsandhowmuchdebtitusesinfundingtheseinvestments.Inparticular
ROE=ROC+D/E(ROC- i (1-t))where,
ROC=(EBIT(1- taxrate))/(BookValueofCapital)BVofCapital=BVofDebt+BVofEquity- CashD/E=Debt/Equityratioi =Interestrateondebtt=Taxrateonordinaryincome.

241
DecomposingROE
Aswath Damodaran
241
¨ Assumethatyouareanalyzingacompanywitha15%returnoncapital,anafter-taxcostofdebtof5%andabookdebttoequityratioof100%.EstimatetheROEforthiscompany.
¨ NowassumethatanothercompanyinthesamesectorhasthesameROEasthecompanythatyouhavejustanalyzedbutnodebt.Willthesetwofirmshavethesamegrowthratesinearningspershareiftheyhavethesamedividendpayoutratio?
¨ Willtheyhavethesameequityvalue?

242
EstimatingGrowthinEBIT:Disney
¨ Westartedwiththereinvestment ratethatwecomputedfromthe2013financialstatements:Reinvestment rate=Wecomputedthereinvestmentrateinprioryearstoensurethatthe2013valueswerenotunusualoroutliers.
¨ Wecompute thereturnoncapital,usingoperatingincome in2013andcapitalinvestedatthestartoftheyear:
ReturnonCapital2013 =
Disney’sreturnoncapitalhasimprovedgraduallyoverthelastdecadeandhaslevelledoffinthelasttwoyears.
¨ IfDisneymaintains its2013reinvestment rateandreturnoncapitalforthenextfiveyears, itsgrowthratewillbe6.80percent.ExpectedGrowthRatefromExistingFundamentals=53.93%*12.61%=6.8%
(3,629 + 103)10,032 (1-.3102)
= 53.93%
EBIT (1-t)(BV of Equity+ BV of Debt - Cash)
=10, 032 (1-.361)
(41,958+ 16,328 - 3,387)=12.61%
Aswath Damodaran

243
Wheneverythingisinflux:Changinggrowthandmargins
¨ Theelegantconnectionbetweenreinvestmentandgrowthinoperatingincomebreaksdown,whenyouhaveacompanyintransition,wheremarginsarechangingovertime.
¨ Ifthatisthecase,youhavetoestimatecashflowsinthreesteps:¤ Forecastrevenuegrowthandrevenues infutureyears,takingintoaccountmarketpotentialandcompetition.
¤ Forecasta“target”margininthefutureandapathwayfromcurrentmargins tothetarget.
¤ Estimatereinvestment fromrevenues, usingasales tocapitalratio(measuring thedollarsofrevenues yougetfromeachdollarofinvestment).
Aswath Damodaran
243

244
Hereisanexample:Baidu’sExpectedFCFF
Aswath Damodaran
244
YearRevenue growth Revenues
Operating Margin EBIT Tax rate EBIT (1-t)
Chg in Revenues
Sales/Capital
Reinvestment FCFF
Base year $28,756 48.72% $14,009 16.31% $11,724 2.64
1 25.00% $35,945 47.35% $17,019 16.31% $14,243 $7,189 2.64 $2,722 $11,521 2 25.00% $44,931 45.97% $20,657 16.31% $17,288 $8,986 2.64 $3,403 $13,885 3 25.00% $56,164 44.60% $25,051 16.31% $20,965 $11,233 2.64 $4,253 $16,712 4 25.00% $70,205 43.23% $30,350 16.31% $25,400 $14,041 2.64 $5,316 $20,084 5 25.00% $87,756 41.86% $36,734 16.31% $30,743 $17,551 2.64 $6,646 $24,097 6 20.70% $105,922 40.49% $42,885 18.05% $35,145 $18,166 2.64 $6,878 $28,267 7 16.40% $123,293 39.12% $48,227 19.79% $38,685 $17,371 2.64 $6,577 $32,107 8 12.10% $138,212 37.74% $52,166 21.52% $40,938 $14,918 2.64 $5,649 $35,289 9 7.80% $148,992 36.37% $54,191 23.26% $41,585 $10,781 2.64 $4,082 $37,503
10 3.50% $154,207 35.00% $53,972 25.00% $40,479 $5,215 2.64 $1,974 $38,505

245
IV.GettingClosureinValuation
Aswath Damodaran
245
¨ Sincewecannotestimatecashflowsforever, weestimatecashflowsfora“growthperiod” andthenestimateaterminalvalue, tocapturethevalueattheendoftheperiod:
¨ Whenafirm’scashflowsgrowata“constant” rateforever, thepresentvalueofthosecashflowscanbewrittenas:Value=ExpectedCashFlowNextPeriod/(r- g)where,
r=Discountrate(CostofEquityorCostofCapital)g=Expectedgrowth rateforever.
¨ This“constant” growthrateiscalledastablegrowthrateandcannotbehigherthanthegrowthrateoftheeconomyinwhichthefirmoperates.
Value = CFt
(1+r)t+
Terminal Value(1+r)N
t=1
t=N∑

246
Gettingtostablegrowth…
Aswath Damodaran
246
¨ Akeyassumption inalldiscounted cashflowmodels istheperiodofhighgrowth,andthepatternofgrowthduringthatperiod. Ingeneral,wecanmakeoneofthreeassumptions:¤ thereisnohighgrowth,inwhichcasethefirmisalreadyinstablegrowth¤ therewillbehighgrowthforaperiod,attheendofwhichthegrowthrate
willdroptothestablegrowthrate(2-stage)¤ therewillbehighgrowthforaperiod,attheendofwhichthegrowthrate
willdeclinegraduallytoastablegrowthrate(3-stage)¨ Theassumptionofhowlonghighgrowthwillcontinuewilldepend
uponseveralfactorsincluding:¤ thesizeofthefirm(largerfirm->shorterhighgrowthperiods)¤ currentgrowthrate(ifhigh->longerhighgrowthperiod)¤ barrierstoentryanddifferentialadvantages(ifhigh->longergrowth
period)

247
ChoosingaGrowthPeriod:Examples
Aswath Damodaran
247
Disney Vale Tata Motors Baidu Firm size/market size
Firm is one of the largest players in the entertainment and theme park business, but the businesses are being redefined and are expanding.
The company is one of the largest mining companies in the world, and the overall market is constrained by limits on resource availability.
Firm has a large market share of Indian (domestic) market, but it is small by global standards. Growth is coming from Jaguar division in emerging markets.
Company is in a growing sector (online search) in a growing market (China).
Current excess returns
Firm is earning more than its cost of capital.
Returns on capital are largely a function of commodity prices. Have generally exceeded the cost of capital.
Firm has a return on capital that is higher than the cost of capital.
Firm earns significant excess returns.
Competitive advantages
Has some of the most recognized brand names in the world. Its movie business now houses Marvel superheros, Pixar animated characters & Star Wars.
Cost advantages because of access to low-cost iron ore reserves in Brazil.
Has wide distribution/service network in India but competitive advantages are fading there.Competitive advantages in India are fading but Landrover/Jaguar has strong brand name value, giving Tata pricing power and growth potential.
Early entry into & knowledge of the Chinese market, coupled with government-imposed barriers to entry on outsiders.
Length of high-growth period
Ten years, entirely because of its strong competitive advantages/
None, though with normalized earnings and moderate excess returns.
Five years, with much of the growth coming from outside India.
Ten years, with strong excess returns.

Aswath Damodaran248
Valuing Vale in November 2013 (in US dollars)Let's start with some history & estimate what a normalized year will look like
Assume that the company is in stable growth, growing 2% a year in perpetuity
Estimate the costs of equity & capital for Vale
Business Sample,size
Unlevered,beta,of,business Revenues
Peer,Group,EV/Sales
Value,of,Business
Proportion,of,Vale
Metals'&'Mining 48 0.86 $9,013 1.97 $17,739 16.65%Iron'Ore 78 0.83 $32,717 2.48 $81,188 76.20%Fertilizers 693 0.99 $3,777 1.52 $5,741 5.39%Logistics 223 0.75 $1,644 1.14 $1,874 1.76%Vale,Operations 0.8440 $47,151 $106,543 100.00%
Market D/E = 54.99%Marginal tax rate = 34.00% (Brazil)Levered Beta = 0.844 (1+(1-.34)(.5499)) = 1.15Cost of equity = 2.75% + 1.15 (7.38%) = 10.87%
Year Operating+Income+($) Effective+tax+rate+ BV+of+Debt BV+of+Equity Cash Invested+capital Return+on+capital
2009 $6,057 27.79% $18,168 $42,556 $12,639 $48,085 9.10%
2010 $23,033 18.67% $23,613 $59,766 $11,040 $72,339 25.90%
2011 $30,206 18.54% $27,668 $70,076 $9,913 $87,831 28.01%
2012 $13,346 18.96% $23,116 $78,721 $3,538 $98,299 11.00%
2013+(TTM) $15,487 20.65% $30,196 $75,974 $5,818 $100,352 12.25%
Normalized $17,626 20.92% 17.25%
%"of"revenues ERPUS & Canada 4.90% 5.50%Brazil 16.90% 8.50%Rest of Latin America 1.70% 10.09%China 37.00% 6.94%Japan 10.30% 6.70%Rest of Asia 8.50% 8.61%Europe 17.20% 6.72%Rest of World 3.50% 10.06%Vale ERP 100.00% 7.38%Vale's rating: A-Default spread based on rating = 1.30%Cost of debt (pre-tax) = 2.75% + 1.30% = 4.05%
Cost of capital = 11.23% (.6452) + 4.05% (1-.34) (.3548) = 8.20%
!"#$%"&'("$'!!"#$ = ! !!"# = !
2%17.25% = 11.59%!
!"#$%!!"!!"#$%&'()!!""#$" = !17,626! 1− .2092 1− !. 1159. 082− .02 = $202,832!
Value of operating assets = $202,832+ Cash & Marketable Securities = $ 7,133- Debt = $ 42,879Value of equity = $167,086Value per share =$ 32.44Stock price (11/2013) = $ 13.57

249
EstimatingStablePeriodInputsafterahighgrowthperiod:Disney¨ Respect thecap:Thegrowthrateforeverisassumed tobe2.5.This isset lower
thantheriskfreerate(2.75%).¨ Stableperiodexcess returns:Thereturnoncapital forDisneywilldropfromits
highgrowthperiodlevelof12.61%toastablegrowthreturnof10%.This isstillhigherthanthecostofcapitalof7.29%butthecompetitive advantagesthatDisneyhasareunlikelytodissipate completely bytheendofthe10thyear.
¨ Reinvesttogrow:Basedontheexpected growthrateinperpetuity(2.5%)andexpected returnoncapital foreverafteryear10of10%,wecomputesastableperiodreinvestment rateof25%:¨ Reinvestment Rate=GrowthRate/ReturnonCapital =2.5%/10%=25%
¨ Adjustriskandcostofcapital: Thebetaforthestockwilldroptoone,reflectingDisney’sstatusasamaturecompany.
¤ CostofEquity=RiskfreeRate+Beta*RiskPremium=2.75%+5.76%=8.51%¤ ThedebtratioforDisneywillriseto20%.Sinceweassumethatthecostofdebtremains
unchangedat3.75%,thiswillresultinacostofcapitalof7.29%¤ Costofcapital=8.51%(.80)+3.75%(1-.361)(.20)=7.29%
Aswath Damodaran

250
V.Fromfirmvaluetoequityvaluepershare
Aswath Damodaran
250
Approach used To get to equity value per shareDiscount dividends per share at the cost of equity
Present value is value of equity per share
Discount aggregate FCFE at the cost of equity
Present value is value of aggregate equity. Subtract the value of equity options given to managers and divide by number of shares.
Discount aggregate FCFF at the cost of capital
PV = Value of operating assets+ Cash & Near Cash investments+ Value of minority cross holdings-Debt outstanding= Value of equity-Value of equity options =Value of equity in common stock/ Number of shares

251
ValuingDeutscheBankinearly2008
Aswath Damodaran
251
¨ TovalueDeutscheBank,westartedwiththenormalized incomeover theprevious fiveyears(3,954millionEuros)andthedividends in2008(2,146millionEuros).WeassumedthatthepayoutratioandROE,basedonthesenumberswillcontinueforthenext5years:¤ Payoutratio=2,146/3954=54.28%¤ Expectedgrowthrate=(1-.5428)*.1181=0.054or5.4%¤ Costofequity=9.23%

252
DeutscheBankinstablegrowth
Aswath Damodaran
252
¨ Attheendofyear5,thefirmisinstablegrowth.Weassumethatthecostofequitydropsto8.5%(as thebetamoves to1)andthatthereturnonequityalsodropsto8.5(toequalthecostofequity).StablePeriodPayoutRatio=1– g/ROE=1– 0.03/0.085=0.6471or64.71%ExpectedDividends inYear6=ExpectedNetIncome5 *(1+gStable)*StablePayoutRatio
=€5,143 (1.03)*0.6471=€3,427millionTerminalValue=
PVofTerminalValue=
¨ Valueofequity=€9,653+€40,079=€49,732millionEuros¨ Valueofequityper share=
Stockwastradingat89Eurospershareatthetimeoftheanalysis.
Expected Dividends6
(Cost of Equity-g)=
3,247(.085-.03)
= 62,318 million Euros
Terminal Valuen
(1+Cost of EquityHigh growth )n=
62,318(1.0923)5 = 40, 079 mil Euros
Value of Equity# Shares
=49,732474.2
=104.88 Euros/share

253
ValuingDeutscheBankin2013
Aswath Damodaran
253
Current 1 2 3 4 5 Steady stateRisk Adjusted Assets (grows 3% a year for next 5 years) 439,851 € 453,047 € 466,638 € 480,637 € 495,056 € 509,908 € 517,556 €Tier 1 Capital ratio (increases from 15.13% to 18.00% over next 5 years 15.13% 15.71% 16.28% 16.85% 17.43% 18.00% 18.00%Tier 1 Capital (Risk Adjusted Assets * Tier 1 Capital Ratio) 66,561 € 71,156 € 75,967 € 81,002 € 86,271 € 91,783 € 93,160 €
Change in regulatory capital (Tier 1) 4,595 € 4,811 € 5,035 € 5,269 € 5,512 € 1,377 €Book Equity 76,829 € 81,424 € 86,235 € 91,270 € 96,539 € 102,051 € 103,605 €
ROE (expected to improve from -1.08% to 8.00% in year 5) -1.08% 0.74% 2.55% 4.37% 6.18% 8.00% 8.00%Net Income (Book Equity * ROE) -716 € 602 € 2,203 € 3,988 € 5,971 € 8,164 € 8,287 €- Investment in Regulatory Capital 4,595 € 4,811 € 5,035 € 5,269 € 5,512 € 1,554 €FCFE -3,993 € -2,608 € -1,047 € 702 € 2,652 € 6,733 €Terminal value of equity 103,582.19 €Present value -3,669.80 € -2,202.88 € -812.94 € 500.72 € 69,671.28 €Cost of equity 8.80% 8.80% 8.80% 8.80% 8.80% 8.80% 8.00%Value of equity today = 63,486.39 €Number of shares outstanding = 1019.50Value per share = 62.27 €Stock price in November 2013 = 35.46 €

254
ValuingTataMotorswithaFCFEmodelinNovember2013:Thehighgrowthperiod
Aswath Damodaran
254
¨ Weusetheexpectedgrowthrateof24.13%,estimatedbaseduponthe2013valuesforROE(29.97%)andequityreinvestmentrate(80.5%):¨ Expectedgrowthrate=29.97%*80.5%=24.13%
¨ ThecostofequityforTataMotorsis13.50%:Costofequity==6.57%+0.964(7.19%)=13.50%
¨ TheexpectedFCFEforthehighgrowthperiod
Current 1 2 3 4 5Expectedgrowthrate 24.13% 24.13% 24.13% 24.13% 24.13%NetIncome 98,926₹ 122,794₹ 152,420₹ 189,194₹ 234,841₹ 291,500₹EquityReinvestmentRate 80.50% 80.50% 80.50% 80.50% 80.50% 80.50%EquityReinvestment 79,632₹ 98,845₹ 122,693₹ 152,295₹ 189,039₹ 234,648₹
FCFE 19,294₹ 23,949₹ 29,727₹ 36,899₹ 45,802₹ 56,852₹[email protected]% 21,100₹ 23,075₹ 25,235₹ 27,597₹ 30,180₹
Sum of PV of FCFE = 127,187₹

255
Stablegrowthandvalue….
Aswath Damodaran
255
¨ Afteryearfive,wewillassumethatthebetawillincrease to1andthattheequityriskpremiumwilldecline to6.98%percent (asthecompanybecomesmoreglobal).Theresultingcostofequityis13.55percent.CostofEquityinStableGrowth=6.57%+1(6.98%)=13.55%
¨ Wewillassumethatthegrowthinnetincomewilldropto6%andthatthereturnonequitywilldropto13.55%(whichisalsothecostofequity).EquityReinvestmentRateStableGrowth=6%/13.55%=44.28%FCFEinYear6=₹291,500(1.06)(1 – 0.4428)=₹ 136,822millionTerminalValueofEquity=₹136,822/(0.1355 – 0.06)=₹ 2,280,372million
¨ TovalueequityinthefirmtodayValueofequity=PVofFCFEduringhighgrowth+PVofterminalvalue
=₹127,187+2,280,372/1.13555 =₹742,008 million¤Dividingby2694.08million sharesyieldsavalueofequitypershareof₹275.42,about40%lowerthanthestockpriceof₹427.85 pershare.

Aswath Damodaran256
Term yrEBIT (1-t) 41,896- Reinv 9.776FCFF 32,120
Terminal Value10= 32,120/(.10-035) = ¥494,159
Cost of capital = 12.91% (.9477) + 3.45% (.0523) = 12.42%
Unlevered Beta for Businesses: 1.30
ERP6.94%
Operating assets ¥291,618+ Cash 43,300- Debt 20,895Value of equity 314,023/ No of shares 2088.87 Value/share ¥150.33
Cost of Debt(3.5%+0.8%+0.3%)(1-.25) = 3.45%
Cost of Equity12.91%
Stable Growthg = 3.5%
Cost of capital = 10% ROC= 15%;
Reinvestment Rate=3.5%/15% = 23.33%
WeightsE = 94.77% D = 5.23%
Riskfree Rate:Riskfree rate = 3.5% +
Beta 1.356 X
In November 2013, the stock was trading at ¥160.06 per share.
Cost of capital decreases to 10% from years 6-10
D/E=5.52%
Baidu: My valuation (November 2013)Revenue
growth of 25% a year for 5 years, tapering down to 3.5% in year
10
Pre-tax operating
margin decreases to
35% over time
Sales to capital ratio
maintained at 2.64 (current
level)
1 3 3 4 5 6 7 8 9 10Revenue growth 25.00% 25.00% 25.00% 25.00% 25.00% 20.70% 16.40% 12.10% 7.80% 3.50%Revenues ¥35,945 ¥44,931 ¥56,164 ¥70,205 ¥87,756 ¥105,922 ¥123,293 ¥138,212 ¥148,992 ¥154,207Operating Margin 47.35% 45.97% 44.60% 43.23% 41.86% 40.49% 39.12% 37.74% 36.37% 35.00%EBIT ¥17,019 ¥20,657 ¥25,051 ¥30,350 ¥36,734 ¥42,885 ¥48,227 ¥52,166 ¥54,191 ¥53,972Tax rate 16.31% 16.31% 16.31% 16.31% 16.31% 18.05% 19.79% 21.52% 23.26% 25.00%EBIT (1-t) ¥14,243 ¥17,288 ¥20,965 ¥25,400 ¥30,743 ¥35,145 ¥38,685 ¥40,938 ¥41,585 ¥40,479 - Reinvestment ¥2,722 ¥3,403 ¥4,253 ¥5,316 ¥6,646 ¥6,878 ¥6,577 ¥5,649 ¥4,082 ¥1,974FCFF ¥11,521 ¥13,885 ¥16,712 ¥20,084 ¥24,097 ¥28,267 ¥32,107 ¥35,289 ¥37,503 ¥38,505
Last%12%months Last%yearRevenues ¥28,756 ¥22,306Operating income or EBIT ¥14,009 ¥11,051Operating Margin 48.72% 49.54%Revenue Growth 28.92%Sales/Capital Ratio 2.64

257
Disney:InputstoValuation
High Growth Phase Transition Phase Stable Growth Phase
Length of Period 5 years 5 years Forever after 10 years
Tax Rate 31.02% (Effective)
36.1% (Marginal)
31.02% (Effective)
36.1% (Marginal)
31.02% (Effective)
36.1% (Marginal)
Return on Capital 12.61% Declines linearly to 10% Stable ROC of 10%
Reinvestment Rate
53.93% (based on normalized
acquisition costs)
Declines gradually to 25%
as ROC and growth rates
drop:
25% of after-tax operating
income.
Reinvestment rate = g/ ROC
= 2.5/10=25%
Expected Growth
Rate in EBIT
ROC * Reinvestment Rate =
0.1261*.5393 = .068 or 6.8%
Linear decline to Stable
Growth Rate of 2.5%
2.5%
Debt/Capital Ratio 11.5% Rises linearly to 20.0% 20%
Risk Parameters Beta = 1.0013, ke = 8.52%%
Pre-tax Cost of Debt = 3.75%
Cost of capital = 7.81%
Beta changes to 1.00;
Cost of debt stays at 3.75%
Cost of capital declines
gradually to 7.29%
Beta = 1.00; ke = 8.51%
Cost of debt stays at 3.75%
Cost of capital = 7.29%
Aswath Damodaran

Aswath Damodaran
Term Yr10,6392,6607,980
Terminal Value10= 7,980/(.0729-.025) = 165,323
Cost of Capital (WACC) = 8.52% (0.885) + 2.40% (0.115) = 7.81%
Return on Capital12.61%
Reinvestment Rate 53.93%
Unlevered Beta for Sectors: 0.9239
ERP for operations5.76%Beta
1.0013Riskfree Rate:Riskfree rate = 2.75%
Op. Assets 125,477+ Cash: 3,931+ Non op inv 2,849- Debt 15,961- Minority Int 2,721=Equity 113,575-Options 972Value/Share $ 62.56
WeightsE = 88.5% D = 11.5%
Cost of Debt(2.75%+1.00%)(1-.361)
= 2.40%Based on actual A rating
Cost of Equity8.52%
Stable Growthg = 2.75%; Beta = 1.00;
Debt %= 20%; k(debt)=3.75Cost of capital =7.29%
Tax rate=36.1%; ROC= 10%; Reinvestment Rate=2.5/10=25%
Expected Growth .5393*.1261=.068 or 6.8%
Current Cashflow to FirmEBIT(1-t)= 10,032(1-.31)= 6,920- (Cap Ex - Deprecn) 3,629 - Chg Working capital 103= FCFF 3,188Reinvestment Rate = 3,732/6920
=53.93%Return on capital = 12.61%
+ X
Disney - November 2013
In November 2013, Disney was trading at $67.71/share
First 5 years
D/E=13.10%
1 2 3 4 5 6 7 8 9 10EBIT/*/(1/2/tax/rate) $7,391 $7,893 $8,430 $9,003 $9,615 $10,187 $10,704 $11,156 $11,531 $11,819/2/Reinvestment $3,985 $4,256 $4,546 $4,855 $5,185 $4,904 $4,534 $4,080 $3,550 $2,955FCFF $3,405 $3,637 $3,884 $4,148 $4,430 $5,283 $6,170 $7,076 $7,981 $8,864
Growth declines gradually to 2.75%
Cost of capital declines gradually to 7.29%

Aswath Damodaran
Cost of capital = 8.52% (.885) + 2.4% (.115) = 7.81%
Financing ChoicesMostly US $ debt with duration of 6
years
Financing MixD=11.5%; E=88.5%
Expected Growth Rate = 12.61% * 53.93%= 6.8%
Current EBIT (1-t)$ 6,920
Reinvestment Rate53.93%
New InvestmentsReturn on Capital
12.61%
The Financing DecisionChoose a financing mix that minimizes the hurdle rate and match your financing to your assets.
The Dividend DecisionIf you cannot find investments that earn more than the hurdle rate, return the cash to the owners of the businesss.
The Investment DecisionInvest in projects that earn a return greater than a minimum acceptable hurdle rate
Investment decision affects risk of assets being finance and financing decision affects hurdle rateSt
rate
gic
inve
stm
ents
det
erm
ine
leng
th o
f gro
wth
perio
d
Disney: Corporate Financing Decisions and Firm Value
Existing InvestmentsROC = 12.61%
Year Expected+Growth EBIT+(15t) Reinvestment FCFF Terminal+Value Cost+of+capital PV1 6.80% $7,391 $3,985 $3,405 7.81% $3,1582 6.80% $7,893 $4,256 $3,637 7.81% $3,1293 6.80% $8,430 $4,546 $3,884 7.81% $3,0994 6.80% $9,003 $4,855 $4,148 7.81% $3,0705 6.80% $9,615 $5,185 $4,430 7.81% $3,0416 5.94% $10,187 $4,904 $5,283 7.71% $3,3677 5.08% $10,704 $4,534 $6,170 7.60% $3,6548 4.22% $11,156 $4,080 $7,076 7.50% $3,8999 3.36% $11,531 $3,550 $7,981 7.39% $4,09410 2.50% $11,819 $2,955 $8,864 $189,738 7.29% $94,966
Value of operating assets of the firm = $125,477Value of Cash & Non-operating assets = $6,780Value of Firm = $132,257Market Value of outstanding debt = $15,961Minority Interests $2,721Market Value of Equity = $113,575Value of Equity in Options = $972Value of Equity in Common Stock = $112,603Market Value of Equity/share = $62.56

260
Waysofchangingvalue…
Cashflows from existing assetsCashflows before debt payments, but after taxes and reinvestment to maintain exising assets
Expected Growth during high growth period
Growth from new investmentsGrowth created by making new investments; function of amount and quality of investments
Efficiency GrowthGrowth generated by using existing assets better
Length of the high growth periodSince value creating growth requires excess returns, this is a function of- Magnitude of competitive advantages- Sustainability of competitive advantages
Stable growth firm, with no or very limited excess returns
Cost of capital to apply to discounting cashflowsDetermined by- Operating risk of the company- Default risk of the company- Mix of debt and equity used in financing
How well do you manage your existing investments/assets?
Are you investing optimally forfuture growth? Is there scope for more
efficient utilization of exsting assets?
Are you building on your competitive advantages?
Are you using the right amount and kind of debt for your firm?
Aswath Damodaran

Aswath Damodaran
Term Yr12,2753,0699,206
Terminal Value10= 9,206/(.0676-.025) = 216,262
Cost of Capital (WACC) = 8.52% (0.60) + 2.40%(0.40) = 7.16%
Return on Capital14.00%
Reinvestment Rate 50.00%
Unlevered Beta for Sectors: 0.9239
ERP for operations5.76%Beta
1.3175Riskfree Rate:Riskfree rate = 2.75%
Op. Assets 147,704+ Cash: 3,931+ Non op inv 2,849- Debt 15,961- Minority Int 2,721=Equity 135,802-Options 972Value/Share $ 74.91
WeightsE = 60% D = 40%
Cost of Debt(2.75%+1.00%)(1-.361)
= 2.40%Based on synthetic A rating
Cost of Equity10.34%
Stable Growthg = 2.75%; Beta = 1.20;
Debt %= 40%; k(debt)=3.75%Cost of capital =6.76%
Tax rate=36.1%; ROC= 10%; Reinvestment Rate=2.5/10=25%
Expected Growth .50* .14 = .07 or 7%
Current Cashflow to FirmEBIT(1-t)= 10,032(1-.31)= 6,920- (Cap Ex - Deprecn) 3,629 - Chg Working capital 103= FCFF 3,188Reinvestment Rate = 3,732/6920
=53.93%Return on capital = 12.61%
+ X
Disney (Restructured)- November 2013
In November 2013, Disney was trading at $67.71/share
First 5 years
D/E=66.67%
Growth declines gradually to 2.75%
Cost of capital declines gradually to 6.76%
More selective acquisitions & payoff from gaming
Move to optimal debt ratio, with higher beta.
1 2 3 4 5 6 7 8 9 10EBIT * (1 - tax rate) $7,404 $7,923 $8,477 $9,071 $9,706 $10,298 $10,833 $11,299 $11,683 $11,975 - Reinvestment $3,702 $3,961 $4,239 $4,535 $4,853 $4,634 $4,333 $3,955 $3,505 $2,994Free Cashflow to Firm $3,702 $3,961 $4,239 $4,535 $4,853 $5,664 $6,500 $7,344 $8,178 $8,981

262
FirstPrinciples
Aswath Damodaran
262