
Reporting in Pakistan Corporate Governance and Environmental

www.environment-agency.gov.uk
Corporate Environmental Governance
A study into the influence of Environmental Governance and Financial Performance full report

www.environment-agency.gov.uk
The Environment Agency is the leading public body protecting and
improving the environment in England and Wales.
It’s our job to make sure that air, land and water are looked after by
everyone in today’s society, so that tomorrow’s generations inherit a
cleaner, healthier world.
Our work includes tackling flooding and pollution incidents, reducing
industry’s impacts on the environment, cleaning up rivers, coastal
waters and contaminated land, and improving wildlife habitats.
Published by:
Environment AgencyRio HouseWaterside Drive, Aztec WestAlmondsbury, Bristol BS32 4UDTel: 01454 624400 Fax: 01454 624409
© Environment Agency September 2004
All rights reserved. This document may be reproduced with
prior permission of the Environment Agency.
This report is printed on Cyclus Print, a 100% recycled stock,which is 100% post consumer waste and is totally chlorine free.Water used is treated and in most cases returned to source inbetter condition than removed.
Environment AgencyProject Executive:Howard Pearce
Environment AgencyProject Manager:Faith Ward
Written by Andrew White and Matthew Kiernan
The authors would like to acknowledge thevaluable input provided by Innovest Analysts to the compilation of this report.

Contents
Foreword i Executive Summary 1 Introduction 12 Literature review 18 Case studies 30 1. Jupiter Ecology Fund 31 2. Winslow Green Growth Fund 34 3. Integrated Oil & Gas 37 4. EU and US Electric Utilities 42 5. Forest & Paper Products 49 6. Water Utilities 56 7. 3M 62 8. Baxter International 67 9. The Co-operative Bank 73 10. Iceland 77 11. Monsanto 83 12. PSA Peugeot Citroen 88 13. Shell 92 14. Vestas Wind Systems 98 15. Xstrata Plc 103 Conclusions 109 Appendices 112 Literature Review Bibliography 113 Glossary of terms 121
ForewordFor some time there has been debate about how companies manage the environment and the influence thishas on business performance. This study seeks to address this issue, by looking at whether there is a linkbetween corporate environmental governance and financial performance.
The study is based on an extensive literature review and 15 case studies. Its conclusion is clear: goodenvironmental governance can benefit financial performance and, conversely, poor performance can havedamaging financial consequences.
This clearly has very important implications for financial investors. It means that better financial returns can beobtained from investing in companies which integrate environmental considerations into corporate governancepolicies and processes.
Some company analysts, institutional pension fund managers and others were rather sceptical of earlier studies.We hope that they will act on these new findings and take greater account of corporate environmentalgovernance in their future decisions.
Howard Pearce
Head of Environmental Finance and Pension Fund Management
October 2004
Environment Agency Corporate Environmental Governance i

About Innovest Strategic Value AdvisorsInnovest Strategic Value Advisors is an internationalinvestment research firm specializing in analysing“non-traditional” drivers of risk and shareholder value,including companies’ performance on environmental,social, and strategic governance issues. Innovest hasbeen recognised recently by several dependentcommentators as the leading firm in the world in thisarea.
Founded in 1998, the firm has over US$1 billionunder structured sub-advisory mandates with assetmanagement partners including State Street GlobalAdvisors, ING Investment Management includingleading European pension funds IDEAM and ABPInvestments.
Innovest also provides customised portfolio analysisand research to more than thirty major institutionalinvestors including Hermes, Schroders, Cazenove, andRockefeller & Co., as well as to leading pension fundsin the United States, the U.K., continental Europe,and Scandinavia. Innovest currently has clients inover twenty countries.
The Environment Agency commissioned InnovestStrategic Value Advisors to carry out this study on itsbehalf. The views and evaluation, particularly ofsectors and companies are based on Innovest’sresearch and are not necessarily those of theEnvironment Agency.
www.innovestgroup.com
AcknowledgementsBefore we published this report, we invited all thecompanies in the profiles section to comment on theanalysis and conclusions drawn, and to provide anyadditional relevant research. The Environment Agencyand the study authors would like to thank all thosecompanies which responded with comments andfurther data. This has helped to ensure the accuracyof the case studies.
Disclaimer
The views expressed in this document are not necessarily thoseof the Environment Agency. Its officers, servants or agentsaccept no liability whatsoever for any loss or damage arisingfrom the interpretation or use of the information, or relianceupon views contained herein.
This report is for information purposes and should not beconsidered as a solicitation to buy or sell any security. InnovestStrategic Value Advisors or nor any other party guarantee itsaccuracy or make warranties regarding results from its usage
Environment Agency Corporate Environmental Governance ii
Executive SummaryThe Environment Agency believes that all companieshave a duty of care towards the environment. It alsomaintains that companies which reduce theirenvironmental risks and impacts are more sustainable,profitable, valuable and competitive. We havecommissioned this report to shed light on the valueof good environmental governance from a buisinessperspective. Our aim is to encourage the wideradoption of sound environmental polices andpractices, leading to improved environmental andfinancial performance.
Overall findingsGood environmental governance helps to deliverbetter financial performance
In recent years there has been a marked increase inresearch suggesting that good environmentalgovernance practice can deliver better financialperformance.
During the literature review, we found strongevidence for the existence of a positive relationshipbetween environmental governance and financialperformance. This result is largely consistent withother literature reviews conducted over the past few years.
“ In 85% of the total number ofstudies assessed, we found apositive correlation betweenenvironmental governance and/or events, and financialperformance.”
Our work on the individual case studies supportedthese positive findings from the literature review.
Table 1 The table below lists the case studies included in the full report available on the internet:
Funds Sectors Companies
Jupiter Ecology Fund Integrated oil & gas 3M
Winslow Green Growth Fund EU and US electric utilities Baxter International
Paper and forest products Co-operative Bank
Water utilities Iceland (The Big Food Group)
Monsanto
PSA Peugeot Citroen
Shell
Xstrata
Vestas Wind Systems
Environment Agency Corporate Environmental Governance 1

The studyThere is an emerging consensus that moreprominence should be given to integratingenvironmental strategies into overall businessobjectives. However, in some quarters, environmental governance is still not considered tobe an important driver.
This paper attempts to assess the validity of thesediffering viewpoints. It tackles five questions:
• Is there evidence to support a positive link betweenthe environmental governance of individualcompanies and their financial performance?
• If such a link exists, is it more pronounced in somesectors than in others?
• Is it possible to say which financial performanceindicators best illustrate any effect thatenvironmental governance may have?
• Can it be concluded that certain types ofenvironmental governance measures will have animpact on certain financial indicators, and can thelongevity of the effect on financial performance beassessed?
• Is the body of research comprehensive in itscoverage of environmental governance issues andfinancial indicators?
The comparative studies – in both the literaturereview and the case studies– provided strikingevidence of a positive correlation betweenenvironmental governance and financial impacts (seetable 2). This impact was most clearly seen in thecompany studies sourced in the literature review andin the sector case studies (see page 8 and figure 8).
Many in the financial community have yet torecognise the link between environmental governanceand financial performance
On the whole, the research findings in this reportappear to directly counter a widespreadmisconception – that paying close attention to anenvironmental governance strategy andenvironmental performance is at best a waste oftime for investors, and at worst actively harmful tofinancial returns. In fact the opposite is true.Improving environmental performance is anopportunity for business and can create competitiveadvantage.
If we are to challenge this misconception in thefinancial community, we need to get across theresults from current research. This is a daunting task.We hope that this report will go some distancetowards addressing this. We would encouragemainstream investors to build corporateenvironmental governance into financial models.
The Winslow Green Growth Fund
The fund has consistently out-performed its benchmark, over a prolonged period. Over one, three and fiveyears, the average annual returns for this fund were, respectively, 20.41%, 5.79% and 11.49% more thanthe benchmark index.
Forest and paper products sector
Companies with above average environmental governance standards and environmental track record out-performed companies with below average standards by over 43% over a four-year period.
Company case study of 3M
The implementation of a pollution prevention programme yielded total savings of US$894 million from1975 to 2002.
There are many individual examples of a link to out-performance:
Table 2 Some examples of the positive findings from our case studies are set out in the table below:
Environment Agency Corporate Environmental Governance 2
What is environmental governance?
Environmental governance describes a company’smanagement of its environmental impacts, risks,performance and opportunities. It covers the fullrange of its best practice approaches (see table 3).
These approaches are reflected in the EnvironmentAgency’s corporate environmental governance policy.Environmental governance includes the following keybusiness considerations:
• Environmental values (vision, mission, principles);
• Environmental policy (strategy, objectives,targets);
• Environmental oversight (responsibility, direction,training, communication);
• Environmental processes (management systems,initiatives, internal control, monitoring and review,stakeholder dialogue, environmental accounting,reporting and verification);
• Environmental performance (use of KeyPerformance Indicators, benchmarking, eco-efficiency, reputation, compliance, liabilities,business development).
Financial performance indicators
Traditionally, financial indicators were based onfigures from management and financial accounts.These are called fundamental indicators. A distinctioncan be made between financial indicators which arequantitatively derived (traditional ‘fundamentals’) and‘intangible’ values. These do not, as yet, generallyappear in company accounts. However, they are verylikely to have a financial impact. The indicatorsconsidered in the review are set out in table 4 below.
Table 3 For the purposes of the literature review in this report, the following environmental factors were assessed:
Table 4 The indicators considered in the review:
Fundamental indicators Intangible indicators
Shareholder value P/E Ratio Reputation
Share price WACC Innovation
Market cap ROCE Competitive advantage
Market share MVA Shareholder relations
BMV EVA Management quality
EBIT ROA Risk avoidance
EBITDA ROE
Operating costs ROIC
Environmental governance Environmental events
Strategy Audit/verification Historic liabilities
Climate change Accounting/reporting Spills and releases
Oversight Eco-efficiency Toxic emissions
Environmental Management Products/services Hazardous wasteSystem
Training Profit opportunities Loss of biodiversity
Environment Agency Corporate Environmental Governance 3

Table 6 Origin of studies by country and authorship:
North UK Europe Other TotalAmerica (excluding-UK)
Academia 21 2 5 1 29
Business 18 8 6 0 32
NGO/not-for-profit 3 1 0 0 4
Government 2 0 0 1 3
Total 44 11 11 2
Note – Several of the studies were co-authored by different organisations, based in different countries. The totalnumber of studies in the table above therefore adds up to more than 60.
Literature reviewIn the literature review, we identified 70 separatestudies, listed in the full report, which examined theimpact of environmental governance on financialperformance (see table 5). The focus was on thosestudies with a strong empirical research contentwhich had been published in the last five to six years.By taking this approach, we attempted to ensure thatthe findings of the literature review were bothmeaningful and up to date.
Note: Ten of the 70 studies were themselves literaturereviews. These have been referred to for comparativepurposes. The statistical analysis in this report wascarried out on the other 60 studies identified. These 60studies each provided a separate analysis of theenvironmental approach taken by companies, sectors orfunds, and of its impact on financial performance.
The Business community is beginning to assess theimpact of environmental governance
Twenty-nine of the studies came from academia and32 were from the business community. Mostemanated from North American institutions. It isencouraging that some in the financial communityhave begun to examine the relevance ofenvironmental governance (See table 6).
This suggests that investors are beginning torecognise the need to carry out empiricalinvestigations into any financial connections.
Some very detailed and cutting-edge work hasrecently been carried out by or in partnership withfinancial consultants, leading banks and fundmanagers. These include ABP, Arthur D. Little,Commerzbank, Pictet, Sarasin and WestLB. Ten of the60 studies were published by financial institutions.
In each study, the report classifies the nature of therelationship between environmental governance andfinancial performance. The classification system looksat whether the link was positive, negative or neutral.It is summarised in table 7 below.
Table 5 The table below shows the breakdownof studies reviewed by type:
Fund Sector Company Other studies studies studies literature
reviews
15 15 30 10
Table 7 Classification system definitions
Negative correlation Neutral correlation Positive correlation
High environmental governance High environmental governance High environmental governancestandards but poor financial standards but no change standards and strong financialperformance in financial performance performance
Low environmental governance Low environmental governance Low environmental governancestandards but strong financial standards but no change standards and poor financialperformance in financial performance performance
Environment Agency Corporate Environmental Governance 4

Figure 1 Number of positive, neutral and negative correlations found
The literature review revealed that there are fourdifferent approaches to assessing the evidence for thelink between environmental governance and financialperformance. Evidence comes from:
i) empirical studies looking at the statisticalrelationship with financial performance;
ii) company, sector or fund case studies;
iii) academic theory/thinking;
iv) research findings from rating agencies andinvestment managers.
The literature review found strong evidence for theexistence of a positive relationship betweenenvironmental governance and financial performance.
In 51 of the 60 studies reviewed, a positivecorrelation was found between environmentalgovernance and financial performance (see figure 1).
In other words, in most cases the current researchsuggests that good environmental governance candeliver financial benefits – and vice versa.
Results from fund, sector and company analyses areall generally positive
The majority of studies demonstrated a positivecorrelation between environmental governance andfinancial performance. This was irrespective ofwhether they were looking at companies, sectors orinvestment in funds which had an environmentalelement (see figures 2-4).
0
10
20
30
40
50
60
Positive Neutral Negative
Num
ber
of C
orre
latio
ns
Note – where a range of environmental governance and/or financialmeasures are considered in a single study, a combination of positive,neutral and/or negative correlations between different measures ispossible within that study’s conclusions. The total number of correlationsin the chart above therefore adds up to more than 60.
Figure 2 Company studies
Neutral11%
Negative17%
Positive72%
Neutral6%
Negative24%
Positive70%
Positive79%
Figure 3 Sector studies
Neutral11%
Negative17%
Positive72%
Neutral6%
Negative24%
Positive70%
Neutral7%
Negative14%
Positive79%
Figure 4 Fund studies
Neutral11%
Negative17%
Positive72%
Neutral6%
Negative24%
Positive70%
Positive79%
Relationship between environmental governance and financial performance
Environment Agency Corporate Environmental Governance 5

Most of the research looks at the impact of anenvironmental strategy
A high proportion of the studies examined in theliterature review focused on a limited range ofenvironmental governance measures.
In nearly half the studies reviewed, the financial effectof an overarching environmental strategy was themain or only area of analysis (see figure 5).
The different components of an environmentalstrategy were rarely identified or assessed separately.These components include specific principles,objectives, targets and policy focus.
Climate change strategy is now high on the research agenda
A fifth of the studies looked at the potential benefits ofimplementing a climate change strategy. Research intothe possible opportunities and risks associated withclimate change is becoming more common. Climatechange is fast becoming the single most prominentenvironmental issue. This is perhaps not unsurprisinggiven its high profile and the incoming legislation andregulation in areas such as carbon emissions.
The UK Government’s Energy White Paper waspublished in February 2003. It set out a new visionfor the country’s energy policy and puts the UK onthe path to cutting its carbon dioxide emissions by60% by 2050.
In November 2003, Environment Secretary MargaretBeckett told a City audience that those companiesand investors which are well informed about the risksof climate change will be best placed both to protectthemselves, and to invest in cleaner technologies.
At the Institutional Investors’ Group on ClimateChange (IIGCC) conference, the Secretary of Statesaid that climate change is a crucial issue for UKinvestors and business, and that it represents majoropportunities to invest in new cleaner technologiesand to trade in greenhouse gas emissions.
Environmental events
The impact of toxic emissions, pollutant spills andreleases – and the fines that accompanied them –was the subject of many of the studies (23 and 21 ofthe 60 studies respectively). Figure 6 below gives thebreakdown of the different environmental eventsconsidered in the studies included in the literaturereview.
Trai
ning
Aud
it/ v
erifi
catio
n
Ove
rsig
ht
Acc
ount
ing/
repo
rtin
g
Prof
it op
port
uniti
es
Eco-
effic
ienc
y
Env'
al M
anag
emen
t sy
stem
s
Prod
ucts
/ s
ervi
ces
Clim
ate
chan
ge
Stra
tegy
No. References to Environmental Governance Issues
Num
ber of references
50
45
40
35
30
25
20
15
10
5
0
Figure 5 Number of references to environmental governance issues identified in literature review
Haz
ardo
us w
aste
Toxi
c em
issi
ons
Biod
iver
sity
loss
His
toric
liab
ilitie
s
Spill
s an
d re
leas
es
No. References to Environmental Events
Num
ber
of r
efer
ence
s45
40
35
30
25
20
15
10
5
0
Figure 6 Number of references to environmental events identified in literature review
Environment Agency Corporate Environmental Governance 6

It is surprising that the impact of different types ofpollution incident on financial performance has beenassessed far less than the impact of a broadenvironmental strategy. Financial impacts of fines andpenalties can be more directly linked to operatingcosts and profitability than can overall policy goals. Itmight therefore be assumed that literature looking atenvironmental governance would focus more on therelevance of pollution control.
Studies focus on a narrow set of financial indicators
The studies identified in the literature review focusedon how environmental governance impacts on justfour financial indicators:
i) shareholder value
ii) share price
iii) operating costs
iv) risk and reputation issues.
These indicators represent some of the key tests offinancial performance. Using these broad measures offinancial performance should help mainstreaminvestors and financial analysts to understand theimpact of environmental governance.
Case studiesAlthough the literature review sourced 30 companystudies, only one of these focused on theperformance of a single company (Exxon Mobil). Toan extent, this result was anticipated. It is one of thereasons we undertook a separate assessment of theperformance of individual companies, using 15 casestudies (as listed in table 1 above, nine of whichlooked at individual companies).
The relevance of examining the performance ofindividual companies was highlighted by a recentcase concerning Associated British Ports (ABP),Britain’s largest ports operator. In April 2004, ABP saw£155 million wiped off its market value after the UKgovernment blocked the company’s plans for a newcontainer terminal at a site in the south of England.
Shares in the company fell by 47p following theannouncement, a fall of almost 10% in a single day.The company’s plans were for a deep water terminalat Dibden Bay, near Southampton. These wererejected after opposition from environmentalcampaigners, who claimed it would wreck importantwildlife locations. The government admitted that onemajor factor in its decision was the potentialenvironmental impact of the company’s proposals.
Such cases demonstrate very clearly that businessstrategies are often inextricably linked toenvironmental issues.
The companies chosen for the individual case studieswere selected because, by and large, they had eachimplemented a different measure of environmentalgovernance. This helps to assess whether certainmeasures of environmental governance may haverelated financial impacts. It also means that the casestudies look beyond the impact of a broadenvironmental strategy, which had been thepredominant focus of the existing literature.
Many case study examples demonstrate a linkbetween environmental governance and financialperformance
The case studies undertaken in this report also showthat where environmental governance systems havebeen implemented, or where environmentalperformance has been good or has improved, there isevidence of a discernable and beneficial impact onthe financial performance of the companies, sectorsor funds studied. Some examples are provided below:
• The performance of the Jupiter Ecology Fund hasbeen impressive, giving a better investment return(see figure 7).
Figure 7 Five-year performance chart for the Jupiter Ecology Fund up to 3 November 2003
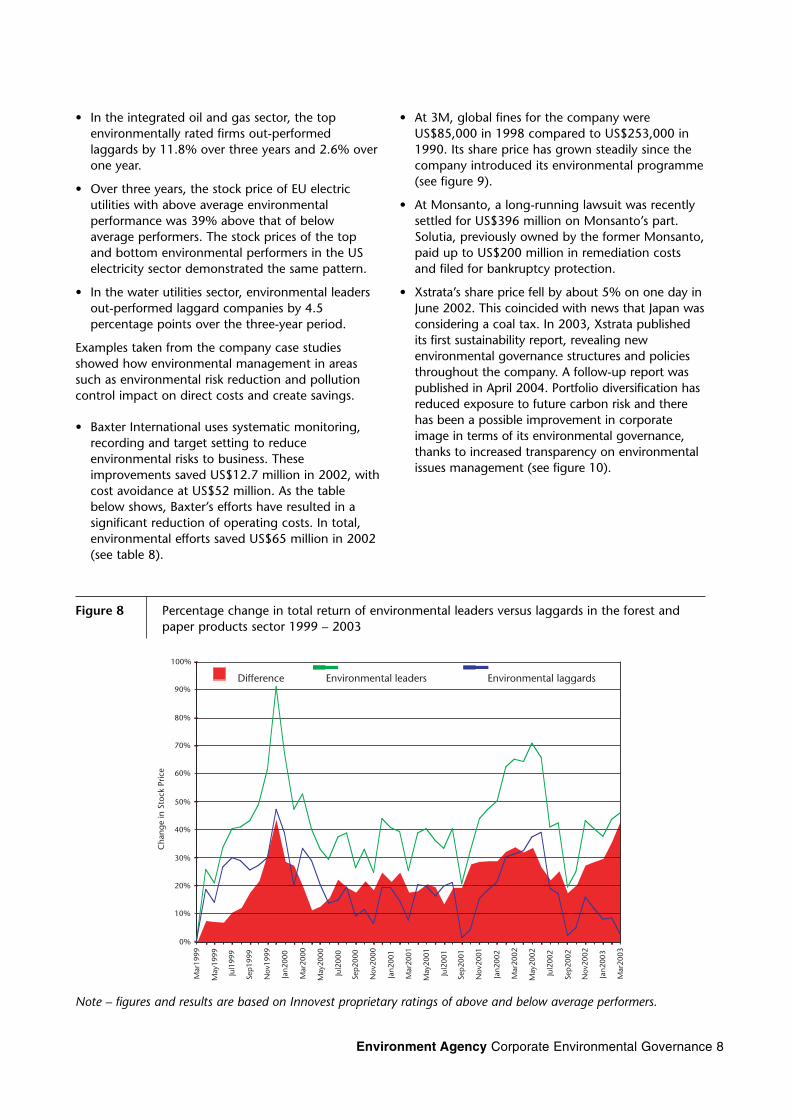
• Forest and paper products companies with aboveaverage environmental governance standards andabove average environmental track record do wellin business terms. They financially out-performedcompanies with below average ratings by morethan 43% (4,300 basis points) over the four yearsfrom March 1999 to March 2003 (see figure 8).
• Out-performance was not confined to the bestenvironmental performers in the paper and forestproducts sector. The companies with the bestenvironmental records/approach also out-performed in the integrated oil and gas, waterutilities and EU and US electric utilities sectors.
Environment Agency Corporate Environmental Governance 7
• In the integrated oil and gas sector, the topenvironmentally rated firms out-performedlaggards by 11.8% over three years and 2.6% overone year.
• Over three years, the stock price of EU electricutilities with above average environmentalperformance was 39% above that of belowaverage performers. The stock prices of the topand bottom environmental performers in the USelectricity sector demonstrated the same pattern.
• In the water utilities sector, environmental leadersout-performed laggard companies by 4.5percentage points over the three-year period.
Examples taken from the company case studiesshowed how environmental management in areassuch as environmental risk reduction and pollutioncontrol impact on direct costs and create savings.
• Baxter International uses systematic monitoring,recording and target setting to reduceenvironmental risks to business. Theseimprovements saved US$12.7 million in 2002, withcost avoidance at US$52 million. As the tablebelow shows, Baxter’s efforts have resulted in asignificant reduction of operating costs. In total,environmental efforts saved US$65 million in 2002(see table 8).
• At 3M, global fines for the company wereUS$85,000 in 1998 compared to US$253,000 in1990. Its share price has grown steadily since thecompany introduced its environmental programme(see figure 9).
• At Monsanto, a long-running lawsuit was recentlysettled for US$396 million on Monsanto’s part.Solutia, previously owned by the former Monsanto,paid up to US$200 million in remediation costsand filed for bankruptcy protection.
• Xstrata’s share price fell by about 5% on one day inJune 2002. This coincided with news that Japan wasconsidering a coal tax. In 2003, Xstrata publishedits first sustainability report, revealing newenvironmental governance structures and policiesthroughout the company. A follow-up report waspublished in April 2004. Portfolio diversification hasreduced exposure to future carbon risk and therehas been a possible improvement in corporateimage in terms of its environmental governance,thanks to increased transparency on environmentalissues management (see figure 10).
0%
10%
20%
30%
40%
50%
60%
70%
80%
90%
100%
Mar
1999
May
1999
Jul1
999
Sep1
999
Nov
1999
Jan2
000
Mar
2000
May
2000
Jul2
000
Sep2
000
Nov
2000
Jan2
001
Mar
2001
May
2001
Jul2
001
Sep2
001
Nov
2001
Jan2
002
Mar
2002
May
2002
Jul2
002
Sep2
002
Nov
2002
Jan2
003
Mar
2003
Cha
nge
inSt
ock
Pric
e
Difference Top Half EV 21 Avg. Bottom Half EV 21 Avg.Difference Environmental leaders Environmental laggards
Figure 8 Percentage change in total return of environmental leaders versus laggards in the forest and paper products sector 1999 – 2003
Note – figures and results are based on Innovest proprietary ratings of above and below average performers.
Environment Agency Corporate Environmental Governance 8
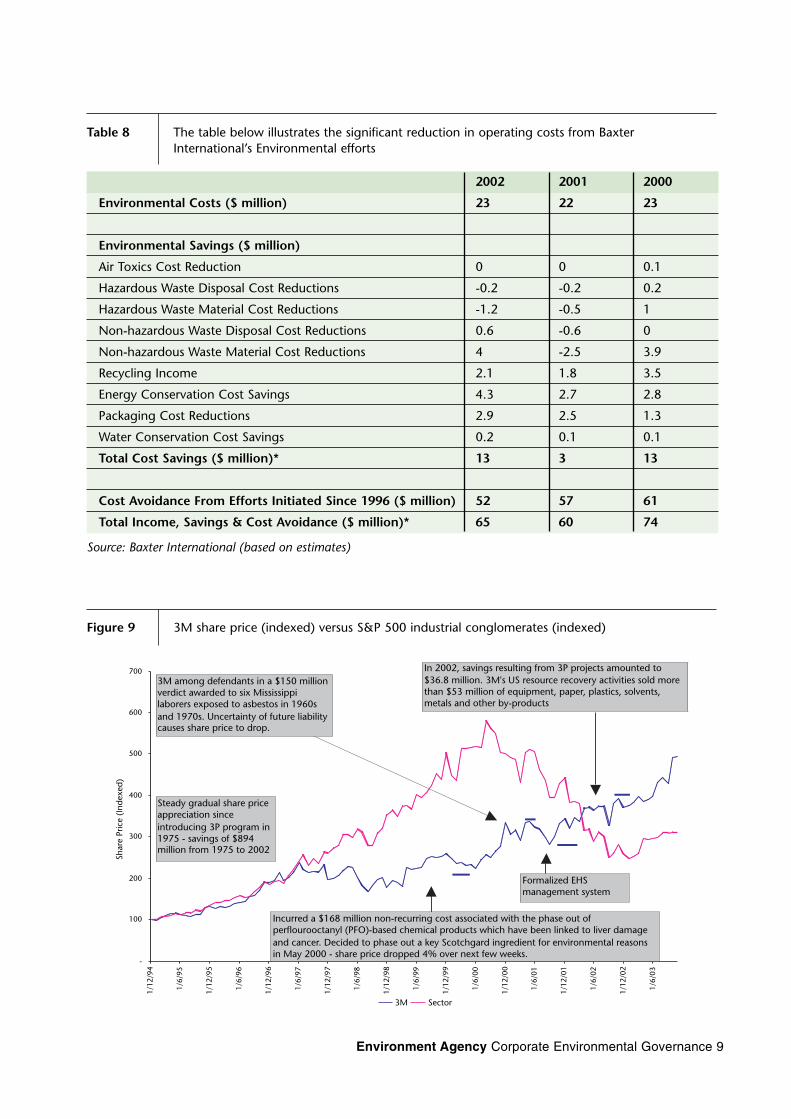
Table 8 The table below illustrates the significant reduction in operating costs from Baxter International’s Environmental efforts
2002 2001 2000
Environmental Costs ($ million) 23 22 23
Environmental Savings ($ million)
Air Toxics Cost Reduction 0 0 0.1
Hazardous Waste Disposal Cost Reductions -0.2 -0.2 0.2
Hazardous Waste Material Cost Reductions -1.2 -0.5 1
Non-hazardous Waste Disposal Cost Reductions 0.6 -0.6 0
Non-hazardous Waste Material Cost Reductions 4 -2.5 3.9
Recycling Income 2.1 1.8 3.5
Energy Conservation Cost Savings 4.3 2.7 2.8
Packaging Cost Reductions 2.9 2.5 1.3
Water Conservation Cost Savings 0.2 0.1 0.1
Total Cost Savings ($ million)* 13 3 13
Cost Avoidance From Efforts Initiated Since 1996 ($ million) 52 57 61
Total Income, Savings & Cost Avoidance ($ million)* 65 60 74
Source: Baxter International (based on estimates)
Figure 9 3M share price (indexed) versus S&P 500 industrial conglomerates (indexed)
-
100
200
300
400
500
600
700
1/12
/94
1/6/
95
1/12
/95
1/6/
96
1/12
/96
1/6/
97
1/12
/97
1/6/
98
1/12
/98
1/6/
99
1/12
/99
1/6/
00
1/12
/00
1/6/
01
1/12
/01
1/6/
02
1/12
/02
1/6/
03
Shar
e Pr
ice
(Ind
exed
)
3M Sector
Steady gradual share price appreciation since introducing 3P program in 1975 - savings of $894 million from 1975 to 2002
Incurred a $168 million non-recurring cost associated with the phase out of perflourooctanyl (PFO)-based chemical products which have been linked to liver damage and cancer. Decided to phase out a key Scotchgard ingredient for environmental reasons in May 2000 - share price dropped 4% over next few weeks.
Formalized EHS management system
In 2002, savings resulting from 3P projects amounted to $36.8 million. 3M's US resource recovery activities sold more than $53 million of equipment, paper, plastics, solvents, metals and other by-products
3M among defendants in a $150 million verdict awarded to six Mississippi laborers exposed to asbestos in 1960s and 1970s. Uncertainty of future liability causes share price to drop.
Environment Agency Corporate Environmental Governance 9

Figure 10 Xstrata share price (indexed) versus World DS Mining (indexed)
40
60
80
100
120
140
160
180
20/03/2002 20/07/2002 20/11/2002 20/03/2003 20/07/2003 20/11/2003
Shar
e Pr
ice
(inde
xed)
Xstrata Sector FTSE100
News emerged of Japan's intended coal
tax [Jun 2002]
Publication of 1st Sustainability Report
and Strategy [28-Jul-03]
Recommended Acquisition of MIM Holdings
Announced[07-Apr-03]
Table 9Number of financial measures considered
1 2 3-5 6-9 10+
Number of studies using only 1 environmental governance measure 18 10 1 7 - -
Number of studies using 2 environmental governance measures 11 3 2 3 2 1
Number of studies using 3-5 environmental governance measures 16 2 2 11 1 -
Number of studies using 6-9 environmental governance measures 10 1 1 3 4 1
Number of studies using 10+ environmental governance measures 5 1 1 1 1 1
Total 60 17 7 25 8 3
Future workThe table below shows that, of the 60 studies in theliterature review, only 16 focused on just one or twoenvironmental criteria and an equally small number ofcorresponding financial impact criteria. (See cellshighlighted in green in table 9 below.)
Many studies look at a broad range of environmentalgovernance factors and an array of financial impacts.This makes it difficult to pin down the effect ofindividual environmental governance measures onspecific financial measures.
Less than a quarter of the studies in the literaturereview attempted to assess the impact on financialperformance of any kind of problematic environmental
event such as a pollution incident. This is surprising:companies in developed markets are now required tooperate according to strict environmental standards.They are increasingly liable to pay large fines andremediation costs if they fail to comply with thesestandards. More research work in this area would bewelcome, in order to assess comprehensively thepotential impact on financial performance of goodversus poor environmental risk management systems.
It is clear that many factors, such as economic andpolitical developments, have a potential bearing onfinancial impacts and influence the efficacy of goodenvironmental governance. The degree to which theenvironmental effect may be overestimated is difficultto assess. It has not been tackled to any great extentin the current literature.
Environment Agency Corporate Environmental Governance 10
Conclusion
The overall finding from the literature review is thatthere is strong evidence that where a company hassound environmental governance policies, practicesand performance, this is highly likely to result inimproved financial performance. The evidence tendsto be more compelling when comparative studies areundertaken, with differences in performance betweenleaders and laggards being quite marked.
The case studies in this report confirm the findings ofthe literature review, in that changes in financialperformance stemming from environmentalgovernance measures can be demonstrated andquantified, although the extent to which thesechanges is due entirely to environmental governanceissues is not always clear.
One area where links can be more clearly establishedis that of operational impacts. The cost of an eco-efficiency initiative and its financial outcomes can bemeasured fairly precisely when a company sets upthe appropriate environmental accounting andreporting procedures. In the case of 3M and BaxterInternational, where the impacts could be examinedover a longer period of time, it was revealed that along term environmental governance strategy couldyield a continuing financial benefit.
Environment Agency Corporate Environmental Governance 11

Environment Agency Corporate Environmental Governance 12
Introduction The fact that good environmental governance can reduce business risks, many of which can have significant financial consequences, is indisputable. The volume of evidence that implementation of good environmental governance practices has the potential to deliver better financial performance has been growing considerably. While a consensus is emerging that a higher value is being placed on integration of environmental strategies into overall business objectives, there is still the view in some quarters that environmental governance issues do not represent real drivers of value. This paper attempts to examine the validity of these opposing viewpoints.
The increasing importance of environmental governance Evidence that implementation of good environmental governance practices can deliver improved financial performance is getting stronger year by year. Advocates of high standards of environmental governance point to a growing body of empirical research that supports the link between sustainable business strategies and above-average financial returns. This evidence has not gone unnoticed among the power brokers – government, regulators, shareholders and City analysts. Many in these circles would now argue that quality of management, including the ability to control risk, build reputation and enhance shareholder value, is reflected in a broader assortment of performance indicators, with certain environmental measures in the vanguard of these. A greater understanding of the financial relevance of environmental issues management to business does seem to be changing the way that environmental governance is perceived.
A new agenda from Government and more regulatory action The UK Government has stated that ‘greening business is central to the Government's drive to modernise the economy’ and that this goes 'hand-in-hand with improved competitiveness and creating a knowledge-driven economy.1 To back up this philosophy the Government has taken a number of steps. The climate change levy2 has been introduced, together with the landfill tax3 and adoption of packaging waste regulations4. The Government has enacted changes to legislation to encourage occupational pension funds to be more transparent about any social, environmental and ethical investment criteria5. In support of moves to a more sustainable way of conducting business, the Prime Minister called on all FTSE 350 companies to produce environmental reports by the end of 20016 and the Government has published a plethora of guidance documents covering key environmental governance issues such as eco-efficiency, new technologies, environmental reporting and management systems, exploiting environmental technologies, waste management and so on. As the environmental regulator, the Environment Agency also has a Corporate Strategy and a Green Business Strategy, which sets out its priorities and contribution to sustainable development. The Environment Agency has its own long term vision which takes the view that business will ‘reap the benefits of sustainable business practices, improve competitiveness and value to shareholders..’7 The Environment Agency measures and reports on the environmental performance of businesses in a number of ways. 1 http://www.sustainable-development.gov.uk/uk_strategy/factsheets/ukbus/index.htm 2 http://www.hmce.gov.uk/forms/notices/ccl1.htm#P85_3124 3 http://www.hmce.gov.uk/forms/notices/lft1.htm 4 http://www.defra.gov.uk/environment/waste/topics/packaging/ 5 From July 2000 pension funds have been required by the revised Pensions Act 1995 to state the extent to which they take social, environmental and ethical considerations into account when they invest money. 6 In his speech to the CBI/Green Alliance Conference (24 October 2000), the PM challenged the top 350 FTSE companies to publish annual environment reports by the end of 2001. This challenge has been reiterated by the Secretary of State for Trade and Industry and the Minister for the Environment. 7 http://www.environment-agency.gov.uk/commondata/105385/cpgreener_world_554150.pdf
Environment Agency Corporate Environmental Governance 13
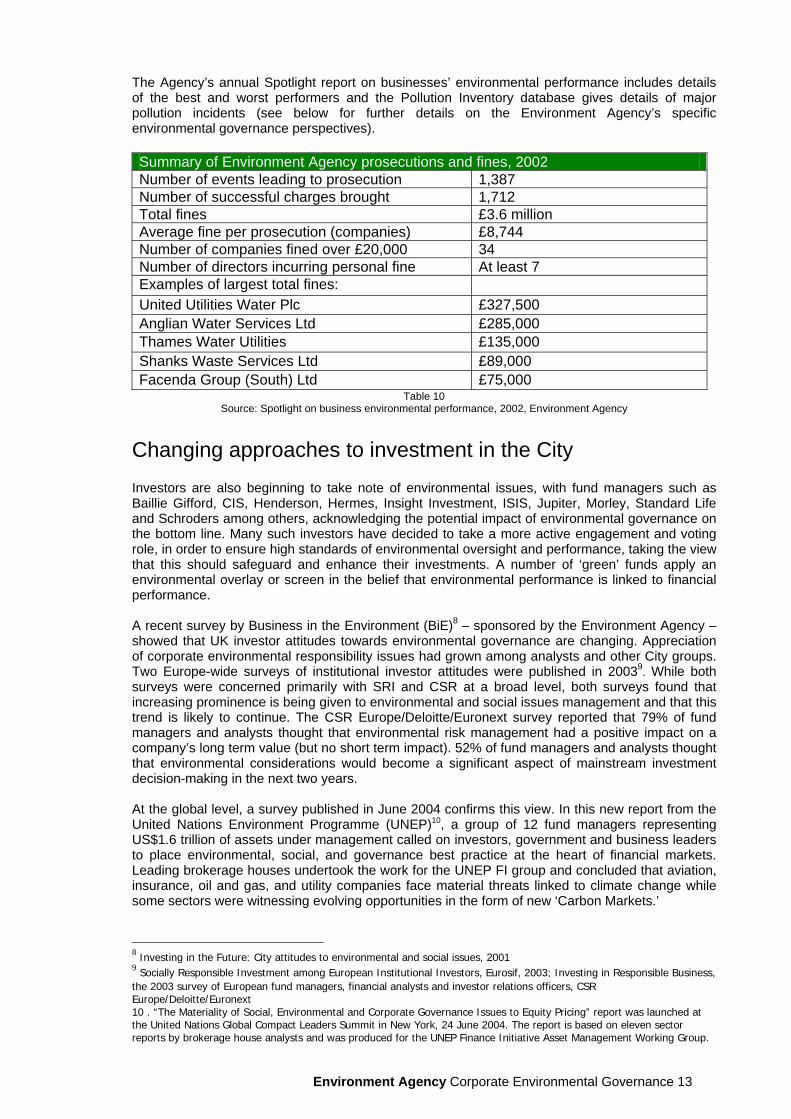
The Agency’s annual Spotlight report on businesses’ environmental performance includes details of the best and worst performers and the Pollution Inventory database gives details of major pollution incidents (see below for further details on the Environment Agency’s specific environmental governance perspectives). Summary of Environment Agency prosecutions and fines, 2002 Number of events leading to prosecution 1,387 Number of successful charges brought 1,712 Total fines £3.6 million Average fine per prosecution (companies) £8,744 Number of companies fined over £20,000 34 Number of directors incurring personal fine At least 7 Examples of largest total fines: United Utilities Water Plc £327,500 Anglian Water Services Ltd £285,000 Thames Water Utilities £135,000 Shanks Waste Services Ltd £89,000 Facenda Group (South) Ltd £75,000
Table 10 Source: Spotlight on business environmental performance, 2002, Environment Agency
Changing approaches to investment in the City Investors are also beginning to take note of environmental issues, with fund managers such as Baillie Gifford, CIS, Henderson, Hermes, Insight Investment, ISIS, Jupiter, Morley, Standard Life and Schroders among others, acknowledging the potential impact of environmental governance on the bottom line. Many such investors have decided to take a more active engagement and voting role, in order to ensure high standards of environmental oversight and performance, taking the view that this should safeguard and enhance their investments. A number of ‘green’ funds apply an environmental overlay or screen in the belief that environmental performance is linked to financial performance. A recent survey by Business in the Environment (BiE)8 – sponsored by the Environment Agency – showed that UK investor attitudes towards environmental governance are changing. Appreciation of corporate environmental responsibility issues had grown among analysts and other City groups. Two Europe-wide surveys of institutional investor attitudes were published in 20039. While both surveys were concerned primarily with SRI and CSR at a broad level, both surveys found that increasing prominence is being given to environmental and social issues management and that this trend is likely to continue. The CSR Europe/Deloitte/Euronext survey reported that 79% of fund managers and analysts thought that environmental risk management had a positive impact on a company’s long term value (but no short term impact). 52% of fund managers and analysts thought that environmental considerations would become a significant aspect of mainstream investment decision-making in the next two years. At the global level, a survey published in June 2004 confirms this view. In this new report from the United Nations Environment Programme (UNEP)10, a group of 12 fund managers representing US$1.6 trillion of assets under management called on investors, government and business leaders to place environmental, social, and governance best practice at the heart of financial markets. Leading brokerage houses undertook the work for the UNEP FI group and concluded that aviation, insurance, oil and gas, and utility companies face material threats linked to climate change while some sectors were witnessing evolving opportunities in the form of new ‘Carbon Markets.’
8 Investing in the Future: City attitudes to environmental and social issues, 2001 9 Socially Responsible Investment among European Institutional Investors, Eurosif, 2003; Investing in Responsible Business, the 2003 survey of European fund managers, financial analysts and investor relations officers, CSR Europe/Deloitte/Euronext 10 . “The Materiality of Social, Environmental and Corporate Governance Issues to Equity Pricing” report was launched at the United Nations Global Compact Leaders Summit in New York, 24 June 2004. The report is based on eleven sector reports by brokerage house analysts and was produced for the UNEP Finance Initiative Asset Management Working Group.
Environment Agency Corporate Environmental Governance 14
Brokerage houses contributing sector research for the UNEP FI report included some high profile names such as ABN AMRO Equities (UK); Deutsche Bank Global Equity Research and South African Equity Research; Dresdner Kleinwort Wasserstein Europe and UK; Goldman Sachs European Equity Research; HSBC; UBS Global Equity Research and West LB Equity Markets. The 12 financial institutions that worked with UNEP on the report also included some prominent players from around the globe such as BNP Paribas Asset Management, France; Citigroup Asset Management, USA; Morley Fund Management, UK; Storebrand Investments, Norway; ABN AMRO Asset Management, Brazil HSBC Asset Management, Europe. While the message is emerging that a higher value is being placed on integration of environmental strategies into overall business objectives, in practice there is still the fairly deeply rooted view in many quarters that environmental governance issues are not considered that relevant as drivers of value. This was another conclusion which could be drawn from the BiE survey which also found that, when prompted for a spontaneous answer, just 3% of analysts and 4% of investors mentioned these factors as things they would take into account.
The Environment Agency approach In its response to the Company Law Review, the Environment Agency developed its own policy on corporate environmental governance. The Environment Agency believes that companies have a duty of care towards the environment and that FTSE listed companies should summarise their environmental performance in their annual report and accounts. In terms of the commercial imperatives linked to good environmental governance, the Environment Agency consider companies that reduce environmental risks and impacts to be more sustainable, profitable, valuable, and competitive. The Environment Agency believe this makes good sense for the economy, companies and investors alike, as well as for the environment (described in this report as the ‘win-win’ situation). Equally, the Environment Agency believes those companies that ignore environmental risks and impacts are less sustainable in any scale but in the very short term are likely to be less profitable, valuable, and competitive. This is potentially bad for the economy, companies, investors and the environment (the ‘lose-lose’ situation). In short, the Environment Agency aims to praise the good environmental performers and seek to change the behaviour of poor performers. The Environment Agency has commissioned this report, to shed some light of the value of good environmental governance from a business perspective, and thereby encourage more widespread adoption of sound environmental policies, practices and lead to improved environmental and financial performance (full details on the Agency’s view on the role of environmental governance can be found on the Agency web site - - www.environment-agency.gov.uk).
What the report is hoping to achieve While there is a growing belief that environmental governance and financial performance are connected, the jury still seems to be out – in the mainstream investment community at least – as to whether or not this view can be substantiated. As one study author put it: ‘After a generation of experience with environmental issues, regulations, and management efforts, an active debate has emerged over whether environmental activities are value-adding or value-destroying. The debate divides into two theories: the Cost Center and Value Creation. The former argues that environmental issues represent primarily increased cost and offer little positive potential for shareholders. The latter view is that the environment presents a new lens through which companies can identify and realize new sources of competitive advantage and improved financial returns’ 11 To address this debate, many studies have been undertaken in recent years, as well as several other literature reviews, but much of the research to date has concentrated on the possible benefits to be derived from pursuing a broad sustainable business strategy. It is the view of the authors that less research has been undertaken to try and bring together the results of studies which have focused exclusively or predominantly on environmental governance.
11 The Emerging Relationship between Environmental Performance and Shareholder Wealth, Ralph Earle, 2002
Environment Agency Corporate Environmental Governance 15
So one of the goals in this report is to isolate research into the impacts of environmental governance from other strands of research carried out in the SRI field. By focusing on environmental governance measures and associated financial impacts, the report aims to ensure that findings are closely aligned with the work of the Environment Agency. The report seeks to identify commonalties as well as limitations of the work undertaken so far by academia and the financial industry. Areas for further research will be highlighted. The report will also play a role in informing Environment Agency thinking in the development, promotion and implementation of strategy and action plans aimed at influencing the environmental governance policies of companies and financial institutions in the UK. In summary, this report seeks to tackle the following five questions:
Is there evidence to support a positive link between the environmental governance of individual companies and their financial performance?
If such a link exists, is it more pronounced in some sectors than in others?
Is it possible to say which financial performance indicators best illustrate any effect environmental governance may have?
Can it be concluded that certain types of environmental governance measures will have an impact on certain financial indicators and can the longevity of the effect on financial performance be assessed?
Is the body of research comprehensive in its coverage of environmental governance issues and financial indicators?
For the purposes of this study, it was decided that a fresh literature review would be undertaken, supported by some new research in the form of a series of case studies. The objective of the literature review is to provide an assessment of current thinking which links environmental governance to a company’s share price and financial performance. By undertaking new case studies, the report seeks to bring some additional analysis to the body of literature already available. This report has been compiled by Innovest Strategic Value Advisors (please see Appendix for further information on the authors).
How environmental governance is defined The term environmental governance is defined as encompassing the full range of best practice approaches to the management by companies of their environmental impacts, risks, performance and opportunities. These approaches are reflected in the Environment Agency’s corporate environmental governance policy12. Environmental governance includes the following key business considerations:
• Environmental values (visions, mission, principles); • Environmental policy (strategy, objectives, targets); • Environmental oversight (responsibility, direction, training, communication); • Environmental processes (management systems, initiatives, internal control, monitoring
and review, stakeholder dialogue, reporting and verification); • Environmental performance (use of KPIs, benchmarking, eco-efficiency, reputation,
compliance, liabilities, business development). All these key criteria match the environmental metrics which have been devised by leading organizations and other authorities in this field, subsequently adopted by many corporate entities and which also form the basis for many of the research studies undertaken by others. The Department for Food, Environment and Rural Affairs (Defra) for example, has produced a general set of guidelines that set out how to produce a good quality environmental report. In addition Defra13 has published separate guidelines on how to measure and report on the three key 12 http://www.environment-agency.gov.uk/commondata/105385/ag_policy.pdf 13 http://www.defra.gov.uk/environment/envrp/index.htm

Environment Agency Corporate Environmental Governance 16
impacts common to all companies: greenhouse gas emissions, waste, water use. Extensive sets of environmental governance criteria have been developed by organisations such as the GRI14; with guidance on implementation from sources such as the AA1000 process model15 and the EFQM excellence model16.
The structure of the report and the methodology used Our report is divided into two parts. The first half of the report presents the findings of the literature review. The second half provides a series of case studies, numbering 15 in total. These case studies have been selected to provide some new and unique insights into the impact of environmental governance factors on financial performance, looking at quantifiable links to share price performance in particular. The literature review summarises the evidence for a positive, negative or neutral correlation (see below for a definition of these correlations) between environmental governance and financial performance. The review also considers which environmental governance measures and which financial indicators have been used most frequently in recent work in this area. The review provides some extracts from the studies found, to demonstrate the strength of any connections which have been put forward. The studies included in the literature review are drawn mainly from the UK and the US, with some additional international publications. The scope of the review was pre-defined to include studies published within the last five years, and using a fairly short time frame helps to ensure that all the latest thinking and research findings in this area are taken into consideration. It is worth noting that the literature review seeks to identify links based on empirical evidence. For the purposes of this report, the main focus has not extended to include papers that are interested primarily in making a business case based on a more ethical agenda or which are based largely on a more subjective or theoretical type of analysis. Many of the studies sourced did not focus solely on environmental governance, but encompassed a whole host of CSR issues. Some of these studies were included in the literature review where it was considered that they presented results that distinguished between the impact on financial performance of environmental and other CSR factors. Studies which looked at a range of SRI/CSR factors, or which looked at the performance of SRI funds, were generally excluded from the literature review. This is on the basis that environmental governance as a driver of financial performance was just one of many other SRI/CSR factors considered in those studies and its impact on financial performance was not analysed separately. The reason for this approach is that the Environment Agency is particularly interested in assessing the role of environmental rather than social drivers of value. The report includes company-based studies (which examine private or publicly listed companies, the latter usually within a leading index of shares such as the FTSE 350 or S&P500), sector-based studies (which look at one or more industries, such as mining or integrated oil and gas) and investment-based studies (which examine pure 'green' funds or funds with an environmental overlay). A number of other literature reviews that were wholly or largely relevant to the impact of environmental governance on financial performance were identified. An assessment of the findings of other literature reviews is useful for comparative purposes. The report also classifies the nature of the relationship between environmental governance and financial performance in each study, according to whether the link was positive, negative and neutral. The classification system is summarised in the table below.
14 http://www.globalreporting.org/divers/environment.asp 15 http://www.accountability.org.uk/aa1000/default.asp 16 http://www.efqm.org/model_awards/model/excellence_model.htm

Environment Agency Corporate Environmental Governance 17
Table 7 The approach taken for the company-specific case studies has been to select companies of varying sizes and global reach. So for example at one end of the spectrum is Shell, a long-established, FTSE100 listed global energy company with a wide range of products, while at the other is Vestas Wind Systems, a new and relatively small player in the energy market listed on the Copenhagen Stock Exchange and offering a single, niche market product. Similarly, the report sought to analyse sectors with varying environmental impacts. This approach should help to say whether the correlation between environmental governance and financial performance is stronger in certain sectors than in others. So while two case studies on energy companies have been included, sectors such as financial services (e.g. Co-operative Bank) and manufacturing (e.g. 3M) have also been covered. Another factor for consideration in all the case studies was the extent to which there was current and high quality data available, and all the companies considered publish detailed information on their environmental governance standards and performance. For the sector case studies, the approach taken was to compare the financial performance of companies with high standards of environmental governance with that of companies with weaker approaches to environmental governance, compared to peers17.
17 Sector classifications in line with MSCI sector classifications. Assessment of the quality of environmental governance standards was based on Innovest ratings (the Innovest methodology is also explained in the Appendix). NB - inclusion of Innovest rating results does not represent an endorsement of the ranking of any company profiled in this report).

Environment Agency Corporate Environmental Governance 18
Literature Review A wide range of environmental governance measures has been assessed in recent studies Environmental governance measures, such as implementation of an environmental strategy or an environmental management system, represent an on-going challenge to an organisation. They remain a challenge because if implemented successfully, they should be able to help companies to avoid environmental risks, achieve cost savings and potentially exploit new business opportunities. Studies which look at these measures have generally undertaken a regression analysis, measuring financial impacts over time. Other studies focus on one-off environmental events or historic liabilities and look at the impacts of particular incidents, such as polluting a local habitat, which may result in a financial penalty. Table 3 shows each of the environmental factors assessed in the literature review.
Table 3
Many different financial indicators have been considered A distinction can be made between financial indicators which are quantitatively derived (traditional ‘fundamentals’) and ‘intangible’ values (which do not, as yet, generally appear in company accounts, but which are very likely nonetheless to have a financial impact). The indicators considered in the review are set out in table 4.
Table 4 A total of 70 studies relevant to this report were identified. 10 of these studies had also reviewed current literature. The statistical analysis shown in this report relates to the 60 studies that were not undertaking a literature review. This approach allows for an assessment of relevant literature according to the three main survey categories (companies, sectors, funds). This number of surveys identified may seem a small, but as mentioned above these are studies which have been published in the past five years or so only, 1997/8 – 2003/4 and which exclude more broadly-based CSR/SRI analyses. In addition, the report focused on studies where a statistical analysis had been carried out, rather than relying on anecdotal evidence, as this was felt to provide a more rigorous understanding of environmental governance connections to financial performance.

Environment Agency Corporate Environmental Governance 19
A further 24 related studies were reviewed but it was decided they were not wholly relevant under the terms of reference. The table below shows the breakdown of studies reviewed by type.
Table 5
51 of the 60 studies reviewed found a positive correlation between environmental governance / events and financial performance The literature review found strong evidence for the existence of a positive relationship between environmental governance and financial performance. In 51 of the 60 studies, 85% of the total number, a positive correlation between environmental governance / environmental events and financial performance was found. These results are largely consistent with other literature reviews that have been conducted over the past few years. 9 of the 10 other literature reviews considered found individual studies showing either a positive and/or neutral effect, with only 4 of the literature reviews unearthing studies demonstrating a negative impact. A small number of the studies, 11 in total, found a neutral effect, while 8 studies concluded that implementation of environmental governance measures could in fact be damaging to financial performance. Note – where a range of environmental governance and / or financial measures are considered in a single study, a combination of positive, neutral and / or negative correlations between different measures is possible within that study’s conclusions, hence the total number of correlations in the chart above adds to more than 60. The overall breakdown of the types of correlations found is in this study is described in figure 1 below.
Figure 1 Number of Positive, Neutral and Negative Correlations Found

Environment Agency Corporate Environmental Governance 20
Most studies undertaken in the US, while the UK and rest of Europe are lagging behind Studies of North American companies and industry sectors featured very strongly and this reflects the fact that most of the recent environmental governance studies have been carried out in the US itself. Of the 60 studies, 44 were published by authors from institutions and other organisations North America, though a few of these were co-authored with UK and other EU institutions. Only 7 of the studies had been published / undertaken solely by UK organisations (4 more in partnership with non-UK authors). The only UK studies were: • ‘Risking Shareholder Value? ExxonMobil and Climate Change’, Claros Consulting; • ‘The Link between Company Environmental and Financial Performance’, Earthscan; • ‘Emissions Trading - Carbon Derby’, Dresdner Kleinwort Wasserstein; • ‘Climate Change and Aviation’, Schroder Investment Management; • ‘The Benefits of Corporate Sustainability and Responsibility’, Environmental Finance; • ‘Green with Envy’, Commerzbank Securities; • ‘Does Ethical Investment Pay?’, Eiris. 29 of the studies came from academia while 32 were from the business community, with most emanating from North American institutions It is encouraging that some in the financial community have begun to examine the relevance of environmental governance. This suggests that investors are beginning to recognise that empirical investigation into any financial connections is now becoming more imperative. Some very detailed and cutting edge work has been carried out recently by or in partnership with consultants, leading banks and fund managers, such as ABP; Arthur D. Little; Commerzbank; Pictet; Sarasin; WestLB. 10 of the 60 studies were published by financial institutions.
Table 6 Note – Several of the studies were co-authored by different organisations, based in different countries, hence the total number of studies in the table above adds to more than 60.

Environment Agency Corporate Environmental Governance 21
A positive link between environmental governance and financial impact in 26 of the 30 company surveys In a high proportion of the company studies, 26 of the 30 identified, there was a positive correlation between environmental governance and financial performance. We also found that the majority of the company-based studies considered some or all of the constituents of a full index of leading shares such as the S&P500, rather than individual companies.
Company studies showing positive correlations ‘The Link between Company Environmental and Financial Performance’ by Edwards, D., from 1999, looked at quantitative links between environmental and financial performance for the UK's best and worst environmental performers across a range of sectors. It demonstrated there is no financial penalty for being environmentally proactive and confirmed many findings from studies in the US that good environmental performance improves financial performance. In ‘Contemporary Environmental Accounting: Issues, Concepts and Practice’, Earthscan, 2000, there is a chapter on environmental shareholder value and environmental issues. It notes improved EMS and performance can reduce systematic risk by approximately 13% and refers to a study into the effects of the Superfund in the US, which found that 62.5% of banks analysed had rejected loan applications because of the possibility of environmental liability.
Company studies showing neutral or negative correlations In ‘A Resource-based Perspective on Corporate Environmental Performance and Profitability’, Russo and Fouts, 1997, the authors wanted to test the view that environmental performance and economic performance are positively linked. The study tested this hypothesis with an analysis of 243 firms over two years, using independently developed environmental ratings. The authors found that environmental variables do not account for more than a modest level of variation in firm performance. This paper also referenced a number of other empirical studies which have shown no significant link between measures of environmental performance and profitability. Waddock and Graves, in ‘Finding the Link between Stakeholder Relations and Quality of Management’, 1997 compared the relationship between management quality and treatment of specific stakeholder issues. Treatment of the ecological environment was not found to be significantly related to quality of management in any of the models. The authors concluded that the environment was not an important factor in developing a reputation for quality management. The lack of significance of environmental concerns may have been related to a general lack of awareness of the relevance of environmental issues to the corporate world. At the time, environmental awareness among corporations was still a relatively recent phenomenon.
Environment Agency Corporate Environmental Governance 22
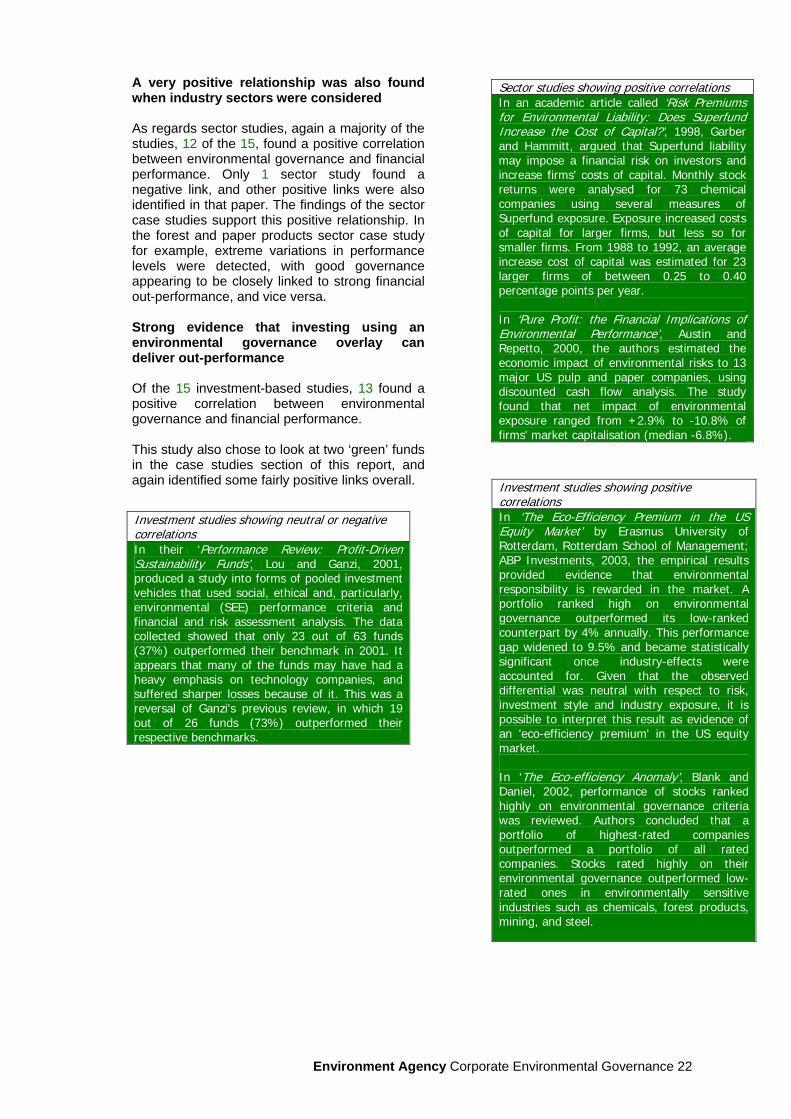
A very positive relationship was also found when industry sectors were considered As regards sector studies, again a majority of the studies, 12 of the 15, found a positive correlation between environmental governance and financial performance. Only 1 sector study found a negative link, and other positive links were also identified in that paper. The findings of the sector case studies support this positive relationship. In the forest and paper products sector case study for example, extreme variations in performance levels were detected, with good governance appearing to be closely linked to strong financial out-performance, and vice versa. Strong evidence that investing using an environmental governance overlay can deliver out-performance Of the 15 investment-based studies, 13 found a positive correlation between environmental governance and financial performance. This study also chose to look at two ‘green’ funds in the case studies section of this report, and again identified some fairly positive links overall.
Sector studies showing positive correlations In an academic article called ‘Risk Premiums for Environmental Liability: Does Superfund Increase the Cost of Capital?’, 1998, Garber and Hammitt, argued that Superfund liability may impose a financial risk on investors and increase firms' costs of capital. Monthly stock returns were analysed for 73 chemical companies using several measures of Superfund exposure. Exposure increased costs of capital for larger firms, but less so for smaller firms. From 1988 to 1992, an average increase cost of capital was estimated for 23 larger firms of between 0.25 to 0.40 percentage points per year. In ‘Pure Profit: the Financial Implications of Environmental Performance’, Austin and Repetto, 2000, the authors estimated the economic impact of environmental risks to 13 major US pulp and paper companies, using discounted cash flow analysis. The study found that net impact of environmental exposure ranged from +2.9% to -10.8% of firms' market capitalisation (median -6.8%).
Investment studies showing positive correlations In ‘The Eco-Efficiency Premium in the US Equity Market’ by Erasmus University of Rotterdam, Rotterdam School of Management; ABP Investments, 2003, the empirical results provided evidence that environmental responsibility is rewarded in the market. A portfolio ranked high on environmental governance outperformed its low-ranked counterpart by 4% annually. This performance gap widened to 9.5% and became statistically significant once industry-effects were accounted for. Given that the observed differential was neutral with respect to risk, investment style and industry exposure, it is possible to interpret this result as evidence of an 'eco-efficiency premium' in the US equity market. In ‘The Eco-efficiency Anomaly’, Blank and Daniel, 2002, performance of stocks ranked highly on environmental governance criteria was reviewed. Authors concluded that a portfolio of highest-rated companies outperformed a portfolio of all rated companies. Stocks rated highly on their environmental governance outperformed low-rated ones in environmentally sensitive industries such as chemicals, forest products, mining, and steel.
Investment studies showing neutral or negative correlations In their ‘Performance Review: Profit-Driven Sustainability Funds’, Lou and Ganzi, 2001, produced a study into forms of pooled investment vehicles that used social, ethical and, particularly, environmental (SEE) performance criteria and financial and risk assessment analysis. The data collected showed that only 23 out of 63 funds (37%) outperformed their benchmark in 2001. It appears that many of the funds may have had a heavy emphasis on technology companies, and suffered sharper losses because of it. This was a reversal of Ganzi's previous review, in which 19 out of 26 funds (73%) outperformed their respective benchmarks.

Environment Agency Corporate Environmental Governance 23
Research focus has been on share price and shareholder value impacts Our study also set out to ask whether there are particular environmental governance measures which have an impact on certain financial indicators. As a first step, it is useful to consider which financial indicators are most commonly cited in the literature. Shareholder value – the exact meaning of which is not always clearly explained in many research studies – was found to be the most frequently used financial indicator, with 48% of the studies examining impacts on this measure. Share price was a close second, examined in 47% of studies. 37% of the studies considered the effect on operating costs, while 35% examined the impact on a more intangible measure, namely risk avoidance. These results are very much in line with other literature reviews which have been carried out in the past five years. They also found that most studies focused on environmental governance impacts on the same four financial measures: shareholder value, share price, operating costs and risk and reputation issues. Nearly all the studies looked at environmental governance as a strategic management issue, event studies less common The literature focuses strongly on on-going environmental governance measures, rather than on environmental events. 54 of the 60 studies examined the financial impact of at least one type of on-going environmental governance measure. Less than half of the studies, 28 in total, considered the impact of an environmental event such as a toxic release. Testing the impact of an overall environmental strategy is most common approach Our review found that while the range of environmental governance issues used in the literature is broad, the focus is very much on environmental policy issues (e.g. environmental strategy) and to a lesser extent on operational issues (e.g. EMS and eco-efficiency). In 44 of the 60 studies, reference to environmental strategy was found. Many of the studies take a very broad view of environmental governance, rather than focusing on specific measures. The possible impacts of climate change also featured strongly, as did development of environmental products/services/technologies, use of an EMS and eco-efficiency measures.

Environment Agency Corporate Environmental Governance 24
The prominence of the various environmental governance issues found in the literature review is shown in figure 5 below.
Figure 5 Number of References to Environmental Governance Issues Identified In Literature Review
0 5 10 15 20 25 30 35 40 45 50
Training
Audit/ Verification
Oversight
Accounting/Reporting
Profit Opportunities
Eco-efficiency
Env'al ManagementS t
Products / services
ClimateCh
Strategy
No. References to Env'alGovernance Issues
Number of references
The impact of toxic emissions and pollutant spills and releases – and the fines that accompanied them – was the subject of 23 and 21 of the studies respectively. Figure 6 gives the breakdown of the different environmental events considered in studies included in the literature review:
Figure 6
Number of References to Environmental Events Identified In Literature Review
0 5 10 15 20 25 30 35 40 45
Biodiversity Loss
Hazardous Waste
Historic Liabilities
Spills and Releases
Toxic Emissions
No. References toEnv'al Events
Number of references
Environment Agency Corporate Environmental Governance 25
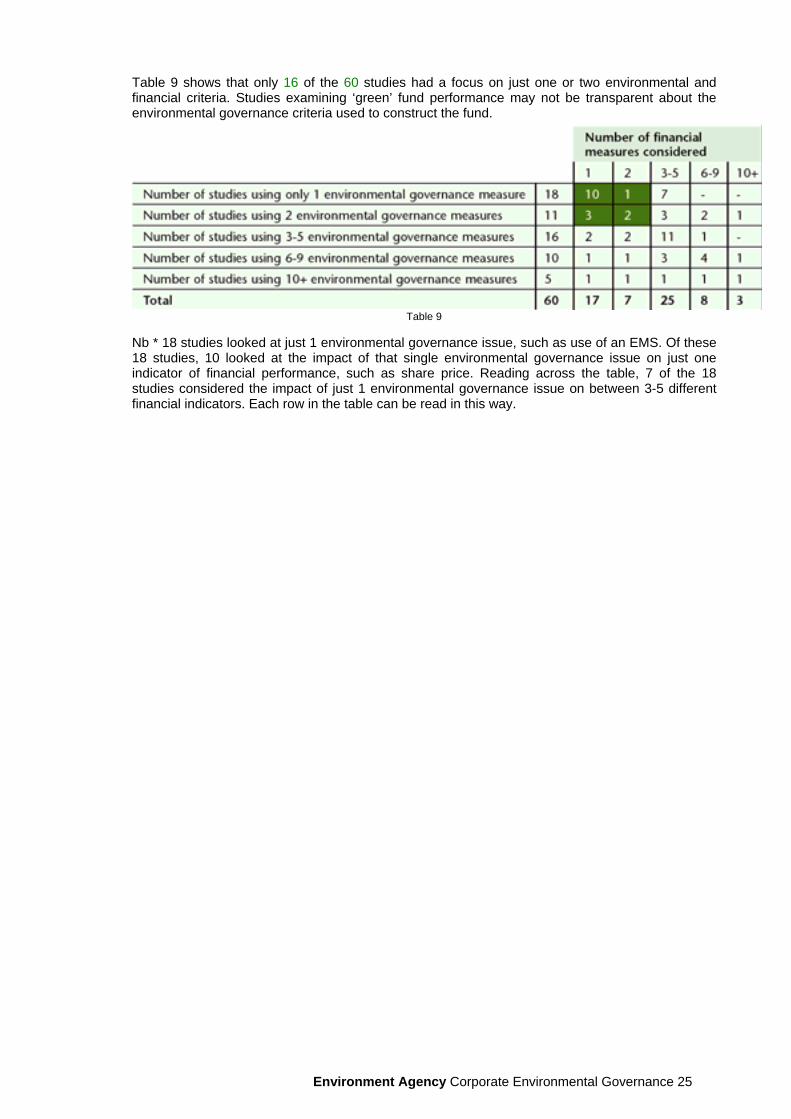
Table 9 shows that only 16 of the 60 studies had a focus on just one or two environmental and financial criteria. Studies examining ‘green’ fund performance may not be transparent about the environmental governance criteria used to construct the fund.
Table 9 Nb * 18 studies looked at just 1 environmental governance issue, such as use of an EMS. Of these 18 studies, 10 looked at the impact of that single environmental governance issue on just one indicator of financial performance, such as share price. Reading across the table, 7 of the 18 studies considered the impact of just 1 environmental governance issue on between 3-5 different financial indicators. Each row in the table can be read in this way.

Environment Agency Corporate Environmental Governance 26
Implementation of an environmental strategy is likely to enhance financial performance It is becoming increasingly difficult for companies, particularly in the UK, to ignore calls for adoption of an appropriate environmental strategy, with many high profile fund managers having developed clear voting policies setting out the value they place on good environmental governance. For example, Morley Fund Management’s voting policy requires companies to disclose their approach to managing their environmental impacts. Morley considers that ‘companies which do not have adequate safeguards in place will be susceptible to reputational risk and fines from regulatory authorities which may in turn lead to poorer financial returns’.18 Other institutional investors have developed similar voting policies. One good example of the positive impact implementation of an environmental strategy can have comes from the company case studies. The case study which highlighted 3M’s long-established environmental governance strategy revealed continuous and significant cost savings over a considerable period of time.
18 http://www.morleyfm.co.uk/literature_library/corp_gov_voting.pdf
Environmental strategy studies showing positive correlations In ‘Do Global Environmental Standards Create or Destroy Market Value?’, Dowell; Hart and Yeung, 2000, market valuations and environmental policies of S&P500 manufacturing and mining companies were examined. The authors noted that companies with the highest stated environmental standards also tended to have significantly higher price/book ratios. The study concluded that there is 'a significant and positive relationship between the market value of a company (as measured by Tobin's Q) and the level of environmental governance standards. Results also suggested that a firm's market value appreciates quickly once it adopts a higher environmental standard.' (This study won the 2001 Moskowitz Prize competition for the best quantitative study of socially responsible investing.) ‘Corporate Social and Environmental Performance and their Relation to Financial Performance and Institutional Ownership: Empirical Evidence on Canadian Firms.’, Mahoney and Roberts, 2002 evaluates the impact of environmental governance and social responsibility on the financial performance (ROE and ROA) of Toronto Stock Exchange firms. It found that both environmental performance and international social performance have a significant positive relationship with ROA and ROE. It also found that environmental performance was positively correlated with institutional ownership, but the overall social performance had a negative correlation.

Environment Agency Corporate Environmental Governance 27
Climate change emerging as an important area of analysis and studies are unanimous in reporting that an appropriate climate change response pays off Studies looking at climate change focus mainly on the potential financial impacts on various high impact industry sectors, such as utilities or the extractive industries. Implementation of a climate change strategy is generally found to have a positive impact on future financial performance. This is perhaps not surprising, given that climate change is a very high profile issue and certainly one which is very much on the radar screens of the financial community. The UK Government's Energy White Paper, published in February 2003, set out a new vision for the country's energy policy and puts the UK on the path to cutting its carbon dioxide emissions by 60% by 2050. In November 2003 Environment Secretary Margaret Beckett told a City audience from the investment, financial and insurance sectors that companies and investors that are well informed about the risks of climate change will be best placed both to protect themselves, and to invest in cleaner technologies. At the Institutional Investors' Group on Climate Change (IIGCC) conference the Secretary of State said that climate change is a crucial issue for UK investors and business and that it represents major opportunities to invest in new cleaner technologies, and to trade in greenhouse gas emissions. She also noted that climate change also poses risks for those in business who do not address it properly, saying that "Climate change could affect both the bottom line and business reputations. Investors need to know how the companies they invest in could be affected by changes in energy policy and regulation. On top of this, businesses could be exposed to the impacts of climate change. We could face a future of more floods, droughts and storms, leading to higher insurance costs and business disruption”. The company case study on Vestas which features in this report looks at a company which is tackling climate change concerns head on through a business strategy based on exploiting the market for renewable energy.
Climate change studies showing positive correlations ‘Emissions Trading - Carbon Derby’, Dresdner Kleinwort Wasserstein, 2003 looked at the impacts of emissions trading on 11 electric utility generators. The report examined value creation opportunities and assessed how those switching to cleaner fuels are set to benefit. The study found that the onset of emissions trading would affect the market cap of different electric utility companies. A main finding was that the biggest beneficiaries would be those operating in low priced electricity markets where the cost of emitting CO2 could be readily assimilated into prices. In another recent utilities sector report, ‘Environmental Exposures in the US Electric Utility Industry’, Repetto and Henderson, 2003, there is a review of 47 US electric utilities' exposure to possible changes in future air emissions policies. The study estimated compliance costs of 5-115% of 2000 revenues, depending on the company and scenario under study. In ‘Changing Oil: Emerging Environmental Risks and Shareholder Value in the Oil and Gas Industry’, the World Resources Institute, 2002, the authors found that shareholder value could be impacted by 10% or more for some companies, although they noted that potential impact varies widely.
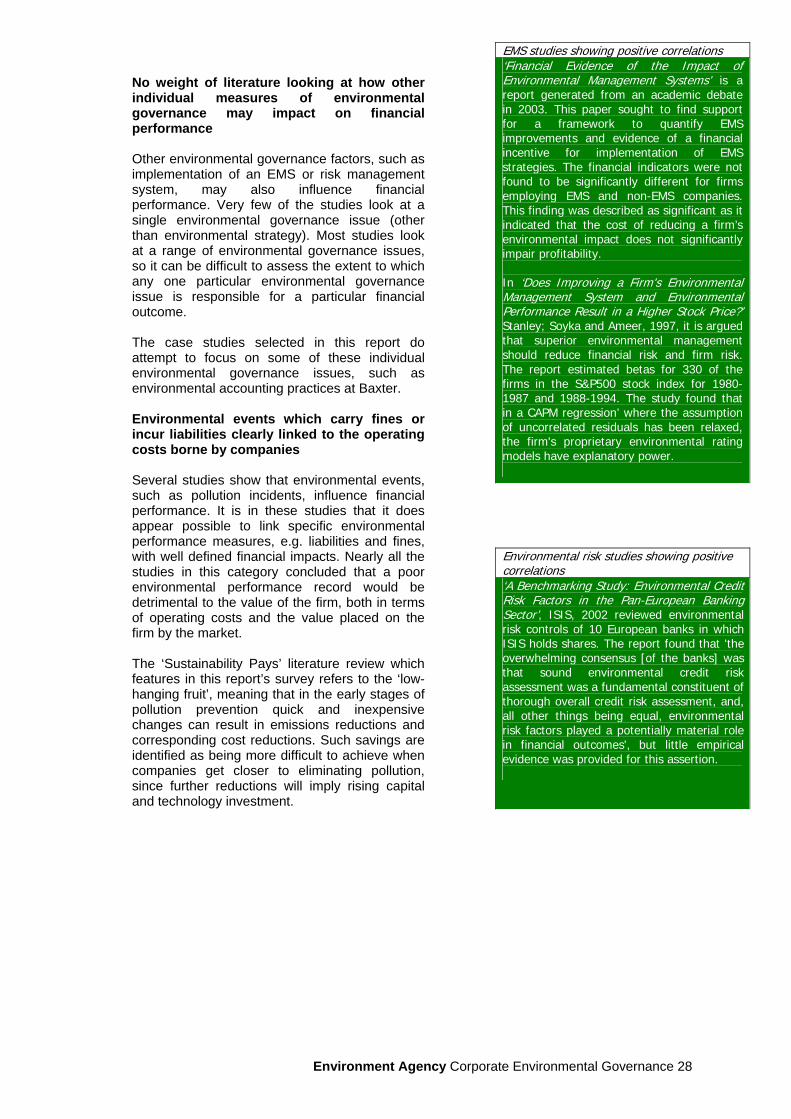
Environment Agency Corporate Environmental Governance 28
No weight of literature looking at how other individual measures of environmental governance may impact on financial performance Other environmental governance factors, such as implementation of an EMS or risk management system, may also influence financial performance. Very few of the studies look at a single environmental governance issue (other than environmental strategy). Most studies look at a range of environmental governance issues, so it can be difficult to assess the extent to which any one particular environmental governance issue is responsible for a particular financial outcome. The case studies selected in this report do attempt to focus on some of these individual environmental governance issues, such as environmental accounting practices at Baxter. Environmental events which carry fines or incur liabilities clearly linked to the operating costs borne by companies Several studies show that environmental events, such as pollution incidents, influence financial performance. It is in these studies that it does appear possible to link specific environmental performance measures, e.g. liabilities and fines, with well defined financial impacts. Nearly all the studies in this category concluded that a poor environmental performance record would be detrimental to the value of the firm, both in terms of operating costs and the value placed on the firm by the market. The ‘Sustainability Pays’ literature review which features in this report’s survey refers to the ‘low-hanging fruit’, meaning that in the early stages of pollution prevention quick and inexpensive changes can result in emissions reductions and corresponding cost reductions. Such savings are identified as being more difficult to achieve when companies get closer to eliminating pollution, since further reductions will imply rising capital and technology investment.
Environmental risk studies showing positive correlations ‘A Benchmarking Study: Environmental Credit Risk Factors in the Pan-European Banking Sector’, ISIS, 2002 reviewed environmental risk controls of 10 European banks in which ISIS holds shares. The report found that 'the overwhelming consensus [of the banks] was that sound environmental credit risk assessment was a fundamental constituent of thorough overall credit risk assessment, and, all other things being equal, environmental risk factors played a potentially material role in financial outcomes', but little empirical evidence was provided for this assertion.
EMS studies showing positive correlations ‘Financial Evidence of the Impact of Environmental Management Systems’ is a report generated from an academic debate in 2003. This paper sought to find support for a framework to quantify EMS improvements and evidence of a financial incentive for implementation of EMS strategies. The financial indicators were not found to be significantly different for firms employing EMS and non-EMS companies. This finding was described as significant as it indicated that the cost of reducing a firm’s environmental impact does not significantly impair profitability. In ‘Does Improving a Firm's Environmental Management System and Environmental Performance Result in a Higher Stock Price?’ Stanley; Soyka and Ameer, 1997, it is argued that superior environmental management should reduce financial risk and firm risk. The report estimated betas for 330 of the firms in the S&P500 stock index for 1980-1987 and 1988-1994. The study found that in a CAPM regression’ where the assumption of uncorrelated residuals has been relaxed, the firm's proprietary environmental rating models have explanatory power.

Environment Agency Corporate Environmental Governance 29
cost reductions. Such savings are identified as being more difficult to achieve when companies get closer to eliminating pollution, since further reductions will imply rising capital and technology investment.
Environmental event studies showing neutral or negative correlations ‘The Cost of Environmental Protection’ , 2001, Morgenstern; Pizer and Shih, contended that reported expenditures for environmental protection are often cited as an assessment of the burden of current regulatory efforts. However, it also contended that the potential for both incidental savings and uncounted costs means that the actual burden could be either higher or lower than these reported values. In one industry, the authors found statistically significant overstatement of costs. In three others, they found no significant deviation in either direction. One study did sound a cautionary note about the findings of event studies. In ‘Capital Markets and Corporate Environmental Performance: What Does the Empirical Work Tell Us?’, Dinah A. Koehler, 2002, the author found several 'methodological issues serious enough to throw doubt' on event study findings of a strong relationship. The author further argued that 'these findings of a negative [short term] relationship should not matter much to long-term investors,' since studies implying long-term returns are driven not by environmental news, but by factors such as firm size, price/book and P/E ratio, as well as market risk and investor psychology.
Environmental event studies showing positive correlations In ‘Does the Market Value Environmental Performance?’, an academic article by Cohen and Konar, 2001, the authors report on a study relating market value of firms in the S&P500 to objective measures of their environmental performance, and record on pollution in particular. The study concluded that legally emitted toxic chemicals have a significant effect on the intangible asset value of publicly traded companies. A 10% reduction in emissions of toxic chemicals resulted in a GBP£50 million increase in market value. The magnitude of these effects was found to vary across industries, with larger losses accruing to the traditionally polluting industries. In another academic article, ‘Exploring the Locus of Profitable Pollution Reduction’, King and Lennox, 2002, the authors proposed that managers underestimate full value of some means of pollution reduction and so under-exploit these means. Based on evidence from previous studies, they argued that waste prevention often provides unexpected innovation offsets, but that on-site waste treatment often provides unexpected cost. They used statistical methods to test the direction and significance of the relationship between the various means of pollution reduction and profitability. They found strong evidence that waste prevention leads to financial gain, but no evidence that firms profit from reducing pollution by other means. ‘Does it Really Pay to Be Green? Accounting for Strategy Selection in the Relationship Between Environmental and Financial Performance’ also by King and Lennox, 2001, looked at a range of variables, including event analysis. Environmental performance was defined using two variables, one for industry emissions and one for the firm's emissions relative to its industry (data came from the EPA's Toxic Release Inventory). The study found that high emissions were associated with weak financial performance.

Environment Agency Corporate Environmental Governance 30
Case Studies
Objectives and structure Although the literature review sourced 30 company studies, only one of these focused on the performance of a single company. To an extent, this result was anticipated and it is one of the reasons a decision was taken to undertake a separate assessment of the performance of individual companies, using a number of case studies. The case studies are presented in this section of the report. Several studies did provide anecdotal evidence on an aspect of financial performance that an individual company has been able to improve through implementation of an environmental governance measure. Most studies, though, looked at groups of companies in an index, sector or fund, and evaluated them on a comparative basis (according to their status as good or bad environmental performers and any financial impacts that corresponded to such status). In light of this finding from the literature review, it was felt there was a need to try and progress the existing research by taking a systematic approach to the assessment of financial impacts at a number of individual firms. The companies chosen for the individual case studies were selected because, by and large, they have each implemented a different environmental governance measure. This helps to assess whether certain environmental governance measures may have related financial impacts. It also means that the case studies look beyond the impact of a broad environmental strategy, where hitherto the focus of the existing literature appears predominantly to have been. Since the number of sector and fund surveys in the literature review was quite small, case study analyses of sector and fund performance were also undertaken. The table below lists the case studies included in this report (each case study is numbered for ease of reference):
Prior to publication of this report, all companies included in the company profiles section of this report were provided with an opportunity to comment on the analysis and conclusions drawn, as well as to provide any additional, relevant research. The Agency and study authors would like to thank all those companies that responded with comments and further data, which has helped to ensure case study accuracy.

Environment Agency Corporate Environmental Governance 31
1. Fund Case Study – Jupiter Ecology Fund
Growth of 194% since launch. Has out-performed benchmark index in last 5 years
Summary The Fund This fund was the first authorised green unit trust launched in the UK. It is a securities scheme and is an authorized unit trust scheme under section 243 of the Financial Services and Markets Act 2000. The fund is in the ‘Global Growth’ Investment Management Association category and is a qualifying fund for inclusion within the stocks and shares component of an Individual Savings Account (ISA). It is also a qualifying investment for inclusion in a Personal Equity Plan (PEP). The focus is on small-cap stocks. Fund charges; Initial 5%; Annual 1.5%; Spread (Bid/Offer) 6% Fund Facts: Fund Value £124 million; Number of holdings 90; Launch Date 1 April 1988
Background The fund invests in companies worldwide, that are responding positively to and profiting from the challenge of environmental sustainability and that are also making a positive commitment to social well-being. The investment process is based on a combination of environmental and social assessments together with separate financial assessments. There is a strong focus on the environmental policy and management standards of the companies in which the fund invests.
Environmental Governance Measure
Financial Measure
Degree of Correlation
Quantifiable Impact?
Companies only eligible for investment by the fund if they demonstrate high environmental policy and management standards, as well as a positive environmental performance record.
Fund return Strong – environmental governance component of fund is a key investment criterion
Growth of 194% since launch on 1 April 1988. Fund ranked in top half in its sector for performance over last five years. Has clearly out-performed benchmark index in past 6 months and also did so for a three year period November 1999 – November 2002.

Environment Agency Corporate Environmental Governance 32
Environmental governance Investment Objectives • Fund objective and investment policy: to achieve long-term capital appreciation and a growing
income while being consistent with a policy of protecting the environment. The investment policy is to invest in companies worldwide which demonstrate a positive commitment to the long-term protection of the environment.
• Investment criteria: the fund’s environmental and social assessment is supported by in-house research conducted by the Jupiter Environmental Research Unit. Jupiter concentrates on those companies which are developing products and services to solve six specific environmental and social problems: air quality, water quality, waste management, transport, sustainable living and beneficiaries of legislation. The sixth theme looks specifically at those companies that are benefiting from increase environmental legislation.
• Industry and stocks avoided: avoids investment in companies involved in the provision of products and services in the following sectors: armaments, alcoholic drinks, tobacco, pornography, nuclear power, gambling and animal testing. In general the fund will not invest in a company which derives over 10% of its turnover from any one of these activities. Where a company has less than 10% of its turnover associated with these activities, an investment may be considered if it is believed that the company makes an outstanding contribution to sustainable development in other respects.
Research Process • Before a company is deemed eligible for investment, it is assessed through meetings with
management representatives, on-site visits and questionnaires. Information is received from other interested stakeholders including campaign groups, financial analysts and trade bodies.
• Negative screening: companies are investigated to discover if they are involved in activities that conflict with the environmental, social and ethical objectives. If there is concern about companies' involvement in such activities, the fund will not invest in them.
• Positive screening: central to the fund research is positive screening. This involves researching companies to find out if they are actively improving their environmental or social performance. Companies that are making positive progress in these areas are added to the ‘approved list’, from which the funds draw their portfolios. Approval of a company is based either on the beneficial nature of its products or services or the high standard of its environmental and social management processes.
• Best in class: Jupiter compares companies against their competitors in the same stock market sector. This enables ‘best in class’ companies to be identified, in other words, the companies that are acting in a more responsible manner with regard to social and environmental issues than their peers. Best performing companies in each industry sector are added to the Approved List. More than one company in an industry sector may be identified as ‘best in class’.
• Quality assurance: research is cross-checked internally by the Environmental Research Unit and is then reviewed by the Environmental Advisory Committee. Jupiter's Compliance Department also carries out regular checks to ensure that the fund holdings continue to comply with the SRI criteria and similar checks may be carried out by Jupiter’s regulatory body, The Financial Services Authority.

Environment Agency Corporate Environmental Governance 33
Financial impacts
Performance The fund’s five year percentage growth as at 1 March 2004 stood at -2%. Its performance since launch on 1 April 1988 is, however, an impressive 194%. Over a three year period (1999 – 2002) the fund consistently out-performed its benchmark, assisted by its focus on smaller-cap, environmental technology stocks, as shown in figure 7 below.
Figure 7 Five Year Performance Chart for the Jupiter Ecology Fund up to 3 November 2003
Net Asset Values (1999 – 2003) Appetite for the fund can be seen to be strong and increasing, looking at the change in number of units since 1999. Date value of fund value per unit units 31.03.99 £67,212,478 129.80p 51,782,013 31.03.00 £108,052,148 188.69p 57,263,828 31.03.01 £134,737,907 170.80p 78,888,328 31.03.02 £156,175,394 159.93p 97,654,828 31.03.03 £92,287,040 87.53p 105,429,828 30.09.03 £114,259,062 110.17p 103,711,328 31.03.04 £123,357,350 118.93p 103,721,327

Environment Agency Corporate Environmental Governance 34
2. Fund Case Study – Winslow Green Growth Fund
Consistently out-performed its benchmark, over a prolonged period - 18.40% average annual return since inception (to 2003) compared to 3.80% for the Russell 2000 Growth Index
Summary The Fund The Winslow Green Growth Fund is a diversified series of US Forum Funds (the Trust). The Trust is a Delaware business trust registered as an open-end management investment company under the Investment Company Act of 1940, as amended. The Trust currently has twenty series. The fund seeks capital appreciation through environmentally responsible investing and focuses on mid-cap stocks. The Fund started in 1994 as an investment trust and opened to the public in 2001. Fund charges: Initial 0%; Annual 1.45%; Spread (Bid/Offer) 0% (At NAV) Fund facts: Fund Value $32 million; Number of holdings 30-40; Launch date 3 May 1994
Background The fund invests at least 80% of its net assets in equity securities of domestic companies that are either environmentally proactive or environmentally sensitive. Beginning with a universe of 600 small and mid-cap US stocks, the research team for the fund conducts the fundamental analysis stage of the investment process using information from a variety of sources. The research seeks to identify companies with superior products or services; ROE of at least 15% and growing; three year growth rate of at least 20%; a record of successful new product development; a strong or improving balance sheet; and strong management with a well defined strategy. Using internal and external research sources, including national and local environmental agencies, the research team develops and assigns environmental ratings to the companies analysed as part of this process, the results are reviewed annually with management. Environmental Governance Measure
Financial Measure
Degree of Correlation
Quantifiable Impact?
Some of the key assessment criteria include identifying products or services that solve environmental problems; good environmental citizenship; industries with no environmental impact; and leadership in cleaning up historically ‘dirty’ industries.
Fund return Strong – environmental governance component of fund is a key investment criterion
Fund has tended to consistently out-perform its benchmark, over a prolonged period. For the one, three, five year and since inception periods, the average annual returns were 21.10%, -10.87%, 15.74% and 18.40%, respectively, versus 0.69%, -16.66%, -4.25% and 3.80% for the Russell 2000 Growth Index and 1.41%, -1.36%, 3.65% and 10.36% for the Russell 2500 Index.
Environment Agency Corporate Environmental Governance 35
Environmental governance Investment Objectives • Fund objectives and investment policy: to capture the power of ‘green’ investing using an
aggressive growth approach. The fund seeks above-average long-term capital appreciation through environmentally effective investing.
• Investment criteria: using a disciplined screening process that incorporates both environmental and financial analysis, the fund examines a universe of mainly small- and mid-sized US stocks. Winslow creates a portfolio of 30 to 40 stocks that it believes are reasonably priced and show potential for superior growth.
• Winslow recognises that environmental effectiveness can be a leading indicator of management quality. The research process employs a proprietary analytical tool to classify investments in one of four categories: environmentally proactive; environmentally responsible; environmentally benign; best in class
Research Process • The research process consists of three stages: stage 1 applies fundamental analysis to the
universe of approximately 600 small and mid-cap stocks. Stage 2 undertakes the environmental analysis and stage 3 consists of the technical and valuation analysis, resulting in a final portfolio of 30 to 40 stocks.
• The environmental perspective groups green companies into the four basic categories described above. Winslow invests in firms from all four categories and this allows the fund to gain exposure to a wide range of industries and companies, while still focusing on those firms that show outstanding environmental leadership in each industry.
• Environmentally proactive (EP): to be assigned this rating, a company must have products or services that improve environmental conditions or solve environmental problems. EP companies typically embrace measures that exceed regulatory compliance (e.g. ISO certification), and openly disclose the environmental impacts of their operations (e.g. by publishing environmental reports). Industry examples include organic produce, alternative/renewable energy.
• Environmentally responsible (ER): companies in this category have no major environmental controversies pending. Operations comply with existing regulations and companies are working toward open disclosure on the environmental impact of their operations. Industry examples include product manufacturing/distribution, capital goods, technology, communications, healthcare, medical instruments.
• Environmentally benign (EB): this rating is given to companies that operate in an industry that has no substantial environmental challenges or impacts. They provide services, and have no manufacturing operations. Industry examples include financial services, Internet products/services.
• Best in class (BIC): this designation is for companies that have implemented environmental programs that set a standard for their industry sector. These companies are recognised leaders in their sector and contribute to a reduction in pollutant emissions or waste generated. BIC companies are those that exhibit the best environmental performance within their selected industry, and have gone well beyond their peers in reducing their environmental impact. Industry examples include semiconductors, mining.
• Technical and valuation analysis: the final stage of constructing the 30-40 stock portfolio compares companies to their peers using technical data, reviews and analyses trading patterns and liquidity to evaluate entry and exit points. The portfolio looks for attractively priced stocks, PEG ratios lower than that of peer group and finally a reason to confirm the expectation for the stock price to rise.

Environment Agency Corporate Environmental Governance 36
Financial impacts
Performance and Net Asset Values The fund ended the quarter with a net asset value per share of $11.48, up 43.86% for the three months ended June 30, 2003, and up 52.86% for the six months ended June 30, 2003. The Russell 2000 Growth Index, the fund’s primary index, was up 24.15% in the same three month period ended June 30, 2003, while the Russell 2500 Index, the fund’s historical index, was up 21.91%. 1 yr 3 yr 5 yr Since inception Winslow GGF 21.10% -10.87% 15.74% 18.40% Russell 2000 0.69% -16.66% -4.25% 3.80% Russell 2500 1.41% -1.36% 3.65% 10.36%
Table 11 As described in the table above, for the one, three, five year and since inception periods, the fund’s average annual returns were 21.10%, -10.87%, 15.74% and 18.40%, respectively, such that it outperformed the Russell 2000 Growth Index and the Russell 2500 Index. In February 2004 the Fund reported that in the previous twelve months its shares had gained 102%, the top performance in the Bloomberg Responsible Fund Index and 39 percentage points better than the Russell 2000 growth index.
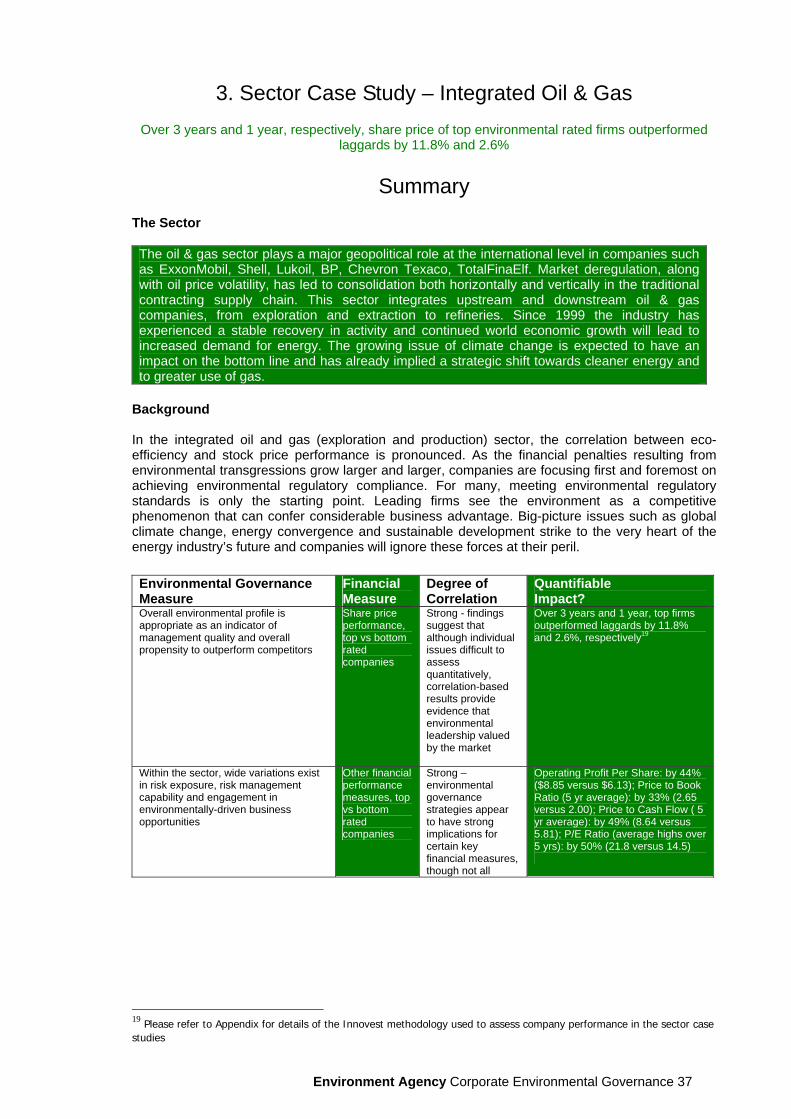
Environment Agency Corporate Environmental Governance 37
3. Sector Case Study – Integrated Oil & Gas
Over 3 years and 1 year, respectively, share price of top environmental rated firms outperformed laggards by 11.8% and 2.6%
Summary The Sector The oil & gas sector plays a major geopolitical role at the international level in companies such as ExxonMobil, Shell, Lukoil, BP, Chevron Texaco, TotalFinaElf. Market deregulation, along with oil price volatility, has led to consolidation both horizontally and vertically in the traditional contracting supply chain. This sector integrates upstream and downstream oil & gas companies, from exploration and extraction to refineries. Since 1999 the industry has experienced a stable recovery in activity and continued world economic growth will lead to increased demand for energy. The growing issue of climate change is expected to have an impact on the bottom line and has already implied a strategic shift towards cleaner energy and to greater use of gas.
Background In the integrated oil and gas (exploration and production) sector, the correlation between eco-efficiency and stock price performance is pronounced. As the financial penalties resulting from environmental transgressions grow larger and larger, companies are focusing first and foremost on achieving environmental regulatory compliance. For many, meeting environmental regulatory standards is only the starting point. Leading firms see the environment as a competitive phenomenon that can confer considerable business advantage. Big-picture issues such as global climate change, energy convergence and sustainable development strike to the very heart of the energy industry’s future and companies will ignore these forces at their peril. Environmental Governance Measure
Financial Measure
Degree of Correlation
Quantifiable Impact?
Overall environmental profile is appropriate as an indicator of management quality and overall propensity to outperform competitors
Share price performance, top vs bottom rated companies
Strong - findings suggest that although individual issues difficult to assess quantitatively, correlation-based results provide evidence that environmental leadership valued by the market
Over 3 years and 1 year, top firms outperformed laggards by 11.8% and 2.6%, respectively19
Within the sector, wide variations exist in risk exposure, risk management capability and engagement in environmentally-driven business opportunities
Other financial performance measures, top vs bottom rated companies
Strong – environmental governance strategies appear to have strong implications for certain key financial measures, though not all
Operating Profit Per Share: by 44% ($8.85 versus $6.13); Price to Book Ratio (5 yr average): by 33% (2.65 versus 2.00); Price to Cash Flow ( 5 yr average): by 49% (8.64 versus 5.81); P/E Ratio (average highs over 5 yrs): by 50% (21.8 versus 14.5)
19 Please refer to Appendix for details of the Innovest methodology used to assess company performance in the sector case studies
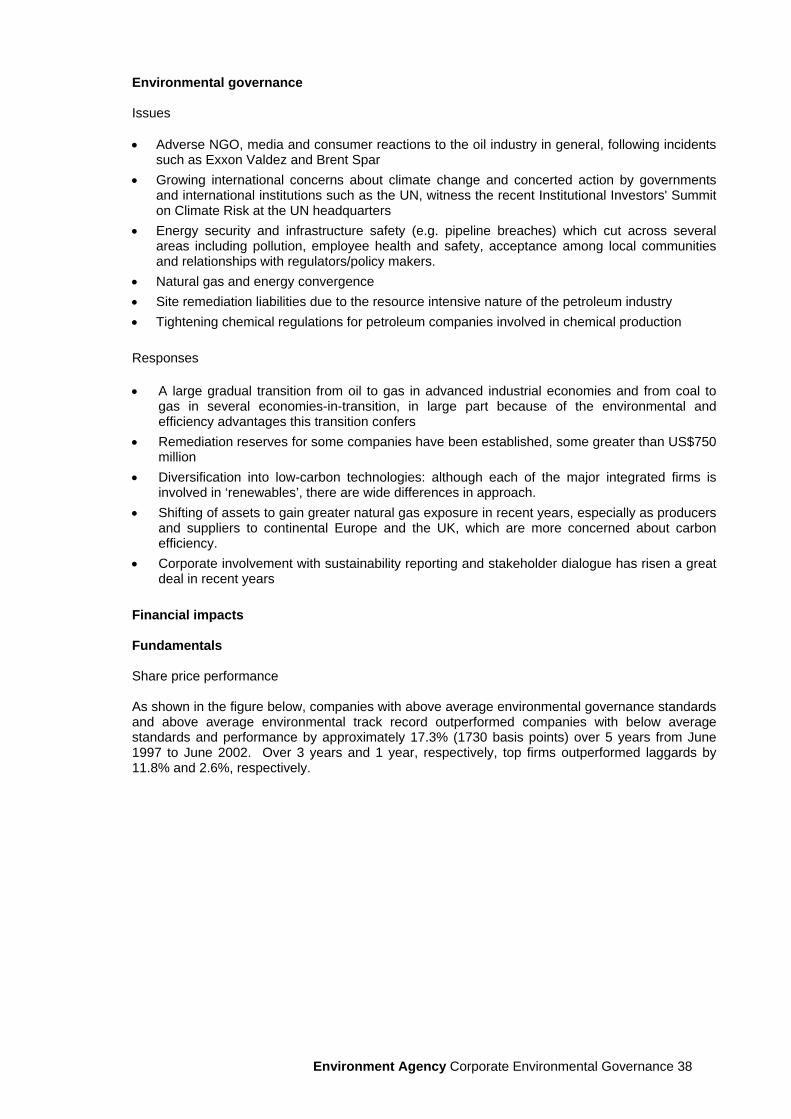
Environment Agency Corporate Environmental Governance 38
Environmental governance Issues • Adverse NGO, media and consumer reactions to the oil industry in general, following incidents
such as Exxon Valdez and Brent Spar • Growing international concerns about climate change and concerted action by governments
and international institutions such as the UN, witness the recent Institutional Investors' Summit on Climate Risk at the UN headquarters
• Energy security and infrastructure safety (e.g. pipeline breaches) which cut across several areas including pollution, employee health and safety, acceptance among local communities and relationships with regulators/policy makers.
• Natural gas and energy convergence • Site remediation liabilities due to the resource intensive nature of the petroleum industry • Tightening chemical regulations for petroleum companies involved in chemical production Responses • A large gradual transition from oil to gas in advanced industrial economies and from coal to
gas in several economies-in-transition, in large part because of the environmental and efficiency advantages this transition confers
• Remediation reserves for some companies have been established, some greater than US$750 million
• Diversification into low-carbon technologies: although each of the major integrated firms is involved in ‘renewables’, there are wide differences in approach.
• Shifting of assets to gain greater natural gas exposure in recent years, especially as producers and suppliers to continental Europe and the UK, which are more concerned about carbon efficiency.
• Corporate involvement with sustainability reporting and stakeholder dialogue has risen a great deal in recent years
Financial impacts
Fundamentals Share price performance As shown in the figure below, companies with above average environmental governance standards and above average environmental track record outperformed companies with below average standards and performance by approximately 17.3% (1730 basis points) over 5 years from June 1997 to June 2002. Over 3 years and 1 year, respectively, top firms outperformed laggards by 11.8% and 2.6%, respectively.

Environment Agency Corporate Environmental Governance 39
Figure 11
Percentage Change in Total Return of Environmental Leaders v Laggards in the Integrated Oil & Gas Sector 1997 – 2002
NB Figures and results based on Innovest proprietary ratings of above and below average performers
Integrated Oil & Gas Company Rankings
Company Ranking Amerada Hess Top Tier BP Top Tier RD/Shell Top Tier Norsk Hyrdo Top Tier Suncor Top Tier ExxonMobil Top Tier Chevron Texaco Middle Tier ENI Middle Tier PetroCanada Middle Tier Phillips Petroleum Middle Tier TotalFinaElf Middle Tier Repsol-YPF Middle Tier Imperial Oil Bottom Tier Lukoil Bottom Tier Occidental Petroleum Bottom Tier Marathon Bottom Tier Conoco Bottom Tier
Table 12 Based on Innovest proprietary ratings
Other financial metrics Top performing stocks, in terms of overall environmental governance and environmental track record, also posted superior results over low scoring companies in various business performance and market valuation ratios: • Operating Profit Per Share; by 44% ($8.85 versus $6.13)
• Price to Book Ratio (5 yr average); by 33% (2.65 versus 2.00)
• Price to Cash Flow ( 5 yr average); by 49% (8.64 versus 5.81)
• P/E Ratio (average highs over 5 yrs); by 50% (21.8 versus 14.5)
Environmental Leaders
Environmental Laggards
-30%
-20%
-10%
0%
10%
20%
30%
40%
50%
60%
70%
Jun1
997
Sep
1997
Dec
1997
Mar
1998
Jun1
998
Sep
1998
Dec
1998
Mar
1999
Jun1
999
Sep
1999
Dec
1999
Mar
2000
Jun2
000
Sep
2000
Dec
2000
Mar
2001
Jun2
001
Sep
2001
Dec
2001
Mar
2002
Jun2
002
Tota
l Ret
urn
Difference Top Half EV 21 Avg. Bottom Half EV 21 Avg.

Environment Agency Corporate Environmental Governance 40
But not with any discernable pattern in terms of:
• Return on Assets (5 yr average)
• Return on Equity Per Share; top firms underperformed laggards by 26%
• Return on Equity (average over 3 yrs); by 34%
Intangibles Corporate reputation Firms realise that their franchise value, license to operate, brand, reputation is a critical component of the overall value and a key determinant of shareholder return. And few issues can damage that value faster than being involved in a major oil spill or becoming embroiled in a controversial drilling project. For multinational corporations, particularly those in the resource sectors, operations around sensitive or controversial sites can be a key determinant of reputation and, by extension, the creation and erosion of intangible value. Many companies within the oil and gas sector have experienced significant negative public relations and financial pressure from shareholders over sensitive site issues. With companies pushing more and more to explore in remote and ecologically sensitive places, the risk of brand-damaging incidents occurring is heightening rapidly. Competitive advantage Despite short-term fluctuations in price, natural gas will be the fuel of choice in advanced industrial economies in large part because of the environmental and efficiency advantages it confers. A gradual transition has also begun to take place from coal to gas in several large economies-in-transition in part because of environmental concerns, and it seems unlikely that this trend will be reversed. Technological advancements are also making it increasingly more economical to transport natural gas rather than flare it off. Companies with strong strategic interests in natural gas, with the capability to commercialize gas assets using gas to liquids technology, and with an involvement in liquefied natural gas production are likely to gain competitive advantage. In the downstream business, where product differentiation can be tough, and where the ability to take advantage of price premiums at the pump is unrealistic, brand equity shows through in the preference or attitude of customers, which affects their loyalty and in turn the company’s market share. New markets The involvement of oil and gas companies in renewable energy technologies continues to be a high-profile aspect of corporate strategy and one that creates marked distinctions between the firms covered in this study. In distinguishing between companies on the renewables and energy technology issue, resources devoted towards technology development were examined as well as the strength of partnerships, type of technology and state of commercialization, product or prototype demonstrations and, where possible, product orders. Similar to renewables, the development of fuel cells is a long term issue which can also add value in the short run. All of the companies with downstream exposure have been engaged in clean fuel development to one extent or another, primarily due to regulatory pressures. Some firms are going beyond what is required by law to take a technology leadership position in fuel cell and engine technology, and position themselves for what has been termed the Hydrogen Future. Gaining access to new geographical areas of exploitation is one issue where good reputation, in-depth stakeholder relationship (local communities and public entities) and real environmental concerns can translate directly into fresh revenue. Continued access to new leases is also becoming more closely linked to a company’s skill in overcoming environmental regulatory hurdles, as developments in the UK indicate. Speaking recently, UK Energy Minister Peter Hain said in connection with the tough new environmental controls on oil and gas drilling around Britain's coasts that firms would be awarded licenses to explore the sea bed only if they can prove they will minimize the effect on natural habitats.

Environment Agency Corporate Environmental Governance 41
Operational efficiency A company’s performance in managing its emissions, complying with local regulations and avoiding major incidents such as spills and refinery accidents can be a useful barometer of management quality and commitment to operating excellence. Consistently good performance not only indicates that a company is well run, but that it can also eliminate unnecessary operating expenditures and so enhance profitability. The firms surveyed here were examined on the basis of normalized performance in air emissions, spills and regulatory compliance, and waste generation (hazardous and non-hazardous). The energy-intensive nature of oil and gas operations places a premium on the ability to conserve resources and pursue a more integrated energy management strategy. Companies can generate substantial reductions in operating costs through better conservation of resources, although the extent to which firms quantify the financial benefits is still limited. Although access to data is patchy, this study benchmarked the oil and gas firms according to efficiency in water usage, waste generation, flaring emissions and energy intensity. Appendix – summary of financial impacts identified
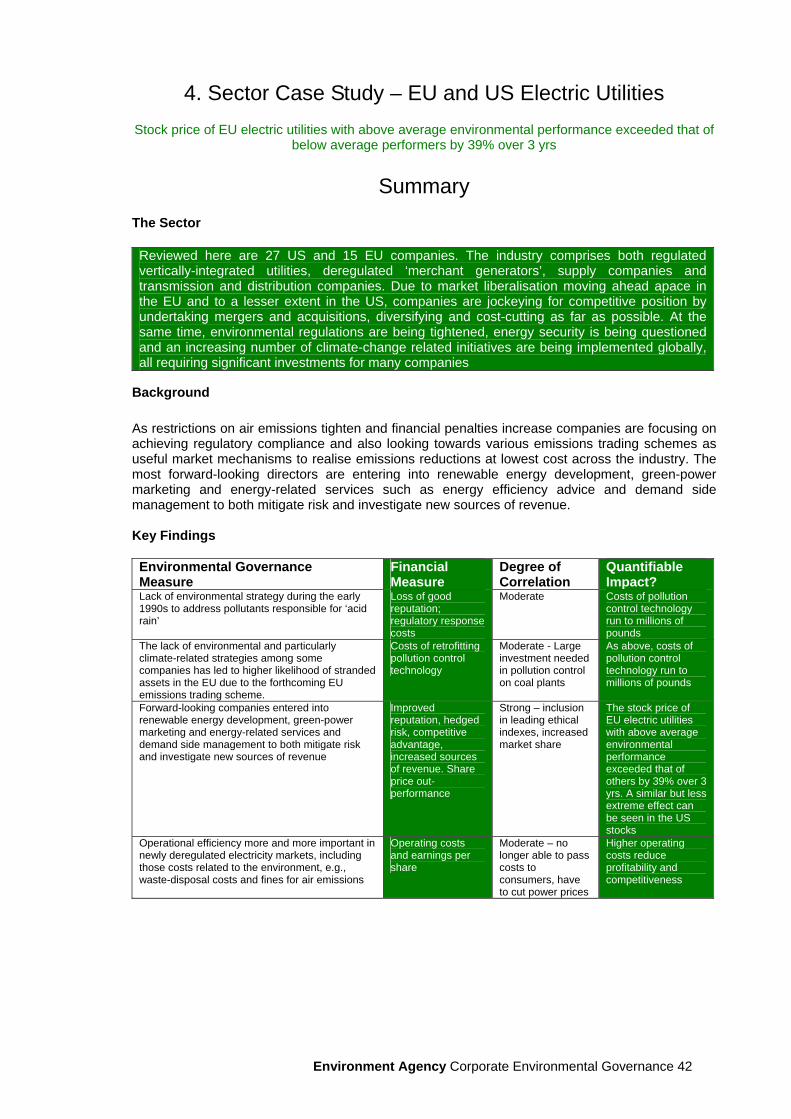
Environment Agency Corporate Environmental Governance 42
4. Sector Case Study – EU and US Electric Utilities
Stock price of EU electric utilities with above average environmental performance exceeded that of below average performers by 39% over 3 yrs
Summary
The Sector Reviewed here are 27 US and 15 EU companies. The industry comprises both regulated vertically-integrated utilities, deregulated ‘merchant generators’, supply companies and transmission and distribution companies. Due to market liberalisation moving ahead apace in the EU and to a lesser extent in the US, companies are jockeying for competitive position by undertaking mergers and acquisitions, diversifying and cost-cutting as far as possible. At the same time, environmental regulations are being tightened, energy security is being questioned and an increasing number of climate-change related initiatives are being implemented globally, all requiring significant investments for many companies
Background As restrictions on air emissions tighten and financial penalties increase companies are focusing on achieving regulatory compliance and also looking towards various emissions trading schemes as useful market mechanisms to realise emissions reductions at lowest cost across the industry. The most forward-looking directors are entering into renewable energy development, green-power marketing and energy-related services such as energy efficiency advice and demand side management to both mitigate risk and investigate new sources of revenue. Key Findings Environmental Governance Measure
Financial Measure
Degree of Correlation
Quantifiable Impact?
Lack of environmental strategy during the early 1990s to address pollutants responsible for ‘acid rain’
Loss of good reputation; regulatory response costs
Moderate Costs of pollution control technology run to millions of pounds
The lack of environmental and particularly climate-related strategies among some companies has led to higher likelihood of stranded assets in the EU due to the forthcoming EU emissions trading scheme.
Costs of retrofitting pollution control technology
Moderate - Large investment needed in pollution control on coal plants
As above, costs of pollution control technology run to millions of pounds
Forward-looking companies entered into renewable energy development, green-power marketing and energy-related services and demand side management to both mitigate risk and investigate new sources of revenue
Improved reputation, hedged risk, competitive advantage, increased sources of revenue. Share price out-performance
Strong – inclusion in leading ethical indexes, increased market share
The stock price of EU electric utilities with above average environmental performance exceeded that of others by 39% over 3 yrs. A similar but less extreme effect can be seen in the US stocks
Operational efficiency more and more important in newly deregulated electricity markets, including those costs related to the environment, e.g., waste-disposal costs and fines for air emissions
Operating costs and earnings per share
Moderate – no longer able to pass costs to consumers, have to cut power prices
Higher operating costs reduce profitability and competitiveness

Environment Agency Corporate Environmental Governance 43
Environmental governance Issues • Significant growth in societal concerns about air emissions from power plants such as SO2,
NOx, particulates and mercury and the links to increased relative mortality risks as well as the damage to forest soils and freshwater and coastal ecosystems through acidification.
• Increasing evidence of global climate change and its various negative impacts has precipitated concerted action to tackle the issue on the part of governments and international institutions; as major CO2 emitters and large stationary sources, electric utilities are now under a significant amount of pressure to curb emissions.
• Governments, NGOs, the public and markets are all pushing electric utilities to provide more environmentally-responsible products and services, e.g., electricity produced by renewable sources as well as energy management services to increase energy efficiency, partly to combat climate change, partly to prevent harmful air emissions and partly as a response to energy security concerns.
• Market deregulation and restructuring intended to boost competitiveness and thereby reduce costs for consumers has given rise to escalating competitiveness, a lack of transparency in corporate governance as illustrated by the Enron scandal and the Californian energy crisis and significant reductions in maintenance work and investment in pollution-prevention technologies.
• The highly publicised accidents at Three Mile Island and Chernobyl heightened safety concerns during the 1980s and the ongoing global debates over the reprocessing and long-term storage and containment of high-level radioactive waste has done nothing to raise public confidence in the nuclear industry. Italy shut down its nuclear reactors a year after the Chernobyl disaster and Germany is planning to phase out nuclear power in the generation mix over the next two decades.
• A significant amount of contamination of subsurface soil and groundwater has been caused by leachate from coal piles and ash landfills, fuel oil leaks and spills at power plants and emissions from waste-water treatment facilities, cooling water systems and holding ponds as well as PCB contaminates from transformers. In the US, land remediation costs can range into millions of dollars per site, e.g., the Superfund sites. Even hydroelectric power can threaten particular ecosystems as dams alter the hydrology and sediment-loads of rivers.
• Lack of energy security and infrastructure investment have become major issues, particularly in the US following a massive power-cut in August 2003, affecting 50 million people in seven states and Canada. Several countries in the EU have also experienced extensive power-cuts. The North American Electric Reliability Council (NERC) reported that power deals that could not be fulfilled due to transmission constraints increased five-fold to nearly 1,500 instances in 2002 compared to 300 in 1998 and transmission investment has fallen from about US$5bn in 1975 to US$2bn in 2000 (in 1997 dollars) according to the EEI.
Responses • At the plants of the leading environmental performers, air emissions reductions have gone
beyond increasing regulatory requirements in the EU and US (upcoming legislation - Large Combustion Plants Directive and the Clear Skies Initiative).
• Most electric utilities now agree on the need to address potential consequences of climate change. Several leading companies in the US electric utility sector are proactively pursuing voluntary CO2 emissions reductions programs and nearly all endorse emissions trading schemes and credit for early action to reduce emissions. In the EU, the development of market mechanisms to combat climate change is well advanced, e.g., the European Emissions Trading System (ETS) scheduled to start in 2005, and corporate strategies to deal with this are beginning to emerge.
• Growing pressures from regulators, consumers and shareholders for more environmentally-favourable products, services and corporate policies have made several dormant business opportunities more attractive, including energy management services, green power marketing in liberalised markets and renewable energy distributed generation development.
• The transition to open markets has demanded that companies strengthen their ability to attract and retain customers who can now choose between various suppliers, restructure their organisation, explore diverse markets for expansion, and probably most importantly, to internalise certain costs for the first time. Leaders demonstrate strong senior management

Environment Agency Corporate Environmental Governance 44
commitment to environmental excellence, integrate environmental issues into their overall business strategies and pro-actively reduce emissions and wastes to cut costs. Renewable energy and distributed generation technologies as described above have the potential to gain significant market share in a deregulated energy services market.
• The nuclear industry is putting pressure on governments and relevant agencies in the US and EU to fulfil their commitments and provide long-term repositories for high-level nuclear waste to allay public concerns and perhaps allow the industry to commence construction of new plant. The industry is also often quick to play its card of zero-emissions energy and the undisputed benefits of that given the climate change debate.
• For a consistently reliable supply of electricity in the US particularly, some utilities will have to make significant investments to upgrade the system.
• Almost all the large companies in this sector have implemented environmental management systems and business strategies that oversee the issues discussed above. Leading beyond-compliance programs typically include the use of scenario analysis to assess current and future market and regulatory forces impacting the company, implementation of annual quantitative targets, tracking of a wide range of environmental performance metrics and environmental accounting.
Financial impacts
Fundamentals Share price performance The stock prices of EU electric utilities with above average environmental governance standards outperformed those of below average companies by 39.3% (3930 basis points) over 3 years from July 2000 to July 2003. Over 2 years and 1 year, respectively, top firms outperformed laggards by 35.8% and 24.8%, respectively.

Environment Agency Corporate Environmental Governance 45
Figure 12
Percentage Change in Total Return of Environmental Leaders v Laggards in the EU Electric Utilities Sector 2000 – 2003
-60%
-40%
-20%
0%
20%
40%
60%
Jul2
000
Oct
2000
Jan2
001
Apr2
001
Jul2
001
Oct
2001
Jan2
002
Apr2
002
Jul2
002
Oct
2002
Jan2
003
Apr2
003
Jul2
003
Tota
l Ret
urn
DifferenceAbove Average Environmental PerformanceBelow Average Environmental Performance
NB Figures and results based on Innovest proprietary ratings of above and below average performers
EU electric utility company ratings
Company Ranking
Electricidade de Portugal, SA Top Tier Iberdrola SA Top Tier National Grid Transco plc Top Tier Scottish and Southern Energy plc Top Tier Scottish Power plc Top Tier TransAlta Corporation Top Tier Viridian Group plc Top Tier Endesa SA Middle Tier International Power plc Middle Tier Union Electrica Fenosa Middle Tier British Energy plc Bottom Tier E.ON AG Bottom Tier Electrabel SA Bottom Tier Enel spa Bottom Tier RWE AG Bottom Tier
Table 13 Based on Innovest proprietary ratings
The stock price performance of the top and bottom environmental performers in the US electricity sector demonstrates the same pattern.

Environment Agency Corporate Environmental Governance 46
Figure 13 Percentage Change in Total Return of Environmental Leaders v Laggards in the US Electric
Utilities Sector 2000 - 2003
-20%
0%
20%
40%
60%
80%
100%
Feb1
999
Apr
1999
Jun1
999
Aug
1999
Oct
1999
Dec
1999
Feb2
000
Apr
2000
Jun2
000
Aug
2000
Oct
2000
Dec
2000
Feb2
001
Apr
2001
Jun2
001
Aug
2001
Oct
2001
Dec
2001
Feb2
002
Difference Top Half Average Bottom Half Average
NB Figures and results based on Innovest proprietary ratings of above and below average performers
US electric utility company rankings Company Rating
Calpine Corp. Top Tier Consolidated Edison Inc Top Tier DTE Energy Company Top Tier Duke Energy Corp. Top Tier FPL Group Top Tier Pinnacle West Capital Corp. Top Tier PPL Corp. Top Tier Public Service Enterprise Group Top Tier TXU US Holdings Company Top Tier AES Corp. Middle Tier Centerpoint Energy Inc Middle Tier Constellation Energy Middle Tier Edison International Inc Middle Tier Entergy Corp. Middle Tier Exelon Middle Tier Southern Company Middle Tier Xcel Energy Inc Middle Tier Allegheny Energy Inc Bottom Tier Ameren Bottom Tier American Electric Power Co. Inc Bottom Tier Cinergy Corp. Bottom Tier CMS Energy Corp. Bottom Tier Dominion Resources Bottom Tier Firstenergy Corp. Bottom Tier Progress Energy Inc Bottom Tier Teco Energy Inc Bottom Tier
Table 14 Based on Innovest proprietary ratings
Difference Env’al Leaders Env’al Laggards

Environment Agency Corporate Environmental Governance 47
Other financial metrics In the EU, the top performing stocks, in terms of overall environmental governance and environmental track record, also posted superior results over low scoring companies in various business performance and market valuation ratios: • Operating Margin, 15.8% vs. 7.8%
• Return on Equity, 16.9% vs. 11.2%
• Return on Assets, 3.6% vs. (20.5%)
• Price/Earnings Ratio, 21.2 vs. 8.9
• Price/Book Ratio, 2.0 vs. 1.7
Intangibles Corporate reputation Many firms now consider that their reputation is a critical component of their overall value and a key determinant of shareholder return. To be the cause of major price-hikes due to unreliable supply or dubious energy trading, power-outages, either serious individual air pollution incidents or ongoing chronic pollution, or to be involved in controversial nuclear waste management issues have all been shown to be damaging to a utility or generator’s reputation. To minimize their risks, companies have become more sensitive to site issues, developed their stakeholder engagement and communications programs and improved their overall environmental performance, particularly engaging with governments and industry groups to hammer out acceptable compromises over market mechanisms used to combat climate change. There is growing awareness among shareholders of the impact of environmental performance and related corporate governance issues on financial value. While environmental disclosure requirements have existed since 1970, widespread allegations of accounting irregularities and fraud together have placed unprecedented pressure on regulatory bodies to more strongly enforce them and avoid underreporting practices through accounting loopholes. Shareholders are becoming more activist, too. In April 2003, shareholders representing 27% of AEP’s shares supported a resolution requiring the company to assess climate change related risks and opportunities as well as to disclose its mitigation strategy. During 2003, 23% of Southern Company’s shareholders voted on a resolution that would require the company to analyze the financial risks of how it deals with climate change issues. Competitive advantage Companies with a low emissions asset base of efficient combined cycle gas turbines and renewable energy sources are likely to gain competitive advantage and avoid stranded assets due to the expense of upgrading old plant to meet new regulatory requirements currently being implemented in the EU and planned in the US. To reduce greenhouse gas emissions in line with the EU emissions trading scheme, for example, companies can either purchase emission credits or reduce their needs for additional emission credits and save money by introducing internal reduction measures e.g. efficiency improvements or fuel-switching, as well as using the project-based mechanisms such as energy conservation or reforestation projects. The most proactive US companies continue moving beyond regulation by setting CO2 emissions reductions targets and monitoring progress, monetizing external impact of fossil fuel generation and working with regulatory and industry bodies to develop beneficial legislation. Related greenhouse gas reduction programs include fossil efficiency improvements, fuel switching to natural gas or renewable energy, energy conservation, renewable energy development, nuclear generation, and reclamation of SF6 gases. New markets The involvement of electric utility companies in renewable energy technologies, distributed generation and energy management services continues to be a significant and growing aspect of corporate strategy given the increasing importance of climate change on the international agenda

Environment Agency Corporate Environmental Governance 48
and one that creates marked distinctions between the firms covered in this study. Similarly to ‘renewables’, the development of fuel cells and micro combined heat and power units may also add value in the medium-term, by allowing electric utilities to provide some services in distributed generation and offsetting the loss in sales through central generation and transmission. Operational efficiency A company’s performance in managing its emissions and wastes, complying with local environmental regulations and supporting international initiatives such as those surrounding climate change can be a useful barometer of management quality and commitment to operating excellence. The resource-intensive nature of electricity-generation as well as the risks attached to the resulting emissions places a premium on the ability to conserve resources and promote energy management strategies to consumers. Companies can generate substantial reductions in operating costs although the extent to which firms quantify the financial benefits is still limited. Appendix – summary of financial impacts identified
Environment Agency Corporate Environmental Governance 49
5. Sector Case Study – Forest & Paper Products
Companies with above average environmental governance standards and environmental track record outperformed companies with below average ratings by over 43% in four years
Summary The Sector The paper & forest products industry ranks as one of the world's most important sectors both from an economic and an ecological perspective. It represents close to 3% of the world's gross economic output. The forests upon which it depends are among the most critical ecosystems for the health of the planet and for human well being. The size of the industry, its links to the rest of the world economy, and the importance of its resource base make it a target of intense public scrutiny and government regulation. Since 1980, world paper production has increased by 72% to almost 310 million tons and is forecasted to grow to 400 million tons by 2010. Global paper production is currently dominated by North America (33%), Asia (30%) and Western Europe (27%). Total world exports of pulp and paper products amounted to 131 million tons in 2001 (almost 27% of world’s total production). Background Paper & forest products companies have implemented a variety of approaches to reduce their environmental risk exposures and improve risk management capacity. Leading firms are capitalizing on environmentally- driven business opportunities created by improved corporate environmental performance. A company’s capacity to manage environmental issues has strong implications for stock price performance, but management capacity is not always captured by conventional analytical methods. In the paper & forests products sector, the correlation between eco-efficiency and stock price performance is pronounced. These correlation-based results provide strong evidence of the financial merits of environmental leadership to the value placed by the market on the shares of top performing firms. Environmental Governance Measure
Financial Measure
Degree of Correlation
Quantifiable Impact?
Overall environmental profile is appropriate as an indicator of management quality and overall propensity to outperform competitors
Share price performance, top vs. bottom rated companies
Strong - findings suggest that although individual issues difficult to assess quantitatively, correlation-based results provide evidence that environmental leadership is valued by the market
Companies with above average environmental governance standards and above average environmental track record financially outperformed companies with below average ratings by more than 43% over the four years from March 1999 to March 2003.
Within the sector, wide variations exist in risk exposure, risk management capability and engagement in environmentally-driven business opportunities
Other financial performance measures, top vs. bottom rated companies
Strong – environmental governance strategies appear to have strong implications for certain key financial measures, though not all.
Operating Profit Margin, 14.8% versus 5.0%; Net Profit Margin, 3.7% versus 1.2%; Return on Equity, 3.2% versus 1.1%; Return on Assets, 1.6% versus 0.8%; Price/Earnings Ratio, 24.4 versus (19.8); Total Return – 5 Years, 21.5% versus 0.4%
Environmental governance Issues • Worldwide regulations to protect forest resources – For example, in 1997 Brazil introduced a
moratorium on mahogany logging and California and Oregon have introduced restrictive measures to protect ecosystems. International efforts towards forest preservation come from the World Bank, United Nations and International Monetary Fund. Climate change concerns have

Environment Agency Corporate Environmental Governance 50
also created increased demands for forest preservation – the World Resources Institute has implemented a satellite logging system to check logging operations worldwide.
• Increased pressure from NGOs and consumers demanding that companies have stronger environmental commitments and implement corporate social responsibility have, for some time, been important considerations for paper & forest products companies competing in the global market.
• Environmental groups have been expanding their coverage, consistently raising the environmental expectations of consumers in emerging markets.
• Increasing consumer demand for certified forest products (CFPs) labels demonstrating that products come from forests that meet, in a verifiable manner, standards for SFM.
• As awareness heightens over the protection of natural resources, public procurement and business-to-business markets are setting up market standards that make it appealing for companies to compete with eco-labels. There is a strong demand for CFPs in several European countries, and many governments have taken action to implement ‘green’ public procurement policies that favor CFPs.
• The emergence of buyers groups to pressure forest products companies to significantly expand the supply of (Forestry Stewardship Council) FSC-certified products.
• The sector has faced mounting environmental constraints and increasingly stringent regulations due to the rising standards by governments and the public aiming to minimize chemical discharges to air and water. New regulations worldwide have required sector companies to make substantial investments to minimize negative impacts.
• The management of hazardous releases represents the largest environmental liability in the sector in economic terms, as demonstrated by fines, litigations, disposal costs and potential product phase-out.
• The substitution of recycled fiber for virgin fiber has been increasing all over the world for both environmental and financial reasons. Legislation in several nations requires that some paper products contain a specified minimum recycled content. Solid waste concerns have also forced governments to adopt laws that promote recycling and programs that lower the amount of materials used in packaging.
Responses • In order to counteract negative effects on reputation and profitability, leading companies have
backed up sound environmental management policies with third-party verified environmental management systems (EMS). They also have improved oversight of operations and their effects on the environment through re-structuring corporate governance.
• To address environmental challenges and improve their reputations, efficient strategies to cope with environmental issues are becoming crucial elements of corporate business development plans. Leaders in the sector have beyond-compliance strategies, have demonstrated innovative approaches in dealing with environment-related risks especially chemical discharges to air and water, and have implemented strategies to improve their resource and energy efficiency.
• Companies have engaged in certification practices in response to pressure from governments, buyers groups and consumers who require certified products. North European companies have been endorsing the FSC scheme, reputed to be the most comprehensive set of guidelines. Other certification schemes include the Pan-European Forest Certification system, the Sustainable Forestry Initiative (US) and the Canadian Standard Association system.
• Paper & forest products companies have strategically invested in technology to upgrade processing lines according to domestic regulatory constraints and international standards and to create solutions (i.e. new products) to meet the environmental demands of their customers.
• Proactive firms have found opportunities in environmental pressures, developing alternative means of product manufacturing by using different materials and adapting production processes, going beyond minimal adaptation techniques focused on compliance. Profit generation results from opportunities created by environmentally oriented consumers
• Driven by governments’ environmental protection efforts and by the reduced availability of virgin wood fiber, the forest products industry worldwide has invested in product technology and product stewardship, to improve the range of recyclable materials and dramatically increase its use of recycled fibers.
• In the wood products area, the need for replacement sources of timber has spurred the birth of the engineered wood products industry. Many mills that don’t have access to enough old-growth timber to make products like lumber and plywood have decided to manufacture engineered wood products instead. These engineered products are made from wood residue
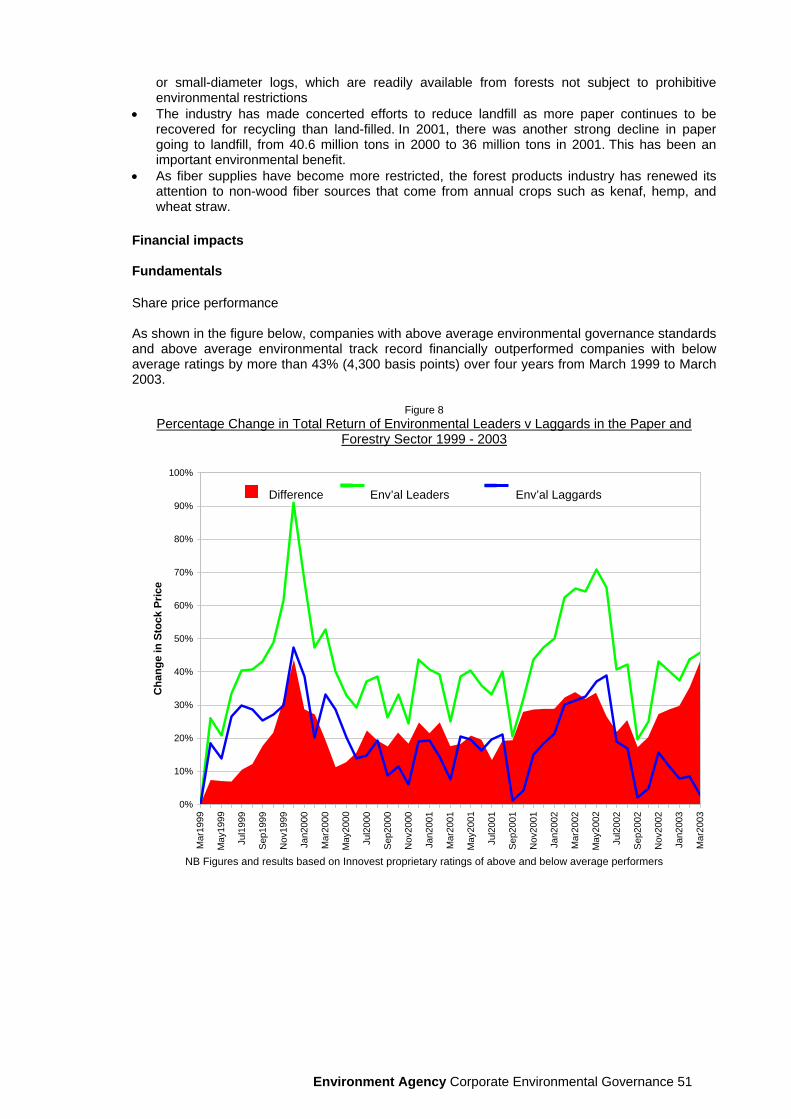
Environment Agency Corporate Environmental Governance 51
or small-diameter logs, which are readily available from forests not subject to prohibitive environmental restrictions
• The industry has made concerted efforts to reduce landfill as more paper continues to be recovered for recycling than land-filled. In 2001, there was another strong decline in paper going to landfill, from 40.6 million tons in 2000 to 36 million tons in 2001. This has been an important environmental benefit.
• As fiber supplies have become more restricted, the forest products industry has renewed its attention to non-wood fiber sources that come from annual crops such as kenaf, hemp, and wheat straw.
Financial impacts
Fundamentals Share price performance As shown in the figure below, companies with above average environmental governance standards and above average environmental track record financially outperformed companies with below average ratings by more than 43% (4,300 basis points) over four years from March 1999 to March 2003.
Figure 8 Percentage Change in Total Return of Environmental Leaders v Laggards in the Paper and
Forestry Sector 1999 - 2003
0%
10%
20%
30%
40%
50%
60%
70%
80%
90%
100%
Mar
1999
May
1999
Jul1
999
Sep
1999
Nov
1999
Jan2
000
Mar
2000
May
2000
Jul2
000
Sep
2000
Nov
2000
Jan2
001
Mar
2001
May
2001
Jul2
001
Sep
2001
Nov
2001
Jan2
002
Mar
2002
May
2002
Jul2
002
Sep
2002
Nov
2002
Jan2
003
Mar
2003
Cha
nge
in S
tock
Pric
e
Difference Top Half EV 21 Avg. Bottom Half EV 21 Avg.
NB Figures and results based on Innovest proprietary ratings of above and below average performers
Difference Env’al Leaders Env’al Laggards
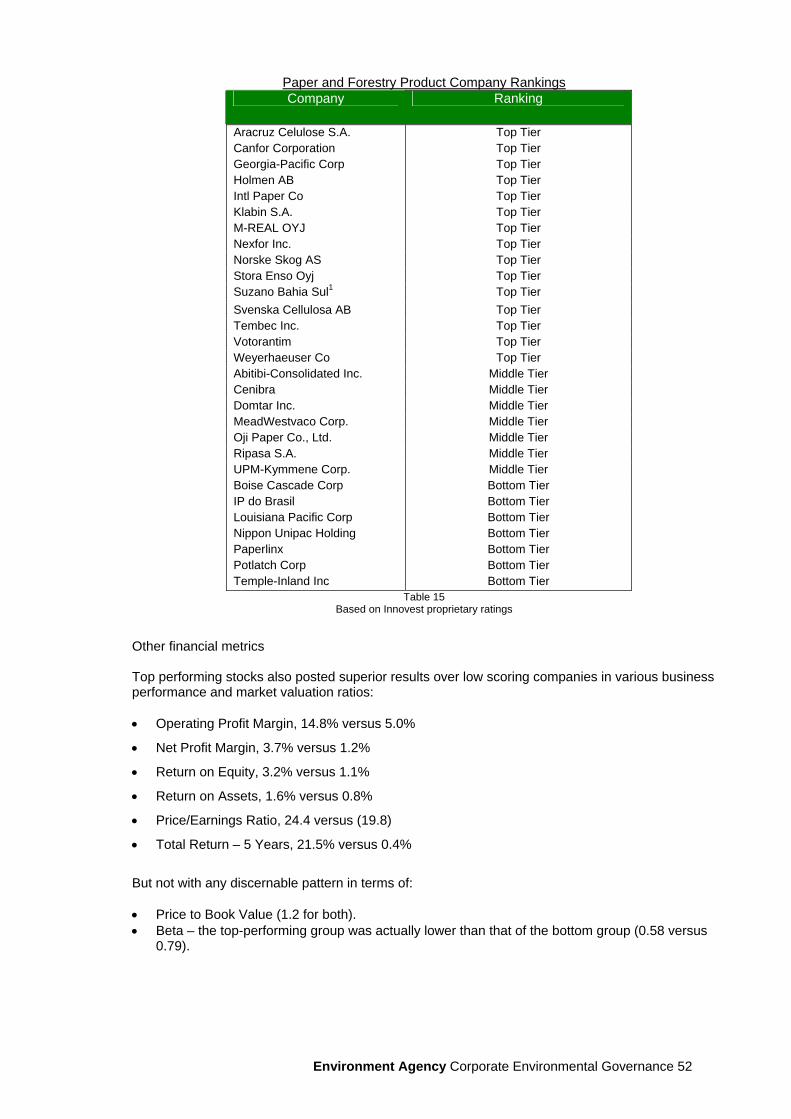
Environment Agency Corporate Environmental Governance 52
Paper and Forestry Product Company Rankings Company Ranking
Aracruz Celulose S.A. Top Tier Canfor Corporation Top Tier Georgia-Pacific Corp Top Tier Holmen AB Top Tier Intl Paper Co Top Tier Klabin S.A. Top Tier M-REAL OYJ Top Tier Nexfor Inc. Top Tier Norske Skog AS Top Tier Stora Enso Oyj Top Tier Suzano Bahia Sul1 Top Tier Svenska Cellulosa AB Top Tier Tembec Inc. Top Tier Votorantim Top Tier Weyerhaeuser Co Top Tier Abitibi-Consolidated Inc. Middle Tier Cenibra Middle Tier Domtar Inc. Middle Tier MeadWestvaco Corp. Middle Tier Oji Paper Co., Ltd. Middle Tier Ripasa S.A. Middle Tier UPM-Kymmene Corp. Middle Tier Boise Cascade Corp Bottom Tier IP do Brasil Bottom Tier Louisiana Pacific Corp Bottom Tier Nippon Unipac Holding Bottom Tier Paperlinx Bottom Tier Potlatch Corp Bottom Tier Temple-Inland Inc Bottom Tier
Table 15 Based on Innovest proprietary ratings
Other financial metrics Top performing stocks also posted superior results over low scoring companies in various business performance and market valuation ratios: • Operating Profit Margin, 14.8% versus 5.0%
• Net Profit Margin, 3.7% versus 1.2%
• Return on Equity, 3.2% versus 1.1%
• Return on Assets, 1.6% versus 0.8%
• Price/Earnings Ratio, 24.4 versus (19.8)
• Total Return – 5 Years, 21.5% versus 0.4%
But not with any discernable pattern in terms of: • Price to Book Value (1.2 for both). • Beta – the top-performing group was actually lower than that of the bottom group (0.58 versus
0.79).

Environment Agency Corporate Environmental Governance 53
Intangibles Corporate reputation Forest products companies are sizeable users of forest resources worldwide as well as managers of raw materials upon which many communities base their livelihoods. Companies are therefore scrutinized by international NGOs and local groups, and are vulnerable to changing public sentiment. Companies that pursue advanced SFM practices and certification systems often have superior management capacity to deal with complex, somewhat intangible forces acting upon them, and modify their strategies accordingly. Leaders in this area usually have low regulatory risk exposure, improved value of owned forest holdings, more access to non-corporate-owned forest resources, product differentiation in highly commoditized markets, corporate image protection and enhanced reputation. Other benefits reported by companies pursuing certification include potentially lowering finance and insurance costs by lowering risk profiles, improving employee morale and productivity and gaining access to new markets. Certification costs vary from company to company, and country to country. Those already pursuing excellent forest management will have the lowest certification costs. Ultimately, consumers will expect certification of SFM practices and certification will become a key purchasing criterion on a par with price and quality. Competitive advantage In expanding their operations to emerging markets such as Asia and Latin America, forest products companies are seeking new sources of raw material, new markets for traditional products, lower labor and manufacturing costs and less stringent environmental regulations. While they may find these conditions, which offset constraints at domestic operations, firms have also discovered that they have to implement sophisticated management strategies to sustain their business in these regions. Superior management is necessary to deal complex stakeholder relations (i.e. highly forest-dependant communities and aboriginal groups) and steadily increasing environmental regulations, which are often quickly implemented in reaction to spills, boycotts, industrial sabotage and community pressure. Corporate reputation and the profits of forest products companies, as well as firms of other high-impact sectors, have been seriously affected by litigations in international courts over environmental shortcomings or misconduct. Forest products companies with CFPs in their product portfolio consider certification a competitive advantage and also a tool to enhance their brand image through corporate responsibility. Awareness of the need for certification is growing. A recent study by the European Forest Institute found that over 60% of companies thought that a widely used timber certification system, such as FSC, was needed. As consumers demand more environmentally-friendly products, profit generation can result from the use of eco-labels and these are recognised as passports to enter markets where consumers favour such products. In certain environmentally driven markets, governments have established eco-labels for forest products that exact certain environmental standards throughout the manufacturing process. One of the most important of these initiatives, from a market perspective, is the Nordic Swan Eco-Label adopted by the Nordic Council of Ministers. The system is a voluntary, positive eco-labeling scheme in the Nordic countries (Denmark, Finland, Iceland, Norway, and Sweden). The objective of the system is to provide information to consumers and enable them to select products that are the least harmful to the environment. Manufacturers around the world that want to market their products in the Nordic countries and want to demonstrate to potential customers their outstanding environmental performance are eligible to obtain the eco-label. Beyond eco labels, top competitors are focusing on new business opportunities through environmentally driven product development plans. Many have entered the recycling market, reusing industrial byproducts to create new product lines and also the use of alternative fibre resources. As fiber supplies become more restricted, the forest products industry will be forced to be even more efficient and creative in its use of fibre resources, from the forest up the value chain to final distribution. It has renewed its attention to non-wood fibre sources that come from annual crops such as kenaf, hemp, and wheat straw. New markets

Environment Agency Corporate Environmental Governance 54
Forest products companies with CFPs in their product portfolio consider certification a competitive advantage and also a tool to enhance their brand image through corporate responsibility. Awareness of the need for certification is growing. A recent study by the European Forest Institute found that over 60% of companies thought that a widely used timber certification system, such as FSC, was needed. As consumer demand more environmentally-friendly products, profit generation can result from the use of eco-label and these are recognized as passports to enter markets where consumers favour such products. In certain environmentally driven markets, governments have established eco-labels for forest products that exact certain environmental standards throughout the manufacturing process. One of the most important of these initiatives, from a market perspective, is the Nordic Swan Eco-Label adopted by the Nordic Council of Ministers. The system is a voluntary, positive eco-labeling scheme in the Nordic countries (Denmark, Finland, Iceland, Norway, and Sweden). The objective of the system is to provide information to consumers, to enable them to select products that are the least harmful to the environment. Manufacturers around the world that want to market their products in the Nordic countries and want to demonstrate to potential customers their outstanding environmental performance are eligible to obtain the eco-label. Beyond eco labels, top competitors are focusing on new business opportunities through environmentally driven product development plans. Many have entered the recycling market, reusing industrial byproducts to create new product lines and also the use of alternative fiber resources. As fiber supplies have become more restricted, the forest products industry will be forced to become even more efficient and creative in its use of fiber resources, from the forest up the value chain to final distribution. It has renewed its attention to non-wood fiber sources that come from annual crops such as kenaf, hemp, and wheat straw. Risk avoidance Strong environmental management policies and good stakeholder relations are a common feature of sector leaders. The existence of this and systems to support these areas can help companies to identify emerging risk factors, adapt to pending regulation thereby reducing future costs and highlight potential opportunities. Sector leaders have strong board oversight, senior management commitment and consistent application of standards across all operations, both domestic and international. Innovative environmental strategies create an advantage for companies that are seeking access to environmentally-driven markets, such as Europe and North America, attempting to reduce or maintain reputational risk, access capital markets on acceptable terms (particularly in developed countries), decrease insurance costs, and minimize long-term operating capital costs. A positive stakeholder strategy can create the permission to access valuable forest resources in emerging markets, reduce local exposure to reputation damage and avoid product boycotting by large customers. Leading firms have partnered with local and international organizations to attain agreements on land productivity and the conservation of forest values. Positive results of such alliances’ focus are improvement of corporate brand value and environmental performance. Companies that have taken a proactive approach to stringent environmental regulations have learned that the adoption of pollution control technologies creates reductions in operating costs. For instance, Swedish manufacturers have reported that efforts to comply with regulations and improve their environmental performance have reduced operating costs by approximately US$20 per ton. Operational Efficiency Forest products companies worldwide have taken notice of innovative production methods aimed at reducing emissions from different industry manufacturing processes. In general, the drive to improve efficiency was driven by government rejections of ‘end of pipe treatments’. Companies that have taken the lead on this matter have been able to provide unique insights to the whole forest products industry on equipment and processes, and have patented their findings. These companies have also recognized new business opportunities in extending their technology to other manufacturers. European companies, mainly Scandinavian and German, and firms from the United Sates, have taken the most of this market share. In addition, the environmental concerns of forest products companies have affected equipment suppliers by increasing market opportunities for oxygen delignification systems.

Environment Agency Corporate Environmental Governance 55
Appendix – summary of financial impacts identified
Environment Agency Corporate Environmental Governance 56
6. Sector Case Study – Water Utilities
Environmental leaders outperformed laggard companies by 4.5 percentage points over the three year period
Summary The Sector Companies in the water services sector reviewed in this case study are predominantly from Europe. Companies in this industry are public and/or investor-owned utilities, which extract and distribute treated water and then collect and treat waste water, while customers are municipalities, industries and individuals. Economies of scale are becoming more important in order to enlarge customer base and achieve a critical mass. Therefore, the largest companies are tending to become global players. Further, the most looking-forward companies are expanding into new environmentally-driven businesses, by offering non-regulated services such as water infrastructure construction and maintenance services.
Background The nature of water as a vital resource and the heavy investments its exploitation requires resulted in a largely privatized industry, and one which is highly regulated to avoid discriminatory costs and to maintain public health standards. Stringent regulations, especially in the UK, made companies strive towards advanced environmental performance in order to be competitive and maintain financial strength. Leaders in this sector have integrated environmental skills into their management, processes and R&D to deliver best practice standards. Key Findings Environmental Governance Measure
Financial Measure
Degree of Correlation
Quantifiable Impact?
Environmental policy and management systems Share price Strong - correlation-based results provide evidence that environmental leadership is valued by the market
Leaders outperformed laggard companies by 4.5 percentage points (450 basis points) over the three year period 1997 to 2000
Eco-efficiency responses required as operating margins become thinner for UK companies, because the regulatory body (OFWAT) has imposed new pricing constraints for 2005
Operating costs and earnings per share
Strong – operating efficiency will need to be high
£115 million reduction in revenues is expected
UK and US companies are coping with stringent environmental standards
Heavy investment in infrastructure and waste water treatment. May affect earnings per share
Strong – not able to pass all costs to consumers
US companies will have to invest US$1 trillion to upgrade equipment over next 20 years. UK firms will need over £1.0 - £1.5 bn per annum to comply with the most stringent standards in Europe
Investment in cutting edge technologies such as micro-filtration is a means to get better, cheaper, faster and more economic environmental treatment
Operating margin Moderate to Strong – varying levels of response by firms
Not measurable at this stage

Environment Agency Corporate Environmental Governance 57
Environmental governance Issues • Growing awareness of the scarcity of water. Water scarcity manifests itself in several ways,
including a shortage of water supply, inaccessibility for consumers through infrastructure failure, or loss/leakage of water through poor maintenance of infrastructure.
• Water shortages can be exacerbated by the impacts of climate change, with changing rainfall patterns affecting levels of water in reservoirs and aquifers.
• Water is critical to human health and the water industry is therefore highly regulated. This can imply a high level of potential exposure to reputational risk where quality standards fall short.
• Environmental regulations are becoming increasingly stringent worldwide, with the goal of improving water quality and conservation practices. Leakage restrictions, wastewater and hazardous waste disposal requirements and related capital investments will increase accordingly.
• National environment agencies have the power to impose heavy fines for non-compliance and a ‘naming and shaming’ approach is becoming more commonplace. In the UK fines may be smaller than in other developed markets, but are high relative to fines made in other sectors in the UK.
Responses • Water shortage has led to a consensus that countries and regions must adopt sustainable
water management policies, while the implementation should be conducted by either public or private companies in charge.
• Due to lack of funds necessary for investing in much needed water infrastructure improvements, many governments have privatized or are in the process of privatizing water utilities.
• Due to public and governmental pressure to ensure high water quality and low prices, leading firms have adopted sustainable water management schemes and now integrate environmental issues into the overall business strategy, partly as a source of competitive advantage.
• Stringent regulatory controls directly affect companies, since they must respond rapidly to and anticipate changes required by regulation. Companies must therefore have the processes and people in place to track the latest regulatory developments in order to comply. Leading companies anticipate regulatory changes by working with associations and regulatory agencies to set industry-wide environmental standards.
• New legislative developments accelerate the need for innovative analytical tools and equipment to identify pollutant containment levels, and to upgrade infrastructure and build filtration plants for drinking water and waste water systems.
• Leaders seek to enhance eco-efficiency through increasing recycling, development of new technology and alternative energy sources. Sewage sludge is re-used in agriculture and land reclamation or disposed of in incinerators. They also offer customers free advice on water use efficiency.

Environment Agency Corporate Environmental Governance 58
Financial impacts
Fundamentals Share price performance
Figure 14
Percentage Change in Total Return of Environmental Leaders v Laggards in the Water Utilities Sector
-30%
-20%
-10%
0%
10%
20%
30%
40%
50%
Nov
-97
Jan-
98
Mar
-98
May
-98
Jul-9
8
Sep-
98
Nov
-98
Jan-
99
Mar
-99
May
-99
Jul-9
9
Sep-
99
Nov
-99
Jan-
00
Mar
-00
May
-00
Jul-0
0
Sep-
00
Nov
-00
Nov.99 OFWAT announced new 5yr
regulated prices for the water industry in the UK
Uncertainty before
announcement by the OFWAT
NB Figures and results based on Innovest proprietary ratings of above and below average performers As shown in the figure 8 above, companies that demonstrate strong environmental policy and management outperformed laggard companies by 4.5 percentage points (450 basis points) over the three year period 1997 to 2000. It is also possible to look at stock performance excluding the UK water companies.
Difference Env’al Leaders Env’al Laggards
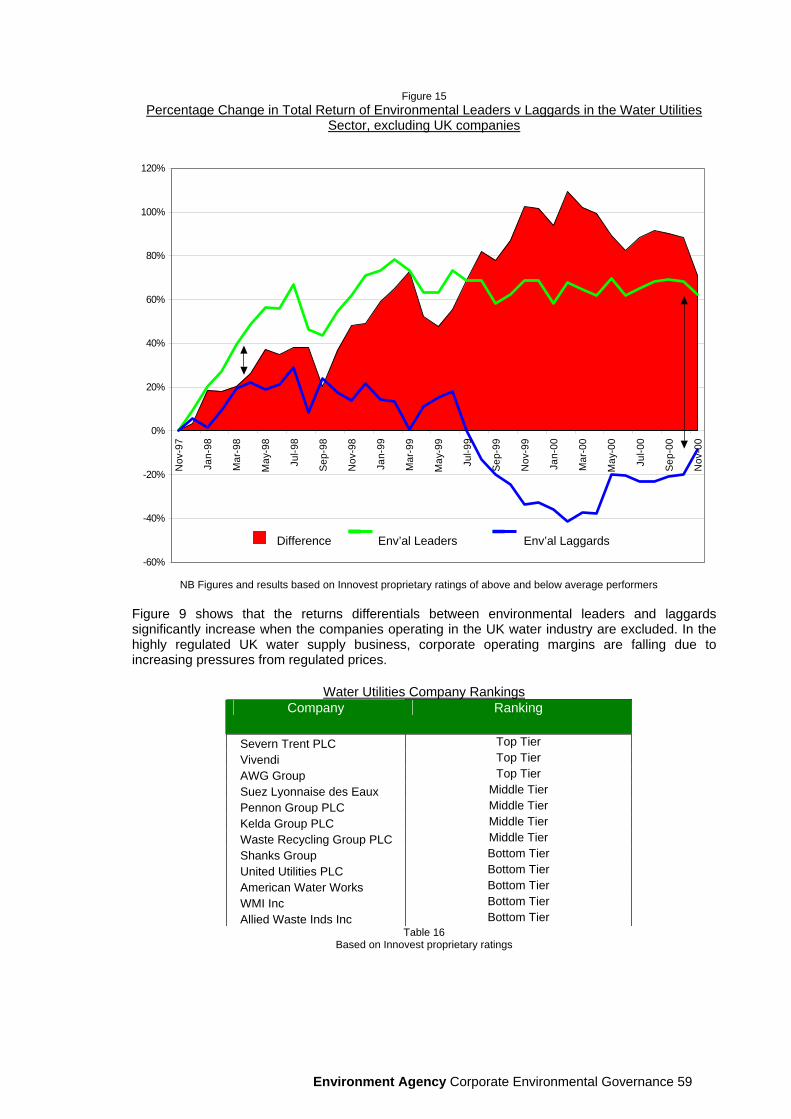
Environment Agency Corporate Environmental Governance 59
Figure 15
Percentage Change in Total Return of Environmental Leaders v Laggards in the Water Utilities Sector, excluding UK companies
-60%
-40%
-20%
0%
20%
40%
60%
80%
100%
120%N
ov-9
7
Jan-
98
Mar
-98
May
-98
Jul-9
8
Sep-
98
Nov
-98
Jan-
99
Mar
-99
May
-99
Jul-9
9
Sep-
99
Nov
-99
Jan-
00
Mar
-00
May
-00
Jul-0
0
Sep-
00
Nov
-00
NB Figures and results based on Innovest proprietary ratings of above and below average performers Figure 9 shows that the returns differentials between environmental leaders and laggards significantly increase when the companies operating in the UK water industry are excluded. In the highly regulated UK water supply business, corporate operating margins are falling due to increasing pressures from regulated prices.
Water Utilities Company Rankings Company Ranking
Severn Trent PLC Top Tier Vivendi Top Tier AWG Group Top Tier Suez Lyonnaise des Eaux Middle Tier Pennon Group PLC Middle Tier Kelda Group PLC Middle Tier Waste Recycling Group PLC Middle Tier Shanks Group Bottom Tier United Utilities PLC Bottom Tier American Water Works Bottom Tier WMI Inc Bottom Tier Allied Waste Inds Inc Bottom Tier
Table 16 Based on Innovest proprietary ratings
Difference Env’al Leaders Env’al Laggards

Environment Agency Corporate Environmental Governance 60
Intangibles Sustainable strategy to cope with stringent regulations In the UK water companies have been faced with pricing constraints by their economic regulator, OFWAT, which declared new price cuts in November 1999 that finally took effect in April 2000 under the mandatory five-year review (2000-2005). This, together with new mandatory capital expenditures, has substantially reduced the operating margins of UK companies. For example, Severn Trent water charges were reduced by 14.1% in April 2000, with a further 1% reduction in each of the following two years. This implied a £115 million reduction in revenues in the regulated water business in the first year and a further reduction of £9 million a year in each of the following two years. In turn, domestic growth potential is limited given the maturity of the business and legal restrictions on mergers of British water companies. Even though stock market prices of the four UK Water Companies were adversely impacted by OFWAT regulation, companies that had leading environmental management and performance such as Severn Trent and Anglian Water outperformed companies that lagged behind by 960 basis points from February 1999 to October 2000. Progressive companies have been responding to this regulatory review by expanding into non-regulated businesses that generate value in the longer term. According to official regulatory bodies and industry associations, companies in the US will have to invest approximately US$1 trillion to upgrade the water infrastructure and build new treatment plants over the next 20 years; and companies in the UK will need to invest approximately £1.0 - 1.5 billion per yearin order to comply with stricter water and waste water environmental standards. For example, the estimated costs to comply with the tighter lead standard in England are around £330 million for 2000-2005. Emerging business opportunities The privatization of water utilities and wastewater treatment works in several European countries has improved the international business competitiveness of EU companies. Companies from France and the United Kingdom have become by far the most internationally competitive for providing an integrated package of designing, building, managing, and even owning water infrastructure around the world. It is no coincidence that these companies have won major projects in Mexico, Brazil, Malaysia and Taiwan. Furthermore, large European companies are expanding into the US water and waste water market. Their strategy is to enlarge their customer base by geographic expansion through acquisitions, gaining economies of scale, primarily in the US, where municipalities and industries increasingly outsource their non-core environmental services.
New technologies Companies that achieve superior environmental and financial performance in a steadily more competitive environment are those that invest in and develop new technologies to satisfy the mounting pressure from public and regulatory agencies at the most efficient cost. Thus, proposed new techniques such as micro-filtration and DNA chips which may be cheaper and faster technologies for quality control and water management could bring a commercial advantage to the companies that use them. The most proactive players invest heavily in such technologies and in R&D to develop innovative solutions with substantial economic and environmental benefits.

Environment Agency Corporate Environmental Governance 61
Appendix – summary of financial impacts identified