Corporate Bond Market Trends Emerging Risks and …...announcements of a less accommodative monetary...
58
Corporate Bond Market Trends, Emerging Risks and Monetary Policy
Transcript of Corporate Bond Market Trends Emerging Risks and …...announcements of a less accommodative monetary...

Corporate Bond Market Trends, Emerging Risks and Monetary Policy


Corporate Bond Market Trends, Emerging Risks and Monetary Policy

This work is published under the responsibility of the Secretary-General of the OECD. The opinions expressed and arguments employed herein do not necessarily reflect the official views of OECD member countries. This document, as well as any data and any map included herein, are without prejudice to the status of or sovereignty over any territory, to the delimitation of international frontiers and boundaries and to the name of any territory, city or area.
© OECD 2020
Please cite this report as: Çelik, S., G. Demirtaş and M. Isaksson (2020), “Corporate Bond Market Trends, Emerging Risks and Monetary Policy”, OECD Capital Market Series, Paris,
www.oecd.org/corporate/Corporate-Bond-Market-Trends-Emerging-Risks-and-Monetary-Policy.htm
This report is part of the OECD Capital Market Series. More information about the series is available at: www.oecd.org/corporate/capital-markets
Any questions and comments are welcome and should be addressed to:
Mr. Mats Isaksson Head of Division Corporate Governance and Corporate Finance Division Directorate for Financial and Enterprise Affairs, OECD [Tel: +33 1 45 24 76 20 | [email protected]]

FOREWORD
By the end of 2019, the global outstanding stock of non-financial corporate bonds reached an all-time high of USD 13.5 trillion in real terms. This record amount is the result of an unprecedented build-up in corporate bond debt since 2008 and a further USD 2.1 trillion in borrowing by non-financial companies during 2019, in the wake of a return to more expansionary monetary policies early in the year. The new data in this report shows that, in comparison with previous credit cycles, today's stock of outstanding corporate bonds has lower overall rating quality, higher payback requirements, longer maturities and inferior investor protection. This report presents:
recent developments and emerging risks in the corporate bond market
the use of rating-based investment and the holders of corporate bonds
credit rating methodologies and historical trends in rating changes
It builds on a dataset of more than 92 000 unique corporate bond issues by non-financial companies from 114 countries between 2000 and 2019. A description of data sources as well as the methodology for data collection are provided in the annex. The report builds on earlier work by the OECD Corporate Governance Committee on corporate finance and the development of more complete capital markets in the form of equity and long-term debt financing. The content and methodologies used in this report are provided as a basis for discussion with OECD committees and other experts about further work on corporate bonds as a source of market-based financing.
The report is part of the OECD Capital Market Series, which informs policy discussions on how capital markets can serve their important role to channel financial resources from households to productive investments in the real economy.
This report has been developed by Mats Isaksson, Head of the Corporate Governance and Corporate Finance Division of the OECD Directorate for Financial and Enterprise Affairs; Serdar Çelik, Senior Economist in the Corporate Governance and Corporate Finance Division, and Gül Demirtaş, Visiting Researcher from Sabanci University. The authors are grateful to their OECD colleagues for valuable comments, in particular Juan Yermo, OECD Deputy Chief of Staff; Yoshiyuki Fukuda and Lukasz Rawdanowicz (Economics Department); and Adriana De La Cruz, Alejandra Medina, Tugba Mulazimoglu, Robert Patalano and Yun Tang (Directorate for Financial and Enterprise Affairs). Further thanks to Pamela Duffin (OECD) for excellent editorial support. Gül Demirtaş would like to thank the Swedish Corporate Governance Forum of the Karl-Adam Bonnier Foundation for its financial support for her work.


Corporate Bond Market Trends, Emerging Risks and Monetary Policy 5
EXECUTIVE SUMMARY
After a return to more expansionary monetary policies in early 2019, the world’s non-financial corporations borrowed an additional USD 2.1 trillion in the form of corporate bonds. In real terms, this is equivalent to the amount borrowed in the previous record year 2016 and represents a clear reversal of the decrease in corporate bond issuance during 2018. Adding the record borrowing during 2019 to the unprecedented build-up of corporate bond debt since 2008 means that the global outstanding stock of non-financial corporate bonds at the end of 2019 reached an all-time high of USD 13.5 trillion. In addition to its growing size, policy makers need to consider that the quality and dynamics of the outstanding stock of corporate bonds have changed. Compared with previous credit cycles, today’s stock of outstanding corporate bonds has lower overall credit quality, higher payback requirements, longer maturities and inferior covenant protection. These are features that may amplify the negative effects that an economic downturn would have on the non-financial corporate sector and the overall economy. As a result, the size, quality and dynamics of today’s corporate bond markets has become a factor to consider in the different scenarios that underpin monetary policy. Supported by a low-interest-rate environment, the mechanics of the credit rating system have allowed companies to increase their leverage ratios and still maintain a BBB rating, which has come to dominate the investment grade category. Over the last three years, BBB rated bonds have made up 52% of all new investment grade bond issuance. As BBB is also the lowest rating in the investment grade category, the significance of the demarcation line between investment and non-investment grade bonds has become increasingly important. Absent the support of low interest rates or in the case of a business downturn, the same rating mechanics that allowed increased leverage will lead to downgrades that increase the borrowing costs for companies and limit their scope for investments. Extensive migration of bonds from investment grade status to non-investment grade status will also test the liquidity of the non-investment grade bond market, as many large investors will be obliged to sell in order to meet their capital requirements and rating-based investment mandates. Given that the average original maturity of investment grade corporate bond issues worldwide has increased from 9 to 12 years, the decrease in the value of bond portfolios that follow from the downgrades will be more pronounced. Some key findings: Extended growth in corporate bond borrowing. Since 2008, the annual global
issuance of corporate bonds has averaged USD 1.8 trillion. This is double the annual average between 2000 and 2007. As a reaction to successive increases in interest rates, announcements of a less accommodative monetary policy and fears over slowing growth, corporate bond issuance declined significantly during the second half of 2018. However, when major central banks announced in early 2019 that they were ready to reintroduce or adjust their accommodative policies, the issuing of corporate bonds rebounded pushing the total amount issued in 2019 to the equivalent amount they borrowed in the previous record year 2016 at USD 2.1 trillion.

EXECUTIVE SUMMARY
6 Corporate Bond Market Trends, Emerging Risks and Monetary Policy
Long-lasting decline in overall bond quality. In every year since 2010, around 20% of the total amount of all bond issues has been non-investment grade and in 2019 the portion reached 25%. This is the longest period since 1980 that the portion of non-investment grade issuance has remained so high, indicating that default rates in a future downturn are likely to be higher than in previous credit cycles. Importantly in 2019, the portion of BBB rated bonds – the lowest quality of bonds that enjoy investment grade status – accounted for 51% of all investment grade issuance. During the period 2000-2007, the portion was just 39%.
Lower quality bonds now dominate. In December 2019, the global outstanding amount of non-financial corporate bonds reached USD 13.5 trillion. In real terms, this is more than twice the amount outstanding in December 2008. Large issuance of BBB rated bonds, non-investment grade bonds and bonds from emerging market corporations since 2008 has resulted in a situation where lower credit quality bonds have come to dominate the global outstanding stock. In 2019, only 30% of the global outstanding stock of non-financial corporate bonds were rated A or above and issued by companies from advanced economies. In addition, for emerging market issuers and non-investment grade and unrated bonds issued by companies from advanced markets, the total payback or refinancing requirements within the next three years is USD 2.5 trillion, equivalent to 41% of their total outstanding amount.
Longer maturities and increased price sensitivity. In the last five years, the average length of maturity for investment grade bonds at the date of issue has been 12.4 years compared to 9.4 years in the early 2000s. In 2019, the average maturity of investment grade bonds was about 13 years. As longer maturities are associated with higher price sensitivity to changes in interest rates, the combination of longer maturities and declining credit quality has made bond markets more sensitive to changes in monetary policy.
The use of rating-based investments, passive management and corporate bond ownership. The portfolio allocation of all major bondholders, such as pension funds, insurance corporations and investment funds is influenced by external credit ratings. This influence is either through regulations that use rating grades as a reference for establishing quantitative limits and capital requirements or through self-imposed rating-based investment strategies that are reflected in their investment mandates and policies. For example, corporate bond holdings by exchange traded funds (ETFs) who typically use passive rating-based strategies increased 13-fold from USD 32 billion in 2008 to USD 420 billion in 2018. Interestingly also, non-financial companies have become significant owners of corporate bonds. Between 2009 and 2018, the combined value of corporate bond holdings by 25 large non-financial US companies tripled from USD 119 billion to USD 356 billion. The company with the largest portfolio alone held USD 124 billion in corporate debt securities. This equals the combined holdings of the world’s 6 largest corporate bond ETFs.
Within-rating leverage ratios have increased. Today, the median firm in each investment grade rating has higher leverage ratios compared to a decade ago. At the same time, influenced by unprecedented low interest rates since 2008, their ability to cover their current interest obligations has improved. If interest rates start to increase or an economic downturn leads to lower earnings, interest coverage and profitability ratios may deteriorate rather rapidly, limiting their ability to offset the high leverage. In such a scenario, the rating mechanics that allowed increased leverage would result in pressure towards higher overall downgrade ratios.

EXECUTIVE SUMMARY
Corporate Bond Market Trends, Emerging Risks and Monetary Policy 7
Issuer quality and rating stability. The significant increase of BBB rated bonds and the declining frequency of downgrades relative to upgrades in recent years, may suggest that credit rating agencies are mindful of downgrading BBB issuers due to their special status just above the non-investment grade category. The one-year 1-notch downgrade probability is lowest for bonds rated BBB-, which is also the lowest rating notch before crossing the line to non-investment grade. It may also reflect that companies with BBB status pay extra close attention to their rating metrics in order to maintain their rating status and borrowing costs. If rating agencies were to be extra cautious to re-rate bonds that are in the vicinity of the investment / non-investment grade frontier, one might expect that the upgrade probability is lowest for the BB+ category. However, for all the three major credit rating agencies the probability of a 1-notch upgrade within a year is either highest or third highest for BB+ rated issuers.
Sell-offs and financial stability concerns. While the growing stock of the BBB rated bonds has allowed investors to seek higher yields, their choice of portfolio allocation is typically influenced by regulations and defined by rating-based investment mandates. Given these limitations, together with a concentration of outstanding bonds just above the demarcation line between investment and non-investment grade, extensive downgrades of BBB rated bonds to non-investment grade status may lead to substantial sell-offs that put corporate bond markets in general under stress, giving rise to financial stability concerns.


Corporate Bond Market Trends, Emerging Risks and Monetary Policy 9
PART I. RECENT DEVELOPMENTS AND EMERGING RISKS IN THE CORPORATE BOND MARKET
Following the return to a more expansionary monetary policy by major central banks in 2019, the world’s non-financial companies have borrowed an additional USD 2.1 trillion in the form of corporate bonds. This is equivalent to the previous record year 2016 and a clear reversal of the nascent decrease in corporate bond issuance in 2018. Adding the 2019 bond issues to the unprecedented use of corporate bonds since 2008 means that the outstanding stock of non-financial corporate bonds has reached yet another all-time high of USD 13.5 trillion. 1.1. Trends in corporate bond issuance by non-financial companies Figure 1 presents the total amount of debt raised by non-financial companies in the form of corporate bonds in each year between 2000 and 2019. As seen in Panel A, there was a significant and lasting increase around the time of the 2008 financial crisis. Between 2008 and 2019, the average global issuance annually was USD 1.8 trillion, which is double the average annual amount of USD 879 billion between 2000 and 2007.
Figure 1. Global corporate bond issuance and issuance in advanced economies (2019 USD, billion)
Note: The figures are based on the analysis of 92 069 unique corporate bond issues by non-financial companies from 114 countries. Source: OECD Capital Market Series dataset, Thomson Reuters Eikon, see Annex for details.
Panel B of Figure 1 shows corporate bond issuance by companies in the United States and other advanced economies. In line with the global trend, issuance in advanced economies decreased in the second half of 2018, resulting in the lowest annual issuance since the 2011 European debt crisis. However, in 2019, issuance bounced back and in advanced economies, it almost reached the 2017 record. This drop and reversal pattern is similar for the United States and other advanced economies. Taking a longer term perspective, the average annual issuance of corporate bonds by non-financial companies in advanced economies grew by 63% from USD 808 billion during the 2000-2007 period to USD 1.3 trillion during the 2008-2019 period. The decline in corporate bond issuance during the second half of 2018 can be linked to the successive rise in interest rates, coupled with investor fears over slowing growth and less accommodative monetary policy. By the end of 2018, the US Federal Reserve had raised interest rates for the ninth time since December 2015 and had already initiated its balance sheet normalisation programme (Federal Reserve, 2017 and 2018). Likewise, in August 2018,
0
500
1 000
1 500
2 000
$2 500 Bn.
2000 '05 '10 '15 '19
A. Global
0
500
1 000
1 500
2 000
$2 500 Bn.
2000 '05 '10 '15 '19
B. Advanced economiesUS Other advanced

PART I. RECENT DEVELOPMENTS AND EMERGING RISKS IN THE CORPORATE BOND MARKET
10 Corporate Bond Market Trends, Emerging Risks and Monetary Policy
the Bank of England increased interest rates for the first time since the crisis and in December 2018, the ECB ended its net purchases under the asset purchase programme (BoE, 2018; ECB, 2018). However, this changed in the first month of 2019 when both the US Federal Reserve and the ECB expressed their readiness to reintroduce or adjust their accommodative strategies in light of future economic and financial conditions (Federal Reserve, 2019a and 2019b; ECB, 2019a). Similarly, the Bank of England adjusted its growth forecasts significantly downward, which lowered the expectations of future interest rate increases (BoE, 2019a). The Bank of Japan also confirmed its intention to maintain the existing and extremely low levels of interest rates for an extended period (BoJ, 2019a). With such reassurances, corporate bond issuance quickly rebounded pushing the total amount in the first six months of 2019 above that of the same period in 2018. In July 2019, US Federal Reserve cut interest rates for the first time since 2008. Two more rate cuts followed in September and October (Federal Reserve 2019c, 2019d, 2019e). Similarly, in September 2019, the ECB lowered interest rates and announced its plan to restart net purchases under its asset purchase programme at a monthly pace of EUR 20 billion starting from November 2019 (ECB, 2019b). Furthermore, in October 2019, the Bank of Japan stated its willingness to cut interest rates if deemed necessary to achieve the inflation target (BoJ, 2019b). In November 2019, the Bank of England followed suit and signalled that it will be ready to adjust its monetary policy to reinforce the expected recovery in economic growth and inflation (BoE, 2019b). Following these developments, full year issuance of non-financial corporate bonds in 2019 in advanced economies climbed above the average post-financial crisis level to USD 1.4 trillion. Figure 2 presents issuance by companies in the People’s Republic of China (China) and other emerging markets where the pre- and post-crisis difference is even more pronounced than that for advanced economies. While bond issuance by Chinese companies was negligible prior to 2008, it averaged USD 285 billion during the period 2008 to 2019. In 2017, China experienced a sharp decline of almost 40% in bond issuance compared with the 2016 peak level of USD 601 billion. During the last 2 years however, annual issuance has continued to grow. Issuance by companies from other emerging market economies has remained relatively limited during the past two decades and ranged between USD 110-190 billion in the last 10 years except for a peak at USD 207 billion in 2013.
Figure 2. Corporate bond issuance by companies in China and in other emerging market economies (2019 USD, billion)
Source: OECD Capital Market Series dataset, Thomson Reuters Eikon, see Annex for details.
In order to understand how annual issuing activity affects the outstanding stock of corporate bond debt, it is necessary to calculate gross issuance minus the total amount of corporate bonds matured or retired in any given year. This is done in Figure 3 with respect to country
0
200
400
600
$800 Bn.
2000 '05 '10 '15 '19
China Other emerging
PART I. RECENT DEVELOPMENTS AND EMERGING RISKS IN THE CORPORATE BOND MARKET
Corporate Bond Market Trends, Emerging Risks and Monetary Policy 11
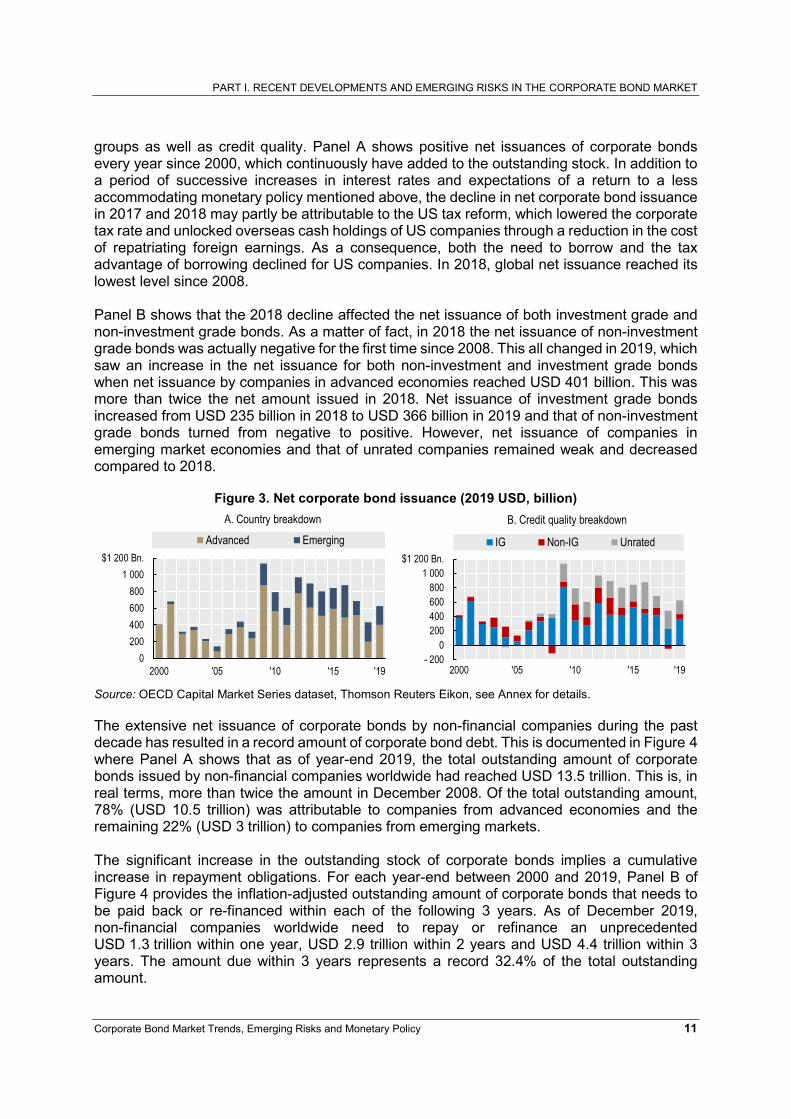
groups as well as credit quality. Panel A shows positive net issuances of corporate bonds every year since 2000, which continuously have added to the outstanding stock. In addition to a period of successive increases in interest rates and expectations of a return to a less accommodating monetary policy mentioned above, the decline in net corporate bond issuance in 2017 and 2018 may partly be attributable to the US tax reform, which lowered the corporate tax rate and unlocked overseas cash holdings of US companies through a reduction in the cost of repatriating foreign earnings. As a consequence, both the need to borrow and the tax advantage of borrowing declined for US companies. In 2018, global net issuance reached its lowest level since 2008. Panel B shows that the 2018 decline affected the net issuance of both investment grade and non-investment grade bonds. As a matter of fact, in 2018 the net issuance of non-investment grade bonds was actually negative for the first time since 2008. This all changed in 2019, which saw an increase in the net issuance for both non-investment and investment grade bonds when net issuance by companies in advanced economies reached USD 401 billion. This was more than twice the net amount issued in 2018. Net issuance of investment grade bonds increased from USD 235 billion in 2018 to USD 366 billion in 2019 and that of non-investment grade bonds turned from negative to positive. However, net issuance of companies in emerging market economies and that of unrated companies remained weak and decreased compared to 2018.
Figure 3. Net corporate bond issuance (2019 USD, billion)
Source: OECD Capital Market Series dataset, Thomson Reuters Eikon, see Annex for details.
The extensive net issuance of corporate bonds by non-financial companies during the past decade has resulted in a record amount of corporate bond debt. This is documented in Figure 4 where Panel A shows that as of year-end 2019, the total outstanding amount of corporate bonds issued by non-financial companies worldwide had reached USD 13.5 trillion. This is, in real terms, more than twice the amount in December 2008. Of the total outstanding amount, 78% (USD 10.5 trillion) was attributable to companies from advanced economies and the remaining 22% (USD 3 trillion) to companies from emerging markets. The significant increase in the outstanding stock of corporate bonds implies a cumulative increase in repayment obligations. For each year-end between 2000 and 2019, Panel B of Figure 4 provides the inflation-adjusted outstanding amount of corporate bonds that needs to be paid back or re-financed within each of the following 3 years. As of December 2019, non-financial companies worldwide need to repay or refinance an unprecedented USD 1.3 trillion within one year, USD 2.9 trillion within 2 years and USD 4.4 trillion within 3 years. The amount due within 3 years represents a record 32.4% of the total outstanding amount.
0 200 400 600 800
1 000$1 200 Bn.
2000 '05 '10 '15 '19
A. Country breakdown
Advanced Emerging
- 200 0
200 400 600 800
1 000$1 200 Bn.
2000 '05 '10 '15 '19
B. Credit quality breakdown
IG Non-IG Unrated

PART I. RECENT DEVELOPMENTS AND EMERGING RISKS IN THE CORPORATE BOND MARKET
12 Corporate Bond Market Trends, Emerging Risks and Monetary Policy
Figure 4. Total outstanding amount of corporate bonds issued by non-financial companies and outstanding amount due within the subsequent 3 years (2019 USD, trillion)
Source: OECD Capital Market Series dataset, Thomson Reuters Eikon, see Annex for details.
1.2 Risks associated with the current outstanding stock of corporate bonds
The large outstanding amounts and the record repayment requirements are not the only characteristics that distinguish today’s outstanding stock of corporate bond debt from that of the previous credit cycles. Other important differences include the aggregate credit quality of issuers, the length of maturities and the level of bondholder rights. A common measure of market-wide issuer quality that has been used to forecast excess corporate bond returns is the ratio of non-investment grade bond issuance to total corporate bond issuance (Greenwood and Hanson, 2013). Construction of this measure for the non-financial corporate bond market in Figure 5 shows that the share of non-investment grade issuance remained above 20% in every year between 2010 and 2017. It fell only slightly below 20% in 2018 and then rose to 25.2% in 2019. This is the longest period of time since 1980 that the portion of non-investment grade issuance has remained this elevated before a significant decrease in its level and a subsequent increase in default rates. However, as discussed in Çelik et al. (2019), this broad measure of issuer quality captures only a part of the story. The reason is that it does not take into account changes in credit quality within the two broad categories of investment grade and non-investment grade bonds, which are often used to define investment policies but which themselves include bonds of rather different credit quality.
Figure 5. Share of non-investment grade bonds in global bond issuance by non-financial companies and average default rates of rated companies
Note: The figure is based on the analysis of 63 562 corporate bond issues with rating information from 105 countries. Source: OECD Capital Market Series dataset, Thomson Reuters Eikon, MIS (2019, 2020), see Annex for details.
13.5
10.5
3.0
6.0
2.91.9
0
2
4
6
8
10
12
$14Tn.
Global Advanced Emerging US Europe China
A. Total outstanding amountDec '08 Dec '19
Due in Y1Due in Y2
Due in Y3
23
25
27
29
31
33%
0
1
2
3
4
$5 Tn.
2000 '05 '10 '15 '19
B. Outstanding due within the subsequent 3 years
Due in 3 years(% of outstanding)
3.6% 3.7%5.0%
0
1
2
3
4
5 %
05
101520253035
40 %
1980 '85 '90 '95 2000 '05 '10 '15 '19
Global non-IG share (LHS) Default rate (RHS)

PART I. RECENT DEVELOPMENTS AND EMERGING RISKS IN THE CORPORATE BOND MARKET
Corporate Bond Market Trends, Emerging Risks and Monetary Policy 13
To explore in more detail the changes in credit quality, Figure 6 uses issuance data to show that such changes in rating composition indeed have occurred within both the investment grade and non-investment grade categories. Notably, Panel A shows that the portion of BBB rated bonds, which is the lowest quality of bonds that are included in the investment grade category, has increased significantly. During the period 2000-2007, on average 38.9% of all investment grade issuance was rated BBB. During the period 2008-2019, their average share in total issuance increased to 44.6%. Since 2017, BBB rated issuances have accounted for more than half of all investment grade issuance and stood at 51% in 2019. Within the non-investment grade category, Panel B shows that the credit quality shift has been in the opposite direction towards a higher portion of higher rated bonds. The average annual share of BB rated bonds in global non-investment grade issuance increased from 35.2% in the pre-crisis period to 50.2% during the period 2008-2019 and reached its highest value of 58.7% in 2019. The shift may partly be attributable to the fact that some issuers below BB have left the bond market for the leveraged loan market.
Figure 6. Composition of issuance in investment and non-investment grade categories
Note: In Panel B, 1990-1991 data are not reported due to an insufficient number of non-investment grade issues in those years. Source: OECD Capital Market Series dataset, Thomson Reuters Eikon, see Annex for details.
While investments in BBB rated bonds allow investors to increase risk and potential returns, institutional investors are often bound or restricted by investment mandates, regulations and self-imposed policies to hold bonds that are included in the investment grade category. Under such restrictions of rating-based investment rules, extensive downgrades of BBB rated bonds to non-investment grade status may lead to substantial sell-offs that put corporate bond markets in general under stress. It is therefore important to pay special attention to the issuance of BBB rated bonds and to the increased importance that the demarcation line between investment grade and non-investment grade plays for the asset allocation of institutional investors and market movements. After years of high BBB issuance, the outstanding stock of BBB rated bonds stood at USD 3.8 trillion in December 2019. This is almost 30% of the value of all outstanding corporate bonds in the world. Their significance is also reflected in the portfolio composition of investors. Aramonte and Eren (2019) report that since the financial crisis, the portion of BBB bonds in the portfolios of investment grade corporate bond mutual funds in the US steadily grew from around 20% in 2010 to about 45% in 2018. Similarly, ECB (2019c) reported that by the end of 2018, BBB rated bonds represented a significant and growing portion of the non-financial corporate bond holdings of euro area non-bank financial institutions and accounted for 40% of
BBB 50.9%
A 40.6%
AA 7.7%AAA 0.73%0
10
20
30
40
50
60%
'90 '95 2000 '05 '10 '15 '19
A. Investment Grade
BB 58.7%
B 37.0%
CCC or lower 4.3%0
15
30
45
60
75
90%
'90 '95 2000 '05 '10 '15 '19
B. Non-Investment Grade

PART I. RECENT DEVELOPMENTS AND EMERGING RISKS IN THE CORPORATE BOND MARKET
14 Corporate Bond Market Trends, Emerging Risks and Monetary Policy
the holdings of insurance corporations and pension funds and 35% of the holdings of investment funds compared with 33% and 31% respectively at the end of 2013. In order to meet the obligations and requirements that are imposed by investment mandates, regulations and self-imposed policies, the occurrence of extensive downgrades from BBB to non-investment grade status may force many institutional investors to offload a large amount of bonds. Based on the 1-year transition rate reported by Moody’s for the year 2009 (i.e. 6.8%) as a proxy and assuming that the outstanding amount of the average downgraded BBB rated company is representative of that of the average BBB rated company, BBB rated bonds amounting to USD 261 billion could be expected to be downgraded to non-investment grade within one year, in case of a significant economic downturn. If corporate bonds issued by financial companies are also taken into account, the amount of so-called “fallen angels” would increase to approximately USD 500 billion. This influx to non-investment grade market may swell as the time horizon for possible downgrades lengthens. Given the major changes in intra-category quality and the critical importance of the demarcation line between investment and non-investment grade categories, a “global corporate bond rating index” is constructed, which provides a more refined measure of overall bond quality rating.1 Panel A of Figure 7 plots this index for each year since 1980, based on information about all rated bonds that have been issued by non-financial companies worldwide. According to the figure, the lowest levels of issuer quality were reached in 1987, 1997, 2004 and 2010, with an absolute minimum (12.59) in 2010. Moreover, the number of years for which this index has stayed under 14, which corresponds to a BBB+ rating, has increased in each cycle: From two years in 1987 to five years around the 2004 low. From the all-time low in 2010, the global corporate bond rating index has stayed below BBB+ for a full 10 years and remained at 13.09 in 2019. This means that the average corporate bond issued has a rating of approximately BBB.
Figure 7. Global corporate bond rating index
Source: OECD Capital Market Series dataset, Thomson Reuters Eikon, see Annex for details.
A closer look at the past 3 years in Panel B reveals that issuer quality began to improve in February 2018, which coincided with a time of large net redemptions from non-investment grade funds, amid increasing investor concerns that inflation in the US could lead to more substantial interest rate hikes. As the major central banks had already become or were expected to become less accommodative in 2018, the prospect of rising interest rates pushed non-investment grade issuers to the loan market, where interest rates are -as opposed to the 1 The index assigns a score of 1 to a bond if it has the lowest credit quality rating and 21 if it has the highest rating. The corporate bond rating index is then calculated by taking a weighted average of individual bond scores, using issue amounts as weights.
12
14
16
18
1980 '85 '90 '95 2000 '05 '10 '15 '19
A. Global Corporate Bond Rating Index
18 (AA-)
16 (A)
14 (BBB+)
12 (BBB-) 12
14
16
18
Dec1
6
Jun1
7
Dec1
7
Jun1
8
Dec1
8
Jun1
9
Dec1
9
B. Monthly global corp. bond rating index

PART I. RECENT DEVELOPMENTS AND EMERGING RISKS IN THE CORPORATE BOND MARKET
Corporate Bond Market Trends, Emerging Risks and Monetary Policy 15
corporate bond market- mainly floating. However, the resulting improvement in the global corporate bond rating index was only temporary and has been reversed in 2019, when central banks voiced their readiness to re-launch accommodative strategies, as necessary. Large issuance of BBB rated bonds, non-investment grade bonds and bonds from emerging market corporations since 2008 has resulted in a situation where lower credit quality bonds have come to dominate the global outstanding stock. Figure 8 shows the composition of the global outstanding stock in terms of credit quality as of year-end 2019. Non-investment grade bonds together with unrated bonds issued by companies from advanced economies and corporate bonds issued by companies from emerging markets make up 45% of all outstanding non-financial corporate bonds globally. The lowest rated bonds in the investment grade category, BBB rated bonds, issued by companies from advanced economies account for another 25%. In other words, only 30% of the global outstanding stock of corporate bonds is rated A or above and issued by companies from advanced economies. As a complement to the maturity walls shown in Figure 4 above, Figure 8 shows the outstanding amounts that are due for payback or re-financing within the next three years (2020-2022) for each credit quality category. For emerging market issuers and for non-investment grade and unrated bonds issued by companies from advanced markets, the share of the outstanding amount that is due within the next 3 years is significantly higher than the share for investment grade bonds issued by companies from advanced economies. Together, the amount of these bonds that are due for payback or re-financing within the next three years is USD 2.5 trillion, equivalent to 41% of their total outstanding amount.
Figure 8. Outstanding amount of corporate bonds by credit quality categories (2019 USD, trillion)
Source: OECD Capital Market Series dataset, Thomson Reuters Eikon, see Annex for details.
In addition to the higher repayment requirements that issuers of non-investment grade bonds face, the fluctuations in the amounts that are issued by them are also considerably higher than the fluctuations observed in investment grade bond issuance. Figure 9 shows the 12-month cumulative issuance amounts for each month and the corresponding percentage changes from prior month. While the total issuance of investment grade bonds has remained stable at around USD 1 trillion per year since 2014, the total issuance amount of non-investment grade bonds has fluctuated between USD 200 and 450 billion. These higher fluctuations in non-investment grade issuing are also reflected on a monthly basis. While the monthly absolute change in investment grade issuance exceeded 5% only during 4 months over the period 2014 to 2019, the same occurred during 26 months for non-investment grade issuance.
1.09 0.79 0.66 0.40
1.43
0
10
20
30
40
50 %
0
1
2
3
4
$5 Tn.
A or above BBB Non-IG Unrated Companies fromCompanies from advanced markets emerging markets
Amount due within 3 years
Amount due later than 3 years
Due in 3 years (% outstanding)

PART I. RECENT DEVELOPMENTS AND EMERGING RISKS IN THE CORPORATE BOND MARKET
16 Corporate Bond Market Trends, Emerging Risks and Monetary Policy
There are four distinct periods of growth and decline in non-investment grade issuance as illustrated in Panel B of Figure 9. The first period of decline was from early 2015 to mid-2016, in particular in the first four months of 2016 with an average monthly decline of 10%. This coincided with a period when the US Federal Reserve, in response to improvements in economic activity, started normalising its monetary policy. The US Federal Reserve started a series of interest rate increases in December 2015. The following 12 months from mid-2016 to mid-2017 saw a strong upward trend with monthly increases in non-investment grade issuance reaching 15%. Concerns about the uncertainties about the economic outlook were expressed by central banks in mid-2016 (ECB, 2016a; Yellen, 2016), which was followed by a decline in long-term expected interest rates. As discussed above, interest rates rose in 2018 coupled with investor fears over slowing growth and gradually decreasing support of major central banks for the economy. An important development in this period was the launch of the US Federal Reserve’s balance sheet normalisation programme, which would reduce its securities holdings in a gradual and predictable manner, in October 2017. This third period saw a 12 consecutive month of decline in non-investment grade issuance and ended in early 2019. This was when both the US FED and the ECB expressed their readiness to reintroduce or adjust their accommodative strategies in light of future economic and financial conditions. With such reassurance, non-investment grade issuance increased throughout 2019. It is noteworthy that during all the four periods, changes in the monetary policy environment are associated with more pronounced reactions in the primary non-investment grade market compared to the primary investment grade market.
Figure 9. 12-month cumulative issuance (2019 USD, trillion) and the corresponding monthly changes (%)
Source: OECD Capital Market Series dataset, Thomson Reuters Eikon, see Annex for details.
There is also a negative correlation between credit quality and bond price volatility. The lower the rating (the higher the credit risk), the higher the price volatility (Bao et al., 2015). As illustrated in Figure 6 and 7 above, there has been a clear downward trend in overall credit quality worldwide. This was not only because of the increase in non-investment grade issuance but also because the relative share of BBB rated bonds has increased at the expense of bonds that are rated AA or above.
100
400
700
1 000
$ 1 300 Bn.
D… J… D… J… D… J… D… J… D… J… D… J… D…
12-m
onth
cumu
lative
iss
uanc
e
A.Investment Grade Issuance
100
400
700
1 000
$ 1 300 Bn.
D… J… D… J… D… J… D… J… D… J… D… J… D…
B. Non-Investment Grade Issuance
-20%-10%
0%10%20%
Dec-1
3Ju
n-14
Dec-1
4Ju
n-15
Dec-1
5Ju
n-16
Dec-1
6Ju
n-17
Dec-1
7Ju
n-18
Dec-1
8Ju
n-19
Dec-1
9
% ch
ange
from
prior
mon
th
-20%-10%
0%10%20%
Dec-1
3Ju
n-14
Dec-1
4Ju
n-15
Dec-1
5Ju
n-16
Dec-1
6Ju
n-17
Dec-1
7Ju
n-18
Dec-1
8Ju
n-19
Dec-1
9
PART I. RECENT DEVELOPMENTS AND EMERGING RISKS IN THE CORPORATE BOND MARKET
Corporate Bond Market Trends, Emerging Risks and Monetary Policy 17
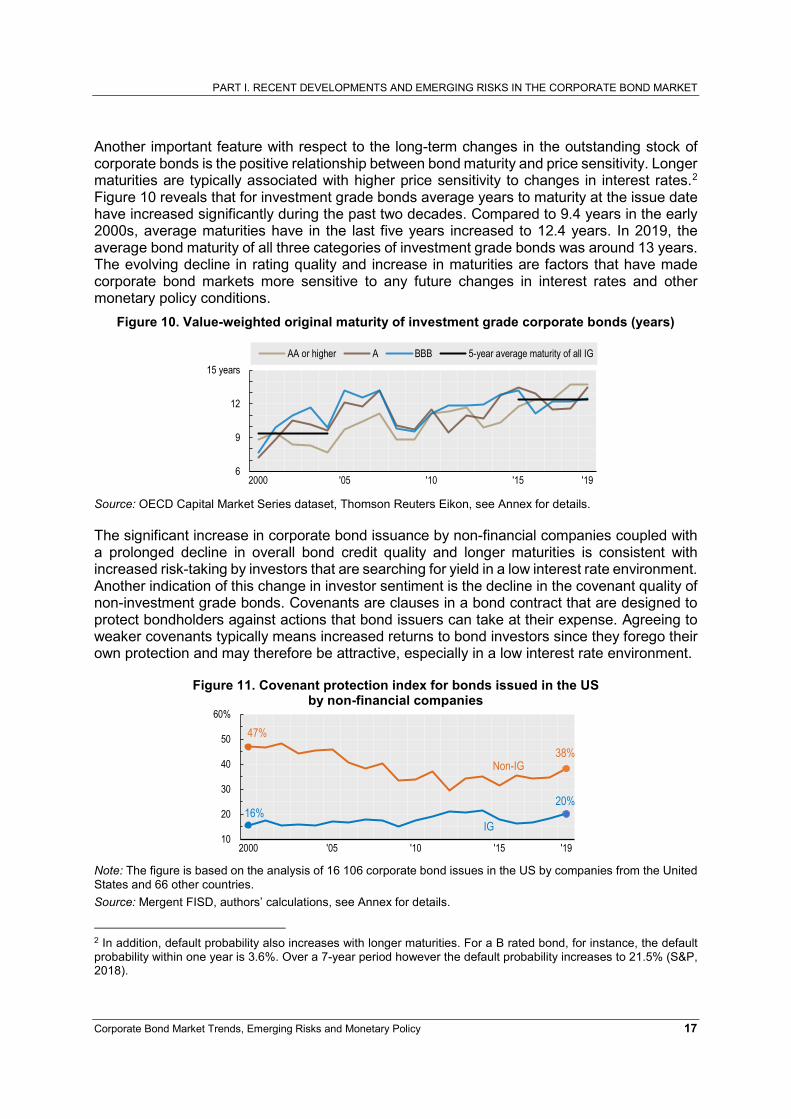
Another important feature with respect to the long-term changes in the outstanding stock of corporate bonds is the positive relationship between bond maturity and price sensitivity. Longer maturities are typically associated with higher price sensitivity to changes in interest rates.2 Figure 10 reveals that for investment grade bonds average years to maturity at the issue date have increased significantly during the past two decades. Compared to 9.4 years in the early 2000s, average maturities have in the last five years increased to 12.4 years. In 2019, the average bond maturity of all three categories of investment grade bonds was around 13 years. The evolving decline in rating quality and increase in maturities are factors that have made corporate bond markets more sensitive to any future changes in interest rates and other monetary policy conditions.
Figure 10. Value-weighted original maturity of investment grade corporate bonds (years)
Source: OECD Capital Market Series dataset, Thomson Reuters Eikon, see Annex for details.
The significant increase in corporate bond issuance by non-financial companies coupled with a prolonged decline in overall bond credit quality and longer maturities is consistent with increased risk-taking by investors that are searching for yield in a low interest rate environment. Another indication of this change in investor sentiment is the decline in the covenant quality of non-investment grade bonds. Covenants are clauses in a bond contract that are designed to protect bondholders against actions that bond issuers can take at their expense. Agreeing to weaker covenants typically means increased returns to bond investors since they forego their own protection and may therefore be attractive, especially in a low interest rate environment.
Figure 11. Covenant protection index for bonds issued in the US by non-financial companies
Note: The figure is based on the analysis of 16 106 corporate bond issues in the US by companies from the United States and 66 other countries. Source: Mergent FISD, authors’ calculations, see Annex for details.
2 In addition, default probability also increases with longer maturities. For a B rated bond, for instance, the default probability within one year is 3.6%. Over a 7-year period however the default probability increases to 21.5% (S&P, 2018).
6
9
12
15 years
2000 '05 '10 '15 '19
AA or higher A BBB 5-year average maturity of all IG
16%IG
20%
47%
Non-IG38%
10
20
30
40
50
60%
2000 '05 '10 '15 '19

PART I. RECENT DEVELOPMENTS AND EMERGING RISKS IN THE CORPORATE BOND MARKET
18 Corporate Bond Market Trends, Emerging Risks and Monetary Policy
Figure 11 above presents the covenant protection index for bonds issued in the US market by non-financial companies.3 The higher the index, the stronger is the covenant protection. As shown, the covenant protection index for non-investment grade bonds decreased significantly from 47% in 2000 to 30% in 2012. Since then, the index for non-investment grade bonds has increased and reached 38% in 2019. Importantly, despite the increase in BBB rated issuance over the recent years, the index for investment grade bonds has stayed in a narrower band between 15% and 21% throughout the period. A closer look at developments during the past two years shows that the covenant protection index for non-investment grade bonds reached its highest level since 2008 in the first half of 2019. Figure 12 displays the trends with respect to the inclusion of the five different covenants that experienced the highest increases over the period. Two of these five covenants are related to restricting asset sales and/or the use of asset sale proceeds, and two are related to restricting issuing new debt by the issuer or the indebtedness of its subsidiaries. The last covenant shown in Panel C is cross default provisions, which trigger default when any other debt of the issuer moves into default. Although it is too early to conclude whether these most recent changes indicate a reversal of the long-term trend of weakening bondholder rights, they still point to an increased investor attention to the overall debt levels of corporate bond issuers.
Figure 12. Recent changes in the covenant protection index and the incidence of observing selected covenants in non-investment grade bonds
Source: Mergent FISD, authors’ calculations, see Annex for details.
Keeping interest rates low with the objective of supporting economic recovery in the post-crisis period has also led institutional investors to search for yield in the riskier parts of the corporate bond market in order to meet their return targets. The observed decline in average issuer quality, increase in average maturities and the deterioration in non-investment grade bonds’ covenant protection in the post-crisis era indicates a period of increased risk appetite among investors, shifting the lending terms in favour of issuers. The threefold lockstep movement of issuer quality, the monetary policy conditions as presented in Panel B of Figure 7 and the increased amounts of corporate bonds due in the medium-term now present one of the factors to be taken into account when assessing different financial market scenarios and setting monetary policy. 3 Please see the Annex for details on the covenant data source and the calculation of the covenant index.
34.4% 35.3%38.2%
30%
34%
38%
42%
2018H1 2018 H2 2019 H1
A. Covenant Protection Index
34%58%
0%
100%
2018 H1 2018 H2 2019 H1
B. Requirement to use asset sale proceeds to redeem bonds
18%40%
0%
100%
2018 H1 2018 H2 2019 H1
C. Cross defaultprovisions
48%59% 67%
0%
100%
2018 H1 2018 H2 2019 H1
D. Restrictions on issuing new debtwith limits on debt outstanding
72% 79%90%
0%
100%
2018 H1 2018 H2 2019 H1
E. Restrictions on asset sales or use of asset sale proceeds
49% 58% 67%
0%
100%
2018 H1 2018 H2 2019 H1
F. Restrictions on total indebtedness of subsidiaries

Corporate Bond Market Trends, Emerging Risks and Monetary Policy 19
PART II. CORPORATE BOND INVESTORS AND RATING-BASED INVESTMENT
The increase in corporate bond issues and the changing character of the outstanding stock of corporate bonds during the past decades have been accompanied by changes in the investor base and the emergence of new investment vehicles. When analysing the dynamics and the future direction of the corporate bond market it is important to understand the systemic effects of these changes and the related financial market regulations. This part explores changes in the investor base during the past two decades and how investment practices together with the regulatory framework are likely to influence the behaviour and investment patterns of corporate bond investors.
2.1. An overview of the current investor base
Information about the different categories of investors that hold corporate bonds is available from the national financial accounts data published by central banks or statistical institutions. These national data typically cover direct owners of corporate bonds issued by companies resident in the country. One disadvantage is that countries cannot identify the different categories of investors among foreign bond owners. Instead, foreign ownership is reported as one aggregate number. The extent to which this reporting practice affects the ability to identify the distribution of corporate bond ownership between different categories of investors in a given country is therefore in proportion to the level of foreign ownership in that country.
Figure 13. Percentage of foreign ownership of outstanding corporate bonds issued by companies in different regions
Source: Authors’ calculations based on national financial accounts data released by the ECB Statistical Data Warehouse, the UK Office for National Statistics, the Bank of Japan and the US Federal Reserve, see Annex for details.
As an illustration, Panel A of Figure 13 shows the foreign ownership share of the outstanding amount of corporate bonds issued by corporate residents of the UK, the US, the euro area and Japan.4 Except in the euro area, where the series are relatively short, foreign ownership is clearly on the rise. In Japan, it has increased from 5.5% in 2005 to 17.2% in 2018 and in the 4 It should be noted that across different countries, the scope of corporate bonds data may differ. For instance, some countries report the national financial accounts data at the breakdown of short-term vs. long-term debt securities. This allows us to focus only on the long-term, since corporate bonds are typically defined as having an original maturity longer than a year. On the other hand, other countries do not provide such a maturity breakdown. For details on the scope of each country, please refer to the Annex.
UK56%
US
28%
Japan17%
Euro Area 18%
0
10
20
30
40
50
60 %
2000 '06 '12 '18
A. Foreign ownership percentage
18%
41%
58% 58%
95%
0
20
40
60
80
100 %
Euro Area Italy Germany France Netherlands
B. Foreign ownership % in the Euro Area (excluding intra-EA positions) vs. individual EA countries (2018)

PART II. CORPORATE BOND INVESTORS AND RATING-BASED INVESTMENT
20 Corporate Bond Market Trends, Emerging Risks and Monetary Policy
US from 17.7% in 2000 to 28.1% in 2018. In the UK, which historically has had the highest portion of foreign bond ownership, it increased from 44.6% in 2000 to 56.1% in 2018. As a consequence the UK data only make it possible to identify the specific categories of bond investors for the remaining 43.9% of the outstanding amount of corporate bonds issued by UK corporations. However, for Japan, the euro area and the US, between 72% and 83% of the bondholders can be identified at a more detailed level. Panel B of Figure 13 provides a comparison of foreign ownership in the euro area as a whole as well as selected euro area countries as of year-end 2018. Foreign ownership for the euro area is computed by first aggregating national data and then eliminating cross-border positions between euro area countries from what is reported as foreign ownership in the individual national financial accounts. This means that the holdings of the residents of Italy in German companies’ corporate bonds are not reported as foreign ownership in the euro area data. Because European countries have significant amounts of cross holdings among each other, individual European countries report a high portion of foreign ownership of corporate bonds, while the euro area figure remains comparatively low. Among the selected countries, the Netherlands has the highest portion of foreign ownership (95%), followed by Germany and France (both 58%), and Italy (41%). In contrast, the aggregate euro area figure stands at only 18%. Since the euro area data allow to identify the individual categories of owners for 82% of the outstanding corporate bond volume, the focus remains on the euro area, instead of the individual euro area countries. When it comes to the classification of different categories there are some differences between countries. For the purpose of achieving broad comparability across countries and consistency with internationally accepted standards for sector classification,5 the following investor categories are identified: Financial sector:
Monetary financial institutions (MFIs): Central banks, money market funds, deposit-taking corporations.
Insurance corporations and pension funds (including public pension funds) Investment funds: All collective investment schemes such as open- and
closed-end investment funds (including exchange traded funds), real estate investment funds, funds of funds, hedge funds.
Other financial institutions: Financial auxiliaries, captive financial institutions and money-lenders, other financial intermediaries except insurance corporations and pension funds.
Non-financial sector: Household sector: Households and non-profit institutions serving households
(NPISHs). General government: Central, state and local governments. Non-financial corporations
5 Japan adopts the System of National Accounts of the United Nations (2008 SNA) and the US maps its own classification to 2008 SNA sectors. The UK and the euro area adopt the European System of National and Regional Accounts (ESA 2010), which is broadly consistent with the 2008 SNA.
PART II. CORPORATE BOND INVESTORS AND RATING-BASED INVESTMENT
Corporate Bond Market Trends, Emerging Risks and Monetary Policy 21
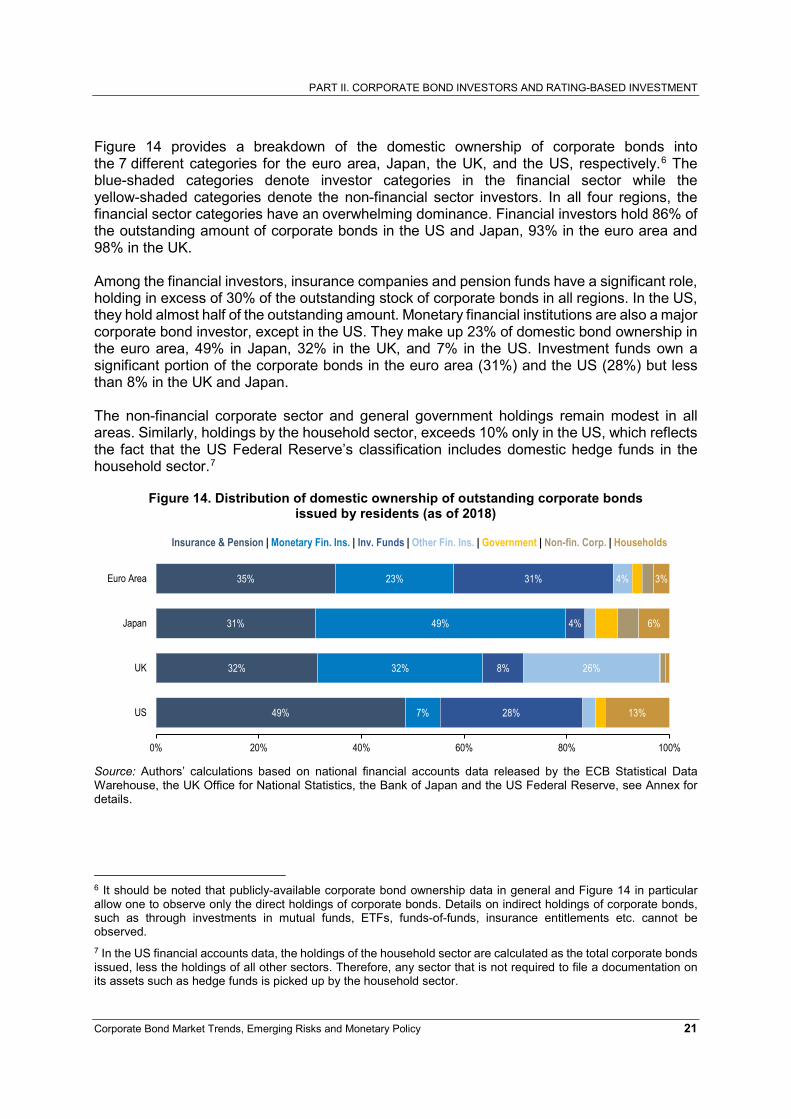
Figure 14 provides a breakdown of the domestic ownership of corporate bonds into the 7 different categories for the euro area, Japan, the UK, and the US, respectively.6 The blue-shaded categories denote investor categories in the financial sector while the yellow-shaded categories denote the non-financial sector investors. In all four regions, the financial sector categories have an overwhelming dominance. Financial investors hold 86% of the outstanding amount of corporate bonds in the US and Japan, 93% in the euro area and 98% in the UK. Among the financial investors, insurance companies and pension funds have a significant role, holding in excess of 30% of the outstanding stock of corporate bonds in all regions. In the US, they hold almost half of the outstanding amount. Monetary financial institutions are also a major corporate bond investor, except in the US. They make up 23% of domestic bond ownership in the euro area, 49% in Japan, 32% in the UK, and 7% in the US. Investment funds own a significant portion of the corporate bonds in the euro area (31%) and the US (28%) but less than 8% in the UK and Japan. The non-financial corporate sector and general government holdings remain modest in all areas. Similarly, holdings by the household sector, exceeds 10% only in the US, which reflects the fact that the US Federal Reserve’s classification includes domestic hedge funds in the household sector.7
Figure 14. Distribution of domestic ownership of outstanding corporate bonds issued by residents (as of 2018)
Source: Authors’ calculations based on national financial accounts data released by the ECB Statistical Data Warehouse, the UK Office for National Statistics, the Bank of Japan and the US Federal Reserve, see Annex for details.
6 It should be noted that publicly-available corporate bond ownership data in general and Figure 14 in particular allow one to observe only the direct holdings of corporate bonds. Details on indirect holdings of corporate bonds, such as through investments in mutual funds, ETFs, funds-of-funds, insurance entitlements etc. cannot be observed. 7 In the US financial accounts data, the holdings of the household sector are calculated as the total corporate bonds issued, less the holdings of all other sectors. Therefore, any sector that is not required to file a documentation on its assets such as hedge funds is picked up by the household sector.
35%
31%
32%
49%
23%
49%
32%
7%
31%
4%
8%
28%
4%
26%
3%
6%
13%
0% 20% 40% 60% 80% 100%
Euro Area
Japan
UK
US
Insurance & Pension | Monetary Fin. Ins. | Inv. Funds | Other Fin. Ins. | Government | Non-fin. Corp. | Households

PART II. CORPORATE BOND INVESTORS AND RATING-BASED INVESTMENT
22 Corporate Bond Market Trends, Emerging Risks and Monetary Policy
While the holdings by non-financial corporations remain below 5% in all regions, it should be noted that the US financial accounts data do not report the holdings by non-financial corporations separately. However, as discussed in Section 2.2.b below, a more detailed analysis shows that non-financial US corporations have increased their corporate bond investments significantly since the financial crisis. Because these corporations typically invest through their foreign subsidiaries, it is likely that their corporate bond investments are recorded as foreign ownership. While China is not represented in Figure 14, it has played a pivotal role in the recent growth of the global corporate bond market. It has moved from an insignificant level of issuance prior to the 2008 financial crisis to a record amount of USD 601 billion in 2016, making Chinese companies the second largest issuers in the world. Despite the importance of the Chinese bond market, there are no publicly available data on the different categories of investors that hold the outstanding stock of Chinese corporate bonds. Instead, Panel A in Figure 15 provides annual data from mainland China on the different investor categories’ net transactions of corporate bonds between 2011 and 2016.8 The figure shows that financial institutions accounted for almost all corporate bond purchases throughout the 2011-2016 period. Only in 2015 did the non-financial sector, including government, account for any significant portion of domestic purchases (28%). The large gap between the non-financial and financial sectors is similar to that observed in the other regions analysed in Figure 14.
Figure 15. Investor base of corporate bonds issued by non-financial companies in China
Source: Authors’ calculations based on national financial accounts data released by the National Bureau of Statistics of China, see Annex for details.
A distinctive characteristic of the Chinese corporate bond market is the limited presence of foreign investors. According to the transaction data, for the period 2011-2016, it was only in 2014 that foreign investors made a positive investment in the Chinese corporate bond market. Cerutti and Obstfeld (2019) report that foreign participation in Chinese bond markets
8 Note that the China Statistical Yearbook discloses the transaction data with a 2-year lag. Therefore, the latest data available from the China Statistical Yearbook 2018 are as of 2016.
- 500
500
1 500
2 500
3 500
CNY 4 500 Bn.
2011 2012 2013 2014 2015 2016
A. Net transactions in corporate bonds
Fin. Inst. Non-fin. Govt. Households Rest-of-world
Fin. Inst. 90%
Non-fin. 5%Govt. 3%Households 3%
0
20
40
60
80
100 %
B. Estimated share of investors (2016)

PART II. CORPORATE BOND INVESTORS AND RATING-BASED INVESTMENT
Corporate Bond Market Trends, Emerging Risks and Monetary Policy 23
represents only about 1.6% of the total value of outstanding bonds and that much of these bonds are issued by the government. In a related article, Longmei and Yuchen (2019) estimate that foreign investors currently hold less than 1 percent of Chinese credit bonds. Our corporate bond issuance data indicate that during the period 2011-2016, foreign-exchange denominated bonds constituted, on average, 6.4% of the total amount issued by all Chinese non-financial companies. Panel B of Figure 15 provides an estimated distribution of the outstanding stock of Chinese corporate bonds across different investor groups. This estimate is calculated based on the assumption that prior to 2011, the stock of corporate bonds in China was negligible. This is not an unrealistic assumption given that corporate bond issuance in China remained close to zero prior to 2009. Given this assumption, the estimated ownership shares reported in Panel B are calculated by cumulating the yearly net corporate bond transactions of each investor group. As in Figure 14, foreign investors are excluded from the analysis. On this basis it is estimated that, as of 2016, the financial sector in China holds 90% of the outstanding amount of corporate bonds. Non-financial corporations hold 5%, while the general government and households hold approximately 3% each. The very limited foreign ownership of Chinese corporate bonds may partly be explained by concerns about the credit rating industry in China. In 2018, for instance, two Chinese regulators suspended Dagong Global Credit Rating, one of China’s three main rating agencies, from rating debt instruments citing chaotic management, high fees charged to issuers for consulting services, unqualified senior management, and problems with the financial models that were used in bond ratings (Wildau, 2018). It is interesting to note, that of the 1 744 Chinese bond issuers rated as of June 2018, 97% were rated AA or above, according to China’s National Association of Financial Market Institutional Investors (Cook, 2019). In contrast, globally, less than 5% of Moody’s-rated companies have a rating AA- or above (MIS, 2019). Until very recently, none of the global credit rating agencies was accredited to rate Chinese companies in the domestic market. They were only able to assign credit ratings for Chinese firms that issue bonds in overseas markets. According to a BIS study, on jointly-rated bond issues, Chinese credit rating agencies on average assign 6-7 notches higher ratings compared to their international peers (Jiang and Packer, 2017). In January 2019, S&P Global became the first international credit rating agency to receive permission from People’s Bank of China to begin offering credit rating services through a wholly-owned local unit. Fitch Ratings and Moody’s have also applied for licenses to conduct rating services in China (Zhu et al., 2019). The entry of global rating agencies into the Chinese domestic market is expected to provide greater comfort to potential foreign investors and help attract foreign investment into the country’s corporate bond market.
2.2. Recent developments in the investor landscape
2.2.a. Financial Investors
Figure 16 presents how the distribution of bond ownership among different categories of financial investors has evolved in the US, the UK, the euro area and Japan. For each region, their ownership is expressed as percentages of the total amount of domestic corporate bonds issued by corporate residents in that region. With regular reference to Figure 16, the evolution of corporate bond ownership for each of the four types of financial investors identified in section 2.1 is discussed.

PART II. CORPORATE BOND INVESTORS AND RATING-BASED INVESTMENT
24 Corporate Bond Market Trends, Emerging Risks and Monetary Policy
Figure 16. Evolution of financial institutions’ ownership share in the corporate bond market (% of total domestic ownership)
Source: Authors’ calculations based on national financial accounts data released by the ECB Statistical Data Warehouse, the UK Office for National Statistics, the Bank of Japan and the US Federal Reserve, see Annex for details.
Monetary Financial Institutions
According to Figure 16, Monetary Financial Institutions (MFIs), which include banks, central banks and money market funds, decreased their ownership share in the corporate bond market in the US and the UK after the financial crisis. In both countries, they also decreased their absolute amount of corporate bond holdings. The Volcker Rule, which is a part of the Dodd-Frank Wall Street Reform and Consumer Protection Act, is likely to have played a role in the decline in bond holdings of US banks. The Volcker Rule allows banks to facilitate client trades as market makers but prohibits banks from trading securities on their own accounts and to make speculative bets. Although banks were required to fully comply with the Volcker rule only by July 2015, it is likely that they took steps to adjust their activities and balance sheets in anticipation of the rule, which was originally issued in 2010. In contrast to the US and the UK, MFIs in the euro area and Japan have increased their ownership share in the corporate bond market. A contributing factor to this increase is that both the ECB and the Bank of Japan (BoJ) as part of their monetary policies entered the domestic corporate bond market as investors. In February 2009, the BoJ announced that short-term corporate bonds with a rating of A or higher would be eligible for a purchase programme that ran until December 2009 (BoJ, 2009a, BoJ 2009b). The programme was later resumed under the “Asset Purchase Program”, which was launched in October 2010. Under this new programme, longer-term corporate bonds rated BBB were also deemed eligible for purchase (BoJ, 2010). In April 2013, the BoJ released its decision to purchase and continuously hold up to JPY 3.2 trillion worth of corporate bonds (BoJ, 2013a). The BoJ is also authorised to purchase non-investment grade bonds that are fully guaranteed by a company rated BBB or higher (BoJ, 2010; BoJ, 2013b). As of the end of September 2019, the BoJ corporate bond holdings amount to JPY 3.1 trillion (USD 29.2 billion). The European Central Bank (ECB) started to buy corporate bonds in June 2016 under its “Corporate Sector Purchase Programme” (CSPP). As part of this programme, selected Eurosystem central banks can purchase investment grade euro-denominated bonds issued by non-bank corporations established in the euro area (ECB, 2016b). In case a corporate bond loses its eligibility after the purchase, e.g. due to a downgrade to a non-investment grade rating, the central banks may choose to, but are not required to sell the bond (ECB, 2019d). The net purchases under the CSPP came to an end in December 2018. However, the ECB expressed its intention to fully reinvest the principal payments that they received from maturing
01020304050
60%
'00 '06 '12 '18
A. United States
'00 '06 '12 '18
B. United Kingdom
'00 '06 '12 '18
C. Euro Area
Insurance & Pension
MFIs
Investment FundsOther Fin. Inst.
'00 '06 '12 '18
D. Japan

PART II. CORPORATE BOND INVESTORS AND RATING-BASED INVESTMENT
Corporate Bond Market Trends, Emerging Risks and Monetary Policy 25
bonds for an extended period of time (ECB, 2018). As presented in Figure 17, since the beginning of 2019, the outstanding amount of corporate bonds held through the CSPP has been approximately EUR 178 billion. After the ECB announced in September 2019 its plans to resume the asset purchase program and started repurchases in November 2019, its corporate bond holdings moved up to EUR 184.8 billion (USD 205.3 billion) within two months.
Figure 17. Central banks’ corporate bond holdings: BoJ and Eurosystem Central Banks
Source: ECB, Bank of Japan.
Similar to its Japanese and European counterparts, the Bank of England (BoE) also engaged in a corporate bond purchase programme, albeit for a shorter period and with a smaller dedicated budget. The purchases under BoE’s “Corporate Bond Purchase Scheme” (CBPS) began in September 2016 and ceased in April 2017 when it reached the GBP 10 billion target. Bank of England stipulated that eligible corporate bonds had to be issued by companies that make a material contribution to the UK economy, be denominated in GBP and rated investment grade (BoE, 2016 and 2017). The BoE decided to reinvest the cash received from maturing bonds held under the CBPS, with the first reinvestment operation taking place in September 2019 (BoE, 2019c). As of year-end 2019, BoE’s corporate bond holdings stand at GBP 9.85 (USD 12.91) billion (BoE, 2020). The one common eligibility criterion that the BoJ, the ECB and the BoE all adopt is the requirement that the corporate bonds have an investment grade rating. Such limiting of the investment universe to investment grade bonds is typically not a hard constraint for deposit-taking institutions other than the central banks. However, the immediate link between the quality of the bonds that they hold and capital adequacy requirements still makes their investment choices sensitive to bond ratings. Of particular importance is the distinction between bonds that are rated as investment grade and bonds that are rated as non-investment grade. The Basel II capital adequacy framework was revised in the aftermath of the financial crisis with an aim to make the banks and the banking system more resilient to possible future shocks. An initial version of the Basel III framework was agreed by the members of the Basel Committee on Banking Supervision (BCBS) and issued in December 2010.9 After several revisions and consultations with the industry and other stakeholders, the framework was finalised in December 2017 and included some adjustments with respect to the capital
9 Currently, BCBS has 28 member jurisdictions: Argentina, Australia, Belgium, Brazil, Canada, China, European Union, France, Germany, Hong Kong (China), India, Indonesia, Italy, Japan, Korea, Luxembourg, Mexico, Netherlands, Russia, Saudi Arabia, Singapore, South Africa, Spain, Sweden, Switzerland, Turkey, United Kingdom, United States.
0
1 000
2 000
3 000
JPY 4 000 Bn.
2009 2011 2013 2015 2017 2019
A. Bank of Japan's corporate bond holdings
0
40
80
120
160
€ 200 Bn.
06/16 06/17 06/18 06/19
B. Eurosystem's corporate bond holdings

PART II. CORPORATE BOND INVESTORS AND RATING-BASED INVESTMENT
26 Corporate Bond Market Trends, Emerging Risks and Monetary Policy
requirements for holding corporate bonds. The Capital Requirements Regulation (CRR), which is the EU directive implementing the Basel III standards in the European Union, was published in June 2013 and became effective as of January 1, 2014. Although Basel III standards are designed, in principle, for internationally active banks, they are in most countries, applied to a broader set of banks. In a recent survey, of 100 non-BCBS jurisdictions, all 100 were found to have adopted some iteration of the Basel rules for the banks operating under their jurisdictions, which included non-internationally active banks (Hohl et al., 2018). Given its wide implementation across the world, the level of capital that the Basel framework requires for holding corporate bonds is quite likely to influence the structure of corporate bond holdings by banks. Figure 18 shows the risk weights assigned by the different versions of the Basel framework and CRR to obligations of corporations with varying credit quality.10 A higher risk weight leads to a higher capital requirement.
Figure 18. Risk weights assigned to corporate obligations
Source: BCBS (1988, 2004, 2017); European Commission (2013).
Under Basel II, the risk weight assigned to a corporate bond rated AA or higher is 20% and that assigned to an A rated bond is 50%. For BBB and BB rated corporate bonds the risk weight increases to 100%. Going from BB- to B+, the risk weight increases to 150% and remains at this level for all corporate obligations with a credit rating B+ or lower. With the Basel III revisions to the standardised approach for credit risk, which will be effective as of January 2022, however, the risk weight of BBB rated bonds is reduced to 75%, accentuating the segregation between investment and non-investment grade bonds. This change in risk weight is not observed in CRR. Indeed, the risk weight assigned to BBB rated corporate exposures was lowered after the release of the second consultative document on standardised approach for credit risk in December 2015 and upon receiving many comments in this direction.
10 The risk weights in Figure 18 apply only to banks who choose to adopt the standardised approach for credit risk. The standardised approach is relatively simple compared to the internal ratings-based (IRB) approach, which allows banks to calculate capital adequacy ratios based on their own internal models. According to BIS (2019), out of the 77 large internationally active banks (i.e. Tier 1 capital of more than EUR 3 billion) contributing the necessary data to the Basel III monitoring exercise, 7 (i.e. 9%) use only the standardised approach for credit risk. On the other hand, out of the remaining 63 banks, which are either smaller or not internationally active, 35 (56%) use only the standardised approach. Furthermore, according to ESMA (2015) even IRB-adopting banks will be required to meet an “output floor”, which is calculated as a percentage of the capital required under the standardised approach. The output floor is intended to limit the benefits banks can derive by using internal models.
20% 20%50%
75%
100%
150%
100%
0
30
60
90
120
150 %
AAA AA A BBB BB B+ and lower
Basel III Basel II & Capital Requirements Regulation Basel I

PART II. CORPORATE BOND INVESTORS AND RATING-BASED INVESTMENT
Corporate Bond Market Trends, Emerging Risks and Monetary Policy 27
How BBB rated bonds are treated with respect to capital requirements is of course of particular importance given that they now dominate the investment grade market.
Insurance companies and pension funds
As shown in Figure 16 above, insurance companies and pension funds have traditionally been a dominant investor in the corporate bond market in all four regions. In the US, their relative share of corporate bond holdings decreased until the 2008 financial crisis as other types of investors, including MFIs increased in importance. Since the crisis their share of holdings has increased steadily and is now back to almost 50%. In the euro area as well, insurance companies and pension funds have been the largest holders of corporate bonds in every year for which data are available. In 2013, they accounted for 39% of the market but have declined slightly to 35% at the end of 2018 because of the increased holdings by MFIs. In the UK and Japan however, insurance companies and pension funds have lost their leading position in the corporate bond market to MFIs after the financial crisis, but they still hold 32% and 31% of the outstanding amount of corporate bonds, respectively. Since insurance (especially life-insurance) companies and pension funds typically have long-term obligations to their clients, long-term debt securities are generally well-suited to meet their liability structure. However, due to different kinds of quantitative regulatory constraints, they are not completely flexible in their investment choices. There are two principally different types of quantitative investment regulations that influence their investments: First, risk-based capital regimes that influence their portfolio composition by dictating a higher capital charge for assets with a higher level of risk. Second, quantitative investment limits that influence their portfolio composition through pre-defined limits on certain types of investments. In recent years, there has been a clear trend for countries to move to risk-based capital regimes in the regulation of insurance companies. Many countries, including Australia, the EU countries, Canada, Japan, Korea, Mexico, Switzerland, US, South Africa, have already adopted a risk-based regime. A risk-based capital regime requires that insurance companies hold more capital for their investments in lower-rated debt securities. Such risk-based capital requirements are for example part of the Solvency II Directive, which insurance companies within the EU have been subject to since January 2016. In contrast, risk-based capital requirements for pension funds are still rare and as of 2015, were adopted only in a few OECD countries, namely Denmark, Finland, Ireland, the Netherlands and Sweden (OECD, 2015). Adoption of risk-based capital regimes for insurance companies has generally led to a shift to market-based and market-adjusted valuations of assets and liabilities. In the case of an economic downturn, the value of assets generally declines while the value of liabilities typically remains unchanged or declines less than asset values. If this difference causes the risk-based solvency ratio to approach or fall below the minimum required ratio, the insurance company must reduce the risk by shifting to less risky assets. This may result in quite rapid sales (so-called fire sales) of the more risky assets that require higher capital charges (OECD, 2015). Ellul et al. (2011) investigate such fire sales of downgraded corporate bonds that were induced by regulatory constraints on insurance companies. Based on a dataset of 1 179 corporate bonds that were downgraded to non-investment grade, the authors find that insurance companies which have a lower risk capacity and so are relatively more constrained by regulation than other institutions are more likely to immediately sell their holdings of a downgraded bond. They also concluded that their forced sales of downgraded bonds caused bond prices to decline below fundamental values. Prices reverted fully only 35 weeks after the

PART II. CORPORATE BOND INVESTORS AND RATING-BASED INVESTMENT
28 Corporate Bond Market Trends, Emerging Risks and Monetary Policy
downgrade event. It is plausible that this extended period of undervaluation depends on the difficulty of finding buyers in a market where many of the large potential buyers are also bound by various types of restrictions, such as risk-based capital requirements, quantitative regulatory limits, self-defined investment policies or investment mandates (Duffie et al., 2007). In order to establish and verify the various risks that institutions and regulators have to monitor under a risk-based regime, market participants and regulators alike rely extensively on external ratings by rating agencies. A report from ESMA, which examined the extent to which EU regulations relied on external credit rating firms, concluded that they play an important part when applying the Solvency II framework in practice. Importantly, they are used to estimate the counterparty risk, market risk, spread risk, and concentration risk for the insurance and reinsurance companies that adopt the Standard Approach of Solvency II (ESMA, 2015). Likewise, in the US, according to guidelines from the National Association of Insurance Commissioners (NAIC), capital requirements for insurance companies increase significantly when the quality of the securities that they hold, as measured by ratings firms, decreases. When moving from the lowest investment grade category (BBB) to the highest non-investment grade category (BB), the capital charge for credit risk increases 3.5-fold (Becker and Ivashina, 2015). Due to the move towards risk-based capital requirements, the use of other quantitative limits on insurance companies are becoming less common. However, some countries do put pre-defined quantitative limits on the portion of non-investment grade debt, while others define a minimum acceptable credit rating. Chile, for instance, limits the exposure to unrated or non-investment grade debt securities through a 5% ceiling (OECD, 2015). Likewise, in the US, although generally not binding, NAIC guidelines put a restriction of 20% for all non-investment grade bonds as a percentage of the portfolio. While risk-based capital requirement rules are uncommon in pension fund regulation, many countries still impose different types of quantitative investment limits on pension funds. (OECD, 2015; OECD, 2018). One example is regulatory limit on foreign investments. In some countries (e.g. India and Egypt) pension funds are completely prohibited from investing abroad, while some other countries (e.g. Finland, Iceland, Luxembourg, Mexico, Norway, Portugal) limit foreign investments in countries that are considered “ineligible”. Some regulatory limits for pension funds relate specifically to investments in corporate bonds. Pension funds in Greece, for example, are not allowed to invest more than 70% of their assets in corporate bonds and those in Turkey and Poland face a limit of 40%. In Hungary, the limit is 10%. Some other countries, such as Czech Republic, Korea, Mexico, and Pakistan, have ratings-based rules, where non-investment grade bonds often are prohibited or subject to stricter limitations than higher-rated bonds. Another type of restriction is limitations based on the liquidity of the instruments. Such restrictions are particularly relevant for corporate bond holdings, especially for holdings of non-investment grade bonds, due to their inherent illiquidity.
Investment Funds
As shown in Figure 16 above, investment funds have since 2008 increased their share of corporate bond ownership in all the 4 regions. In the Japan and UK, their ownership share increased from relatively low levels by 2.4 and 3.7 percentage points respectively during the last decade. US investment funds increased their portion of ownership from 9.9% in 2008 to 27.7% in 2018. Investment funds are large owners of corporate bonds also in the euro area holding more than one-quarter of the 2018 outstanding stock of corporate bonds. Investment

PART II. CORPORATE BOND INVESTORS AND RATING-BASED INVESTMENT
Corporate Bond Market Trends, Emerging Risks and Monetary Policy 29
funds in the UK and Japan, held 7.9% and 3.8% respectively of the domestic outstanding stock of corporate bonds. Figure 19 below provides a breakdown into the different types of investment funds for the US, where this data is available. According to the US statistics, investment funds include mutual funds, closed-end funds, exchange traded funds (ETFs) and real estate investment trusts (REITs). Panel A of Figure 19 presents the relative importance of these different types of investment funds. While closed-end funds and REITs have limited corporate bond holdings in both 2008 and 2018, the holdings by ETFs increased quite substantially from 3.9% to 16.4% at the expense of by far the largest holder, mutual funds, who declined from 88.6% to 78.8%.
Figure 19. Breakdown of corporate bond holdings among different types of US investment funds (2018 USD, billion)
Source: Financial Accounts of the United States.
According to Panel B of Figure 19, the value of corporate bond holdings by mutual funds almost tripled from USD 720 billion in 2008 to just over USD 2 trillion in 2018. During the same period, the portion of corporate bond holdings compared to their total financial assets increased from 10.7% to 13.7%. From a lower absolute level, the holdings of ETFs underwent an even larger change. Panel C of the figure shows that corporate bond holdings by ETFs increased 13-fold from USD 32 billion in 2008 to USD 420 billion in 2018. This means that corporate bonds now account for about 12% of the assets under management by US ETFs.11 The increased presence of ETFs in the corporate bond market is likely to increase the prevalence of passive investment strategies in the corporate bond market. Passively managed funds are likely to be attractive especially in a low interest rate environment such as the period following the financial crisis, since they are associated with lower expense ratios as compared to actively managed funds. Among the 100 largest US-listed ETFs by assets under management (AUM), 24 are bond ETFs.12 Only one of these 24 ETFs is actively-managed, while the other 23 track an index. The 2 largest bond ETFs, which together manage USD 105 billion of assets, track the same index, the Barclays Capital US Aggregate Bond Index, which includes a spectrum of investment grade fixed income securities, including US corporate
11 The analyses of US ETFs in this section cover their global investments as well as their investments in the US. It is estimated that by assets under management, the US ETFs account for approximately 71% of the global ETF industry. 12 Data on the 100 largest ETFs are obtained from the ETFdb.com website. Largest ETFs: Top 100 ETFs by Assets, ETFdb.com, https://etfdb.com/compare/market-cap/ (retrieved July 14, 2019).
79%
16%0
20
40
60
80
100%
Mutualfunds
ETFs Closed-end funds
REITs
A. Breakdown of Investment Funds' Corporate Bond Holdings
2008 2018
0
4
8
12
16 %
0
600
1 200
1 800
2 400
'00 '06 '12 '18
B. Mut. Funds' Corp. Bond Holdings
Amt. outstanding ($ bn.)% of fin. assets
0
4
8
12
16 %
0
100
200
300
400
500
'00 '06 '12 '18
C. ETFs' Corp. Bond Holdings
Amt. outstanding ($ bn.)% of fin. assets

PART II. CORPORATE BOND INVESTORS AND RATING-BASED INVESTMENT
30 Corporate Bond Market Trends, Emerging Risks and Monetary Policy
bonds. Furthermore, all of the 23 large passive ETFs are managed by 3 asset managers, namely BlackRock, Vanguard and State Street. Again, the distinction between investment and non-investment grade bonds tends to be important for bond ETFs. 13 of the 24 largest bond ETFs invest in corporate bonds and 10 of those 13 ETFs invest exclusively in investment grade bonds. Two of them invest only in non-investment grade bonds. The remaining 1 ETF, which is also actively-managed, declares that it primarily focuses on investment grade bonds. Hence, even the actively-managed ETF follows an investment rule based on the credit quality of the bond. Such passive reliance on indexes for investment decisions is also observed in the government bond market, where the inclusion of a given security into a widely-tracked index typically has a critical impact on asset allocations. For instance, the inclusion of 363 Chinese government and policy bank bonds into the Bloomberg Barclays Global Aggregate index in April 2019 is expected to direct USD 2 trillion of fund inflows into China’s onshore debt market over the 20-month phased inclusion period (Lockett, 2019). The increase in corporate bond ownership by investment funds has triggered some concerns in the market. One is the extent to which an economic downturn would lead to sell-offs that could destabilise the market and cause further negative effects on the real economy. This scenario may be aggravated by the inherent illiquidity of the corporate bond market where buyers may be hard to find, especially at times of market distress. Such a potential mismatch between the liquidity requirements of investment funds (due to the daily redemption promise) and the illiquidity of their holdings, including corporate bonds, is viewed as a structural vulnerability by the Financial Stability Board (FSB, 2017). This mismatch is likely to generate a first-mover advantage in investors’ decision to redeem their holdings. Indeed, Goldstein et al. (2017) find that corporate bond mutual fund outflows are more sensitive to bad performance than their inflows are sensitive to good performance. Furthermore, the sensitivity of outflows to bad performance is higher when the fund has more illiquid assets and in times of overall market illiquidity. This potential structural vulnerability arising from the liquidity mismatch of investment funds has recently been a major subject for discussion among supervisors and regulators. The FSB also issued recommendations to address structural vulnerabilities from asset management activities in 2017 (FSB, 2017). Some institutions, including the UK Financial Conduct Authority, the French AMF and the Hong Kong Securities and Futures Commission, have updated their regulatory framework or guidance relating to liquidity risk management of investment funds. And at the request of FSB, IOSCO published recommendations on liquidity risk management for collective investment schemes, detailing how an effective liquidity risk management process could be achieved (IOSCO, 2018). Other Financial Institutions The share of “other financial institutions” in total domestic ownership of corporate bonds has remained limited in Japan and the euro area where it has never exceeded 6% (Figure 16). In the UK, however, their share increased from 16% in 2007 to 25% in 2008 and has remained around this level thereafter. In the US, the share of other financial institutions gradually declined from 15% in 2007 to 2% in 2018. Importantly and linked to the discussion about bond market illiquidity, this significant decrease can partly be explained by a significant reduction in corporate bond holdings by security brokers and dealers. Based on US financial accounts data,

PART II. CORPORATE BOND INVESTORS AND RATING-BASED INVESTMENT
Corporate Bond Market Trends, Emerging Risks and Monetary Policy 31
Panel A of Figure 20 presents the sharp reduction in the corporate bond holdings of securities brokers and dealers from USD 464 billion in 2007 to USD 63 billion in 2018. To complement the observations from Panel A, Panel B presents the evolution of net corporate bond positions of primary dealers. The panel shows a downward trend in their holdings of both investment grade and non-investment grade corporate bonds. During the first 2 years from April 2013 to April 2015, investment grade positions averaged USD 11.1 billion. Since then the positions have averaged USD 6.3 billion. Similarly, while non-investment grade corporate bond positions averaged USD 6.5 billion in the former period, they have averaged USD 2.0 billion in the period after April 2015.13 The decline in non-investment grade bond positions (69%) was proportionately larger compared to that in investment grade positions (43%). And it should be noted that these sharp declines have taken place during a period when corporate bond issuance and outstanding amounts have grown at record rates. Furthermore, in 2019, the net positions turned negative to levels that never have been observed.
Figure 20. Securities brokers and dealers’ corporate bond holdings and primary dealer inventories in the US
Source: Panel A data are obtained from Financial Accounts of the United States and Panel B data are obtained from Federal Reserve Bank of New York / Primary Dealer Statistics.
In contrast to the stock market, secondary corporate bond market has traditionally been an over-the-counter market with most trades intermediated by dealers. Although in recent years, there is a move towards electronic trading platforms, which make direct matching of buyers and sellers possible, the heavy reliance on dealers continues. The sharp decline in dealers’ corporate bond inventories is argued to be the combined result of new regulations, such as the Basel III and the Volcker Rule, and a lower risk tolerance among dealers. Whether dealers will step in to facilitate trades and efficiently absorb imbalances between supply and demand during market turbulence, possibly caused by fire sales due to extensive rating downgrades and/or large redemptions of investment funds, remains to be seen.
13 Prior to January 2015, data based on a maturity breakdown of non-investment grade bonds were not available. Therefore, for dates prior to January 2015, the analysis is based on non-investment grade bonds of all maturities. However, in Figure 20, a comparison of the series of non-investment grade bonds of all maturities with the series of non-investment grade bonds having a maturity longer than 13 months reveals that the 2 series are actually very close to each other.
0
2
4
6
8
10%
0
100
200
300
400
500
2000 '06 '12 '18
A. Broker&Dealers' Corp. B. Holdings(2018 USD, billion)
Amt. outstanding ($ bn.)% of fin. assets
-12
-6
0
6
12
$18 bn
Apr '1
3
Oct '1
3
Apr '1
4
Oct '1
4
Apr '1
5
Oct '1
5
Apr '1
6
Oct '1
6
Apr '1
7
Oct '1
7
Apr '1
8
Oct '1
8
Apr '1
9
Oct '1
9
B. Net Corporate Bond Positions of Primary Dealers (Apr '13 - Jan '20)Non-IG, all maturities Non-IG, due > 13 monthsIG, due > 13 months

PART II. CORPORATE BOND INVESTORS AND RATING-BASED INVESTMENT
32 Corporate Bond Market Trends, Emerging Risks and Monetary Policy
2.2.b. Non-Financial Investors
Figure 21 presents corporate bond ownership by households, non-financial corporations and the general government. According to the figure, corporate bond holdings by the non-financial sector have historically been quite modest. The exception is the US household sector, which as mentioned above, also includes domestic hedge funds and has seen a sharp decline since 2011.
Figure 21. Evolution of non-financial sector’s ownership share in the corporate bond market (% of total domestic ownership)
Source: Authors’ calculations based on national financial accounts data released by the ECB Statistical Data Warehouse, the UK Office for National Statistics, the Bank of Japan and the US Federal Reserve, see Annex for details.
Seen over the whole period, corporate bond ownership by households has declined also in the UK and the euro area. It is important however to note that Figure 21 only reports the direct holdings of households in the corporate bond market. Their exposure to bonds as an asset class would obviously be higher if indirect holdings through pension and insurance entitlements and different kinds of investment funds were included. OECD National Accounts Data from 28 OECD countries for which data are available, indicate that the portion of the household sector’s total financial assets that are held indirectly through different investment vehicles increased from an average of 26% in 2000 to 32% in 2017. Indeed, in all but five of the 28 countries, households’ indirect ownership has increased. This means that households’ exposure to different asset classes, including corporate bonds, increasingly depends on the investment strategies and asset allocations of investment funds, pension funds and insurance corporations. According to Figure 21, the share of non-financial corporations in the total domestic ownership of corporate bonds is below 5% in all regions but there is a modest upward movement in their share in Japan. It should be noted that the US national financial accounts data do not present the corporate bond holdings of non-financial US companies separately. However, looking directly at the financial statements of large US companies suggests a major increase in their corporate bond investments, which is a trend that has received attention from the financial media too (Platt et al., 2017). Figure 22 presents data for the 25 non-financial US companies with the largest investment portfolios.14 Together these companies account for 13% of the aggregate investment portfolio value of publicly listed firms around the world. Panel A of the figure reports the size of the investment portfolio of each company as well as the value of their corporate debt securities holdings within this portfolio. The portfolio size of the company with the largest investment portfolio, for example, is USD 237.1 billion, of which USD 123.7 billion (52%) is in the form of 14 The ranking is done based on the size of the investment portfolio in 2018. The investment portfolio consists of cash and cash equivalents, short- and long-term investments and does not include investments on subsidiaries.
05
101520
25%
'00 '06 '12 '18
A. United States
'00 '06 '12 '18
B. United Kingdom
'00 '06 '12 '18
C. Euro Area
General Government
HouseholdsNon-financial corporations
'00 '06 '12 '18
D. Japan

PART II. CORPORATE BOND INVESTORS AND RATING-BASED INVESTMENT
Corporate Bond Market Trends, Emerging Risks and Monetary Policy 33
corporate debt securities. To put this figure into perspective, it can be noted that the combined assets under management of all the 6 largest ETFs that only invest in corporate debt securities is USD 124 billion. In other words, a single non-financial company, alone, owns as much corporate debt securities as the world’s 6 largest corporate bond ETFs.
Figure 22. Corporate debt securities investments of US non-financial companies with the largest investment portfolios
Note: For some of these companies, the financial / non-financial company distinction is less clear-cut. UnitedHealth Group, Cigna Corp, Anthem Inc. and Centene Corp. are classified by Thomson Reuters Eikon as non-financial companies under the sector “healthcare providers and services” although their SIC code (6324 – Hospital & medical service plans) is in the financial sector. Icahn Enterprises LP is classified by Thomson Reuters Eikon as a non-financial company under the sector “industrial conglomerates”, but its investments are mostly held by its investment segment rather than other industrial sectors. Coca-Cola Co. and Uber Technologies Inc. were excluded from the analysis as a clear breakdown to identify their corporate debt securities investments was not available in their SEC filings. In Panel B, 3 companies (Facebook, CVS Health and DuPont de Nemours) out of the 25 do not have the necessary data to calculate this ratio in 2009. To increase data consistency while adjusting the scope, investments reported under headings such as corporate debt securities, corporate notes, corporate bonds and commercial papers are all recorded as corporate debt securities investments.
Source: SEC 10-K filings of companies, Thomson Reuters Eikon, see Annex for details. Together, these 25 companies have an investment portfolio of USD 1.12 trillion and they own approximately USD 356 billion of corporate debt securities. Panel B of Figure 22 presents how the share of corporate debt securities in the investment portfolio has changed from 2009 to 2018. According to the figure, 15 of the 22 companies, for which data are available in both
0 50 100 150 200 $ 250 Bn.
CenteneIcahn EnterprisesBooking Holdings
IntelMerck
VisaDuPont de NemoursJohnson & Johnson
PfizerCVS Health
AnthemGeneral Motors
AmgenGilead Sciences
CignaFord Motor
OracleFacebook
AmazonUnitedHealth
CiscoGeneral Electric
AlphabetMicrosoft
Apple
A. Portfolio inc. cash and eq., short- and long-term invt. (2018)
Corporate debt securities Other holdings
0 10 20 30 40 50 60 70 %
CenteneIcahn EnterprisesBooking Holdings
IntelMerck
VisaDuPont de NemoursJohnson & Johnson
PfizerCVS Health
AnthemGeneral Motors
AmgenGilead Sciences
CignaFord Motor
OracleFacebook
AmazonUnitedHealth
CiscoGeneral Electric
AlphabetMicrosoft
Apple
B. Corporate debt securities (% of investment portfolio)
2009 2018

PART II. CORPORATE BOND INVESTORS AND RATING-BASED INVESTMENT
34 Corporate Bond Market Trends, Emerging Risks and Monetary Policy
years, increased corporate debt securities’ share in their portfolio. While the median company allocated 15.6% of its investment portfolio to corporate debt securities in 2009, that share increased to 27.2% in 2018. Figure 23 reports the evolution of the aggregate corporate debt securities portfolio of these 25 companies from 2009 to 2018. According to the figure, their combined holdings has tripled since the financial crisis, from USD 119 billion in 2009 to USD 356 billion in 2018. A similar increase can be observed for the average portion of corporate debt securities in their investment portfolios.
Figure 23. Aggregate corporate debt securities investments of 25 US non-financial companies with the largest investment portfolios (2018 USD, billion)
Source: SEC 10-K filings of companies, Thomson Reuters Eikon, see Annex for details.
Another important observation from reviewing the annual reports of these companies is their emphasis on rating-based investment. Of the 25 companies, 18 state that they take into account debt securities’ ratings in their investment policies. And 13 of those 18 companies make a clear distinction between investment and non-investment grade debt securities and state that their investment portfolios primarily consist of investment grade securities. One company specifically states that it manages the credit risk and average maturity of its fixed-income portfolio in such a way that it achieves economic returns that correlate to certain fixed-income indices. Furthermore, there is evidence that some companies have lowered or removed their minimum credit rating requirement in the last decade. For instance, while one company stated in its 2009 annual report that its marketable securities portfolio was invested primarily in securities with a minimum rating of A, this requirement was lowered to the investment grade threshold of BBB- in its 2012 annual report. Similarly, another company still has a reference to credit ratings in the description of its investment policy, but it no longer refers to a minimum investment grade rating requirement as it did in its 2015 annual report.
0
6
12
18
24
30%
0
100
200
300
400
USD 500 Bn.
2009 2012 2015 2017 2018
Aggregate corporate debt securities portfolio% of investment portfolio (median)

Corporate Bond Market Trends, Emerging Risks and Monetary Policy 35
PART III. CREDIT RATING METHODOLOGIES AND TRENDS IN RATING CHANGES
Part II illustrates that external credit ratings play a pivotal and increasingly important role in the corporate bond market by influencing the investment decisions and asset allocation of financial and non-financial institutions in a number of different ways. One is through regulations that use external credit ratings to define quantitative limits and risk-based capital requirements. Frequently, credit ratings also dictate investment choices through self-defined policies that focus exclusively or primarily on buying investment grade bonds, as in the case of central banks (e.g. BoE, BoJ and ECB) and non-financial corporations. Importantly, large bond investors, such as investment funds are typically bound by rating-based indexes and investment mandates that are defined with reference to ratings. Furthermore, cross-border investments in corporate bonds, which now constitute a significant share of the market, are also likely to depend on rating- or index-based strategies. It could be argued that instead of relying on the services of credit rating agencies (CRAs), institutional investors could have their own credit rating staff and internal methodologies to evaluate the credit worthiness of each corporate bond issue. Properly staffed, this could make investors better informed about what they are investing in and better placed to evaluate whether the associated risks are within their risk tolerance. Although it is likely that institutional investors actually have some staff dedicated to evaluating bond issues quality, it would be unrealistic to expect them to set aside resources to fully analyse the credit worthiness of each and every corporate bond issue at initiation and on an ongoing basis. In 2019 alone 7 865 new corporate bond tranches came to the market, corresponding to 6 798 bond issues by 3 672 unique non-financial bond issuers. More generally, in every year after 2008, the number of new bond tranches issued exceeded 4 000 and averaged 5 913 annually. Hence, unlike the equity market, where there is typically a single instrument for each company and where the annual number of new issues is more limited, a single issuer in the corporate bond market may have hundreds of corporate bonds, each with different risk characteristics. In such a market, a consolidation of the efforts to evaluate the quality of different securities may be unavoidable and rational. Another obstacle that may hinder individual investors to evaluate individual bond issues may be the issuers’ reluctance to share sensitive business information with each potential investor. Since such information may still be relevant and necessary to properly determine the credit worthiness of a bond issue, the most practical solution may be sharing the proprietary data only with a limited number of CRAs. Given their central role and the heavy reliance among both investors and regulators on external credit ratings, the quality and functioning of the credit rating industry play an important role when assessing the robustness and direction of the corporate bond market. In particular, because the distinction between investment and non-investment grade bonds play a critical role for investors’ asset allocation. To complete the overview of today’s corporate bond market, this section will therefore focus on the credit rating industry by using publicly available data from the 3 leading credit rating agencies, Standard & Poor’s (S&P), Moody’s and Fitch, which together received 93.5% of global revenues generated by the credit rating industry in 2018

PART III. CREDIT RATING METHODOLOGIES AND TRENDS IN RATING CHANGES
36 Corporate Bond Market Trends, Emerging Risks and Monetary Policy
(SEC, 2020).15 Since CRAs are legally required to disclose information about their rating procedures and methodologies, all of the three leading CRAs provide a significant amount of comparable information in these respects.
3.1. How ratings are assigned
According to the filings of the three large CRAs with the US Securities and Exchange Commission (SEC), the general rating assignment procedure is quite similar across the agencies.16 The rating process starts with a request from an issuer, arranger, sponsor or underwriter or is initiated by the CRA itself on an unsolicited basis. Upon initiation, an analytical team and a lead analyst are assigned to collect the necessary information and carry out the analysis with respect to the agency-defined rating methodology and criteria. The analyst then makes a rating recommendation and presents it to the agency’s rating committee with supporting materials. The final rating decision is taken by the vote of the rating committee, not by an individual analyst. The rating decision is then communicated to the issuer. After the issuer reviews the rating documentation to ensure factual accuracy and the non-presence of proprietary information, the rating is disseminated to the public. The rating is then monitored on an ongoing basis and reviewed by the agency at least annually. The rating analysis is typically supported by statistical methods. In addition to improving the predictive performance of credit ratings, standardised statistical methods also help dealing with the large number of instruments that have to be rated in today’s financial markets. To give some perspective, for instance, as of year-end 2018 S&P employed 1 557 credit analysts covering their 1 058 211 outstanding ratings and the rating of new issues coming to the market. Of the outstanding ratings, 65 551 were associated with securities issued by financial institutions (including insurance companies) and 54 510 were associated with securities issued by corporate issuers.17 Despite the increasing role of quantitative models and standardised methods in the rating process, CRAs emphasise that their ratings are not simply driven by formulas. In its rating methodologies, Moody’s provides a scorecard that summarises the qualitative considerations, the financial information and the ratios that are most important for its rating analysis, as well as their respective weights. Moody’s notes that the actual weights for each factor shown on the scorecard may differ on a case-by-case basis, and that the rating methodologies are not intended to include an exhaustive discussion of all factors that are considered when assigning ratings. Nevertheless, the scorecards can provide a general idea of the relative weight of quantitative and qualitative factors that are likely to affect ratings.
15 Note that this percentage is reported as a share of the total revenue generated by the CRAs which have received the “Nationally Recognized Statistical Rating Organizations” (NRSRO) designation from the US Securities and Exchange Commission. 16 Information on the procedures and methodologies for determining credit ratings is obtained from each CRAs’ Form NRSRO filing dated 31 December, 2018. 17 The number of ratings outstanding and the number of analysts as of year-end 2018 is obtained from SEC (2020).

PART III. CREDIT RATING METHODOLOGIES AND TRENDS IN RATING CHANGES
Corporate Bond Market Trends, Emerging Risks and Monetary Policy 37
As of September 2019, Moody’s has separately defined rating methodologies for 48 different non-financial industries. Although the weights of each factor typically vary across industries, there are 5 main rating factors that are kept consistently across 44 of the 48 industries.18 These 5 main factors are (i) leverage and coverage, (ii) scale, (iii) profitability, (iv) business profile, and (v) financial policy. In some industries, these factors are further broken down into sub-factors. As the factor names suggest, the first 3 factors are calculated solely based on financial or other business data. The “leverage and coverage” factor is typically divided into sub-factors that measure the leverage and interest coverage of a given company through financial ratios such as debt / earnings before interest, taxes, depreciation and amortisation (EBITDA); retained cash flow / net debt; earnings before interest, taxes and amortisation (EBITA) / interest expense, etc. The “scale” factor proxies the size of the company using financial data such as total revenue, asset size, EBITDA, etc. Finally, the “profitability” factor measures profitability and efficiency typically through ratios such as EBITA margin, operating margin, return on sales etc. Although the “business profile” and “financial policy” factors make use of some quantitative data, they are not as straightforward to calculate as the first three factors and require some qualitative judgment. The “business profile” factor serves as an indicator for the variability of performance, competitive position and long-term viability of a company. Sub-factors such as market share, product strengths, regulatory environment, earnings stability, competitive environment and diversification with respect to geography, market segment, product line, etc. may also be considered. The “financial policy” factor attempts to capture the tolerance of a company’s management and board for financial risk as well as the future direction of the company’s capital structure. For each of the 5 factors (and their sub-factors, if applicable), the rating methodology provides a grid to map them against Moody's broad rating categories (i.e. Aaa, Aa, A, Baa, Ba, B, Caa or Ca). To determine the overall scorecard-indicated rating, each of the rating factors is first converted into a numeric value. Each of these values is then multiplied by each factor weighting to produce a composite weighted-factor score, which is mapped against Moody’s more detailed alphanumeric ratings. Hence, even if a risk factor, by itself, indicates a low rating category, it can be compensated by another risk factor that indicates a higher rating category, resulting in a final rating between the two rating categories.
18 The remaining four industries, which use different scorecard classifications are the following: (i) captive finance subsidiaries of nonfinancial corporations, (ii) enhanced equipment trust and equipment trust certificates, (iii) investment holding companies and conglomerates and (iv) shipping industry.

PART III. CREDIT RATING METHODOLOGIES AND TRENDS IN RATING CHANGES
38 Corporate Bond Market Trends, Emerging Risks and Monetary Policy
Figure 24 provides the distribution of the weights that are assigned to the 5 rating factors across the 44 industries to give an understanding of their relative importance in credit ratings.
Figure 24. Weight of each risk factor in the final scorecard-indicated rating (distribution across 44 industries)
Note: In box-and-whisker plots, the lower and higher edges of the box indicate the first and third quartiles of the data, respectively while the line across the box shows the median. The whiskers show the range of the data, excluding outliers, if any. The outliers are plotted as dots falling outside the whiskers. Source: Moody’s rating methodologies for non-financial corporates.
The figure indicates that the leverage and coverage factor typically is the most critical factor in assigning ratings. Its weight across industries ranges between 20% and 45%, with a median of 35%. The leverage and coverage factor is followed by the business profile factor, which has a median weight of 25% and scale that has a median weight of 18.75%. The least influential factors are financial policy and profitability with median weights of 15% and 10% respectively across the 44 industries. The last panel of the figure plots the distribution of the total weight of the first 3 risk factors, which are the quantitative factors that can be directly calculated from financial statements or other business reports. The total weight of purely quantitative factors is 60% in the median industry and ranges between 40% and 75% across all. The range of the total weight of purely quantitative factors (40% - 75%) indicated by Moody’s rating methodologies is largely consistent with the results of a recent study by Benmelech (2017), which econometrically evaluates the quantitative content of rating decisions made by S&P. The study finds that during the period 2012-2015, 10 quantitative variables obtained from financial statements alone can account for about 51.6% to 66.3% of the variation in the S&P credit rating decisions.

PART III. CREDIT RATING METHODOLOGIES AND TRENDS IN RATING CHANGES
Corporate Bond Market Trends, Emerging Risks and Monetary Policy 39
3.2. Potential of shifts in credit rating standards
Some financial economists have expressed concerns about the potential tendency of CRAs to relax their rating standards during good times. Based on a theoretical model of ratings reputation, Bar-Isaac and Shapiro (2013) find that during boom periods, ratings have lower quality compared to recessionary periods. The authors argue that the prospects of growing business opportunities during booms give the CRAs an opportunity to take advantage of their reputation and be less stringent in order to generate more revenue. It is also argued that lower default probabilities during booms imply a lower risk of getting “caught” for reduced accuracy. Both phenomena would predict lower ratings accuracy during booms. Empirical evidence by Lobo et al. (2017) and Auh (2015) indicates the existence of procyclicality in credit ratings and hence provides support for the arguments made by Bar-Isaac and Shapiro (2013). Based on a long window from 1986 to 2012 and a broad sample of US companies rated by S&P, Lobo et al. (2017) find that CRAs assign lower credit ratings during downturns and higher ratings during upturns. The investor reaction to negative credit rating actions is also stronger during downturns, indicating that rating actions have greater information content during downturns, which is consistent with greater rating quality. Likewise, based on US corporate bond data from 2002 to 2011 and ratings assigned by the major CRAs, (Moody’s, S&P, Fitch and Duff & Phelps), Auh (2015) finds that the median credit risk of firms within each rating is lower during a downturn than during an expansion and that bonds rated during a recession perform better in terms of lower default frequencies, consistent with rating procyclicality. In contrast, based on a sample of non-financial companies from 27 developed markets over the period 1994 to 2016, Hung et al. (2019) document a tightening trend of corporate credit ratings. Consistent with a possible loosening in credit standards during the current boom period, a study by CreditSights, a credit research firm, presents a marked deterioration in within-rating leverage ratios, especially in higher ratings. CreditSights finds that the leverage of AA or AAA rated US issuers increased from 1 times EBITDA in 2007 to 1.8x in 2017. The leverage of A rated issuers increased from 1.5x to 2.2x while that of BBB rated issuers saw a more modest increase from 2.2x to 2.5x (Scaggs, 2018). With reference to this recent deterioration in within-rating fundamentals, PIMCO, a leading fixed income investment management firm, has warned investors that “This suggests a greater tolerance from the credit rating agencies for higher leverage, which in turn warrants extra caution when investing in lower-rated investment grade names, especially in sectors where earnings are more closely tied to the business cycle” (Brons and Lin, 2018). To explore whether CreditSights’ evidence from the United States on the increasing level of within-rating leverage also holds at the global level, Figure 25 provides a comparison of median leverage ratios of global non-financial, non-utility corporations for each rating from AA to B.19 In both years, 2007 and 2017, there is a monotonic relationship between leverage and rating quality, with lower ratings being associated with higher leverage. Moreover, consistent with the evidence from the United States, the median firm in each investment grade rating is now 19 The AAA category was excluded from the analysis because it had too few observations: 6 in 2007 and only 3 in 2017. Ratings from CCC to C were also excluded because the financial ratios of firms with ratings in that range were averaged together and hence did not allow a rating-based analysis. Trends in the AA-level should also be interpreted with caution since the number of corporations in that rating level decreased from 35 in 2007 to 16 in 2017, and so the statistics may suffer from small sample bias.

PART III. CREDIT RATING METHODOLOGIES AND TRENDS IN RATING CHANGES
40 Corporate Bond Market Trends, Emerging Risks and Monetary Policy
typically more levered compared to a decade ago and this increase in leverage is more pronounced in higher rating groups. For instance, the median ratio of debt-to-EBITDA increased from 1.7 to 2.1 for A rated issuers and from 2.4 to 2.8 for BBB rated issuers. In the non-investment grade rating scale, BB and B rated issuers also experienced a slight increase in this ratio. The debt-to-EBITDA ratio is a very prominent factor in determining credit ratings as it feeds into the rating scorecards of all but 4 of the Moody’s 44 industries and it has a median weight of 10%.20 Similar trends can be observed for funds from operations (FFO) to debt, debt-to-capital and retained cash flow-to-net debt ratios, with higher-rated issuers experiencing a more significant deterioration in leverage and non-investment grade issuers experiencing either a slight improvement or a slight deterioration.
Figure 25. Median leverage ratios for global non-financial, non-utility corporations by rating (year-end 2007 vs. year-end 2017)
Source: Moody’s Financial Metrics™ Key Ratios by Rating and Industry for Global Non-Financial Corporates: December 2007 and December 2017.
Another important rating factor is the interest coverage ratio, which measures the ability of a company to cover its current interest obligations. A lower ratio indicates a higher likelihood that the company may not be able to service its debt. Examining the interest coverage ratios presented in Figure 26 shows that interest coverage is decreasing from higher to lower ratings in both years and that for each rating, interest coverage ratios have improved from 2007 to 2017. Similar observations can be made for the EBITA margin, which proxies firm profitability.
20 It can be argued that the observed increase in leverage from 2007 to 2017 may be driven by an increase (decrease) in the dominance of a particular sector(s), in which firms tend to have higher (lower) leverage. However, an industry-level comparison of the median debt to EBITDA ratio of BBB rated issuers from 2007 to 2017 shows that the increase in leverage is observed across almost all industries. Specifically, out of the 13 industries reported, 10 has experienced an increase in leverage. Of the most dominant four industries, each of which represents more than 10% of the entire sample in 2017, the median debt to EBITDA ratio of BBB rated issuers increased from 2.6 to 3.0 in the consumer products sector, from 1.7 to 3.1 in the energy & environment sector, from 2.2 to 2.8 in the manufacturing sector and from 2.1 to 2.6 in the telecommunications sector. (The focus was put on BBB rated issuers in this analysis, since not all sectors are represented in all rating categories. The BBB category is the best represented investment-grade rating category across all industries.)
20072017
0%20%40%60%80%
AA A BBB BB B
Funds from OperationsDebt
012345
AA A BBB BB B
Debt...EBITDA
0%20%40%60%80%
AA A BBB BB B
Debt .Book Capitalization
0%10%20%30%40%
AA A BBB BB B
Retained Cash Flow Net Debt

PART III. CREDIT RATING METHODOLOGIES AND TRENDS IN RATING CHANGES
Corporate Bond Market Trends, Emerging Risks and Monetary Policy 41
Figure 26. Median interest coverage and profitability ratios for global non-financial, non-utility corporations by rating (year-end 2007 vs. year-end 2017)
Source: Moody’s Financial Metrics™ Key Ratios by Rating and Industry for Global Non-Financial Corporates: December 2007 and December 2017.
Comparing Figures 25 and 26 indicates that the worsening of within-rating median leverage ratios during the past decade appears to be offset by simultaneous increases in median interest coverage and profitability ratios. The improvement in interest coverage ratios can be partly attributed to the unprecedentedly low levels of interest rates. If interest rates start to increase from their currently low levels and the companies have to refinance their debt under higher interest rates and/or if an economic downturn hits highly leveraged companies’ earnings, both interest coverage and profitability ratios may deteriorate rather rapidly, limiting their ability to offset the high leverage ratios. Figure 27 further explores whether CRAs' rating actions may be experiencing a shift during good times. The figure reports the global corporate downgrade-to-upgrade ratio, which is regularly reported in CRAs’ annual default and transition studies. The ratio is calculated by dividing the total number of downgrades (including downgrades to default status) over the course of a year by the total number of upgrades in the same year.21 A ratio of 1 indicates an equal number of downgrades and upgrades for that year. The downgrade-to-upgrade ratios of Fitch and S&P have followed very similar trends over time. In the years leading up to the financial crisis, from 2004 up to and including 2007, the ratio of both agencies stayed under 1, meaning that the number of upgrades exceeded the number of downgrades. Only after the onset of the 2008 crisis did the market witness a major deterioration in ratings with the downgrade-to-upgrade ratio of Fitch reaching 5.7 and that of S&P reaching 4.8 in 2009.
Figure 27. Global corporate downgrade-to-upgrade ratio
Source: Fitch Ratings Global Corporate Finance Transition and Default Studies (2003-2018), S&P Global Ratings 2018 Annual Global Corporate Default and Rating Transition Study.
21 When annual downgrades and upgrades are counted, the end-of-year-rating is simply compared to the beginning-of-year rating. Hence, multiple rating actions for the same issuer throughout the year are not separately counted.
20072017
048
121620
AA A BBB BB B
FFO + Interest ExpenseInterest Expense
048
121620
AA A BBB BB B
EBITA .Interest Expense
0%6%
12%18%24%
AA A BBB BB B
EBITA Margin
S&P Fitch
0
1
2
3
4
5
6
1995 2000 '05 '10 '15 '18

PART III. CREDIT RATING METHODOLOGIES AND TRENDS IN RATING CHANGES
42 Corporate Bond Market Trends, Emerging Risks and Monetary Policy
Such an abrupt and disproportionate jump in the downgrade-to-upgrade ratio, preceded by years of improving overall rating levels, may arise if an unexpected worsening in companies’ financial strength occurs. To explore the ability of CRAs to predict the overall health of the economy, Panel A of Figure 28 plots Moody’s default rate forecast for the global corporate non-investment grade issuers for a given year vs. the actual default rate for that year. Interestingly, in the pre-crisis years, Moody’s always predicted higher default rates than the realised rates and successfully foresaw the significant rise in default rates both in 2008 and 2009. However, like its competitors, Moody’s kept its position in favour of upgrades over downgrades up until the crisis reached its peak in 2008. This may be influenced by the “rating stability” objective of CRAs, which results in a reluctance to update ratings despite expectations of a change in default rates. Higher rating stability may lead to less timely downgrades, which may be perceived as undesirable. However, downgrades are valuable to investors and other counterparties only when they are accurate. Importantly, rating downgrades have real effects on companies, such as increased borrowing costs and the triggering of ratings-based covenants, which means that inaccurate downgrades may put companies under unfounded financial pressure. Furthermore, downgrades that are later reversed are disruptive if they lead to frequent trading and require adjustments of the capital reserves of the bond owners. Taking these and related aspects into account, it is widely considered that there is a trade-off between the timeliness and stability of ratings.
Figure 28. Moody’s default rate estimate performance and rating drift
Source: Moody’s Annual Default Studies (2000-2018).
Panel B of Figure 28 presents Moody’s rating drift, which is an alternative metric based on both the relative occurrence and the magnitude of changes in ratings. Moody’s defines rating drift, as the average upgraded notches per issuer minus the average downgraded notches per issuer. Rating drift is expressed as a percent of one notch. Similar to the trend observed for Fitch and S&P in Figure 27, the upgrades by Moody’s exceeded downgrades in the 2004-2007 period. This period was followed by a sudden increase in downgrades relative to upgrades and in 2009, Moody’s rating drift dipped to its minimum value. Panel A of Figure 28 reveals that Moody’s forecasts with a slight downward bias have continued to successfully track the overall trend in default rates after the financial crisis. For instance, Moody’s predicted non-investment grade default rates of 2.7% and 4% for 2015 and 2016, respectively but, mostly due to pressures in the energy and commodity sectors, the actual default rates turned out at 3.5% and 4.5%, respectively. Consequently, the rating drift dived back into negative territory in 2015 and 2016 after being almost neutral at zero in 2014. Analogous observations can be made for S&P and Fitch in Figure 27. The observation that downgrades have, on average, dominated upgrades in the past decade, may suggest either
Expected
Actual0%
4%
8%
12%
16%
20%
2001 '06 '12 '18
A. Global Corporate Non-IG Default Rate
-60%
-40%
-20%
0%
20%
1995 2000 '05 '10 '15 '18
B. Moody's Rating Drift

PART III. CREDIT RATING METHODOLOGIES AND TRENDS IN RATING CHANGES
Corporate Bond Market Trends, Emerging Risks and Monetary Policy 43
that issuers’ financial standing has deteriorated, that CRAs have become more stringent or a combination of these two effects. During the last 2 years covered in Figure 27, S&P and Fitch almost reached breakeven between downgrades and upgrades. In 2018, the downgrade-to-upgrade ratio of S&P was 1.08 and that of Fitch was 1.13. For Moody’s Panel B in Figure 28 shows that it reached and actually exceeded the breakeven point in the last 2 years when its rating drift reached 0.7% in 2017 and 2.3% in 2018. The only periods that Moody’s rating drift had moved into positive territory since 1985 was the 3 years prior to the Asian financial crisis (1993, 1994 and 1996) and the 4 years prior to the 2008 global financial crisis. The substantial expansion of BBB ratings and the decreased frequency of downgrades relative to upgrades in the recent years, may indicate that CRAs are mindful of downgrading BBB issuers due to their special status just above the non-investment grade category. The question is if the important distinction between investment grade and non-investment grade bonds that is driven by regulatory requirements, rating-based investment strategies and the investment mandates described in Part II may give rise to additional “stability” concerns among CRAs when considering a change in rating that moves a bond across the line from the investment to the non-investment category. Figure 29 provides the historical average one-year 1-notch downgrade probabilities from a given rating, separately for S&P, Moody’s and Fitch. The data are based on the one-year average transition matrix of all global corporate issuers during the 1983-2018 period for Moody’s, the 1990-2018 period for Fitch and the 1981-2018 period for S&P.22 In the case of S&P for example, the figure shows that the historical probability of an AA+ rated issuer to be downgraded to AA within a given year is 11.1%.
Figure 29. Historical average one-year 1-notch downgrade probability from a given rating
Note: The data are based on the average one-year transition matrix of all global corporate issuers over the 1983-2018 period for Moody’s, 1990-2018 period for Fitch and 1981-2018 period for S&P. Source: Fitch Ratings 2018 Transition and Default Studies, Moody’s 2018 Annual Default Study, S&P Global Ratings 2018 Annual Global Corporate Default and Rating Transition Study.
22 The analyses in Figures 29 and 30 exclude AAA rated issuers as this category suffers from small sample bias especially in the most recent years, when the number of AAA rated issuers dropped considerably. Issuers rated below B- are also excluded since S&P and Fitch report issuers rated CCC to C as a single group, making their comparison to other ratings unmeaningful. Because of this reporting practice, for S&P and Fitch the probability shown on the figure for issuers rated B- is the probability of moving from B- to any rating from CCC to C within a year.
S&P
Fitch
Moody's
3
5
7
9
11
13 %
AA+ AA AA- A+ A A- BBB+ BBB BBB- BB+ BB BB- B+ B B-
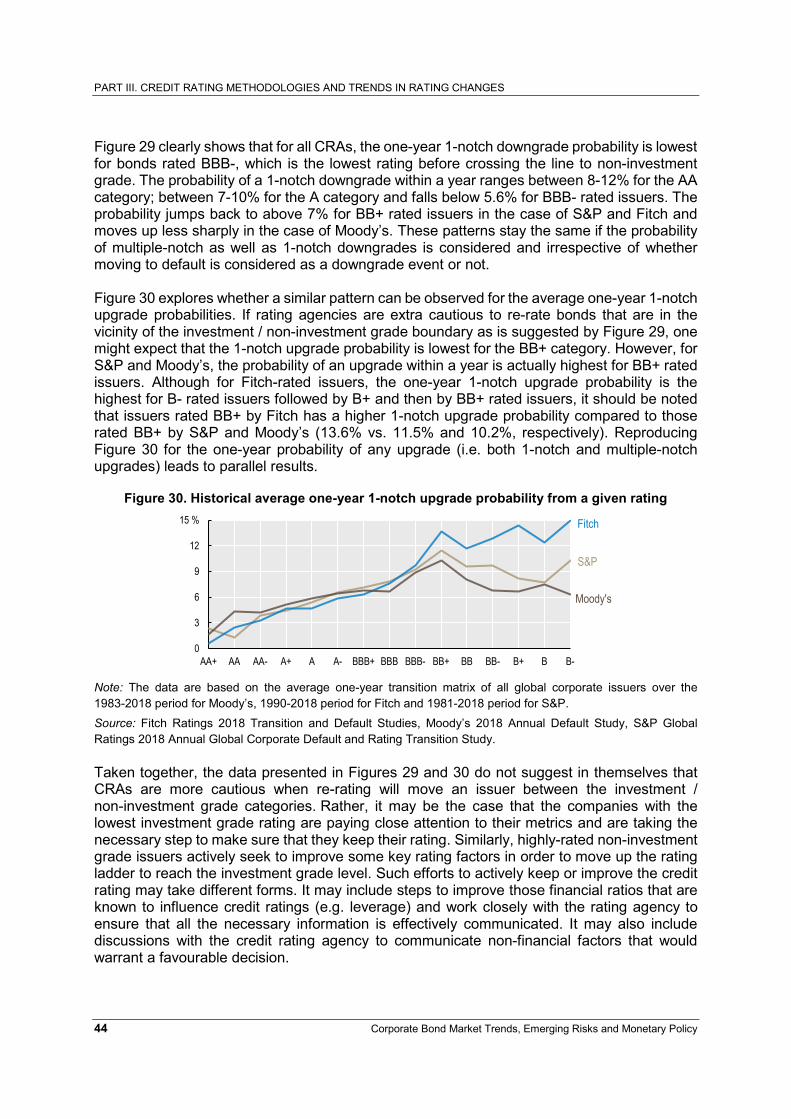
PART III. CREDIT RATING METHODOLOGIES AND TRENDS IN RATING CHANGES
44 Corporate Bond Market Trends, Emerging Risks and Monetary Policy
Figure 29 clearly shows that for all CRAs, the one-year 1-notch downgrade probability is lowest for bonds rated BBB-, which is the lowest rating before crossing the line to non-investment grade. The probability of a 1-notch downgrade within a year ranges between 8-12% for the AA category; between 7-10% for the A category and falls below 5.6% for BBB- rated issuers. The probability jumps back to above 7% for BB+ rated issuers in the case of S&P and Fitch and moves up less sharply in the case of Moody’s. These patterns stay the same if the probability of multiple-notch as well as 1-notch downgrades is considered and irrespective of whether moving to default is considered as a downgrade event or not. Figure 30 explores whether a similar pattern can be observed for the average one-year 1-notch upgrade probabilities. If rating agencies are extra cautious to re-rate bonds that are in the vicinity of the investment / non-investment grade boundary as is suggested by Figure 29, one might expect that the 1-notch upgrade probability is lowest for the BB+ category. However, for S&P and Moody’s, the probability of an upgrade within a year is actually highest for BB+ rated issuers. Although for Fitch-rated issuers, the one-year 1-notch upgrade probability is the highest for B- rated issuers followed by B+ and then by BB+ rated issuers, it should be noted that issuers rated BB+ by Fitch has a higher 1-notch upgrade probability compared to those rated BB+ by S&P and Moody’s (13.6% vs. 11.5% and 10.2%, respectively). Reproducing Figure 30 for the one-year probability of any upgrade (i.e. both 1-notch and multiple-notch upgrades) leads to parallel results.
Figure 30. Historical average one-year 1-notch upgrade probability from a given rating
Note: The data are based on the average one-year transition matrix of all global corporate issuers over the 1983-2018 period for Moody’s, 1990-2018 period for Fitch and 1981-2018 period for S&P. Source: Fitch Ratings 2018 Transition and Default Studies, Moody’s 2018 Annual Default Study, S&P Global Ratings 2018 Annual Global Corporate Default and Rating Transition Study.
Taken together, the data presented in Figures 29 and 30 do not suggest in themselves that CRAs are more cautious when re-rating will move an issuer between the investment / non-investment grade categories. Rather, it may be the case that the companies with the lowest investment grade rating are paying close attention to their metrics and are taking the necessary step to make sure that they keep their rating. Similarly, highly-rated non-investment grade issuers actively seek to improve some key rating factors in order to move up the rating ladder to reach the investment grade level. Such efforts to actively keep or improve the credit rating may take different forms. It may include steps to improve those financial ratios that are known to influence credit ratings (e.g. leverage) and work closely with the rating agency to ensure that all the necessary information is effectively communicated. It may also include discussions with the credit rating agency to communicate non-financial factors that would warrant a favourable decision.
S&P
Fitch
Moody's
0
3
6
9
12
15 %
AA+ AA AA- A+ A A- BBB+ BBB BBB- BB+ BB BB- B+ B B-

PART III. CREDIT RATING METHODOLOGIES AND TRENDS IN RATING CHANGES
Corporate Bond Market Trends, Emerging Risks and Monetary Policy 45
When General Electric was downgraded to BBB+ in 2018, its CEO stated that they will move quickly to raise cash and make asset sales, saying “We have no higher priority right now than bringing those leverage levels down” (Domm, 2018). Likewise, Kisgen (2009) reports that firms reduce leverage following rating downgrades and that the reductions are larger at downgrades to a non-investment grade rating. Specifically, firms downgraded to non-investment grade are about twice as likely to reduce debt as other firms, possibly with a hope of moving back to the investment grade category. Figure 6 showed a significant increase in the issuing of BBB and BB rated bonds since 2008. When such a rating composition is coupled with the observation that the downgrade probability is the lowest in the BBB rating scale and that the upgrade probability is the highest in the BB rating scale, a downward pressure in the downgrade-to-upgrade ratios observed in Figure 27 can be expected. In Figure 29, the historical average one-year downgrade probabilities was provided for each rating. To see how recent years’ downgrade rates compare to these long-term averages, Figure 31 presents the percentage of BBB rated issuers that moved into the non-investment grade category (i.e. have become fallen angels) in each year after 2007. Focus is on the BBB category due to its position just above non-investment grade ratings and the large volume of BBB rated bonds.
Figure 31. Percentage of BBB rated issuers that become fallen angels within a year
Source: Moody’s Annual Default Studies (2007-2018).
According to the figure, the 1-year fallen angel percentage for BBB rated issuers exceeded its 1970-2018 average during the financial crisis and more recently, in 2015 and 2016. In 2016, the fallen angel percentage rose above its crisis peak of 6.8% and reached 7.7%. In contrast, in 2018, only 1.37% of the BBB rated issuers at the beginning of the year had become fallen angels by the end of the year. This is the minimum percentage reached since 2007 and it is well below the 1970-2018 average of 4.7%. The rating stability objective of the CRAs, which manifests itself in the agencies’ reluctance to update ratings each time default probabilities change, holds back the number of rating changes, in the short run. However, at longer time horizons, as the stability objective becomes less of a constraint, rating accuracy may improve. Longer time horizons are also less prone to the distortionary effect of any short-term fluctuations in credit market conditions and consequently allow more reliable across-time comparisons. Furthermore, due to the seasoning effect, an increased percentage of first-time issuers may put upward pressure on short-term rating stability and so make short-term transition rate comparisons across years less reliable.
1970-2018 Average
0%1%2%3%4%5%6%7%8%9%
2007 2009 2011 2013 2015 2017

PART III. CREDIT RATING METHODOLOGIES AND TRENDS IN RATING CHANGES
46 Corporate Bond Market Trends, Emerging Risks and Monetary Policy
For these reasons, Figure 32 presents Fitch’s 5-year transition rates from different initial credit ratings. The rating changes within the most recent 5-year period from January 2014 to December 2018 are contrasted with historical averages of 5-year transition rates calculated over the 1990-2018 period.23 Downgrade rates are reported in a way that downgrades to default status can be separately observed. The figure can be interpreted as a combination of Figures 29 to 31, but with Fitch-only transition rates and a longer time horizon for transitions.
Figure 32. Transition rates from a given rating within 5 years: Historical average vs. most recent cohort (%)
Source: Fitch Ratings, Global Corporate Finance 2018 Transition and Default Study.
Consistent with the observations in Figure 29, the historical averages indicate that a BBB rated issuer is the least likely to be downgraded compared to other rating groups. Within 5 years, a BBB rated issuer downgrades to non-investment grade category with a 10% probability, upgrades to A- or higher ratings with a 9% probability and remains unchanged in the BBB category with 54% probability. The remaining 27% of issuers see their ratings withdrawn. As also documented by Altman and Kao (1992), investment grade ratings other than BBB show a greater propensity to be downgraded than to be upgraded. In contrast, for BBB rated issuers the likelihood of a downgrade and that of an upgrade are almost equal. Likewise, consistent with Figure 30, the historical averages indicate that a BB rated issuer is the most likely to be upgraded compared to other rating groups. Historically, a BB rated issuer upgraded with 22% probability within a 5-year period, downgraded with 15% probability and remained unchanged with 30% probability. According to Figure 32, the rating transitions experienced by the BBB and BB rated issuers in the most recent 5-year cohort from January 2014 to December 2018 have been quite similar to their historical averages. There has been only a minor change in favour of “no change” at
23 Note that in this analysis a move within BBB (e.g. from BBB+ to BBB) is not counted as a downgrade. Only moves across major rating groups are counted as changes.
50
73
29
9
Hist. Avr. Jan'14- Dec'18
From AA
5565
5
3
1813
Hist. Avr. Jan'14- Dec'18
From A
54 57
9 6
10 10
Hist. Avr. Jan'14- Dec'18
From BBB
30 35
22 17
15 13
Hist. Avr. Jan'14- Dec'18
From BB
29 28
1914
1316
Hist. Avr. Jan'14- Dec'18
From B
Upgrade %
No Change %
Downgrade exc. default %
Default %

PART III. CREDIT RATING METHODOLOGIES AND TRENDS IN RATING CHANGES
Corporate Bond Market Trends, Emerging Risks and Monetary Policy 47
the expense of upgrades. But the sum of no change and upgrade percentages is almost identical to the historical average. Interestingly, the stability of the AA and A rating categories in the past 5 years has been remarkably higher than the historical averages. Historically, on average 29% of AA rated issuers have been downgraded within 5 years and 50% experienced no change. In contrast, in the past 5 years, only 9% of AA rated issuers experienced a downgrade and 73% remained unchanged. In the A category, 65% of issuers experienced no change in the past 5 years and only 13% were downgraded. These figures contrast the historical averages of 55% and 18%, respectively. The figure also shows that, overall, the stability of all rating groups except B is higher in the 2014 - 2018 period compared to historical averages.24
24 The main results remain unchanged when Figure 32 is reproduced with withdrawal-adjusted percentages.

48 Corporate Bond Market Trends, Emerging Risks and Monetary Policy
REFERENCES
Altman, E. I. and D. L. Kao (1992), “The implications of corporate bond ratings drift”, Financial Analysts Journal, Vol. 48, No. 3, pp. 64-75.
Aramonte, S. and E. Eren (2019), “Investment mandates and fire sales: The case of mutual funds and BBB bonds”, in BIS Quarterly Review March 2019, Bank for International Settlements, Basel.
Auh, J. K. (2015), “Procyclical credit rating policy”, Georgetown McDonough School of Business Research Paper, No. 2581738, http://dx.doi.org/10.2139/ssrn.2581738.
Bao, J. et al. (2015), “Prices and volatilities in the corporate bond market”, Fisher College of Business Working Paper, No. 2015-03-18, http://dx.doi.org/10.2139/ssrn.2651243.
Bar-Isaac, H. and J. Shapiro (2013), “Ratings quality over the business cycle”, Journal of Financial Economics”, Vol. 108, No. 1, pp. 62-78.
BCBS (2017), Basel III: Finalising Post Crisis Reforms, Basel Committee on Banking Supervision, Basel.
BCBS (2004), International Convergence of Capital Measurement and Capital Standards: A Revised Framework, Basel Committee on Banking Supervision, Basel.
BCBS (1988), International Convergence of Capital Measurement and Capital Standards, Basel Committee on Banking Supervision, Basel.
Becker, B. and V. Ivashina (2015), “Reaching for yield in the bond market”, Journal of Finance, Vol. 70, No. 5, pp. 1863-1901.
Benmelech, E. (2017), “Credit ratings: Qualitative versus quantitative information”, Unpublished working paper, http://dx.doi.org/10.2139/ssrn.2987211.
BIS (2019), Basel III Monitoring Report, March 2019, Bank for International Settlements, Basel.
BoE (2020), “Asset purchase facility quarterly report - 2019 Q4”, https://www.bankofengland.co.uk/asset-purchase-facility/2019/2019-q4.
BoE (2019a), “Monetary policy summary and minutes of the monetary policy committee meeting ending on 6 February 2019”, 7 February, https://www.bankofengland.co.uk/-/media/boe/files/monetary-policy-summary-and-minutes/2019/february-2019.pdf.
BoE (2019b), “Monetary policy summary and minutes of the monetary policy committee meeting ending on 6 November 2019”, 7 November, https://www.bankofengland.co.uk/-/media/boe/files/monetary-policy-summary-and-minutes/2019/november-2019.pdf.
BoE (2019c), “Monetary policy summary and minutes of the monetary policy committee meeting ending on 19 June 2019”, 20 June, https://www.bankofengland.co.uk/-/media/boe/files/monetary-policy-summary-and-minutes/2019/june-2019.pdf.
BoE (2017), Bank of England Asset Purchase Facility Fund Limited Annual Report and Accounts 1 March 2016–28 February 2017, Bank of England, London.
BoE (2018), “Monetary policy summary and minutes of the monetary policy committee meeting ending on 1 August 2018”, 2 August, https://www.bankofengland.co.uk/-/media/boe/files/monetary-policy-summary-and-minutes/2018/august-2018.pdf.
BoE (2016), “Corporate bond purchase scheme: Eligibility and sectors”, 12 September, www.bankofengland.co.uk/news/2016/september/corporate-bond-purchase-scheme-eligibility-and-sectors.
BoJ (2019a), “Statement on monetary policy”, 23 January, www.boj.or.jp/en/announcements/release_2019/k190123a.pdf.

REFERENCES
Corporate Bond Market Trends, Emerging Risks and Monetary Policy 49
BoJ (2019b), “Statement on monetary policy”, 31 October, www.boj.or.jp/en/announcements/release_2019/k191031a.pdf.
BoJ (2013a), “Introduction of the quantitative and qualitative monetary easing”, 4 April, www.boj.or.jp/en/announcements/release_2013/k130404a.pdf.
BoJ (2013b), “Establishment and abolishment of principal terms and conditions in accordance with the introduction of the quantitative and qualitative monetary easing”, 4 April, www.boj.or.jp/en/announcements/release_2013/rel130404a.pdf.
BoJ (2010), “Establishment of principal terms and conditions for the asset purchase program”, 28 October, www.boj.or.jp/en/announcements/release_2010/mok1010f.pdf.
BoJ (2009a), “Establishment of principal terms and conditions for outright purchases of corporate bonds”, 19 February, www.boj.or.jp/en/announcements/release_2009/mok0902b.pdf.
BoJ (2009b), “Statement on monetary policy”, 15 July, https://www.boj.or.jp/en/announcements/release_2009/k090715.pdf.
Brons, J. and L. Lin (2018), “Investment grade credit: Be actively aware of BBB bonds”, January, https://global.pimco.com/en-gbl/insights/viewpoints/investment-grade-credit-be-actively-aware-of-bbb-bonds.
Cerutti, E. and M. Obstfeld (2019), “China’s bond market and global financial markets” in The Future of China’s Bond Market, International Monetary Fund, Washington, D.C.
Cook, R. (2019), “Ratings key to globalizing China’s bond market”, Asia Times, 9 May.
Çelik, S., G. Demirtaş and M. Isaksson (2019), Corporate Bond Markets in a Time of Unconventional Monetary Policy, OECD Capital Market Series, OECD Publishing, Paris, www.oecd.org/corporate/Corporate-Bond-Markets-in-a-Time-of-Unconventional-Monetary-Policy.htm.
Domm, P. (2018), “GE was once America’s most valuable company. Today it is fighting against junk-bond status”, CNBC, 16 November.
Duffie, D., N. Gârleanu and L. H. Pedersen (2007), “Valuation in over-the-counter markets”, Review of Financial Studies, Vol. 20, No. 6, pp. 1865-1900.
ECB (2019a), “Committee on economic and monetary affairs – Monetary dialogue with Mario Draghi, President of the European Central Bank”, 28 January, https://www.ecb.europa.eu/press/key/date/2019/html/ecb.sp190128_transcript.en.pdf.
ECB (2019b), “Monetary policy decisions”, 12 September, https://www.ecb.europa.eu/press/pr/date/2019/html/ecb.mp190912~08de50b4d2.en.html.
ECB (2019c), Financial Stability Review, May 2019, European Central Bank, Frankfurt. https://www.ecb.europa.eu/pub/financial-stability/fsr/html/ecb.fsr201905~266e856634.en.html#toc25
ECB (2019d), “Corporate Sector Purchase Programme (CSPP) – Questions & answers”, https://www.ecb.europa.eu/mopo/implement/omt/html/cspp-qa.en.html (accessed 5 February 2020).
ECB (2018), “Monetary policy decisions”, 13 December, https://www.ecb.europa.eu/press/pr/date/2018/html/ecb.mp181213.en.html.
ECB (2016a), Economic Bulletin, Issue 5 /16, European Central Bank, Frankfurt. https://www.ecb.europa.eu/pub/pdf/ecbu/eb201605.en.pdf.
ECB (2016b), “ECB announces details of the Corporate Sector Purchase Programme (CSPP), 21 April, https://www.ecb.europa.eu/press/pr/date/2016/html/pr160421_1.en.html.
Ellul, A., C. Jotikasthira and C. T. Lundblad (2011), “Regulatory pressure and fire sales in the corporate bond market”, Journal of Financial Economics, Vol. 101, No. 3, pp. 596-620.
http://www.oecd.org/corporate/Corporate-Bond-Markets-in-a-Time-of-Unconventional-Monetary-Policy.htm

REFERENCES
50 Corporate Bond Market Trends, Emerging Risks and Monetary Policy
ESMA (2015), Technical Advice on Reducing Sole and Mechanistic Reliance on External Credit Ratings, European Securities and Markets Authority, Paris.
European Commission (2013), Regulation (EU) No 575/2013 of the European Parliament and of the Council of 26 June 2013 on prudential requirements for credit institutions and investment firms and amending regulation (EU) No 648/2012, Official Journal of the European Union.
Federal Reserve (2019a), “Federal Reserve issues FOMC statement”, 30 January, https://www.federalreserve.gov/newsevents/pressreleases/monetary20190130a.htm.
Federal Reserve (2019b), “Statement regarding monetary policy implementation and balance sheet normalization”, 30 January, https://www.federalreserve.gov/newsevents/pressreleases/monetary20190130c.htm.
Federal Reserve (2019c), “Federal Reserve issues FOMC statement”, 31 July, https://www.federalreserve.gov/newsevents/pressreleases/monetary20190731a.htm.
Federal Reserve (2019d), “Federal Reserve issues FOMC statement”, 18 September, https://www.federalreserve.gov/newsevents/pressreleases/monetary20190918a.htm.
Federal Reserve (2019e), Federal Reserve issues FOMC statement”, 30 October, https://www.federalreserve.gov/newsevents/pressreleases/monetary20191030a.htm.
Federal Reserve (2018), “Federal Reserve issues FOMC statement”, 19 December, https://www.federalreserve.gov/newsevents/pressreleases/monetary20181219a.htm.
Federal Reserve (2017), “Federal Reserve issues FOMC statement”, 20 September, https://www.federalreserve.gov/newsevents/pressreleases/monetary20170920a.htm.
FSB (2017), Policy Recommendations to Address Structural Vulnerabilities from Asset Management Activities, Financial Stability Board, Basel.
Goldstein, I., H. Jiang and D. T. Ng (2017), “Investor flows and fragility in corporate bond funds”, Journal of Financial Economics, Vol. 126, No. 3, pp. 592-613.
Greenwood, R. and S. G. Hanson (2013), "Issuer quality and corporate bond returns", Review of Financial Studies, Vol. 26, No. 6, pp. 1483-1525.
Hohl, S. et al. (2018), The Basel Framework in 100 Jurisdictions: Implementation Status and Proportionality Practices, FSI Insights on Policy Implementation, No. 11, Bank for International Settlements, Basel.
Hung, M. et al. (2019), “Market power and credit rating standards: Global evidence”, Unpublished working paper.
IOSCO (2018), Recommendations for Liquidity Risk Management for Collective Investment Schemes: Final Report, The Board of the International Organization of Securities Commission, Madrid.
Jiang, X. and F. Packer (2017), “Credit ratings of domestic and global agencies: What drives the differences in China and how are they priced?”, BIS Working Papers, No. 648, Bank for International Settlements, Basel.
Kisgen, D. J. (2009), “Do firms target credit ratings or leverage levels?”, Journal of Financial and Quantitative Analysis, Vol. 44, No. 6, pp. 1323-1344.
Lobo, G. J. et al. (2017), “The effect of business and financial market cycles on credit ratings: Evidence from the last two decades”, ABACUS, Vol. 53, No. 1, pp. 59-93.
Lockett, H. (2019), “China government bonds make global benchmark debut”, Financial Times, 1 April.
Longmei, Z. and W. Yuchen (2019), “Credit bonds” in The Future of China’s Bond Market, International Monetary Fund, Washington, D.C.
MIS (2020), Annual Default Study: Defaults will Edge Higher in 2020, 30 January, Moody’s Investors Service, New York.

REFERENCES
Corporate Bond Market Trends, Emerging Risks and Monetary Policy 51
MIS (2019), Annual Default Study: Defaults will Rise Modestly in 2019 amid Higher Volatility, 1 February, Moody’s Investors Service, New York.
MIS (2010), Corporate Default and Recovery Rates, 1920-2019, February, Moody’s Investors Service, New York.
OECD (2018), OECD Survey of Investment Regulation of Pension Funds, OECD Publishing, Paris, www.oecd.org/daf/fin/private-pensions/2018-Survey-Investment-Regulation-Pension-Funds.pdf.
OECD (2015), Regulation of Insurance Company and Pension Fund Investment: OECD Report to G20 Finance Ministers and Central Bank Governors, OECD Publishing, Paris, www.oecd.org/g20/summits/antalya/Regulation-of-Insurance-Company-and-Pension-Fund-Investment.pdf.
Platt, E., A. Scaggs, and N. Bullock (2017), “How Apple and co became some of America’s largest debt collectors?”, Financial Times, 15 September.
S&P (2018), Default, Transition and Recovery: 2017 Annual Global Corporate Default Study and Rating Transitions, 5 April, S&P Global Ratings, New York.
Scaggs, A. (2018), “The herds and the BBBs”, Financial Times, 12 July.
SEC (2020), Annual Report on Nationally Recognized Statistical Rating Organizations, U.S. Securities and Exchange Commission, Washington D.C.
Wildau, G. (2018), “China suspends major credit ratings agency Dagong”, Financial Times, 17 August.
Yellen, J. L. (2016), “Current conditions and the outlook for the U.S. economy”, speech at the World Affairs Council of Philadelphia, Philadelphia, Pennsylvania, 6 June 2013, https://www.federalreserve.gov/newsevents/speech/yellen20160606a.htm.
Zhu, G., C. Deng and S. Y. Xie (2019), “S&P wins Beijing’s approval to offer credit-rating services in China”, The Wall Street Journal, 28 January.

52 Corporate Bond Market Trends, Emerging Risks and Monetary Policy
ANNEX 1 – METHODOLOGY FOR DATA COLLECTION AND CLASSIFICATION
Primary corporate bond market data
Primary corporate bond market data are based on original OECD calculations using data obtained from Thomson Reuters Eikon that provides international deal-level data on new issues of corporate bonds, which are underwritten by an investment bank. The database provides a detailed set of information for each corporate bond issue, including the identity, nationality and sector of the issuer; the type, interest rate structure, maturity date and rating category of the bond, the amount of and use of proceeds obtained from the issue. The initial dataset covers observations in the period from 1 January 2000 to 31 December 2019. From this initial set, convertible bonds, deals that were registered but not consummated, preferred shares, sukuk bonds, bonds with an original maturity less than 1 year or an issue size less than USD 1 million are excluded. The analyses in the paper are limited to bond issues by non-financial companies. This industry classification is carried out based on Thomson Reuters Business Classification (TRBC). The final dataset after all exclusions covers 92 069 bond issues from 114 countries. When tranches under the same bond package are counted as a single issue, this figure reduces to 73 457. Given that a significant portion of bonds are issued internationally, it is not possible to assign such issues to a certain country of issue. For this reason, the country breakdown is carried out based on the domicile country of the issuer. The advanced/emerging market classification is based on IMF country classification. Issuance amounts are presented in 2019 USD adjusted by US CPI.
Rating data
Thomson Reuters Eikon provides rating information from three leading rating agencies: S&P, Fitch and Moody’s. For each bond that has rating information in the dataset, a value of 1 to the lowest credit quality rating (C) and 21 to the highest credit quality rating (AAA for S&P and Fitch and Aaa for Moody’s) is assigned. There are eleven non-investment grade categories: five from C (C to CCC+); and six from B (B- to BB+). There are ten investment grade categories: three from B (BBB- to BBB+); and seven from A (A- to AAA). If for a given issue, ratings from multiple rating agencies are available, their average is taken. Some issues in the dataset, on the other hand, do not have rating information available. For such issues, the average rating of all bonds issued by the same issuer in the same year (t) is assigned. If the issuer has no rated bonds in year t, year t-1 and year t-2 are also considered, respectively. This procedure increases the number of rated bonds in the dataset and hence improves the representativeness of rating-based analyses. As a result of this procedure, our rating analyses covering the 2000-2019 period are based on 41 668 bond issues from 101 countries and those covering the 1980-2019 period are based on 63 562 bond issues from 105 countries. When differentiating between investment and non-investment grade bonds, the final rating is rounded to the closest integer and issues with a rounded rating less than or equal to 11 are classified as non-investment grade.
Early redemption data
When calculating the outstanding amount of corporate bonds in a given year, issues that are no longer outstanding due to being redeemed earlier than their maturity should also be deducted. The early redemption data are obtained from Thomson Reuters Eikon and cover bonds that have been redeemed early due to being repaid via final default distribution, called, liquidated, put or repurchased. The early redemption data are merged with the primary corporate bond market data via international securities identification numbers (i.e. ISINs).

ANNEX 1 – METHODOLOGY FOR DATA COLLECTION AND CLASSIFICATION
Corporate Bond Market Trends, Emerging Risks and Monetary Policy 53
Covenant data
Covenant analyses are based on authors’ original calculations performed on data obtained from Mergent Fixed Investment Securities Database (FISD), a database providing issue-level covenant data for publicly offered bonds in the US, issued either by US or non-US entities. The initial dataset covers observations in the period from 1 January 2000 to 30 June 2019. From this initial set, issues by non-corporate issuers, preferred shares, convertible bonds, bonds with an original maturity less than 1 year, bonds for which no covenant data have been collected and bonds with no rating data available are excluded. The analyses in the paper are limited to bond issues by non-financial companies. The final dataset after all exclusions covers 16 106 bond issues in the US by companies from the United States (87%) and 66 other countries. Thirty seven covenant-related data fields, each of which corresponds to a covenant type, are taken into covenant analyses. Ten of those thirty seven covenant types are almost never used in non-investment or investment grade bonds and therefore are excluded from covenant protection index calculations to ensure that they do not unnecessarily distort the index. For each corporate bond, binary variables denoting the presence/absence of 27 different types of covenants in the bond contract are first summed up. This sum is then divided by 27 and multiplied by 100 to create a score that ranges between 0 and 100, with 100 denoting the highest level of protection for bond investors. For any given year, the index is the average of the covenant scores of bonds issued in that year.
Investor base data
The analyses on the investor base of corporate bonds in the euro area, the UK, Japan, the US and China are based on national financial accounts data released by the ECB Statistical Data Warehouse, the Office for National Statistics, the Bank of Japan, the US Federal Reserve and the National Bureau of Statistics of China, respectively. The time period considered for each region depends on the availability of data, which have the required level of detail and consistency across time. Accordingly, while the UK and the US have data for the full observation period from 2000 to 2018, the data from Japan and the euro area start from 2005 and 2013, respectively. The data from China, on the other hand, start from 2011 and end in 2016, due to a 2-year lag in data disclosure. The scope of corporate bonds for each country/country group varies depending on the data breakdown released by each data source. While a focus on the holders of outstanding long-term debt securities issued by resident non-financial companies would have been the most compatible with this report’s primary corporate bond market scope, a level of detail that would allow such a focus is not available except for the euro area. Hence, the investor base analysis for the UK is based on data on the holders of long-term debt securities issued by UK financial and non-financial companies, the analysis for Japan is based on the holders of debt securities issued by Japanese financial and non-financial companies and the analysis for China is based on the different investor groups’ transactions of debt securities issued by non-financial companies in China. On the other hand, the financial accounts data of the US only provide information on the holders of “corporate and foreign bonds”, bundling together the bonds issued by US financial and non-financial companies with bonds issued by foreign governments and companies. The share of foreign bonds in the “corporate and foreign bonds” category averaged 16.8% over the 2000-2018 period. This percentage would have been smaller if it was possible to calculate the share of bonds issued by foreign governments, which is the portion that should ideally be excluded in a corporate bond analysis. For the sake of convenience, the US “corporate and foreign bonds” classification is referred to as “corporate bonds” in the study. The sector classification that is adopted in this study to categorise corporate bond investors into different sectors is the one used by the ECB. Although there may be some differences across different countries’ classifications, they all aim consistency with internationally accepted rules for sector classification. Japan adopts the System of National Accounts of the United Nations (2008 SNA) and the US maps its own classification to 2008 SNA sectors. The UK and the euro area adopt the European System of Accounts (ESA 2010) classification. According to the ESA 2010 guideline, "ESA 2010 is broadly

ANNEX 1 – METHODOLOGY FOR DATA COLLECTION AND CLASSIFICATION
54 Corporate Bond Market Trends, Emerging Risks and Monetary Policy
consistent with the System of National Accounts of the United Nations (2008 SNA) with regard to definitions, accounting rules and classifications.” Due to this broad consistency across countries, it is relatively straightforward to map each country’s classification into the adopted sector classification. During the mapping, whenever public pension funds are reported as a separate item under the general government sector, they are reclassified under the insurance corporations and pension funds sector.
Data on the corporate debt securities investments of US non-financial companies
The 25 US non-financial public companies with the largest investment portfolios are determined based on the balance sheet data obtained from Thomson Reuters Eikon as of the end of the 2018 fiscal year. The investment portfolio consists of cash and cash equivalents, short- and long-term investments and does not include investments on subsidiaries. These 25 companies, as a whole, account for 13% of the aggregate investment portfolio of public firms around the world. Information on the corporate debt securities investments of these companies is then hand-collected from their filings (10-K, or rarely 10-Q, filings) with the US Securities and Exchange Commission as of the fiscal years 2009, 2012, 2015 and 2018. The references to or the breakdown provided for corporate debt securities investments in the SEC filings are not always consistent across companies or through time. To increase data consistency while adjusting the scope, investments reported under headings such as corporate debt securities, corporate notes, corporate bonds and commercial paper are all recorded as corporate debt securities investments.


www.oecd.org/corporate/capital-markets