Corporal Punishment Update - Tennessee
21
Update: Corporal Punishment in Tennessee Lauren Spires, Legislative Research Analyst [email protected], Office of Research and Education Accountability Introduction In July 2017, members of the Tennessee General Assembly requested that the Comptroller’s Office of Research and Education Accountability (OREA) research the use of corporal punishment in Tennessee schools, particularly to determine if corporal punishment is being used disproportionately for students with disabilities. In March 2018, OREA published a report on corporal punishment in Tennessee public schools, including an analysis of its use for students with disabilities. At the time of publication, the most current data available on corporal punishment use was from the 2013-14 school year. In late April 2018, the Office for Civil Rights (OCR) within the U.S. Department of Education released data from the 2015-16 school year. This report includes an updated analysis of corporal punishment use in Tennessee public schools from the past four reporting years: 2009-10, 2011-12, 2013-14, and 2015-16. October 2018 Corporal Punishment Paddling, spanking, or other forms of physical punishment imposed on a student. Students with Disabilities Students receiving services under the Individuals with Disabilities Education Act (IDEA) and/or Section 504 of the federal Rehabilitation Act of 1973 (Section 504).
Transcript of Corporal Punishment Update - Tennessee
Page 1
Update: Corporal Punishment in Tennessee
Lauren Spires, Legislative Research [email protected], Office of Research and Education Accountability
IntroductionIn July 2017, members of the Tennessee General Assembly requested that the Comptroller’s Office of Research and Education Accountability (OREA) research the use of corporal punishment in Tennessee schools, particularly to determine if corporal punishment is being used disproportionately for students with disabilities.
In March 2018, OREA published a report on corporal punishment in Tennessee public schools, including an analysis of its use for students with disabilities. At the time of publication, the most current data available on corporal punishment use was from the 2013-14 school year. In late April 2018, the Office for Civil Rights (OCR) within the U.S. Department of Education released data from the 2015-16 school year.
This report includes an updated analysis of corporal punishment use in Tennessee public schools from the past four reporting years: 2009-10, 2011-12, 2013-14, and 2015-16.
October 2018
Corporal PunishmentPaddling, spanking, or other forms of
physical punishment imposed on a student.
Students with DisabilitiesStudents receiving services under the
Individuals with Disabilities Education Act (IDEA) and/or Section 504 of the federal Rehabilitation Act of 1973 (Section 504).
Page 2
Key conclusions from the available data• Students with disabilities received corporal punishment at a higher rate than students
without disabilities for three of the four most recent reporting years. In 2009-10, the statewide rate of corporal punishment use for students with disabilities was lower than the statewide rate for students without disabilities. In the following three reporting years, the opposite was true: students with disabilities received corporal punishment at a higher rate than their peers, by nearly 2 percentage points in 2013-14 and 2015-16.
• The statewide rate of corporal punishment use has declined more for students without disabilities than for students with disabilities. The statewide rate of corporal punishment use for students with disabilities dropped by less than one percentage point over the past four reporting years. In contrast, the rate of corporal punishment use for students without disabilities declined by more than three percentage points from 2009-10 through 2015-16.
• The number of students with disabilities receiving corporal punishment declined from 2009-10 through 2015-16, but not as much as the decline for students without disabilities. There were about 19 percent fewer students with disabilities who received corporal punishment in 2015-16 than in 2009-10, while the number of students without disabilities receiving corporal punishment declined by about 58 percent across the same time frame. The number of students without disabilities receiving corporal punishment declined for each of the four reporting years, while the number of students with disabilities who received corporal punishment peaked in 2011-12.
• Of the schools that use corporal punishment for students with and without disabilities, about 80 percent used corporal punishment at a higher rate for students with disabilities in all four reporting years. The remaining schools (about 20 percent) used corporal punishment for students with disabilities at rates equal to or lower than students without disabilities.
• Beginning with the 2015-16 school year, OCR requires that schools report the number of instances of corporal punishment use in the school year, as well as the number of students who received corporal punishment. Over half of schools reported a greater number of students receiving corporal punishment than the number of instances corporal punishment was used for that school year. It is unclear if this is a reporting error or if districts are reporting different data based on their interpretations of the reporting instructions.
◊ Based on the reported data, students with disabilities receive corporal punishment more often during the school year compared to their peers. In the 2015-16 school year, students with disabilities received corporal punishment an average of 1.65 instances per school year compared to an average of 1.50 instances for students without disabilities.
OREA’s full report on corporal punishment explores in greater depth the use of corporal punishment in Tennessee schools, including a detailed analysis of survey responses from principals and Directors of Schools, and an explanation of the federal disability laws (IDEA and Section 504). Appendices include a list of Tennessee school districts allowing the use of corporal punishment per board policy, a list of schools that reported using corporal punishment in the past four reporting years with available data, and the corresponding rates of use for students with and without disabilities in schools that reported using corporal punishment.
Page 3
OverviewState law and local school board policiesTennessee is one of 22 states that allow corporal punishment. In these states, corporal punishment is either permitted through state law, or state law makes no reference to the practice. The other 28 states and the District of Columbia have laws explicitly banning the use of corporal punishment.
Adopted in 1979, the School Discipline Act (TCA 49-6-4101 et seq.) allows corporal punishment to be used in Tennessee schools and directs local boards of education to adopt policies governing its use within their districts. Prior to the adoption of Public Chapters 777 and 900 during the 2018 legislative session, Tennessee state law did not address the use of corporal punishment for students with disabilities. PC 777 requires the Tennessee Department of Education (TDOE) to collect more detailed corporal punishment data more often than that collected by OCR (including more details specifically for students with disabilities). PC 900 prohibits the use of corporal punishment for students with disabilities, unless parental consent is provided.
In August 2017, OREA conducted a comprehensive review of the corporal punishment policies of all school districts in Tennessee. Of the 148 total school districts,A 109 have a board policy allowing corporal punishment and 39 do not allow its use, either explicitly per board policy or through lack of board policy.B
Most school board policies on corporal punishment contain similar language and guidelines, and leave discretion to the principal, assistant principal, or teacher who administers corporal punishment within the school. Among other components, most policies require a witness to be present, and state that corporal punishment is to be administered only after other less stringent measures have failed or when the conduct of the student is of such nature that corporal punishment is the only reasonable form of punishment under the circumstances. OREA’s 2017 review found that one school board’s policy addresses the use of corporal punishment specifically for students with disabilities, however, prohibiting its use if the student’s misbehavior is a manifestation of his or her disability (i.e., the student’s behavior is caused by his or her disability).
A This figure includes all 141 county, city, and special school districts, four state special schools (Alvin C. York Institute, Tennessee School for the Blind, Tennessee School for the Deaf, and West Tennessee School for the Deaf), the Achievement School District (ASD), the State Board of Education (SBE), and the Tennessee Department of Children’s Services (DCS). The four state special schools, ASD, SBE, and DCS are treated as school boards in terms of creating their own policies for the school(s) within their jurisdiction. See Appendix D in the full report for a list of all 148 districts included in the analysis.B In summer 2018, the local boards of two districts (Cheatham and Robertson Counties) took steps to pass policies that would ban corporal punishment in the schools within their respective districts.
Page 4
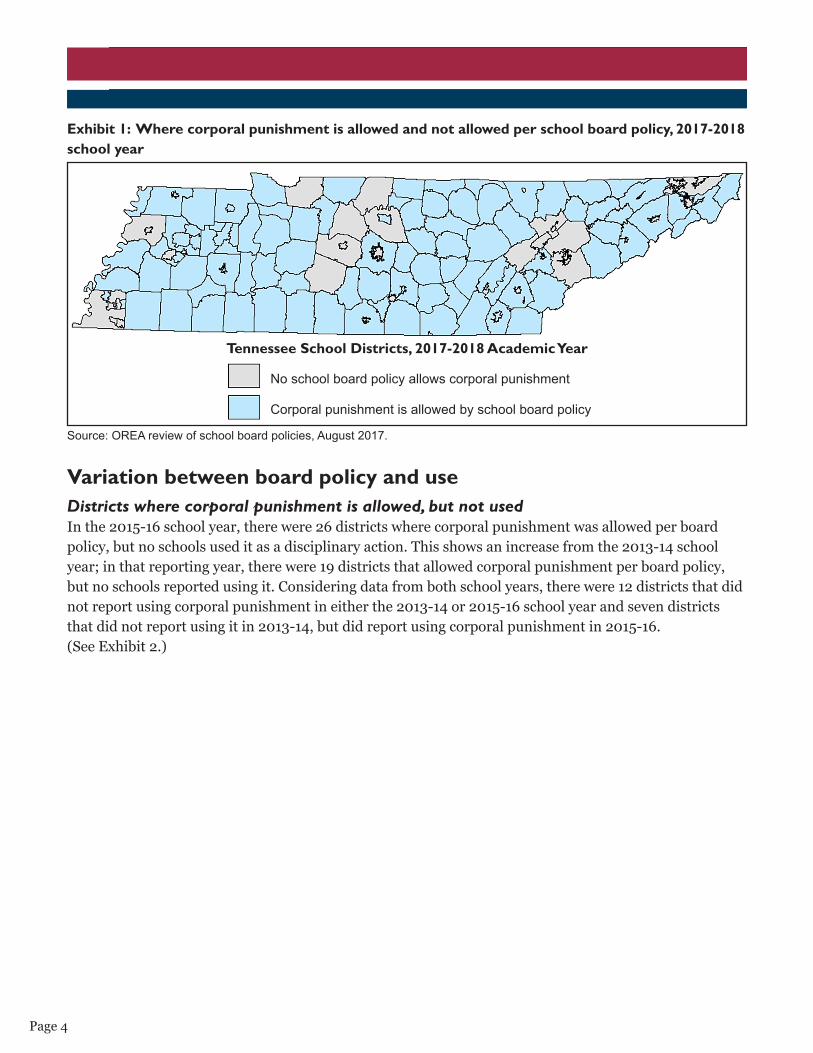
Exhibit 1: Where corporal punishment is allowed and not allowed per school board policy, 2017-2018 school year
Tennessee School Districts, 2017-2018 Academic Year
Source: OREA review of school board policies, August 2017.
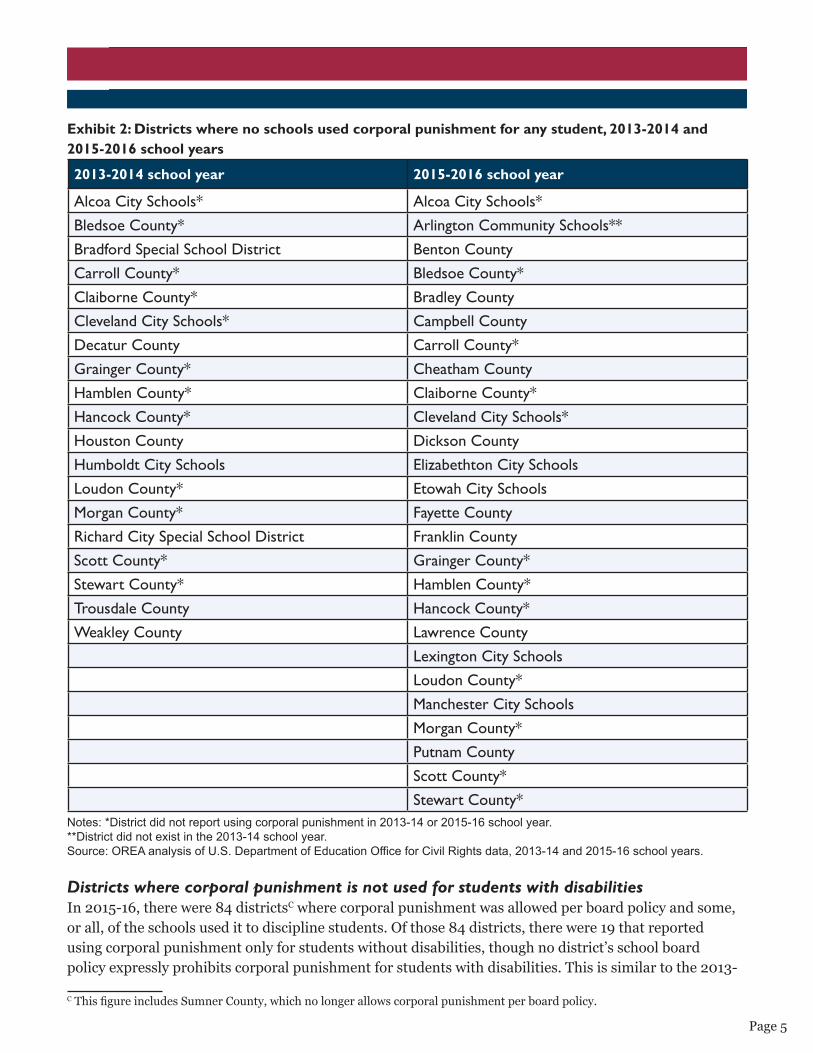
Variation between board policy and useDistricts where corporal punishment is allowed, but not usedIn the 2015-16 school year, there were 26 districts where corporal punishment was allowed per board policy, but no schools used it as a disciplinary action. This shows an increase from the 2013-14 school year; in that reporting year, there were 19 districts that allowed corporal punishment per board policy, but no schools reported using it. Considering data from both school years, there were 12 districts that did not report using corporal punishment in either the 2013-14 or 2015-16 school year and seven districts that did not report using it in 2013-14, but did report using corporal punishment in 2015-16. (See Exhibit 2.)
No school board policy allows corporal punishment
Corporal punishment is allowed by school board policy
Page 5
Exhibit 2: Districts where no schools used corporal punishment for any student, 2013-2014 and 2015-2016 school years
Notes: *District did not report using corporal punishment in 2013-14 or 2015-16 school year.**District did not exist in the 2013-14 school year. Source: OREA analysis of U.S. Department of Education Office for Civil Rights data, 2013-14 and 2015-16 school years.
Districts where corporal punishment is not used for students with disabilitiesIn 2015-16, there were 84 districtsC where corporal punishment was allowed per board policy and some, or all, of the schools used it to discipline students. Of those 84 districts, there were 19 that reported using corporal punishment only for students without disabilities, though no district’s school board policy expressly prohibits corporal punishment for students with disabilities. This is similar to the 2013-
C This figure includes Sumner County, which no longer allows corporal punishment per board policy.
2013-2014 school year 2015-2016 school year
Alcoa City Schools* Alcoa City Schools*Bledsoe County* Arlington Community Schools**Bradford Special School District Benton CountyCarroll County* Bledsoe County*Claiborne County* Bradley CountyCleveland City Schools* Campbell CountyDecatur County Carroll County*
Grainger County* Cheatham County
Hamblen County* Claiborne County*Hancock County* Cleveland City Schools*Houston County Dickson CountyHumboldt City Schools Elizabethton City SchoolsLoudon County* Etowah City SchoolsMorgan County* Fayette CountyRichard City Special School District Franklin CountyScott County* Grainger County*Stewart County* Hamblen County*Trousdale County Hancock County*Weakley County Lawrence County
Lexington City SchoolsLoudon County*Manchester City SchoolsMorgan County*Putnam CountyScott County*Stewart County*
Page 6
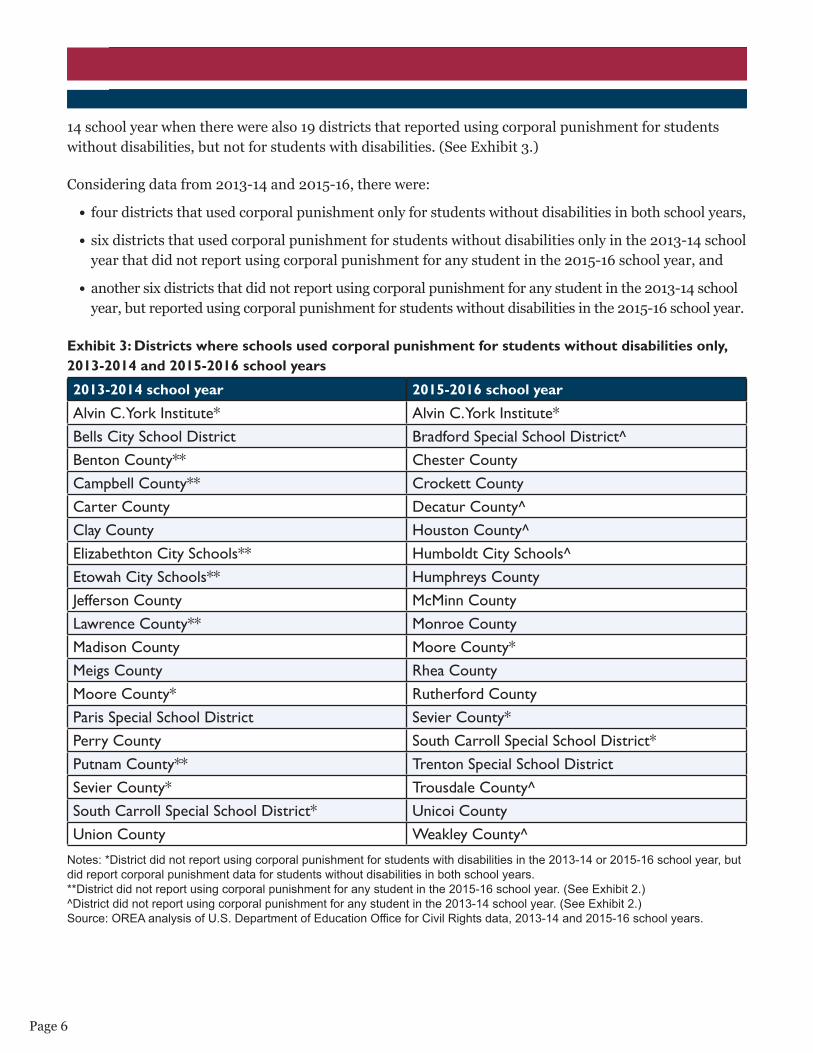
14 school year when there were also 19 districts that reported using corporal punishment for students without disabilities, but not for students with disabilities. (See Exhibit 3.)
Considering data from 2013-14 and 2015-16, there were:
• four districts that used corporal punishment only for students without disabilities in both school years,
• six districts that used corporal punishment for students without disabilities only in the 2013-14 school year that did not report using corporal punishment for any student in the 2015-16 school year, and
• another six districts that did not report using corporal punishment for any student in the 2013-14 school year, but reported using corporal punishment for students without disabilities in the 2015-16 school year.
Exhibit 3: Districts where schools used corporal punishment for students without disabilities only, 2013-2014 and 2015-2016 school years
Notes: *District did not report using corporal punishment for students with disabilities in the 2013-14 or 2015-16 school year, but did report corporal punishment data for students without disabilities in both school years. **District did not report using corporal punishment for any student in the 2015-16 school year. (See Exhibit 2.)^District did not report using corporal punishment for any student in the 2013-14 school year. (See Exhibit 2.)Source: OREA analysis of U.S. Department of Education Office for Civil Rights data, 2013-14 and 2015-16 school years.
2013-2014 school year 2015-2016 school year
Alvin C. York Institute* Alvin C. York Institute*Bells City School District Bradford Special School District^Benton County** Chester CountyCampbell County** Crockett CountyCarter County Decatur County^Clay County Houston County^Elizabethton City Schools** Humboldt City Schools^Etowah City Schools** Humphreys CountyJefferson County McMinn CountyLawrence County** Monroe CountyMadison County Moore County*Meigs County Rhea CountyMoore County* Rutherford CountyParis Special School District Sevier County*Perry County South Carroll Special School District*Putnam County** Trenton Special School DistrictSevier County* Trousdale County^South Carroll Special School District* Unicoi CountyUnion County Weakley County^
Page 7
Appendix E in the full report lists schools and districts that reported using corporal punishment for students with and/or without disabilities for one or more of the four most recent reporting years with available data.
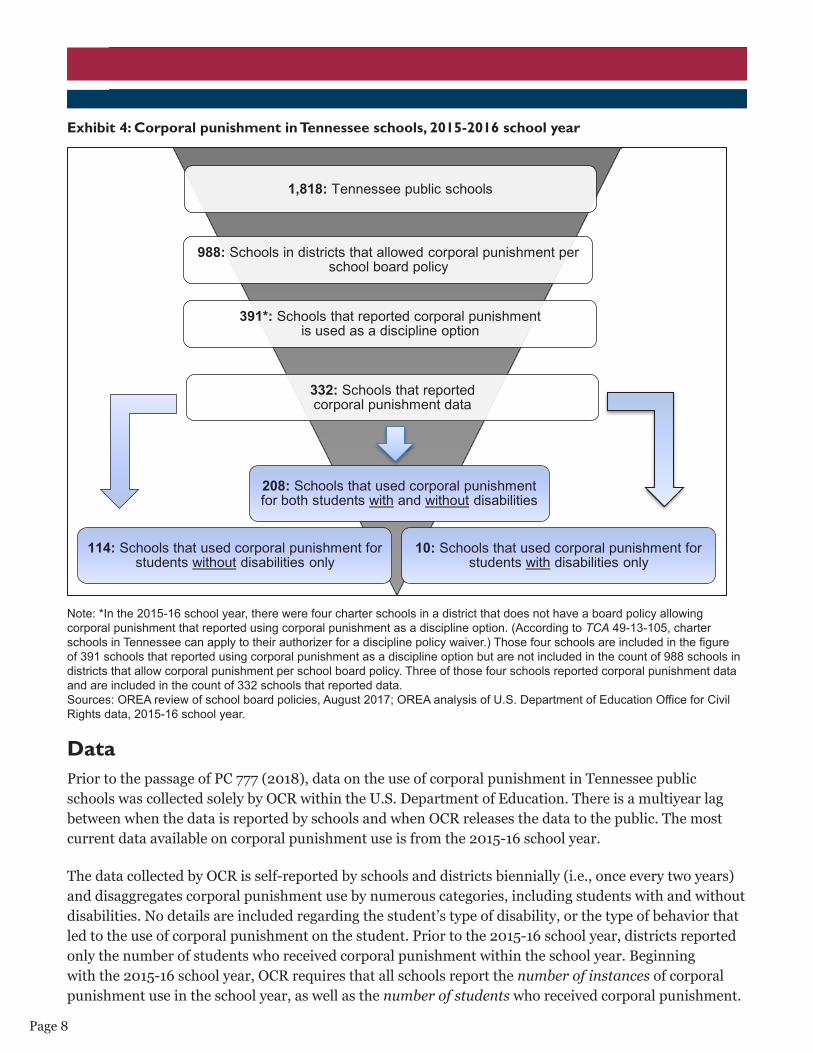
Schools using corporal punishmentWhen reporting data to OCR for the 2015-16 school year, schools were asked if they use corporal punishment to discipline students. Of the 988 schools located in districts with a board policy allowing corporal punishment, 391 responded in the affirmative when asked if their school uses it to discipline students.
If a school responded in the affirmative, they were prompted to report their school’s data on corporal punishment use. Not all schools that responded yes to using corporal punishment reported data indicating its use. Of the 391 schools that responded in the affirmative to using corporal punishment as a discipline option, 59 did not report any data.D This is similar to the 2013-14 school year; in that reporting year, 64 schools that said they use corporal punishment to discipline students did not report any data.
About 34 percent of the schools located in districts with a board policy allowing corporal punishment reported using it in the 2015-16 school year. (Of 988 schools, 332 reported using corporal punishment in 2015-16). This is slightly lower than in 2013-14, when about 40 percent of schools located in districts allowing corporal punishment used it to discipline students. (Of 972 schools, 379 reported using it in 2013-14.)
Exhibit 4 shows a breakdown of the number of schools reporting data to OCR for the 2015-16 school year.
D It is assumed that if a school did not report any data of students receiving corporal punishment, then the school did not use corporal punishment in that school year, despite having confirmed that the school uses corporal punishment as a discipline option.
Page 8
Exhibit 4: Corporal punishment in Tennessee schools, 2015-2016 school year
Note: *In the 2015-16 school year, there were four charter schools in a district that does not have a board policy allowing corporal punishment that reported using corporal punishment as a discipline option. (According to TCA 49-13-105, charter schools in Tennessee can apply to their authorizer for a discipline policy waiver.) Those four schools are included in the figure of 391 schools that reported using corporal punishment as a discipline option but are not included in the count of 988 schools in districts that allow corporal punishment per school board policy. Three of those four schools reported corporal punishment data and are included in the count of 332 schools that reported data.Sources: OREA review of school board policies, August 2017; OREA analysis of U.S. Department of Education Office for Civil Rights data, 2015-16 school year.
DataPrior to the passage of PC 777 (2018), data on the use of corporal punishment in Tennessee public schools was collected solely by OCR within the U.S. Department of Education. There is a multiyear lag between when the data is reported by schools and when OCR releases the data to the public. The most current data available on corporal punishment use is from the 2015-16 school year.
The data collected by OCR is self-reported by schools and districts biennially (i.e., once every two years) and disaggregates corporal punishment use by numerous categories, including students with and without disabilities. No details are included regarding the student’s type of disability, or the type of behavior that led to the use of corporal punishment on the student. Prior to the 2015-16 school year, districts reported only the number of students who received corporal punishment within the school year. Beginning with the 2015-16 school year, OCR requires that all schools report the number of instances of corporal punishment use in the school year, as well as the number of students who received corporal punishment.
1,818: Tennessee public schools
988: Schools in districts that allowed corporal punishment per school board policy
391*: Schools that reported corporal punishment is used as a discipline option
332: Schools that reported corporal punishment data
114: Schools that used corporal punishment for students without disabilities only
208: Schools that used corporal punishment for both students with and without disabilities
10: Schools that used corporal punishment for students with disabilities only
Page 9
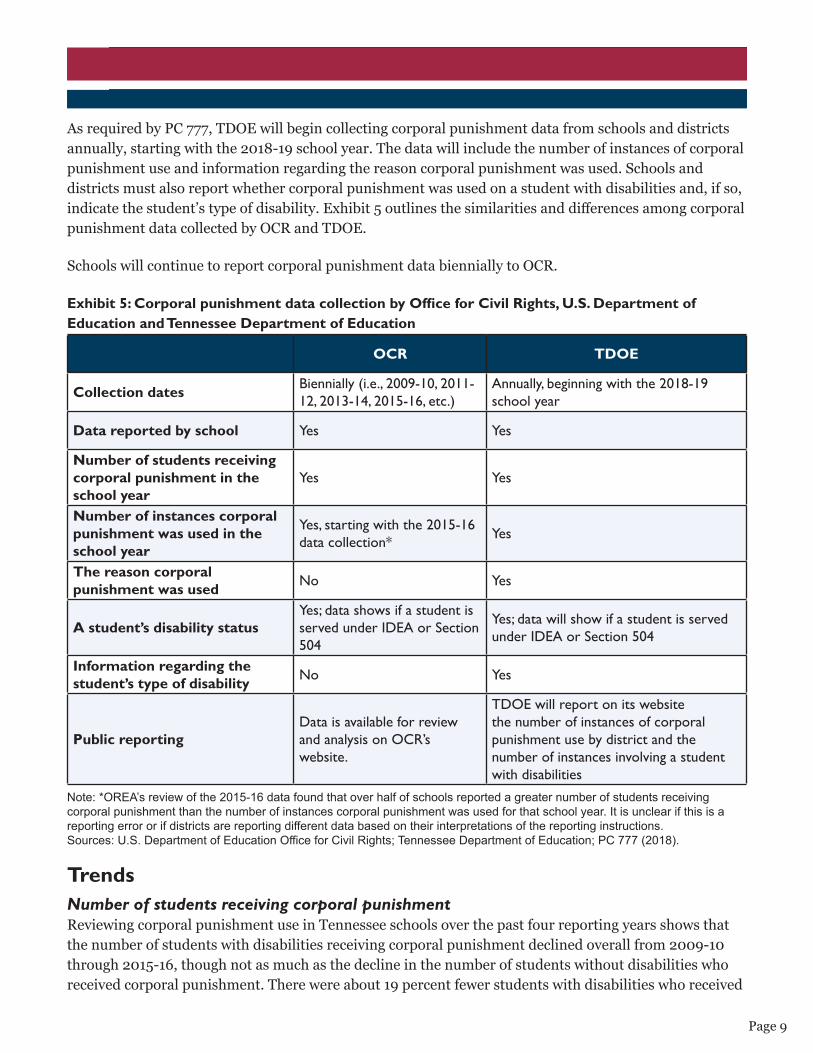
As required by PC 777, TDOE will begin collecting corporal punishment data from schools and districts annually, starting with the 2018-19 school year. The data will include the number of instances of corporal punishment use and information regarding the reason corporal punishment was used. Schools and districts must also report whether corporal punishment was used on a student with disabilities and, if so, indicate the student’s type of disability. Exhibit 5 outlines the similarities and differences among corporal punishment data collected by OCR and TDOE.
Schools will continue to report corporal punishment data biennially to OCR.
Exhibit 5: Corporal punishment data collection by Office for Civil Rights, U.S. Department of Education and Tennessee Department of Education
Note: *OREA’s review of the 2015-16 data found that over half of schools reported a greater number of students receiving corporal punishment than the number of instances corporal punishment was used for that school year. It is unclear if this is a reporting error or if districts are reporting different data based on their interpretations of the reporting instructions.Sources: U.S. Department of Education Office for Civil Rights; Tennessee Department of Education; PC 777 (2018).
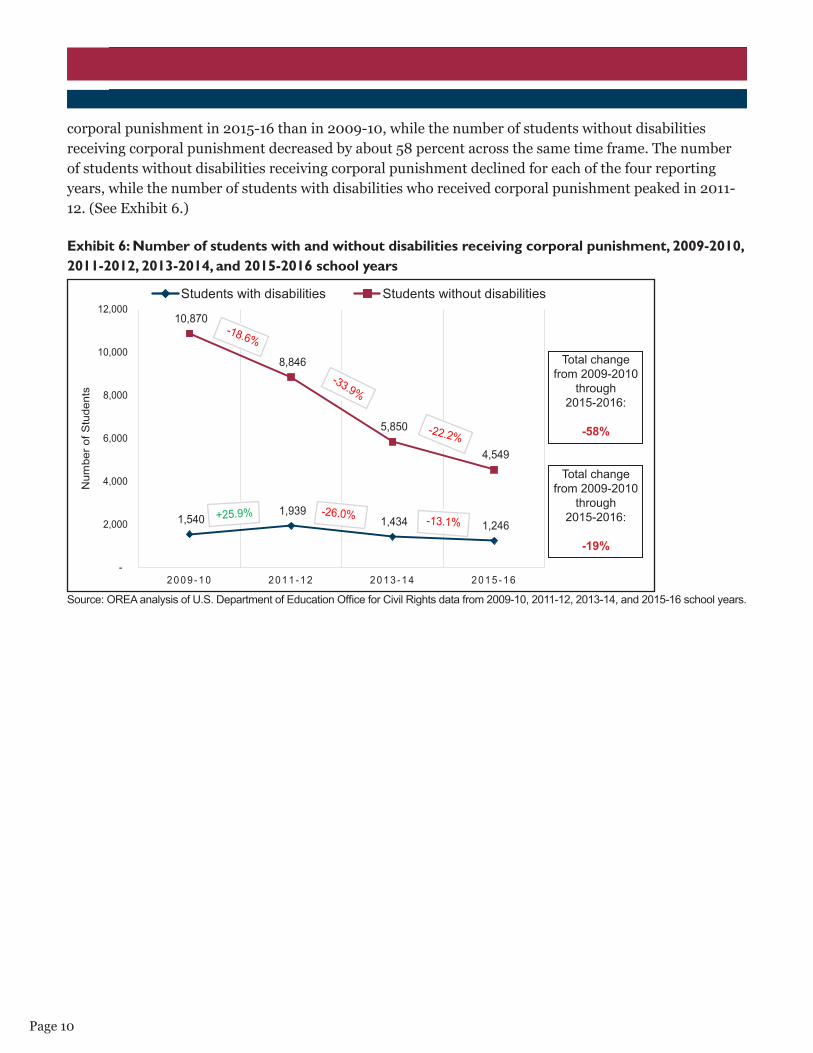
TrendsNumber of students receiving corporal punishmentReviewing corporal punishment use in Tennessee schools over the past four reporting years shows that the number of students with disabilities receiving corporal punishment declined overall from 2009-10 through 2015-16, though not as much as the decline in the number of students without disabilities who received corporal punishment. There were about 19 percent fewer students with disabilities who received
OCR TDOE
Collection dates Biennially (i.e., 2009-10, 2011-12, 2013-14, 2015-16, etc.)
Annually, beginning with the 2018-19 school year
Data reported by school Yes Yes
Number of students receiving corporal punishment in the school year
Yes Yes
Number of instances corporal punishment was used in the school year
Yes, starting with the 2015-16 data collection* Yes
The reason corporal punishment was used No Yes
A student’s disability statusYes; data shows if a student is served under IDEA or Section 504
Yes; data will show if a student is served under IDEA or Section 504
Information regarding the student’s type of disability No Yes
Public reportingData is available for review and analysis on OCR’s website.
TDOE will report on its website the number of instances of corporal punishment use by district and the number of instances involving a student with disabilities
Page 10
corporal punishment in 2015-16 than in 2009-10, while the number of students without disabilities receiving corporal punishment decreased by about 58 percent across the same time frame. The number of students without disabilities receiving corporal punishment declined for each of the four reporting years, while the number of students with disabilities who received corporal punishment peaked in 2011-12. (See Exhibit 6.)
Exhibit 6: Number of students with and without disabilities receiving corporal punishment, 2009-2010, 2011-2012, 2013-2014, and 2015-2016 school years
Source: OREA analysis of U.S. Department of Education Office for Civil Rights data from 2009-10, 2011-12, 2013-14, and 2015-16 school years.
1,540 1,939
1,434 1,246
10,870
8,846
5,850
4,549
-
2,000
4,000
6,000
8,000
10,000
12,000
2009 -10 2011 -12 2013 -14 2015 -16
Num
ber o
f Stu
dent
s
School Year
Students with disabilities Students without disabilities
Total change from 2009-
2010 through2015-2016:
-58%
Total change from 2009-2010 th h
Total change from 2009-2010
through 2015-2016:
-58%
Total change from 2009-2010
through 2015-2016:
-19%
Page 11
Misreporting of corporal punishment data
Corporal punishment data is self-reported by schools, and OREA’s March 2018 publication Corporal Punishment in Tennessee documents reporting errors with corporal punishment data.
After reviewing 2013-14 data in an interview, administrators at one school indicated they had reported the number of instances of corporal punishment, not the number of students receiving corporal punishment. (Schools were not required by OCR to report the number of instances of corporal punishment use until the 2015-16 school year.) This reporting error inflated the school’s rate of use. Additionally, when reporting data to OCR for the 2009-10 school year, one school listed a greater number of students receiving corporal punishment than were enrolled in that category, resulting in a rate of use over 100 percent. Other schools may have misreported corporal punishment data in this manner.
Beginning with the 2015-16 school year, OCR requires that schools report the number of instances of corporal punishment use in the school year, as well as the number of students who received corporal punishment. Of the 332 schools that reported corporal punishment data in 2015-16, 183 schools reported a greater number of students receiving corporal punishment than the number of instances corporal punishment was used for that school year. It is unclear if this is a reporting error or if districts are reporting different data based on their interpretations of the reporting instructions. The data reporting instructions provided to schools and districts by OCR does not clearly specify if an instance of corporal punishment can include more than one student.
These caveats should be considered when reviewing Tennessee’s corporal punishment statistics.
OREA’s March 2018 report, Corporal Punishment in Tennessee, included the following policy consideration:
• Schools and districts should review and improve their data reporting methods. To prevent errors in the reporting of corporal punishment data identified by OREA, schools and districts should review their reporting procedures and ensure corporal punishment data is reported correctly.
Beginning with the 2018-19 school year, the Tennessee Department of Education (TDOE) will begin collecting corporal punishment data from schools and districts. It is anticipated that having TDOE collect and maintain corporal punishment data will make it easier to identify and correct reporting errors.
Page 12
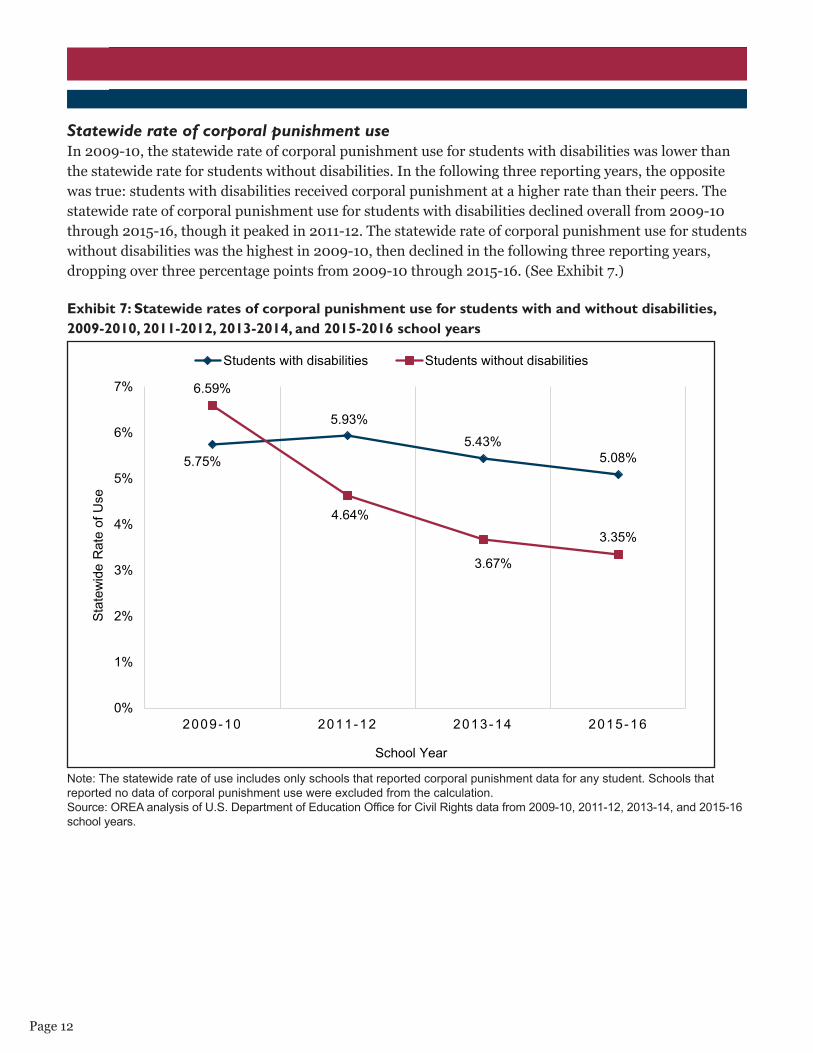
Statewide rate of corporal punishment useIn 2009-10, the statewide rate of corporal punishment use for students with disabilities was lower than the statewide rate for students without disabilities. In the following three reporting years, the opposite was true: students with disabilities received corporal punishment at a higher rate than their peers. The statewide rate of corporal punishment use for students with disabilities declined overall from 2009-10 through 2015-16, though it peaked in 2011-12. The statewide rate of corporal punishment use for students without disabilities was the highest in 2009-10, then declined in the following three reporting years, dropping over three percentage points from 2009-10 through 2015-16. (See Exhibit 7.)
Exhibit 7: Statewide rates of corporal punishment use for students with and without disabilities, 2009-2010, 2011-2012, 2013-2014, and 2015-2016 school years
Note: The statewide rate of use includes only schools that reported corporal punishment data for any student. Schools that reported no data of corporal punishment use were excluded from the calculation.Source: OREA analysis of U.S. Department of Education Office for Civil Rights data from 2009-10, 2011-12, 2013-14, and 2015-16 school years.
5.75%
5.93%5.43%
5.08%
6.59%
4.64%
3.67%
3.35%
0%
1%
2%
3%
4%
5%
6%
7%
2009-10 2011-12 2013-14 2015-16
Stat
ewid
e R
ate
of U
se
School Year
Students with disabilities Students without disabilities
Page 13
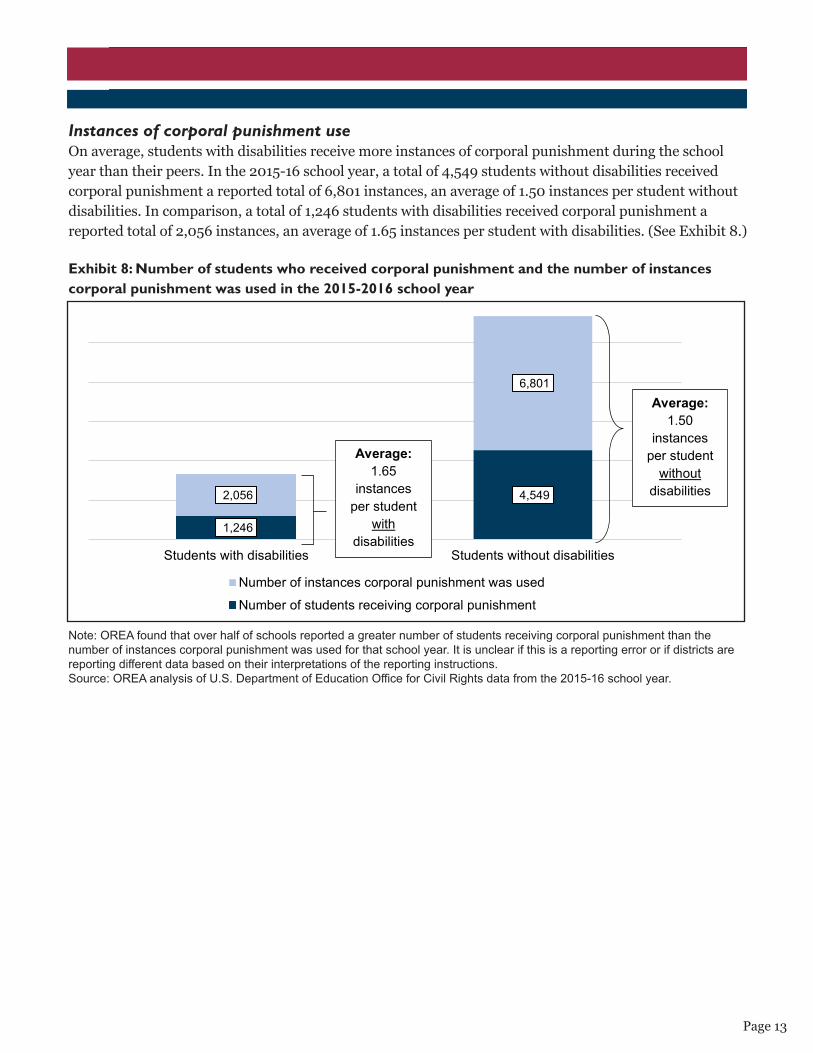
Instances of corporal punishment useOn average, students with disabilities receive more instances of corporal punishment during the school year than their peers. In the 2015-16 school year, a total of 4,549 students without disabilities received corporal punishment a reported total of 6,801 instances, an average of 1.50 instances per student without disabilities. In comparison, a total of 1,246 students with disabilities received corporal punishment a reported total of 2,056 instances, an average of 1.65 instances per student with disabilities. (See Exhibit 8.)
Exhibit 8: Number of students who received corporal punishment and the number of instances corporal punishment was used in the 2015-2016 school year
Note: OREA found that over half of schools reported a greater number of students receiving corporal punishment than the number of instances corporal punishment was used for that school year. It is unclear if this is a reporting error or if districts are reporting different data based on their interpretations of the reporting instructions.Source: OREA analysis of U.S. Department of Education Office for Civil Rights data from the 2015-16 school year.
1,246
4,549 2,056
6,801
Students with disabilities Students without disabilities
Number of instances corporal punishment was used
Number of students receiving corporal punishment
Average:1.65
instances per student
withdisabilities
Average:1.50
instances per student
withoutdisabilities
Page 14
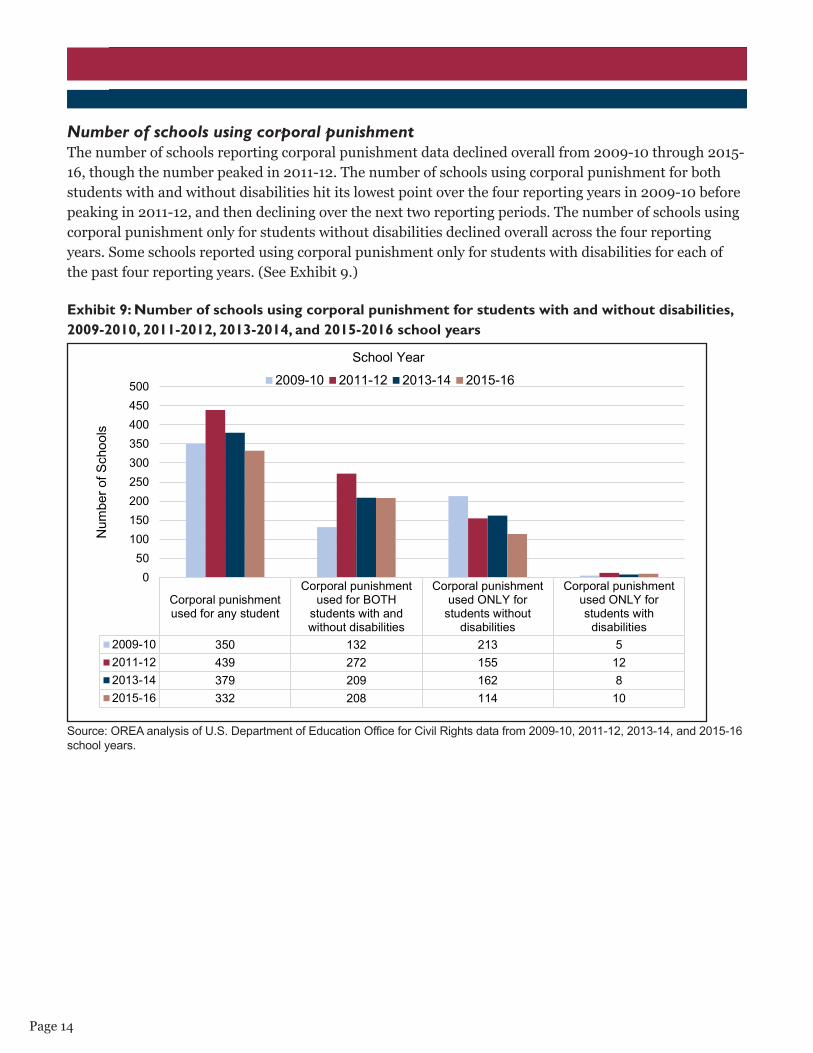
Number of schools using corporal punishmentThe number of schools reporting corporal punishment data declined overall from 2009-10 through 2015-16, though the number peaked in 2011-12. The number of schools using corporal punishment for both students with and without disabilities hit its lowest point over the four reporting years in 2009-10 before peaking in 2011-12, and then declining over the next two reporting periods. The number of schools using corporal punishment only for students without disabilities declined overall across the four reporting years. Some schools reported using corporal punishment only for students with disabilities for each of the past four reporting years. (See Exhibit 9.)
Exhibit 9: Number of schools using corporal punishment for students with and without disabilities, 2009-2010, 2011-2012, 2013-2014, and 2015-2016 school years
Source: OREA analysis of U.S. Department of Education Office for Civil Rights data from 2009-10, 2011-12, 2013-14, and 2015-16 school years.
Corporal punishmentused for any student
Corporal punishmentused for BOTH
students with andwithout disabilities
Corporal punishmentused ONLY for
students withoutdisabilities
Corporal punishmentused ONLY forstudents with
disabilities2009-10 350 132 213 52011-12 439 272 155 122013-14 379 209 162 82015-16 332 208 114 10
050
100150200250300350400450500
Num
ber o
f Sch
ools
School Year
2009-10 2011-12 2013-14 2015-16
Page 15
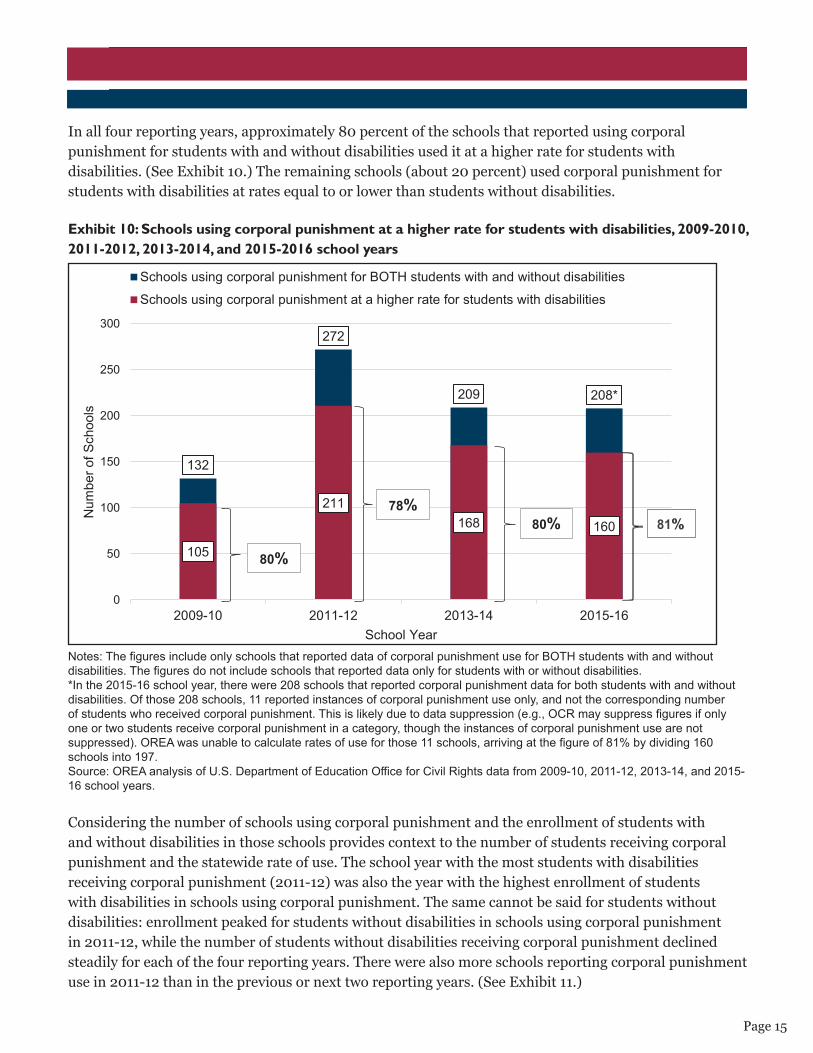
In all four reporting years, approximately 80 percent of the schools that reported using corporal punishment for students with and without disabilities used it at a higher rate for students with disabilities. (See Exhibit 10.) The remaining schools (about 20 percent) used corporal punishment for students with disabilities at rates equal to or lower than students without disabilities.
Exhibit 10: Schools using corporal punishment at a higher rate for students with disabilities, 2009-2010, 2011-2012, 2013-2014, and 2015-2016 school years
Notes: The figures include only schools that reported data of corporal punishment use for BOTH students with and without disabilities. The figures do not include schools that reported data only for students with or without disabilities.*In the 2015-16 school year, there were 208 schools that reported corporal punishment data for both students with and without disabilities. Of those 208 schools, 11 reported instances of corporal punishment use only, and not the corresponding number of students who received corporal punishment. This is likely due to data suppression (e.g., OCR may suppress figures if only one or two students receive corporal punishment in a category, though the instances of corporal punishment use are not suppressed). OREA was unable to calculate rates of use for those 11 schools, arriving at the figure of 81% by dividing 160 schools into 197.Source: OREA analysis of U.S. Department of Education Office for Civil Rights data from 2009-10, 2011-12, 2013-14, and 2015-16 school years.
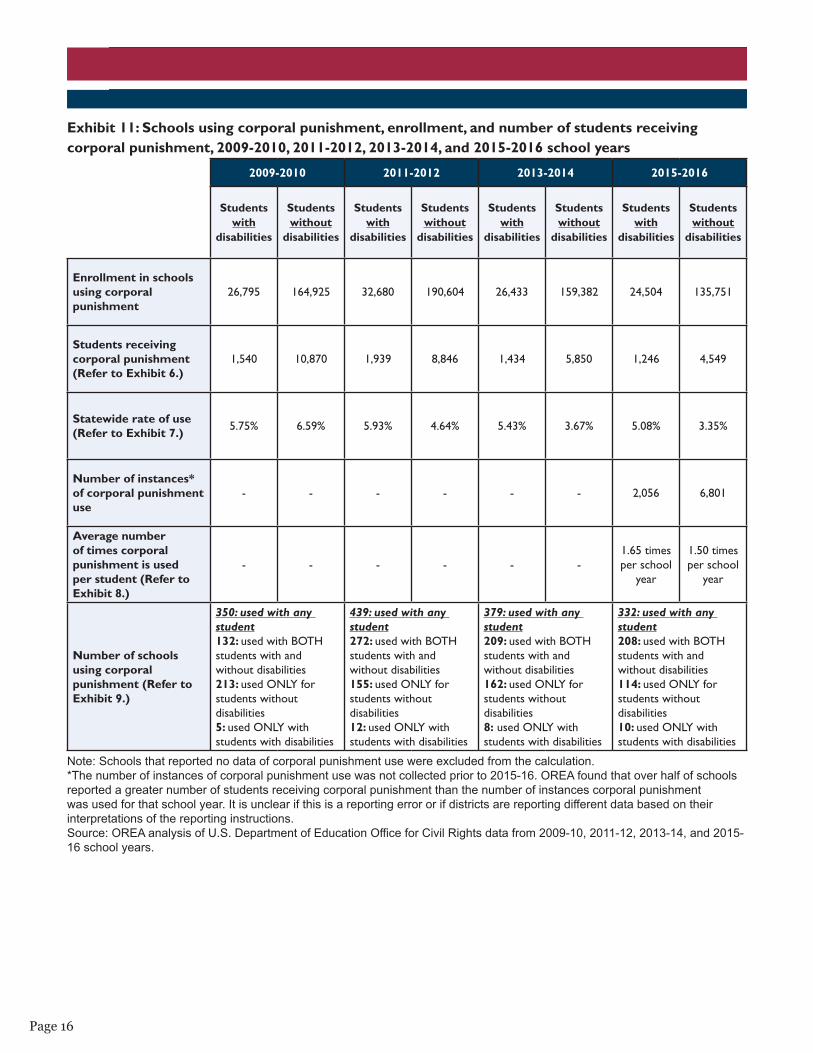
Considering the number of schools using corporal punishment and the enrollment of students with and without disabilities in those schools provides context to the number of students receiving corporal punishment and the statewide rate of use. The school year with the most students with disabilities receiving corporal punishment (2011-12) was also the year with the highest enrollment of students with disabilities in schools using corporal punishment. The same cannot be said for students without disabilities: enrollment peaked for students without disabilities in schools using corporal punishment in 2011-12, while the number of students without disabilities receiving corporal punishment declined steadily for each of the four reporting years. There were also more schools reporting corporal punishment use in 2011-12 than in the previous or next two reporting years. (See Exhibit 11.)
132
272
209 208*
105
211168 160
0
50
100
150
200
250
300
2009-10 2011-12 2013-14 2015-16
Num
ber o
f Sch
ools
School Year
Schools using corporal punishment for BOTH students with and without disabilities
Schools using corporal punishment at a higher rate for students with disabilities
80%
80%78%
81%
Page 16
Exhibit 11: Schools using corporal punishment, enrollment, and number of students receiving corporal punishment, 2009-2010, 2011-2012, 2013-2014, and 2015-2016 school years
Note: Schools that reported no data of corporal punishment use were excluded from the calculation. *The number of instances of corporal punishment use was not collected prior to 2015-16. OREA found that over half of schools reported a greater number of students receiving corporal punishment than the number of instances corporal punishment was used for that school year. It is unclear if this is a reporting error or if districts are reporting different data based on their interpretations of the reporting instructions.Source: OREA analysis of U.S. Department of Education Office for Civil Rights data from 2009-10, 2011-12, 2013-14, and 2015-16 school years.
2009-2010 2011-2012 2013-2014 2015-2016
Students with
disabilities
Students without
disabilities
Students with
disabilities
Students without
disabilities
Students with
disabilities
Students without
disabilities
Students with
disabilities
Students without
disabilities
Enrollment in schools using corporal punishment
26,795 164,925 32,680 190,604 26,433 159,382 24,504 135,751
Students receiving corporal punishment(Refer to Exhibit 6.)
1,540 10,870 1,939 8,846 1,434 5,850 1,246 4,549
Statewide rate of use (Refer to Exhibit 7.) 5.75% 6.59% 5.93% 4.64% 5.43% 3.67% 5.08% 3.35%
Number of instances* of corporal punishment use
- - - - - - 2,056 6,801
Average number of times corporal punishment is used per student (Refer to Exhibit 8.)
- - - - - -1.65 times per school
year
1.50 times per school
year
Number of schools using corporal punishment (Refer to Exhibit 9.)
350: used with any student132: used with BOTH students with and without disabilities213: used ONLY for students without disabilities5: used ONLY with students with disabilities
439: used with any student272: used with BOTH students with and without disabilities 155: used ONLY for students without disabilities12: used ONLY with students with disabilities
379: used with any student209: used with BOTH students with and without disabilities162: used ONLY for students without disabilities8: used ONLY with students with disabilities
332: used with any student208: used with BOTH students with and without disabilities114: used ONLY for students without disabilities10: used ONLY with students with disabilities
Page 17
LimitationsAvailable data is not current
Data on the use of corporal punishment is self-reported by schools and districts biennially to OCR. A multiyear lag exists between the reporting year and when data is publicly available; the most current data available on corporal punishment use is from the 2015-16 school year. The next reporting year will include data from the 2017-18 school year, expected to be available in 2020.With the passage of PC 777 (2018), schools are required to report corporal punishment data to TDOE on an annual basis, beginning with the 2018-19 school year.
Reporting errors existInformation on reporting errors are detailed earlier. See page 11.
Data by disability categoryBased on a review of the disability categories served under IDEA and Section 504, there is a spectrum of disabilities for which students may receive services in Tennessee schools, ranging from temporary medical issues to a severe cognitive disability. When schools report corporal punishment data to OCR, students with disabilities are identified as receiving services under IDEA or Section 504; no further details are provided. The lack of specificity prevents OREA from determining which types of students with disabilities receive corporal punishment. (See Appendix C in the full report for a detailed explanation of IDEA and Section 504.)
PC 777 (2018), which requires schools to report corporal punishment data to TDOE, also requires more details be reported. Starting with the 2018-19 school year, schools will annually report corporal punishment data to TDOE, including each instance of corporal punishment use, information regarding the reason for each instance of corporal punishment use, whether the instance involves a student with disabilities, and, if so, information regarding the student’s type of disability. This additional information will make it possible to determine which types of students with disabilities receive corporal punishment, and the behaviors that lead to its use.
Tennessee-specific disability categories Tennessee recognizes two disability categories (Functional Delay and Intellectually Gifted) that are not included in the federal IDEA law. These two categories have a combined five-year average enrollment of about 21,600 students. Any student identified solely under one of these two disability categories in Tennessee would not be counted as a student with disabilities when schools report to OCR, as long as schools abide by OCR’s instruction to report using the federally recognized disability categories. (It is unclear if schools follow this instruction.) This potential exclusion of students should be considered when reviewing Tennessee’s corporal punishment statistics.
This specific limitation will be addressed when schools begin reporting data to TDOE, beginning with the 2018-19 school year. Schools will identify students who fall into these two disability categories as students with disabilities when reporting corporal punishment data to TDOE.
Page 18
MethodologyVariablesWhen schools report corporal punishment data to OCR, students with disabilities are reported as receiving services under either IDEA or Section 504.E To perform the data analysis, OREA combined the number of students receiving services under both programs to create the variable “students with disabilities.” The category for “students without disabilities” includes all other students enrolled who were not identified as receiving disability services or accommodations.
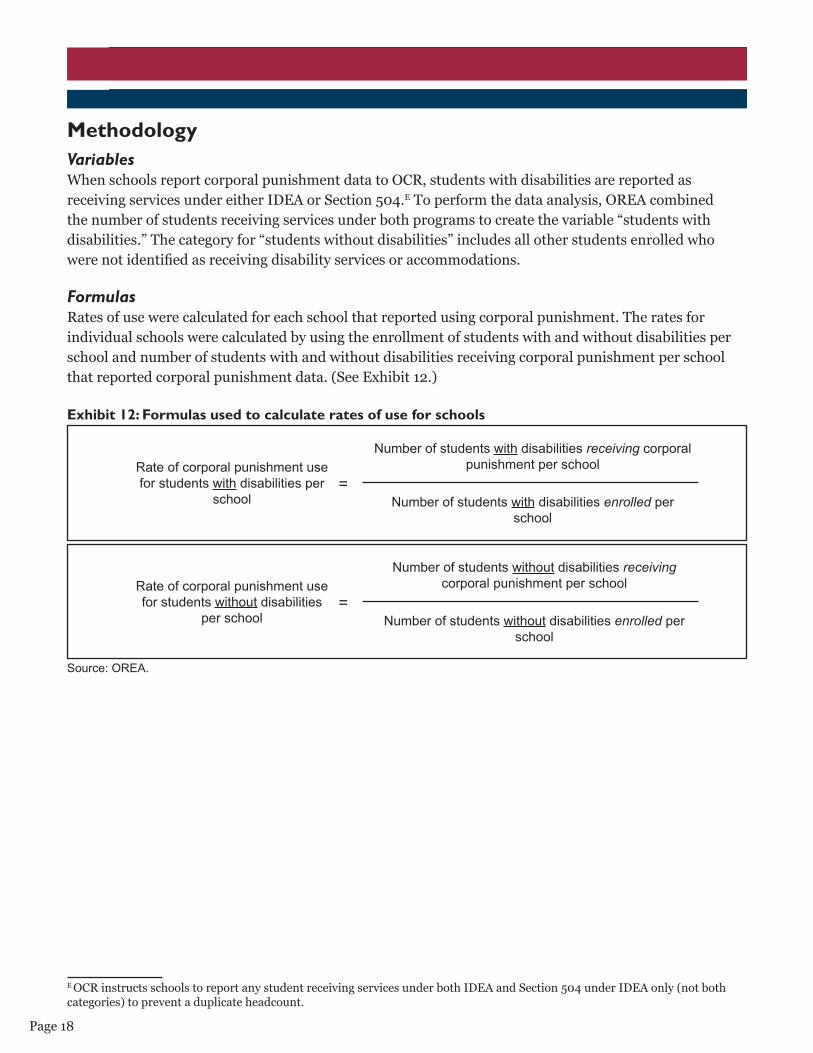
FormulasRates of use were calculated for each school that reported using corporal punishment. The rates for individual schools were calculated by using the enrollment of students with and without disabilities per school and number of students with and without disabilities receiving corporal punishment per school that reported corporal punishment data. (See Exhibit 12.)
Exhibit 12: Formulas used to calculate rates of use for schools
Source: OREA.
E OCR instructs schools to report any student receiving services under both IDEA and Section 504 under IDEA only (not both categories) to prevent a duplicate headcount.
Rate of corporal punishment use for students with disabilities per
school
Number of students with disabilities receiving corporal punishment per school
Number of students with disabilities enrolled per school
Number of students without disabilities receiving corporal punishment per school
Number of students without disabilities enrolled per school
Rate of corporal punishment use for students without disabilities
per school
=
=
Page 19
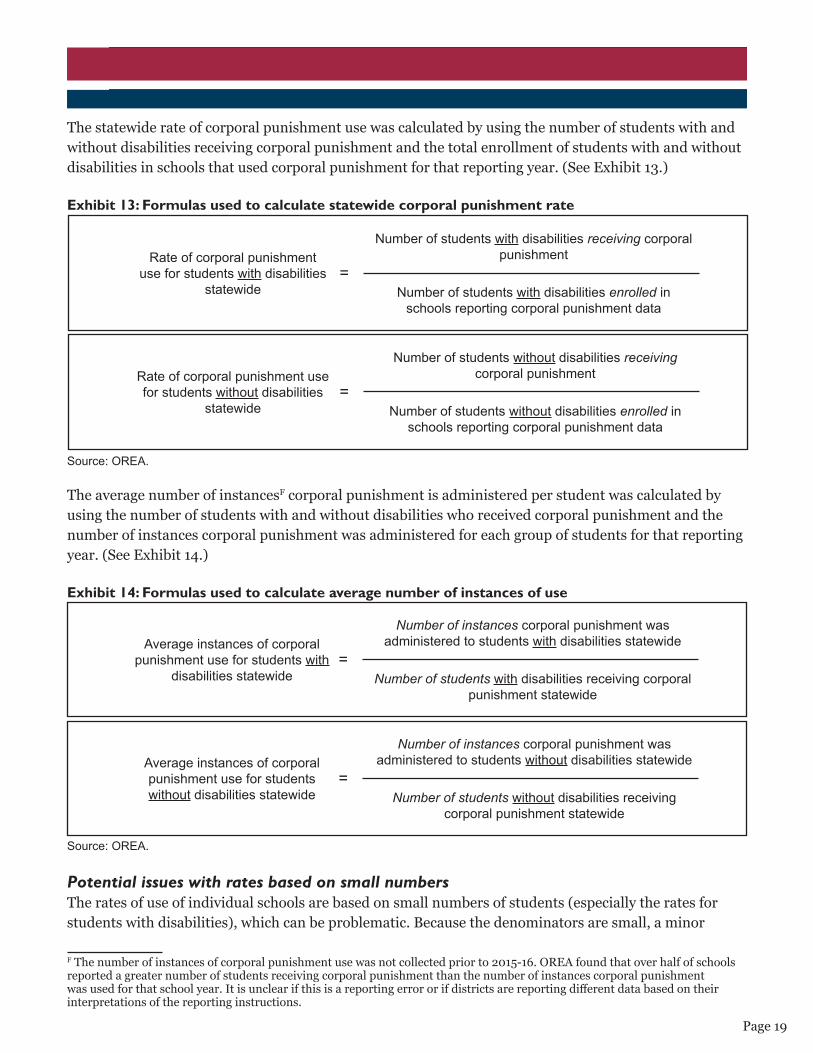
The statewide rate of corporal punishment use was calculated by using the number of students with and without disabilities receiving corporal punishment and the total enrollment of students with and without disabilities in schools that used corporal punishment for that reporting year. (See Exhibit 13.)
Exhibit 13: Formulas used to calculate statewide corporal punishment rate
Source: OREA.
The average number of instancesF corporal punishment is administered per student was calculated by using the number of students with and without disabilities who received corporal punishment and the number of instances corporal punishment was administered for each group of students for that reporting year. (See Exhibit 14.)
Exhibit 14: Formulas used to calculate average number of instances of use
Source: OREA.
Potential issues with rates based on small numbersThe rates of use of individual schools are based on small numbers of students (especially the rates for students with disabilities), which can be problematic. Because the denominators are small, a minor
F The number of instances of corporal punishment use was not collected prior to 2015-16. OREA found that over half of schools reported a greater number of students receiving corporal punishment than the number of instances corporal punishment was used for that school year. It is unclear if this is a reporting error or if districts are reporting different data based on their interpretations of the reporting instructions.
Average instances of corporal punishment use for students with
disabilities statewide
Number of instances corporal punishment was administered to students with disabilities statewide
Number of students with disabilities receiving corporal punishment statewide
Number of instances corporal punishment was administered to students without disabilities statewide
Number of students without disabilities receiving corporal punishment statewide
Average instances of corporal punishment use for students without disabilities statewide
=
=
Rate of corporal punishment use for students with disabilities
statewide
Number of students with disabilities receiving corporal punishment
Number of students with disabilities enrolled in schools reporting corporal punishment data
Number of students without disabilities receiving corporal punishment
Number of students without disabilities enrolled in schools reporting corporal punishment data
Rate of corporal punishment use for students without disabilities
statewide
=
=
Page 20
change in the numerator can produce volatile rates of use. For example, a school may have a total of 10 students with disabilities enrolled, and if two of those students receive corporal punishment, the school’s rate of corporal punishment use for students with disabilities would be 20 percent. Adding or subtracting one student with disabilities receiving corporal punishment would change the rate of use by 1o percentage points in either direction.
For students without disabilities, the denominator is typically larger than the numerator (i.e., schools typically have more students enrolled without disabilities than with disabilities), so a change to the numerator creates a smaller change in the rate of use. If a school has 300 students without disabilities enrolled, and 30 of them receive corporal punishment, the school’s rate of use is 10 percent. Adding or subtracting one student receiving corporal punishment creates a much smaller change to the school’s rate of use, about one-third of 1 percentage point in either direction. In this example, removing one student receiving corporal punishment creates a rate of use of 9.67 percent while adding one student creates a rate of use of 10.33 percent.
One study addressing this issue suggests using averages across multiple years (i.e., five-year average enrollment and number of students receiving corporal punishment) to reduce volatility in rates from one year to the next.G It was not possible to calculate five-year average rates of use per school for this report because many schools do not report corporal punishment data in each reporting year. It would be problematic to create multiyear average rates of use for some schools but not all schools. To address this issue, Appendix E in the full report contains enrollment and corporal punishment use numbers alongside the rates of use for each school that reported data in one or more of the past four reporting years (2009-10, 2011-12, 2013-14, and 2015-16). Readers can compare the rate of use to the number of students enrolled and receiving corporal punishment, rather than the rate of use alone.
District discrepanciesThe most recent year of corporal punishment data available is from the 2015-16 school year. One district has rescinded its corporal punishment policy since then, meaning it will no longer administer corporal punishment in its schools. (Sumner County repealed its corporal punishment policy in July 2017.) Schools in this district are included in the data analysis and counts of schools that reported data, though the district is not among the 109 school districts with a board policy allowing corporal punishment use.
Two districts, both of which have a board policy allowing corporal punishment, were created in 2014 (Arlington Community Schools and Millington Municipal Schools). Data from these schools were not reported under their respective districts until the 2015-16 school year.
One district with a board policy allowing corporal punishment did not report data for the 2013-14 school year (Robertson County). Accordingly, schools in this district were not included in the data analysis or count of schools using corporal punishment for the 2013-14 school year.
G Paul A. Buescher, “Statistical Primer: Problems with Rates Based on Small Numbers (Revised),” North Carolina Department of Health and Human Services, Division of Public Health, State Center of Health Statistics, No. 12, 1997, rev. 2008.
Page 21
Contact Information
Justin P. WilsonComptroller of the Treasury
Jason E. MumpowerChief of Staff
State CapitolNashville, Tennessee 37243
615.741.2501
For more information, please visit theComptroller’s Office of Research & Education Accountability at:
www.comptroller.tn.gov/orea