CORN LEAF APHID AND POLYSORA RUST RESISTANCE IN …
99
CORN LEAF APHID AND POLYSORA RUST RESISTANCE IN TROPICAL MAIZE A THESIS SUBMITTED TO THE GRADUATE DIVISION OF THE UNIVERSITY OF HA WAIT IN PARTIAL FULFILLMENT OF THE REQUIREMENTS FOR THE DEGREE OF MASTER OF SCIENCE IN HORTICULTURE AUGUST 2003 By Yoon-Sup So Thesis Committee: James L. Brewbaker, Chairperson Richard M. Manshardt Chifumi Nagai
Transcript of CORN LEAF APHID AND POLYSORA RUST RESISTANCE IN …

CORN LEAF APHID AND POLYSORA RUST RESISTANCE
IN TROPICAL MAIZE
A THESIS SUBMITTED TO THE GRADUATE DIVISION OF THE UNIVERSITY OF HA WAIT IN PARTIAL FULFILLMENT
OF THE REQUIREMENTS FOR THE DEGREE OF
MASTER OF SCIENCE
IN
HORTICULTURE
AUGUST 2003
ByYoon-Sup So
Thesis Committee:
James L. Brewbaker, Chairperson Richard M. Manshardt
Chifumi Nagai

We certify that we have read this thesis and that, in our opinion, it is satisfactory in scope
and quality as a thesis for the degree of Master o f Science in Horticulture.
THESIS COMMITTEE

@ Copyright 2003
by
Yoon-Sup So
in

I am grateful to my committee chairman Dr. James L. Brewbaker for his support.
His knowledge and experiences were o f great value throughout the entire process o f this
research project. I would also like to express my sincere appreciation to Drs. Richard M.
Manshardt and Chifumi Nagai who served on my thesis committee.
I had a great help from all Waimanalo Research Station staff involving the station
manager, Mr. Rogelio Corrales. Without their excellent field management and practices,
this project would never have been successful. I would like to acknowledge all of them
here; Francisco Pagay, Ronald Luning, Juanito Gorces, Olivio Arios, Curtis Kobashigawa,
Wilson Kaahanui, Michael Parmacio, Thoran Evans. In addition, my appreciation extends
to Lynnette Horiuchi and Susan Takahashi in the Department office who have been
always kind, helpful and supportive to me.
I wish to express my sincere appreciation to Dr. Soon-Kwon Kim, my former
advisor in South Korea, whose passion and fervor have led me to pursue my study in
maize breeding. I’m also particularly indebted to Drs. Hee-Chung Ji and Hyung-Joo Jin
for their time and effort for setting up the artificial inoculation technique and field
evaluation. I thank Drs. Robert E. Pauli, Chung-Shih Tang, Russell H. Messing, Ray
Ming, Young-Soo Keum for their time and counsel on various aspects on the project for
which I am extremely grateful.
Finally, special thanks are expressed to my parents, brother and sister-in-low for
their patience, understanding and emotional assistance during entire period o f the study in
Hawaii.
ACKNOWLEDGMENTS
IV

ABSTRACT
This research includes two separate studies both of which incorporated generation
mean analyses to interpret genetically the resistance to com leaf aphid and polysora mst
in tropical maize.
The first study focused on resistance to com leaf aphid in tropical sweet corn
inbred Hi38-71. An inoculation technique using hair-pin clip cages and infestation
quantification method using digital image analysis were developed for this study. During
the study, a heavy natural infestation of com leaf aphids occurred in a seed production
nursery. Yield loss by ranged from 38.9% to 98.8%, with an average loss of 71.7%. The
clip-cage method was effective in distinguishing resistant and susceptible plants under
field conditions. Resistance to com leaf aphid from Hi38-71 appeared to be monogenic
and recessive. Aphid reproduction and population growth were measured on four
different genotypes of varying aphid tolerance. Aphids on Hi38-71 had poorest
performance over all aspects of growth and reproduction examined. Difference in number
of progenies produced and days to 50% mortality appeared to account for most of the
difference observed in the genetic study.
The second study estimated genetic parameters for polysora mst resistance in
Hi38-71. Hi38-71 exhibited moderately high resistance to polysora mst as well as
resistance to com leaf aphid. Generation mean analysis showed that epistatic interactions
of [aa] and [dd\ along with simple dominance and additive gene effects were involved in
controlling resistance in Hi38-71 to polysora mst. It is concluded that polysora resistance

breeding cannot be based on selection of a single parent but a hybrid-breeding or
reciprocal recurrent selection approach appears justified.
The tropical sweet com inbred, Hi38-71 is a sib line of Hi38 which was bred from
a bt-\ conversion of AA8sh2. AA8sh2 was studied for its resistance to com leaf aphid in
1970’s in Hawaii and was converted to common rust resistance, Rdl-D which broke
down due to evolved racial variation of the pathogen. Hi38-71is thus of particular value
in sweet com breeding for tropical regions. This is due not only to its resistance to com
leaf aphid and polysora, but to its high sweet com qualities and generally good
combining abilities.
VI

TABLE OF CONTENTS
ACKNOWLEDGMENTS
ABSTRACT
LIST OF TABLES
LIST OF FIGURES
•IV
•X
•xil
CHAPTER 1 : LITERATURE REVIEW
1.1. CORN LEAF APHID, Rhopalosiphum maidis (Fitch)-
I. 1. 1. Distribution.........................................................
1. 2 .
. 1 . 2 . Host range.............................
. 1 . 3 . Biology..................................
. 1 . 4 . Aphid feeding activity.........
. 1 . 5 . Reproduction........................
. 1 . 6 . Biotype..................................
. 1 . 7 . Com leaf aphid in Hawaii •••
APHID-PLANT RELATIONSHIP
. 2. 1. Damage on plant by aphid attack.........
. 2 . 2 . Vector o f plant viruses..........................
I. 2. 3. Development at different plant stages-
1. 3. HOST PLANT RESISTANCE TO INSECTS
1.3. 1. Host plant resistance...
1.3.2. Categories o f resistance
•2
•2
•3
•4
•4
•6
•7
•7
•8
•8
•9
•9
•10
Vll

1.3.3. Mechanism of resistance................................................................................ 11
1.3.4. Com leaf aphid resistance in m aize..............................................................14
1. 4. POLYSORA RUST IN M AIZE.............................................................................. 16
1. 5. GENERATION MEAN ANALYSIS........................................................................19
1. 5. 1. Components of m ean................................................................................... 20
1. 5. 2. Scaling test for additive-dominance model............................................... 24
1. 5. 3. Joint scaling test and perfect f i t .................................................................... 24
1.5.4. Non-allelic interaction................................................................................... 25
CHAPTER 2 : YIELD LOSS AND RESISTANCE TO CORN LEAF APHID 29
ABSTRACT.................................................................................................................29
2. 1. INTRODUCTION....................................................................................................... 30
2. 2. MATERIALS AND M ETHODS..............................................................................31
2. 2. 1. Observation o f yield loss ..............................................................................31
2. 2. 2. Generation mean analysis..............................................................................32
2. 2. 3. Hair-pin clip cage............................................................................................ 33
2. 2. 4. Inoculation.......................................................................................................35
2. 2. 5. Quantification of resistance........................................................................ 35
2. 2. 6 . Statistical methods .......................................................................................36
2. 2. 7. Survival and reproduction of com leaf aph id ........................................... 39
2. 3. RESULTS................................................................................................................... 40
2. 3. 1. Yield loss t r i a l .............................................................................................. 40
2. 3. 2. Resistance in Hi38-71.................................................................................. 42
viii

2. 3. 3. Survival and reproduction of aphids.......................................................... 49
2. 4. DISCUSSION..............................................................................................................52
2. 4. 1. Yield loss ......................................................................................................52
2. 4. 2. Inoculation and quantification ................................................................... 54
2. 4. 3. Resistance to corn leaf aphid ....................................................................... 56
CHAPTER 3 : ESTIMATION OF GENETIC PARAMETERS FOR
POLYSORA RUST RESISTANCE 59
ABSTRACT..................................................................................................................59
3. 1. INTRODUCTION ......................................................................................................60
3. 2. MATERIALS AND M ETHODS............................................................................61
3.2. 1. Generation mean analysis ........................................................................... 61
3. 2. 2. Disease evaluation .........................................................................................61
3. 2. 3. Statistical methods .......................................................................................63
3. 3. RESULTS ..................................................................................................................64
3. 4. DISCUSSION ........................................................................................................... 71
Appendix A. Predators o f com leaf aphid in Waimanalo AgriculturalResearch Station.................................................................................................. 74
Appendix B. Rating scores of com leaf aphid coverageamong Hi38-71 x Hi27 family.......................................................................... 75
Appendix C. Rating scores of polysora mst among Hi38-71 x G24 family....................... 77
REFERENCES...........................................................................................................................78
ix

LIST OF TABLES
Table 1. Components of means for different generations of a GMA on the six parameter models (Mather and Jinks, 1977). Note that 3 parameter model involves only m, [a] and { d \. .................... 23
Table 2. Phenotypes from nine genotypes comprising all combinationsof A-a and B-b in the presence o f non-allelic interaction withoutlinkage (Mather and Jinks, 1977)...............................................................................25
Table 3. Interactions in the means of families of a digenic cross(Mather and Jinks, 1977)............................................................................................28
Table 4. Analysis of variance for mean aphid coverage ratings for sixgenerations o f Hi38-71 (resistant) x Hi27 (susceptible).........................................45
Table 5. The com leaf aphid coverage ratings for two parents, Hi38-71(Pr)and Hi27(Ps), Fi, F2 and backcross (BCr & BCs) generations..............................45
Table 6 . Individual scaling tests on aphid coverage ratings from Hi38-71X Hi27 family................................................................................................................48
Table 7. Joint scaling test of the additive-dominance (3 parameter) model on Hi38-71(Pr) x Hi27(Ps) family for aphid coverage rating from spring and fall tria ls .....................................................................................................50
Table 8 . Joint scaling test of the additive-dominance (3 parameter) model on the Hi38-71(Pr) x Hi27(Ps) family for aphid coverage rating from combined data.....................................................................................................50
Table 9. Performance of com leaf aphid on different maize genotypes. ............................51
Table 10. Estimates of mean, variance, number of plant, variance of mean and standard error of polysora mst rating for theHi3 8-71 xG24 family. ............................................................................................. 65
X
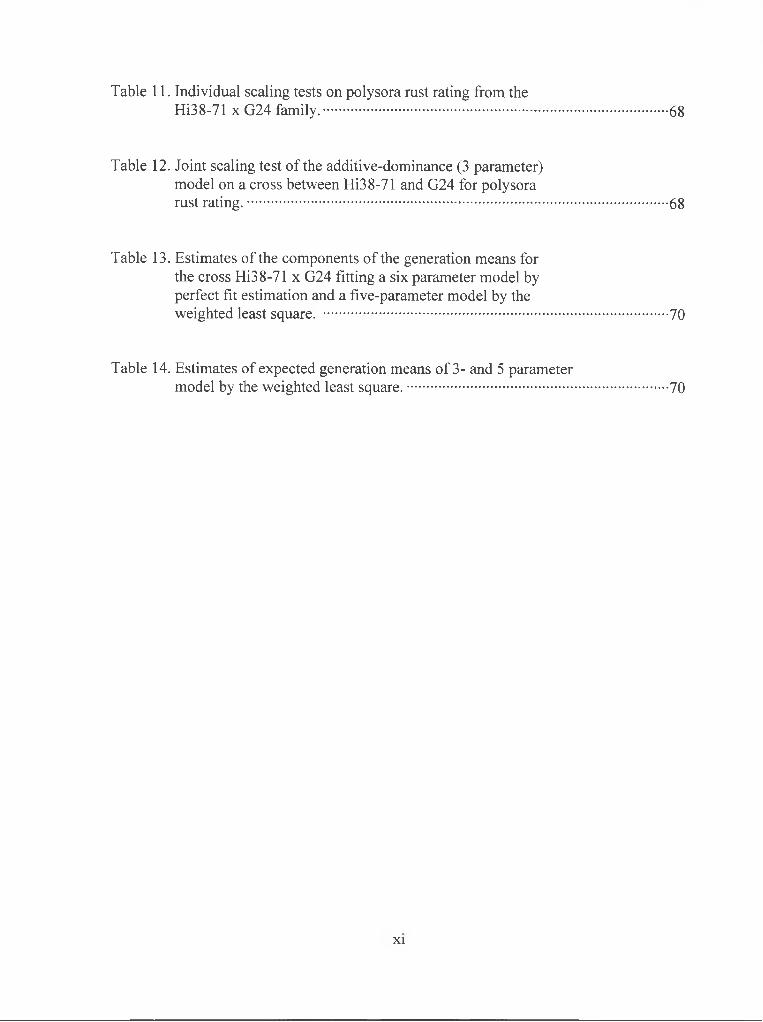
Table 11. Individual scaling tests on polysora rust rating from theHi38-71 X G24 family............................................................................................... 68
Table 12. Joint scaling test o f the additive-dominance (3 parameter) model on a cross between Hi38-71 and G24 for polysora rust rating....................................................................................................................68
Table 13. Estimates of the components of the generation means for the cross Hi38-71 x G24 fitting a six parameter model by perfect fit estimation and a five-parameter model by theweighted least square. .............................................................................................. 70
Table 14. Estimates of expected generation means of 3- and 5 parametermodel by the weighted least square........................................................................ 70
XI

LIST OF FIGURES
Fig. 1. Com leaf aphid population feeding on a com leaf (upper) and a close-up of a wingless (lower left) and a winged (lower right) form aphid. ........................................................................................
Fig. 2. Hydroxamic acids (Hx) stmcture from Gramineae. ..................................................13
Fig. 3. Mixed infection o f P. sorghi and P. polysora on a maize leaf P. polysora can be distinguished by the size, shape and color o f uredinia, which are generally smaller, more circular and lighter in color than those o f P. sorghi as seen in this picture. ............................... 17
Fig. 4. The a and d increments o f the gene difference A-a. Deviations are measured from the mid-parent, m, midway between the two homozygotes AA and aa. Aa may lie on either side o f m and the sign of d will vary accordingly (Mather and Jinks, 1977).Notation for parameters a and d has been replaced withGambles’ one (1962).....................................................................................................22
Fig. 5. Hair-pin clip cage and an aspirator. A. Hair-pin clip cage with a ventilation lid on top. B. prototype cage (right) in comparison to one used in this study (left). C. aspirator made and usedfor this study. .................................................................................................................34
Fig. 6 . Yield loss by outbreak of com leaf aphid in seed com production nursery. Sample o f ten adjacent plants from two isogenic single cross female parents (above - HI 012 (male fertile, detasseled), below - H1012Crf (male sterile, undetasseled)). Five ears out o f ten plants were barren in H 1012Crf ..................................................................... 41
Fig. 7. Aphid population increase in hair-pin clip cage 12 days after inoculation. Rating score for Hi38-71 and Hi27 is 2 (11-20% coverage) with 61 aphids and 8 (71-80% coverage) with 270 aphids, respectively. A white substance in a red circle is a cast skin left over by an aphid. Area taken by cast skins are excluded from estimation of aphid coverage..............................................................................43
Xll

Fig. 8 . Frequency distribution of aphid coverage rating in six generations of Hi38-71 X Hi27 family from combined data. Note that there is no lO’s because cast skins were not included in the estimation of aphid coverage........................................................................................................... 47
Fig. 9. Frequency distributions of polysora rust rating in the six generationof the Hi38-71 x G24 fam ily ........................................................................................66
Xlll

CHAPTER ONE
LITERAURE REVIEW
1 . 1. CORN LEAF APHID, Rhopalosiphum maidis (Fitch)
Com leaf aphid is a tiny bluish-green, soft-bodied, piercing-sucking insect, that
belongs to the family o f Aphididae within the order of Homoptera. It was first named
Aphis maidis by Fitch (1986) and was later given the scientific name Rhopalosiphum
maidis Fitch. It is one o f the most abundant species among the twelve species found on
maize in the United States (Stoetzel and Miller, 2001).
1. 1. 1. Distribution
Com leaf aphid is considered to have originated in Asia (Blackman and Eastop,
1984). It occurs throughout the world and is an economically important cereal aphid
species in tropical climates (Blackman and Eastop, 1984). In North America, it migrates
annually from south to north (Forbes, 1905; McColloch, 1921; Cartier, 1957; Kieckhefer
et al., 1974). Foott (1977) also found no evidence in southwestern Ontario that com leaf
aphid can overwinter in that area. Dispersal of the aphid population is primarily by the
winged form (Berry, 1969). The aphid species is not a strong flyer but is light enough to
get into wind currents, being spread through the atmosphere as “aerial plankton”
(Johnson, 1969). Thus, geographic distribution and spread are mainly by the winged
aphid, while wingless form accounts for population increase within a host plant.

1.1. 2, Host range
Com leaf aphid has a wide host range in the Graminae, including more than 30
genera and most of the cereal crops, especially barley (Hordeum vulgare L.), maize, and
sorghum {Sorghum bicolor (L.) Moench) (Blackman and Eastop, 1984). Among four
crop plants tested including Andropogon sorghum, broad bean {Vicia faba), and com,
using 7-day old seedlings barley (Hordeum vulgare) was the most favorable host under
laboratory conditions (El-Ibrashy et ah, 1972).
1.1. 3. Biology
Biology o f com leaf aphid has been studied under uncontrolled, field and
controlled conditions (Davis, 1909; Wildermuth and Walter, 1932; Branson and Ortman,
1967). The aphid species undergoes 4 nymph stages to maturity. The average durations of
the instars reared on barley under field (Wildermuth and Walter, 1932) and controlled
conditions (Branson and Ortman, 1967) were; (1) first instar, 1.30 and 1.88 days; (2)
second instar, 1.36 and 1.29 days; (3) third instar, 1.16 and 1.00 days; and (4) fourth
instar, 1.41 and 1.29 days for totals 5.23 and 5.46 days, respectively. Lifespan averaged
23.83 days and the aphids gave birth to an average of 61.33 offspring. El-Ibrashy et al.
(1972) observed about 50 generation per year on barley under laboratory condition.
The biology of com leaf aphid is closely linked with environment. Temperature is
probably the most important environmental variable influencing rates o f aphid
development and reproduction (Elliott et al., 1988). For winged aphids, temperature can
be regarded as the effective releaser o f takeoff in the morning and light as the inhibitor in

the evening (Johnson and Taylor, 1957). However, light is also required to initiate and
maintain aphid flight, and to orient it (Kennedy and Booth, 1963).
1.1. 4. Aphid feeding activity
When aphids land on host plants, they initiate a series of short tests using stylets
called “probing” into epidermis. They distinguish host and non-host by this activity. Once
they find host plants, epidermal penetration by stylets follows. In most aphid species, the
penetration takes place intercellularly with exception of stomatal penetrations (Staniland,
1924; Sorin, 1966; Parry, 1971). Aphids secret saliva from the stylet during penetration
and form a tube around the stylets. This tube or stylet sheath remains in the plant even
after stylet is withdrawn. This stylet track provides evidence o f the feeding pathway.
Bing et al. (1991) observed under a light microscope stylet penetration and
feeding sites o f com leaf aphid on seedlings and late whorl stages of maize. Fifty-seven
percent o f com leaf aphid stylets entered plants in the late whorl stage through stomata,
whereas only 8% of the aphid penetrated seedling-stage plants through stomata. This
indicated that stomatal penetration by the aphid was preferred in whorl-stage maize but
not in seedling maize. They concluded that stomatal penetration by the aphid in seedling
maize might be random events because o f the tenderness o f seedling leaves. The majority
of the style penetrations (86%) occurred intercellularly between epidermal cells. In their
study, pectinase was found in the saliva of com leaf aphid. However, salivary pectinase
has not been found in this species before (McAllan and Adams, 1961; Ma et al., 1990).

1.1. 5. Reproduction
Com leaf aphid is an anholocyclic cereal aphid, which means its reproduction is
exclusively parthenogenetic (Brown and Blackman, 1988). During the parthenogenetic
reproduction, com leaf aphid produces morphologically different phenotypes, winged (or
alate) and wingless (or apterous) morphs (Fig. 1). Dixon (1988) defined it “polyphenism”,
that is, the production of two or more alternative phenotypes hy a single genotype. The
alate morph is able to fly short distances and colonize new host plants, and in general has
a longer developmental time and lower fecundity than apterous forms (Zera and Denno,
1997; Dixon, 1988). It was observed by Foott (1977) in a barley field that approximately
10% of the aphids were apterous females and 90% were nymphs. Only 6.7% of the
nymphs had wing pads. Although there have been reports on the discovery o f com leaf
aphid males in lab colonies (Wildermuth and Walter, 1932) and in the wild (Eastop,
1954), oviparous females have never been reported and all literature supports
reproduction as being asexual (Lambers, 1966).
1.1. 6. Biotype
Painter and Pathak (1962) described 4 biotypes on the basis of aphid reproduction
on different plants and plant reaction to aphid feeding, and named them KS-1, KS-2, KS-
3 and KS-4. Wilde and Feese (1973) found a population of com leaf aphid which differed
significantly from those 4 biotypes, based on ability to attack previously considered
resistant plants and ability to reproduce well at higher temperatures. This population was
designated KS-5. Recent development of molecular technique allowed Caballero et al.
(2001) to obtain a total o f 20 distinguishable polymorphic bands which revealed 23
4

" A :
. ‘4 >
| ; M , V
%•-
Fig. 1. Corn leaf aphid population feeding on a corn leaf (upper) and close-up of a wingless (lower left) and a winged (lower right) form aphid.

different clones from Johnson grass {Sorghum halepense) in Chile using RAPD-PCR
based on three primers. Steiner et al. (1985) employed isozyme or allozyme
electromorphism analysis with 21 electrophoretic loci in 15 natural populations and
revealed 8 loci useful for population comparisons. Karyotypes of different com leaf aphid
biotypes were found to be 2n = 8, 9 and 10. Differences in chromosome numbers
explained the discrepancies in host plant preference (Brown and Blackman, 1988).
1.1. 7. Corn leaf aphid in Hawaii
Com leaf aphid is known to have introduced to Hawaii by commercial trade, and
first reported on Oahu in 1906. Since then it spread to neighboring islands (Mau and
Kessing, http://www.extento.hawaii.edu/kbase/crop/type/rhopalos.htm). There has been
no males reported in Hawaii, thus population increase is entirely dependent upon
parthenogenesis by females. The primary hosts in Hawaii are com and sorghum.
Secondary hosts include bermudagrass {Cynodon spp.), asparagus {Asparagus officinalis),
sudangrass {Sorghum sudanense), ]ob'•& tears, Johnson grass, oats {Avena spp.), sugarcane
{Saccharum officinarum), wheat {Triticum spp.), oxalis {Oxalis spp.), and many species
of Panicum and other grasses.
Biological control of com leaf aphid has been successful witb several predators
and parasites. Predators and parasitoids of com leaf aphids in Hawaii are well
documented (Bergquist, 1975). Parasitic wasps include maidis Timberlake and
Lysiphlebus testaceipes Cresson. Predators in Waimanalo Research Station include
ladybird beetle larvae {Coelophora inaequalis Fab.), syrphid fly larvae {Allographa
obliqua Say), anthocorid predacious bug {Orius persequens White), long-homed
6

grasshopper (Conocephalus saltator Saussure), lace-wing larvae (Chrysopa spp.) and
aggravating grasshopper (Euconocephalus nasutus Thunberg). Fungus diseases are also
important in reducing the aphid species.
1. 2. APHID-PLANT RELATIONSHIP
1. 2.1. Damage on plant by aphid attack
Yield loss in maize by direct feeding of com leaf aphid is periodic and sporadic
but considerable when it occurs. Everly (1960) reported that when plants were lightly
infected with com leaf aphid, about 10% of yield was reduced. However, significant
reduction in yield by corn leaf aphid can be encountered when com plants suffer from
drought stress (Triplehorn, 1959). Foott and Timmins (1973) reported up to 91.8% yield
reduction in heavily infected, drought-stressed maize.
Direct feeding by colonies o f com leaf aphid may cause the followings ; (a) injury
to the central tassel spike resulting in failure to shed pollen; (b) gumming up of the lateral
branches of the tassel with honeydew which prevents pollen shedding; (c) failure o f tassel
to emerge completely; (d) development of molds and rots on the upper portion of the
plant which often extends down to the ears; (e) yellow and red discoloration of com
leaves especially under high level o f infestation; (f) accelerated maturity with partially
filled ears, an effect due to aphid feeding on kernels and silk; (g) a concomitant increase
in the infestation of com earworm (Helicoperva zea Boddie), which is attracted by the
honeydew produced by com leaf aphids (Everly, 1960). Bing et al. (1991) suggested a
possibility that leaf gas exchange in the late whorl stage o f maize plant could be disrupted
7

by direct feeding of com leaf aphid, assuming that stomatal penetration o f aphid stylet
physically damages the stomata.
1. 2. 2. Vector of plant viruses
Besides mechanical injury, com leaf aphid is able to transmit more than 15 plant
vimses including barley yellow dwarf, guinea grass mosaic, maize leaf fleck, millet red
leaf, abaca mosaic, maize dwarf mosaic, sugar cane mosaic, cucumber mosaic, onion
yellow dwarf and papaya ring spot vimses in persistent and non-persistent manners (Chan
et ah, 1991). In the case of vectoring plant vimses, the alate form is more responsible
than apterous form of aphids.
1. 2. 3. Development at different plant stages
It is generally believed that seedling maize is virtually immune to com leaf aphid
colonization. Dicke and Sehgal (1990) showed, however, that alate com leaf aphids were
attracted to, and might establish colonies, on seedling dent and sweet com plants in Iowa
and Jamaica. On barley, com leaf aphid reproduced significantly more on the earlier
growth stages than on the later stages (Kieckhefer and Gellner, 1988). In late growth
stages, the enclosed whorl area o f a com plant provides a very favorable environment for
aphid development. It is apparent that the moist, protected environment within the whorl
has a greater influence on aphid development than the nutrition supplied by the tassels
(Foott, 1977). When the tassels became exposed there was a movement of aphids down
the plant to occupy positions on the leaves, beneath leaf sheaths, and on the ear shoot.
The degree and rapidity of movement down and the percentages o f alate adults and
8

nymphs with wing pads were usually directly related to the size of the infestations (Foott,
1997). After the tasseling stage, populations of corn leaf aphid persist on maize until the
plants begin to dry. It is common to find that neighboring plants of the same variety
exhibit a great range in levels of aphid infestations when tassels become exposed near
pollination.
1. 3. HOST PLANT RESISTANCE TO INSECTS
1. 3.1. Host plant resistance
Host plant resistance is the most effective, economical and environmentally sound
management tactic to control insect pests in crop plants. Smith (1997) defined host-plant
resistance as the inherited qualities that result in a plant of one variety or species being
less damaged than a susceptible plant lacking these qualities, crop plants with insect
resistance have increased agricultural productivity in the United States for over 200 years.
Insect resistance in maize has been a subject of research from the early 1900’s, starting
with relation of com earworm damage to husk tightness and thickness (Hinds, 1914) and
com leaf aphid resistance in teosinte x yellow dent com hybrids (Gemert, 1917).
The use of insect-resistant cultivars has many economic and environmental
advantages (Smith, 1997). It can reduce or eliminate the costs and use o f insecticides,
increase farming efficiency, improve the quality o f the environment and the health of
agricultural producers and consumers. Moreover, when compared to research on
insecticide development, insect resistance research gives a substantially greater payoff for
each research dollar invested.

1. 3. 2. Categories of resistance
According to Painter (1968), plant resistance mechanism can be categorized into
three types; antibiosis, non-preference and tolerance. The term “categories” was proposed
by Smith (1997) to refer to antibiosis, antixenosis and other undefined types of plant-
insect interactions, observed as responses of insects to plant resistance mechanisms. In
antibiosis, feeding on the plant affects adversely the biology of the pest insect, leading to
death of the insect, abnormal life span, reduction in food reserves, unsuccessful
hibernation, smaller size, decreased fecundity or abnormal behavior.
Non-preference relates to host plant selection by the insect. With non-preference
resistance, insects treat resistant plants as poor hosts and then select an alternate host.
Non-preference is now referred to as antixenosis by many researchers (Kogan and
Ortman, 1978).
Painter (1968) defined tolerance as “a basis of resistance in which the plant shows
an ability to grow and reproduce itself or repair injury to a marked degree in spite of
supporting a population approximately equal to that damaging a susceptible host”.
Antibiosis and antixenosis are based on the reaction of an insect to a plant while tolerance
is related with the reaction of a plant to insect infestation and damage. From an ecological
and environmental standpoint, tolerance has several advantages over antibiosis and
antixenosis in pest management programs (Smith, 1997; Reese et ah, 1994). Unlike
antibiosis and antixenosis, tolerance does not adversely affect beneficial insects and
natural enemies or exert sufficient selection pressure to develop biotypes. Moreover, it
also tends to delay expensive chemical treatments or reduce the number of treatments.
However it is often difficult to separate tolerance from antibiosis and antixenosis (Reese
10

et al., 1994). Experiments must be precisely and accurately designed to delineate actual
contributions of resistance factors into each category o f resistance.
1. 3. 3. Mechanism of resistance
Smith (1997) proposed the term “mechanisms” to he used to describe the
underlying chemical or morphological plant processes that are responsible for the
negative reaction of insects to resistant plants. Both chemical and morphological defenses
mediate resistance to insect pests. Chemically induced resistance to aphids may result
from the presence of olfactory repellents, feeding or oviposition deterrents, or the absence
of feeding or oviposition stimulants.
Among secondary metabolites in plants, hydroxamic acids have heen reported to
play a role in resistance o f certain cereals including maize to several aphid species such
as com leaf aphid (Long et al., 1977; Beck, 1983), rose-grain aphid (Metopolophium
dirhodum) (Argandona et al., 1980), greenbug {Schizaphis graminum) (Corcuera et al.,
1985), grain aphid (Sitobion avenae) (Thackray et al., 1990), hird-cherry oat aphid
{Rhopalosiphum padi) (Thackray et al., 1990) and Russian wheat aphid {Diuraphis
noxid) (Mayoral et al., 1996). In maize, it has also been studied in relation to a chemical
resistance factor to European com horer, Ostrinia nubilalis (Wahlroos and Virtanen,
1959; Klun and Brindley, 1966; Klun et al., 1967; Klun and Robinson, 1969), stalk rot by
Diplodia maidis (BeMiller and Pappelis, 1965) and northern corn leaf hlight,
Exserohilum turcicum (Long et al., 1975). High concentrations of 2,4-dihydroxy-7-
methoxy-l,4-henzoxazin-3-one (DIMBOA) were correlated with observed resistance to
diseases and insects in those studies.
11

Hydroxamic acids begin to appear soon after germination in maize (Klim and
Robinson, 1969). Levels increase with age and reach a maximum a few days after
germination, followed by a subsequent decrease. The rate of decrease, however, is
dependent upon genotypes (Klun and Robinson, 1969). The main hydroxamic acid in
maize is 2-|3-D-glucopyranosyloxy-4-hydroxy-7-methoxy-l,4-benzoxazin-3-one
(DIMBOA-Glc), a glucoside form of DIMBOA (Tipton et al., 1967) (Fig. 2). When
plants are injured, DlMBOA-Glc is converted into corresponding aglycones by (1-
glucosidase (Wahlroos and Virtanen, 1959).
However, there have been conflicting reports on the role o f DIMBOA as primary
resistance factor to aphids (Bing et al., 1990; Cambier et al., 2001). Cambier et al. (2001)
studied DIMBOA derivatives such as DlMBOA-Glc and HDMBOA-Glc with
Metopolophium dirhodum. They believed that DIMBOA is not the main resistance factor
to the aphids, since DIMBOA was not detected in the phloem sap (Molyneux et al., 1990;
Caillaud and Niemeyer, 1996). Phloem is the main nutrition site o f aphids, and
DlMBOA-Glc and the p-glucosidase are stored in extravacuolar space and vacuolar
spaces, respectively (Massardo et al., 1994).
In some cases, nutritional condition of host plant may influence aphid resistance.
Nitrogen level in diets is considered one of the most important factors influencing the
performance of the aphid species on their host plants. Principal carbon and nitrogen
sources used by most aphids are sugars (especially sucrose) and amino acids, respectively
(Dadd, 1985). Despite the abundance of sugars in plant phloem sap, nitrogenous
compounds are rare in phloem sap (Douglas, 1993). Thus aphids show a strong response
12

OGIc
P-glucosidase
Glucosides
R=H DIBOA-GIc R=CH30 DIMBOA-GIc
Aglucones
R=H DIBOA R=CH30 DIMBOA
Fig, 2. Hydroxamic acids (Hx) structure from Gramineae.
13

to nitrogen level in their host plants (van Emden, 1996). Susceptibility to aphid feeding
generally has been shown to increase with the level of nitrogenous compounds in plant
tissue.
External or internal plant structural features may also alter aphid behavior or
reduce aphid digestion. Plant morphology may provide a favorable habitat for aphid
populations. Maize tassel type has been associated to aphid infestation by Coon (1945).
Caillaud and Niemeyer (1996) suggested a possible mechanical mechanism of resistance
in some lines o f Triticum monococcum to Sitobion avenae. In their study, hydroxamic
acids did not account for the resistance, but there was possible involvement of the phloem
sealing system in aphid resistant lines.
1. 3. 4. Corn leaf aphid resistance in maize
Resistance in maize to com leaf aphids was first reported in 1917 by Gemert
(1917) in the Fi hybrid between annual teosinte {Zea mexicana) and yellow dent maize.
Resistance to com leaf aphid has been reported to be caused by a combination of plant
morphology, soil and climatic conditions, and physiochemical factors (Coon et ah, 1948).
Haber and Gaessler (1942) studied the chemical constituents, especially sugar content of
tassels o f sweet com inbreds, but found no relationship between resistance and
susceptibility to aphids on one hand and sugar content or other constituents on the other.
Coon (1945) reported on the relation between the type o f tassel and the aphid infestation
of both inbreds and hybrids. He found that inbreds in which the tassel was exposed
quickly and completely from the leaves tended to have the lowest aphid populations. On
the basis of tassel type, he classified maize into five categories. The tassels that were
14

enclosed the longest time provide the most favorable habitat for the aphids (Painter,
1968). Although the correlations between tassel type and aphid population were
significant, exceptions were noted for all categories. Coon et al. (1948) found signifieant
correlation (r=0.5697) between the carotene content of com grain and degree of aphid
infestation in 44 hybrids.
Chang and Brewbaker (1976) reported that resistance to com leaf aphid is
conditioned by a single recessive gene. They also suggested a possible linkage of the
resistance gene to the R pl locus on chromosome 10 which controls resistance to maize
mst caused by Puccinia sorghi Schw. The aphid resistance locus was later named aphl.
Lu and Brewbaker (1999) also showed the recessive nature o f aphid resistance using a
generation mean analysis and recombinant inbred lines.
Long et al. (1977) reported that the cyclic hydroxamate, DIMBOA, was the
antibiotic factor for resistance to aphids. Maize lines with high concentrations of
DIMBOA in the leaves were found to suffer less damage from com leaf aphid than those
with low DIMBOA content. Bing et al. (1990), however, reported that DIMBOA was not
the primary factor conditioning resistance to com leaf aphid among inbred lines of maize.
Generation mean analysis using inbreds Mo 17 (resistant) and B96 (susceptible) by Bing
and Guthrie (1991) revealed significance of both additive and dominant genetic effects,
but showed greater importance of additive genetic effects in resistance o f Mo 17 to com
leaf aphid. Results of a diallel study involving 10 inbred lines by Bing et al. (1992)
showed that general combining ability (GCA) effects were more important than specific
combining ability (SCA). They found evidence for the involvement of multiple genes and
15

a greater influence of additive gene effects relative to non-additive gene effects in
resistance to the com leaf aphid.
1. 4. POLYSORA RUST IN MAIZE
Polysora mst or southern com mst o f maize caused by Puccinia polysora
Underwood is common throughout the southern United States (Bailey et ah, 1987) and
West Africa (Rhind et ah, 1952; Cammack, 1954; Robinson, 1996). Polysora mst was
devastating in Africa in the 1950’s, but it was considered to be a minor disease in the
United States (Rodriguez-Ardon et ah, 1980). Since the outbreak of epidemics in the
Mississippi Valley during 1972 ~ 1974, however, the potential of mst to cause severe
yield losses when it arrives early in the growing season has been recognized in the
southern United States (Zummo, 1988). The disease has also been reported as far north as
Wisconsin, but does not overwinter in temperate regions (Pavgi and Flangas, 1959).
Occurrence of the disease in northern United States is usually late in the season and does
not have significant impact on yield. Severity of the disease was attributed to high
susceptibility o f temperate U.S. com hybrids to polysora mst and the increase of double
cropping practices in southern areas (Futrell, 1975; Raid, 1988). Yield losses ranging
from 4% to 50% have been observed (Rhind et ah, 1952; Rodriguez-Ardon et ah, 1980).
Polysora mst can be distinguished from common rust caused by Puccinia sorghi
Schw. by its pustule size, shape and color (Fig. 3). But the most significant distinction is
that polysora mst is more devastating and can eventually kill the plants, while common
mst rarely does. Although there have been nine physiological races o f southern com mst
identified so far (Ryland and Storey, 1955; Robert, 1962; Ullstmp, 1965), no information
16

rj
:>w?* ...
P. sorghi P. polysora
Fig. 3. Mixed infection of P. sorghi and P. polysora on a maize leaf. P. polysora can be distinguished by the size, shape and color of uredinia, which are generally smaller, more circular and lighter in color than those of P. sorghi as seen in this picture.
17

is available about races o f polysora rust in Hawaii on relationships with previously
identified races o f the rust.
Monogenic resistant gene Rpp\ and Rpp2 were identified around 1950, but both
soon proved useless in Africa, and other monogenes followed the same fate. A single
dominant gene, Rpp9 has been identified by Ullstrup (1965) from a South American plant
introduction (PI 186208). The gene conferred resistance to Indiana isolates of polysora
rust race, PP.9. Later, Futrell et al. (1975) found another source o f single gene resistance
to the same race. Holland et al. (1998) suspected a relationship between those two single
resistance genes since both were obtained from South African germplasm. Genes for
race-specific resistance were not effective in controlling polysora rust in Africa
(Robinson, 1996). The resistance gene, Rpp9, was introduced to South Africa where it
broke down even before commercial release of hybrids with the gene. Robinson (1996)
strongly suggested the use of horizontal (general) resistance for reducing polysora rust
disease below economic level. General resistance in maize was then bred into many local
open-pollinated populations in Africa in the 1950s and proved effective in controlling the
disease.
General resistance to polysora rust is inherited quantitatively in maize. Bailey et
al. (1987) identified maize inbreds and single crosses as “slow-rusting” (a general form of
resistance) based on weekly assessments of pustule density to determine the area under
the disease progress curve (AUDPC). Among inbreds tested, Tx601 was highly resistant,
and the performance o f Tx601 was consistent in south central Texas and Nigeria. Tx601
also exhibits high tolerance to southern com mst in Hawaii. Zummo (1988) reported
different responses of maize genotypes to southern com rust fungus in its pustule
18

incidence, size, tumescence and sporulation. He used those characters to identify
components contributing partial resistance to southern com rast.
Moon (1995) evaluated a set of recombinant inbred lines (RlLs) in Hawaii and the
Philippines, which segregated approximately 50% tolerant and 50% susceptible. Ming
(1995) further identified restriction fragment length polymorphism (RFLP) markers
linked to quantitative trait loci (QTLs) in the same set of RlLs and found five QTLs on
chromosomes 2, 4, 6 , 9 and 10 with emphasis on the possible important role o f the QTL
on chromosome 6 .
Holland et al. (1998) studied the inheritance of resistance to polysora rust in F23
populations. Broad-sense heritabilities estimated from two populations were 30% and
50% respectively. RFLP markers were also utilized to localize and estimate the effects of
genes conferring resistance to polysora rust in the two populations. A single locus on the
short arm of chromosome 10 was identified to contribute 82-83% of the variation among
field resistance scores in the two populations. QTLs on chromosomes 3, 4, and 10 and
their epistatic interactions explained 96-99% of the variation in the two populations.
Those chromosomal regions were previously known to possess genes for resistance to
either polysora rust or common rust.
1.5. GENERATION MEAN ANALYSIS
Robinson (1996) is among authors who strongly advise the avoidance o f gene-for
gene resistance as opposed to horizontal resistance of disease and insect pests. Horizontal
resistance differs in degree, with every grade of variation between a minimum and a
maximum. Continuous variation is attributable in part to a heritable component, but also
19
to environmental components. These include external environments affecting both host
and parasite, and/or vagaries in the internal development o f the individuals. The heritable
component may consist of genes at many loci throughout the genome which function
together in a polygenic system. Individual gene effects may be small and similar to one
another. These properties of individual genes along with their supplementary effects on
the phenotype give rise to continuous variation. The individual gene effects cannot be
uncovered unless we employ special and appropriate quantitative genetic techniques,
such as generation mean analysis.
Generation mean analysis utilizes observed means and variances of various
generations. The generations should be derived from a cross between two parents that are
homozygous for differences in a trait of interest. Modes of gene action or effects which
can be revealed by the analysis are additivity, dominance and three types of non-allelic
interactions (“epistasis”). The theoretical foundation of generation mean analysis will be
summarized here from a classic textbook on biometrical genetics by Mather and Jinks
(1977), followed by techniques in the analytical procedure in the Materials and Methods
in section of chapter 2 and 3.
1. 5. 1. Components of mean
When two loci are involved (disomic inheritance), there will be three genotypes,
AA, Aa and aa in a segregating locus. There are two parameters required in order to
measure the differences in phenotypic expression of these three genotypes. The mid-point
between two homozygotes AA and aa is defined as m, mid-parent. A parameter a is
defined to measure the departure o f each homozygote AA and aa from the mid-parent
20
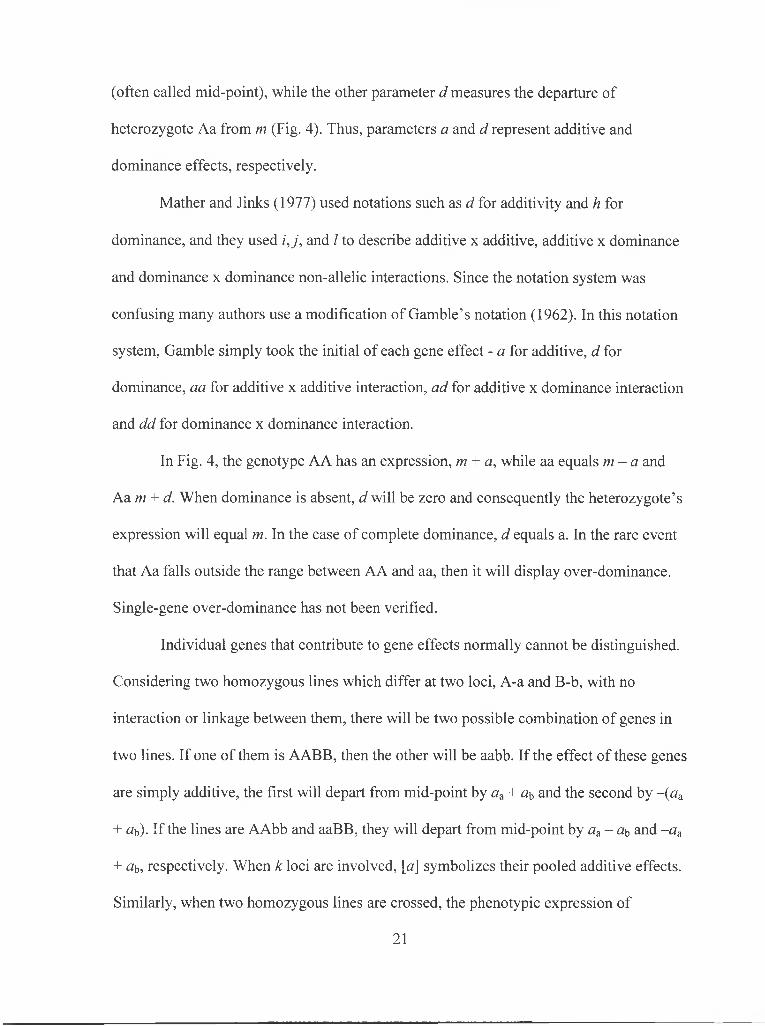
(often called mid-point), while the other parameter d measures the departure of
heterozygote Aa from m (Fig. 4). Thus, parameters a and d represent additive and
dominance effects, respectively.
Mather and Jinks (1977) used notations such as d for additivity and h for
dominance, and they used i,j, and 1 to describe additive x additive, additive x dominance
and dominance x dominance non-allelic interactions. Since the notation system was
confusing many authors use a modification o f Gamble’s notation (1962). In this notation
system. Gamble simply took the initial of each gene effect - a for additive, d for
dominance, aa for additive x additive interaction, ad for additive x dominance interaction
and dd for dominance x dominance interaction.
In Fig. 4, the genotype AA has an expression, m + a, while aa equals m - a and
A am + d. When dominance is absent, d will be zero and consequently the heterozygote’s
expression will equal m. In the case o f complete dominance, d equals a. In the rare event
that Aa falls outside the range between AA and aa, then it will display over-dominance.
Single-gene over-dominance has not been verified.
Individual genes that contribute to gene effects normally cannot be distinguished.
Considering two homozygous lines which differ at two loci, A-a and B-b, with no
interaction or linkage between them, there will be two possible combination of genes in
two lines. If one of them is AABB, then the other will be aabb. If the effect of these genes
are simply additive, the first will depart from mid-point by a^ + a^ and the second by -(oa
+ flb)- If the lines are AAbb and aaBB, they will depart from mid-point by «a - «b and -aa
+ a\), respectively. When k loci are involved, [u] symbolizes their pooled additive effects.
Similarly, when two homozygous lines are crossed, the phenotypic expression of
21

Fig. 4. The a and d increments of the gene difference A-a. Deviations are measured from the mid-parent, m, midway between the two homozygotes AA and aa. Aa may lie on either side of m and the sign of d will vary accordingly (Mather and Jinks, 1977). Notation for parameters a and d has been replaced with Gambles’ one (1962).
22
heterozyotes will have pooled dominance effects represented by [d\. In each case,
individual gene effects can be both positive and negative, and thus tend to balance out
each others’ effects.
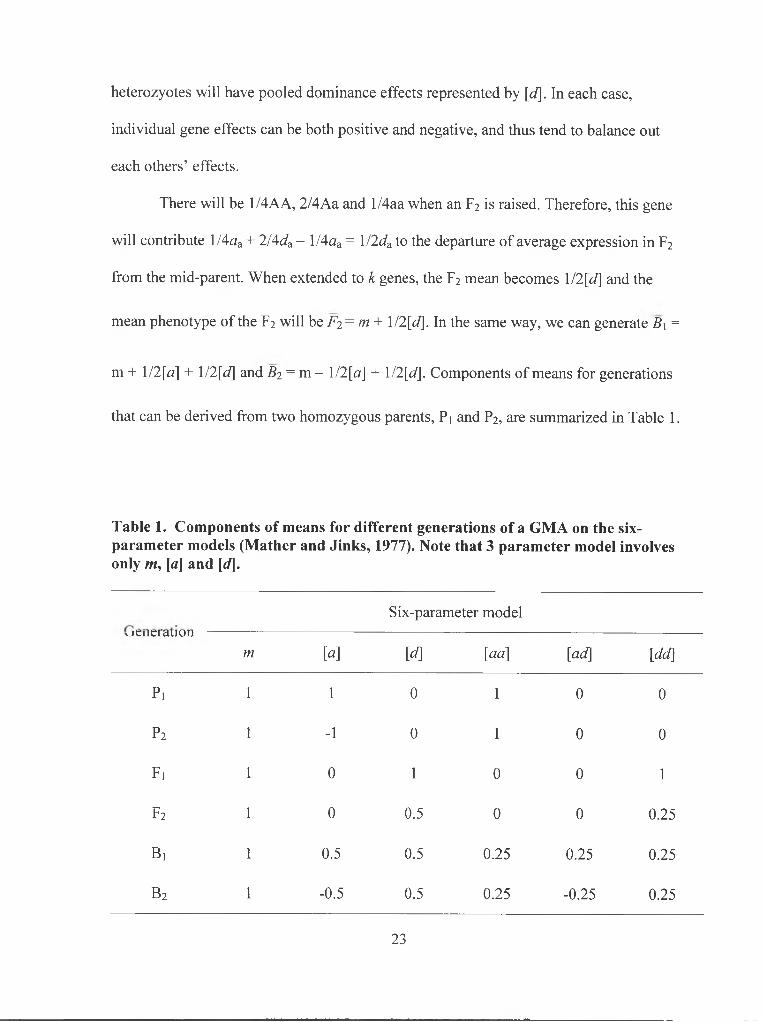
There will be 1/4AA, 2/4Aa and l/4aa when an F2 is raised. Therefore, this gene
will contribute l/4aa + 2/4c/a - l/4fla = l/2t/a to the departure o f average expression in F2
from the mid-parent. When extended to k genes, the F2 mean becomes 1/2 [J] and the
mean phenotype of the F2 will be F 2 = w -1- \l2{d\. In the same way, we can generate B\ =
m + 1/2 [a] + \H \d\ and B2 = v a - 1/2 [a] -1- \l2[d\. Components of means for generations
that can be derived from two homozygous parents. Pi and P2, are summarized in Table 1.
Table 1. Components of means for different generations of a GMA on the six- parameter models (Mather and Jinks, 1977). Note that 3 parameter model involves only m, \a\ and \d\.
Six-parameter model\JC11C1 dLlUIl
m [«] [d\ [aa] [ad] [dd\
Pi 1 1 0 1 0 0
P2 1 -1 0 1 0 0
Fi 1 0 1 0 0 1
F2 1 0 0.5 0 0 0.25
Bi 1 0.5 0.5 0.25 0.25 0.25
B2 1 -0.5 0.5 0.25 -0.25 0.25
23

1. 5. 2. Scaling test for additive-dominance model
Now the following relations oeeur among observed generation means;
B\ = \!2{F\ + P\), Bj = l/2(F\ + Pi), and Fj = l/4(2Fi + Px + Pj )• The relationships ean
be rearranged to produce the following seales A = 2B\ - F \ - P \ , B = 2Bi - F \ - P 2, and
C = 4F2 - 2.F\ - P \ - P2- The values of A, B and C must sum to zero within the limits of
their standard error. These expected relationships can be used to test deviations from this
model. The test of the deviations has been termed “scaling tests” by Mather (1949).
Significance of deviations from zero for any one of these scales is an indication of the
presenee of non-allelic interaction. Singh and Chaudhary (1977) noted that A and B tests
provide evidence on possible involvement of any of three interactions {aa, ad and dd),
while C and D tests indicate the presence of dd and aa type interaction, respectively. Sets
of such scaling tests ean be devised to cover any combination of generations.
1. 5. 3. Joint scaling test and perfect fit
Cavalli (1952) proposed a procedure known as “joint scaling tesf’ which
combines the whole set o f scaling tests into one, rather than testing the various expected
relationships one at a time. This can also be applied to six-parameter model, in which
three types of interactions are incorporated along with additive and dominance effects.
The joint scaling test not only estimates the model’s parameters, m, [a], and {d\ but
provides a test of goodness of fit of the model when number o f families exceed that of
parameters to be estimated. If the number of families available is same as number of
24

parameters estimated, no test can be made of the goodness o f fit of the model. In such a
case, “perfect fit” must be obtained.
1. 5. 4. Non-allelic interaction
There are two possible causes for departure from the additive-dominance model.
These are non-allelic interaction and linkage. Two gene pairs, A-a and B-b are used here
to explain the effects o f non-allelic interaction without linkage. The two gene pairs can
give rise to nine different genotypes with nine potential phenotypes (Table 2). The
differences among these phenotypes can be described by eight parameters, which
correspond to the 8 df among the nine types. Additive (aa and a^) and dominance (Ja and
d\)) parameters were previously defined. The remaining four parameters represent
epistatic interactions defined as aoab, ad o, adb^, and dd b-
Table 2. Phenotypes from nine genotypes comprising all combinations of A-a and B- b in the presence of non-allelic interaction without linkage (Mather and Jinks, 1977).
AA Aa aa
BB + cib+ aaab c/a + «b + ac/ba -a a + ab+ aa^b
Bb a^+db + adbb c/a+ c/b + ddab -a a + d b - adab
Bb a^-ab+aa^b c/a C?b ~ Clc/ba - « a - c?b+ «<3ab
25

If fla and are independent, will be the same whether or not the difference
AA-aa is measured in BB or bb background. Thus, AABB - aaBB will be equal to AAbb
- aabb, that is, AABB - aaBB - AAbb - aabb = 0. However, in the presence of
interaction, it is necessary to accommodate prospective interaction of and a ,. Thus,
phenotypes of AABB, AAhh, aaBB, and aabb involve either negative or positive
interaction parameter aaab- The remaining interactions such as adab, adba and dd^h
incorporated into the corresponding genotypes similarly can provide contributions to the
interaction phenotypes. In all cases, the coefficient of the interaction term is the product
o f the coefficients of the two main items hy which the interaction takes place.
The definition of mid-point, m, as mid-way between two homozygous parents
becomes no longer adequate when interactions occur. The average o f a cross between
AABB and aabb now has a mid-parent average of 1/2 [{m + Oa + ab + aoab) + { m - a^ - ab
+ aaab)] =m + auab- The alternative cross, AAbb x aaBB, gives a mid-parent o f m - aoab-
Therefore, there is a need to redefine the mid-parent as the mean of all the possible
combinations which can be obtained from the two gene pairs, AABB, AAbb, aaBB and
aabb.
The genotype AaBb in F i heterozygous can be a production of either of crosses
between AABB and aabb or between AAbb and aaBB. Genes of each parent carrying the
increasing allele of one gene and the decreasing allele of the other is said to be dispersed
whereas genes of each parent carrying the increasing alleles together and the decreasing
alleles in the other being associated. Association and dispersion of genes in Fi and F2
generations do not make difference in phenotypic expression. However, this relationship
may need to be taken into account for generations such as the parental and backcross
26

generations. For example, with the association of genes, the parental phenotypes will
have w + fla + Ob + auab and /n - aa - «b + ««ab, while with dispersion, the phenotypes will
be w + aa - ab - aaab and m -a a + a ^ - aaah- This kind of difference will occur in
backcross generations.
These theories are then generalized to cover the case of more than two gene loci.
With dispersion, the a ’s of different genes tend to balance one another out, leading to
define [a] as the sum of the a ’s taking sign into account where some genes are associated
in the parents while others are dispersed. This also can be applied to the definition o f [d\
being the sum of the t/’s o f the individual genes, although the sign of d does not depend
on gene association nor dispersion but on the direction of the dominance itself (Table 3).
Having taken into account the effect of association and dispersion as well as the direction
of interaction, the following generalized formulations are produced.
Pi = w + [a] + [aa]
P2 = m - [ a \ + [aa]
F\ — m + \ d\ + \dd\
F2 = m + \l2 [d \ + \IA[dd\
Bx = m+ l/2[a] + \l2{d\ + l/4[aa] + \IA[ad\ + HA[dd\
8 2 = m - l/2[a] + \/2[d] + l/4[aa] - l/4[ad] + \/4[dd]
Thus, genetic parameters can be estimated as follows;
m = I/2P, + I/2P 2 + 4P2 - 2P 1 - 2P 2
[a] = I/2P 1 - I/2P 2
[d] = 6P 1 + 6 B2 - 8P2 - Pi - 3/2P 1 - 3/2P2
[aa] = 2B \ + 2 B2 — 4 F2
[ad] = 2B\ + /*i — 2 B2 + P2
[dd\ = Pi + P2 + 2P 1 + 4P2 - 4P 1 - 4P2
27

Table 3. Interactions in the means of families of a digenic cross (Mather and Jinks, 1977).
m aa d. 4 aO ab adah adba ddab
Associated AABB X aabb
Pi 1 1 1 1
Pi 1 -1 -1 1
Fi 1 1 1 1
P2 1 1/2 1/2 1/4
Bi 1 1/2 1/2 1/2 1/2 1/4 1/4 1/4 1/4
B2 1 -1/2 -1/2 1/2 1/2 1/4 -1/4 -1/4 1/4
Dispersed AAbb X aaBB
Pi 1 1 -1 -1
Pi 1 -1 1 -1
Bx 1 1/2 -1/2 1/2 1/2 -1/4 1/4 -1/4 1/4
B2 1 -1/2 1/2 1/2 1/2 -1/4 -1/4 1/4 1/4
28

CHAPTER TWO
YIELD LOSS AND RESISTANCE TO CORN LEAF APHID
ABSTRACT
Com leaf aphid causes occasional yield loss of maize in Hawaii. Severe aphid
damage was experienced in a seed com production nursery in late 2000. Yield loss hy
direct feeding ranged from 38.9% to 98.8% with average o f 71.7%. To exploit sources of
resistance, we developed an inoculation technique using a hair-pin clip cage and
summarize our studies on genetics of resistance to com leaf aphid through generation
mean analysis. A total o f 360 plants from two parents (Hi38-71; resistant and Hi27;
susceptible), Fi, F2 and backcrosses were artificially inoculated with three wingless
aphids per cage. Aphid population increase was classified on a ten-point scale based on
aphid density. Average ratings of resistant and susceptible parents were 2.89 and 7.25
respectively. The average Fi rating (6.72) showed susceptibility to the aphid. Resistance
began to show up in F2 and backcross to Hi38-71, while backcross to Hi27 remained
susceptible. Resistance to com leaf aphid from Hi38-71 appeared to be monogenic and
recessive. The clip-cage method seemed effective in separating resistant and susceptible
plants in segregating populations. For future understanding of the underlying cause of
resistance, various aspects of aphid growth and reproduction on different genotypes were
also examined. Newly bom aphids were fed on four different genotypes including two
parents used in the genetic study. Aphids on Hi38-71 had poorest performance over all.
Difference in days to 50% mortality might be the major cause of resistance in Hi38-71
against com leaf aphid.
29

Com leaf aphid is a cosmopolitan insect pest in the Graminae including barley,
sorghum and maize. It occurs throughout the year in tropical climates and is considered
an economically important cereal aphid (Blackman and Eastop, 1984). Aphid occurrence
in temperate regions is dependent upon migration rather than overwintering o f the aphid
(Kieckhefer et al., 1974; Foott, 1977). Unlike in the tropics, the aphid species is
considered a minor insect pest in maize in temperate regions. It appears to be linked to
periodic and sporadic nature of aphid incidence.
Reduetion in yield, however, is considerable, especially when population increase
is accompanied by drought condition. Foott and Timmins (1973) reported up to 91.8%
yield loss in heavily infected, drought-stressed maize. Resistance to com leaf aphid is
indeed present in maize in the form of single and multiple gene(s). Resistanee in maize to
eom leaf aphids was first reported in 1917 by Gernert (1917) in the Fi hybrid between
annual teosinte {Euchlaena mexicana) and yellow dent maize. Bing and Guthrie (1991)
and Bing et al. (1992) found evidence for the involvement of multiple genes and a greater
influenee of additive gene effects relative to non-additive gene effeets in resistance to the
com leaf aphid. Chang and Brewbaker (1976) and Lu and Brewbaker (1999), however,
showed that resistance to com leaf aphid was conditioned by a single recessive gene.
Causes of resistance to com leaf aphid have been reported to be a combination of plant
morphology, soil and climatic conditions, and physiochemical factors (Coon et al., 1948).
Despite the fact that resistance to the aphid species exists in maize, pesticide use has been
a major practice for field control. This is in part due to lack of appropriate screening
methods for identifying resistance genotypes.
2.1. INTRODUCTION
30

The purposes of this study were to develop artificial inoculation techniques and
quantification methods for screening aphid resistance in tropical maize and to apply them
in field trials. Attempts were also made to study genetics of resistance in a sweet com
inbred, Hi38-71 through generation mean analysis and to investigate effect of the
resistance on aphid performance. In addition, yield loss observed in a seed com
production nursery is reported.
2. 2. MATERIALS AND METHODS
2. 2.1. Observation of yield loss
There was a severe aphid attack late in 2000 on a field com seed production
nursery at Waimanalo Research Station that provided an excellent chance to estimate
yield loss by com leaf aphid. The nursery was planted on 9th Sept. 2000 with two single
cross female hybrids (HI012 and H1012Crf) and one male inbred (Hi26). The two female
hybrids were isogenic lines produced by crosses between Hi34Crf and Hi34 as female
parents and 1CAL210 as a male parent. Hi34Crf is genetically identical to Hi34 except
that Hi34Crf has C-cytoplasm which makes plants male sterile. Since the male parent in
H I 012 and HI012Crf lacks the fertility restorer gene for C-cytoplasm, H1012Crf
becomes male-sterile while H1012 produces normal pollens. H1012Crf had been planted
in an attempt to get rid of hand detasseling in seed production nursery.
Hybrids H I 012 and H il012Crf were planted in 21 and 24 rows, respectively and
the male parent Hi26 was planted every 4th row starting from the first row. Thus there
were three rows of female hybrid (a block) in between male rows. Com leaf aphid began
31

to colonize on male parents at late whorl stage. At tasseling, detasseling only took place
on males of Hil012. However, the last block of H1012Crf was detasseled by accident. At
harvest, blocks were divided into three parts and a sample was taken from the center of
each part and from second rows of each block. A sample consisted of ears from 10
adjacent plants. Sample ears were dried to 15% moisture content.
2. 2. 2. Generation mean analysis
A tropical super sweet com inbred, Hi3 8-71, with high resistance to com leaf
aphid was crossed to a field com inbred, Hi27, to produce Fi, F2 and two backcross
populations (BCr and BCs). Hi38-71 is one of sub-lines of a brittle-\- based commercial
super sweet parental inbred, Hi38. Hi27 is a flint com inbred and a parent of Near
Isogenic Lines for more than 130 single maize mutants. Both inbreds have gone through
numerous generations for years and were assumed to be highly homozygous.
Field evaluation for six generations (Pr, Ps, Fi, F2, BCr and BCs) was carried out
in spring and fall of 2002 at Waimanalo Agricultural Research Station o f University of
Hawaii. The experiments were designed as randomized complete blocks with three
replications. Plots consisted of two 5-m rows for non-segregating populations (Pr, Ps and
Fi) and four and six rows for the two backcrosses and F2 populations, respectively. The
two parents were paired during randomization and planted in adjacent plots to minimize
competition from hybrid generations. Row and hill spacings were 0.75 and 0.2 m,
respectively. Two untreated seeds were planted per hill and resulting plants were thinned
to one per hill at around 3 weeks after plantings.
32

In order to generate uniform infestations under field conditions and obtain better
quantification of resistance, a clip-cage method has been employed. Prototypes of cages
were obtained from a previous study (Chang, 1976) and other entomologists (Fig. 5).
Chang’s leaf cage had two nails embedded in opposing positions on one side of
plexiglass tubing to pin down on a plywood floor support through a plant leaf. The tubing
was covered with a removable lid. However, it is possible that this method o f pinning
down plant leaves induces biochemical changes affecting aphids. DIMBOA can occur as
a result of wounds and may be responsible for increased com leaf aphid resistance. Hence
nails were replaced with a hair-pin clip which was used in a prototype from
entomologists. However, the prototype from entomologists had closed top on the tubing
so access to interior was impossible. The hair-pin clip cage used in this study was made
to take advantage of two prototypes.
The cage (Fig. 5) consisted of three parts; (1) a bottom plate ( 3 x 3 cm), (2) a
confining tube (2.2 cm i.d x 1.2 cm height) made from a transparent plexiglass and (3) a
removable ventilation lid. The bottom plate was to support the tube. Plant leaves were
placed between the tube and the plate. Foam sponge was attached to one side of the
tubing which directly contacts leaf surface, in order to avoid wounding plants and to seal
up the tube completely to leaf surface. The sponge also sucks away honeydews produced
by aphids confined inside the tube. The lid top was covered with fine mesh cloth for
ventilation and was easy to take off from the tube with a knife. The removable lid gave
easy access to the cage interior and facilitated data collection when many cages were
used.
2. 2. 3. Hair-pin clip cage
33

B
Fig. 5. Hair-pin clip cage and an aspirator. A. Hair-pin clip cage with a ventilation lid on top. B. prototype cage (right) in comparison to one used in this study (left). C. aspirator made and used for this study.
34

Natural population of corn leaf aphids was collected in maize breeding nurseries
at the time of inoculation. Three wingless viviparous adults were carefully collected on
maize tassels by an aspirator and were blown out into the cage. The aspirator (Fig. 5c)
was made simply by plugging in mesh-cloth-covered one end of a 20cm flexible vacuum
tubing (Tygon, R-3603 , 1/8” i.d. and 1/4” o.d.,) into a 1-ml micropipeting tip. The
micropipeting tip was cut about 1mm from the tip to make the entrance hole big enough
to accommodate an adult aphid.
Inoculation was made on three plants per row, giving total of 180 samples in each
trial; 18 samples for Pr, Ps and Fi, 54 samples for Fi and 36 samples for two backcross
generations. The cage was clipped on to abaxial side of a fully expanded uppermost leaf
o f about 50 days old plant. The lower surface of com leaves has more stomata
(Kiesselbach, 1980) through which com leaf aphid is found to be more frequently
penetrating stylets during the late whorl stage (Bing et al., 1991). Leaves with cages were
cut and brought into the laboratory 12 to 14 days after inoculation.
2. 2. 5. Quantification of resistance
Cages were removed from the leaf and close-up digital photographs of confined
area covered with aphids were obtained by a Sony DSC-F505V digital camera (Sony Co.,
Japan) at high resolution of 2,240 x 1,680 pixels. The camera has a built-in macro mode
which enables one to take a close-up digital picture of an object as close as 2mm from its
lens. The images were transferred to a personal computer and were rated visually from 1
to 10 on the computer monitor based on the aphid density or coverage of the confined
2. 2. 4. Inoculation
35

area. Rating score 1 was considered to have aphids covered with 0 ~ 10% of the area.
Similarly, aphid coverage at 91 ~ 100% was given a rating score 10. There were no
samples rated 10, however, since cast skins were left as aphids morph, covering up
approximately 10% of the area at maximum. Cast skins were not included in aphid
coverage rating.
2. 2. 6. Statistical methods
Analysis o f variance over seasons was conducted for the genetic study o f com
leaf aphid prior to generation mean analysis. If the source o f variation for seasons was
significant, generation mean analyses were carried out for each season as well as across
seasons. Data from all samples in all replications were pooled for the computation of
generation means, while variances for each generation were calculated by averaging
variance of each replication in same generation. Variance of mean for a generation was
obtained by its variance divided by number o f plants in the generation. Standard error of
a generation was a square root of variance of mean for the generation.
The initial analyses were under the assumption that observed variation was due to
additive and dominance effects with no epistasis or linkage (additive-dominance model,
or often called 3 parameter model). The assumption was tested by simple scaling test and
was confirmed by a joint scaling test with the 3-parameter model. Joint scaling test could
not only be used to test the adequacy of 3- and 6-parameter model, but provided estimates
of genetic parameters and expected means for each generation.
Each scale and its variance were computed by the following provide by Mather
and Jinks (1977);
36

A = 2 5 i - F i - P i
B = 2 5 2 - F i - P 2
C = 4 F 2 - 2 F i - . P i -E2
V(A) = 4V(5i) + V(Pi) + V(Fi)
V(B) = 4V(52) + V(?2) + V(Fi)
V(C) = 16V(F2) + 4V(F,) + V(Pi) + V(P2)
The variance was calculated from variance of means and standard error was the square
root of the variance. Significant difference of individual scale was accessed by a
Student’s t-test at the degree of freedom which was a sum of degree of freedom for the
generations involved in each scale. Degrees of freedom for each generation was the
number o f plants in a generation minus numbers o f replication (Singh and Chaudhary,
1985). If the scales are adequate, the values of A, B and C should be zero within the
limits of their respective standard errors. On the other hand, significance of any one of
these scales indicates the presence of non-allelic interaction.
The joint scaling test utilizes a weighted least square (multiple linear regression)
with weights that are the reciprocals of the variance of mean o f the generation means. It
was indicated that the reason for weighting is that all o f the genetic information is not
estimated with the same precision (Mather and Jinks, 1977). Computational procedure
was modified from Rowe and Alexander (1980);
N matrix S matrixN(Pi) V(P.)
N(P2) V(Pi)n(F,) V(Fi)
n(F2) V(F2)n(Bi) V(B.)
n(B2) V(B2)
37

Y matrij^
Px
Pi
Fi
Fi
Bx
C matrix1
1
1 0
-1 0
0 1
0 0.5
0.5 0.5
0.5 0.5
M matri)^ m
[^][d\
Matrices were defined as follows; the matrix N consisted of the number of plants
as diagonal elements, while S matrix contained, as its diagonal elements, variance of
generation, not variance of mean. For example with first parent, V(Pi) was the variance
of Pi while V(P\) was the variance of mean of Pi obtained by V(Pi) / n(Pi). Matrix Y was
a column vector o f the generation means. The C matrix depended upon the genetic model
and here consisted of the genetic expectations of the six generations in terms of the three
parameters, m, [a] and [d\. Beginning with three-parameter model, C matrix has been
replaced with six parameters and then later with five parameters based on perfect fit
result. Finally, M was the vector of the genetic parameters to be estimated by least
squares.
Parameter estimates (E) for the model applied to a joint scaling test were obtained
by the following equation ; E = (C’x N x S‘' x C)"' x (C’x N x S'* x Y), where ’ indicates
the transpose and '* the inverse. Computation of matrices was done in Quattro Pro 10, a
spreadsheet computer program (COREL Co. Ltd., 2001). Built-in spreadsheet functions
used were “@MINVERSE” for inverting a matrix, “@TRANSPOSE” for transposing a
matrix and “@MMULT” for the product of two matrices. Variance of parameter
38

estimates (V(E)) was simply the diagonal elements of (C’x N x S'* x C)'* and standard
errors were the square root of variance of parameter estimates. Student’s /-test at (k-p)
degree o f freedom was used to test significance o f parameter estimates.
Expected generation means (Y) were derived by multiplying C matrix with the
estimated genetic parameters (E). Further, value of a goodness o f fit was obtained for
the assessment of a genetic model by the following equation;
X (k-p) = (Y - Y)'* X (N X S '') X (Y - Y), where k is the number of generation means and p
is the number of parameters estimated. Hence, the computed value was compared at
(k-p) degrees o f freedom to tabular value.
2. 2. 7. Survival and reproduction of corn leaf aphid.
Ten plants from four genotypes, Hi38-71, G24, 190 and Hi27 were sampled in a
breeding nursery during winter of 2002 for this study. One cage per plant was attached to
a lower leaf surface in the manner described above. Three apterous aphids collected in
field were transferred into the cages in the morning and were removed in late afternoon,
leaving newly bom 1st instars in the cages. All the apterous aphids reproduced a few
offspring in each cages. First nymphs bom on the day o f inoculation (0th day) were
eonsidered at the same age. Instars were allowed to feed for 3 days to insure adaptation in
the confined area. Three days after adult removal, all except one offspring were also
removed, thus only one aphid was left, feeding in the confined area. This aphid was
marked first generation and was observed everyday.
When the first generation began to reproduce, newly bom nymphs per cage were
counted and removed until there were no longer nymphs produced. First generations were
39

observed until death. Data obtained were (1) total number of progenies produced by ten
aphids, (2) days to first winged form aphid emergence, (3) number of winged form
emerged, (4) total number o f progeny produced by wingless form, (5) days to first
progeny emergence, (6) days to 50% mortality, (7) average life cycle (days) and average
reproduction period (days).
2 .3 . RESULTS
2. 3 .1 . Yield loss trial
There was great difference in yield between H I012 and undetasseled H1012Crf
female parent (Fig. 6). Both detasseled H1012 and H1012Crf female parents supported
fewer aphids than undetasseled H1012Crf. There was exponential growth of aphid
population on tassels of H1012Crf. Numerous aphids were observed over entire plants.
Predators came in late after mid-silking and began to feed on com leaf aphid, but initial
number of predators was not sufficient to reduce the aphid population below
economically damaging levels in a short period of time. Aphid feeding and honeydew
production up to mid-silking, in the absence of predators resulted in many barren and
poorly filled ears in undetasseled HI012Crf block.
Average sample weights of detasseled HI 012 and undetasseled H1012Crf were
1402.7g and 457.8g, respectively. Range of sample weights from undetasseled H1012Crf
was 19~987g. Despite great yield reduction observed in undetasseled H I012Crf block,
one block of H1012Crf that was mistakenly detasseled produced the highest yield
40

Fig. 6. Yield loss by outbreak of corn leaf aphid in seed corn production nursery. Sample of ten adjacent plants from two isogenic single cross female parents (above H1012 (male fertile, detasseled), below - H1012Crf (male sterile, undetasseled)). Five ears out of ten plants were barren in H lO llCrf.
41

(1616.7g). When this was compared to individual samples from undetasseled H1012Crf,
yield loss due to aphid feeding ranged from 38.9% to 98.8% with average of 71.7%.
2. 3. 2. Resistance in Hi38-71
Performance of com leaf aphids in the hair-pin clip cages was good enough to
establish initial populations in the confined cage area. The viviparous adult aphids
transferred into the clip cage started reproduction and offspring were observed around
their parents the day after inoculation. After 1 2 -1 4 days, some of early nymphs became
adults and produced offspring. Most of them became the winged form while a few
morphed to wingless adults. Thus, two generations were coexisting in the form of
nymphs, winged and wingless adults in one cage. In most cases, initial adults had died
when cages were removed.
Fig. 7 shows a close-up view of confined area after the cages were removed.
There was a great difference in population increase on resistant (Hi38-71) and susceptible
(Hi27) plants. Rating scores for sample pictures in Fig. 7 were 2 for Hi38-71 and 8 for
Hi27, with aphid counts of 61 and 270, respectively. Cast skins took up some spaces in
the confined area, but were not considered in the coverage ratings.
Analysis of variance for mean aphid coverage ratings from two seasons revealed
significant differences between two seasons and among six generations (Table 4).
Significant differences among generations were expected, while the seasonal difference
was a somewhat unexpected event. However, the interaction between generations and
seasons was not significant. This indicates that overall performance of aphids was
42

1 inch
/ -
• V*
V
ri^fsessaanJ”^ - ■ ■ y
.-.M- V
Hi38-71 (Resistance) Hi27 (Susceptible)
Fig. 7. Aphid population increase in hair-pin clip cage 12 days after inoculation. Rating score for Hi38-71 and Hi27 is 2 (11-20% coverage) with 61 aphids and 8 (71-80% coverage) with 270 aphids, respectively. A white substance in a red circle is a cast skin left over by an aphid. Area taken by cast skins are excluded from estimation of aphid coverage.
43

different in the two seasons, but remained consistent among generations within each
season. The consistency was also reflected by correlation between mean rating scores of
the generations in two seasons (r = 0.96). Despite use of highly homozygous parents,
some variations in aphid performance within lines were observed.
Table 5 summarizes average rating scores and standard errors of aphid coverage
for six generations in two seasons. Overall performance of com leaf aphid in fall was
better than that in spring. That is, means in fall for all generations were higher than those
in spring. Average CVs’ were as follows for the two seasons; Pr 35.9%, Ps 16.5%, F|
17.1%, F2 36.0%, BCr 36.9% and BCs 16.5%.
For the spring trial, mean rating scores for resistant (Hi38-71) and susceptible
(Hi27) parents were 1.83 and 6.56 with mid-point of 4.19, respectively. F| hybrids
supported slightly fewer aphids (6.06) than the susceptible parents, but this difference
was not statistically significant. Resistance segregated in F2 population (4.91).
Backcrosses to the susceptible parent gave mean aphid rating o f 7.00, high susceptibility,
even exceeding that of susceptible parents. Mean o f backcross to the resistant parent
(4.53) was not significantly different from mid-parent value (4.19), with large variances.
Data taken in the fall showed higher mean aphid coverage ratings. The mean
rating scores for resistant and susceptible parents were 3.94 and 7.94, respectively, with
mid-point of 5.94. Fi hybrid (7.39) also was susceptible, but less than the susceptible
parent. Resistance segregated in F2 population (6.83 ± 0.23). Two backcross generations
also showed higher means than in summer (7.25 and 6.06 for backcross to susceptible
and resistant parent, respectively). When two seasons were combined, mean aphid
coverage ratings were 2.89 and 7.25 for resistant and susceptible parents, respectively,
44

Table 4. Analysis of variance for mean aphid coverage ratings for six generations of Hi38-71 (resistant) x Hi27 (susceptible).
Sources df Sum of squares
Meansquares F
Total 35 126.74
Seasons 1 18.22 18.22 13.57*
Reps in seasons 4 5.37 1.34
Generations 5 80.56 16.11 16.60**
Generation x Seasons 5 3.18 0.64 0 .6 6 "
Error 20 19.41 0.97
*, ** significant at 5®/o and 1% level o f probability, respectively, not significant.
Table 5. The corn leaf aphid coverage ratings for two parents, Hi38-71(Pr) andHi27(Ps), Fi, F2 and backcross (BCr & BCs) generations.
GenerationsCom leaf aphid coverage rating (1--10)
Spring Fall Combined
Ps 6.5610.342 7.94 1 0.206 7.25 1 0.200
Pr 1.83 10.224 3.9410.264 2.8910.173
Mid-parent 4.19 5.94 5.07
F, 6.0610.331 7.3910.194 6.7210.192
F2 4.91 10.332 6.83 10.234 5.87 1 0.203
BCs 7.0010.185 7.25 1 0.206 7.1310.139
BCr 4.53 10.305 6.06 1 0.345 5.2910.230
area covered with aphids.
45

with mid-parent value of 5.07. Their Fi hybrid mean of 6.72 was less than that of the
susceptible parent. Mean rating for F2 (5.87) and backcross to resistant parent (5.29) was
lower than backcross to susceptible parent (7.13). There was no plant rated 10 because
cast skins were not included in the estimation of aphid coverage.
Frequency distributions of combined aphid coverage ratings in the six generations
clearly showed the genetic differences and segregation pattern of resistance in F2 and
backcrosses to resistance (Fig. 8). Parental distributions showed great differential
response to aphid colonization. The F1 hybrids had same response as the susceptible
parent, indicating a recessive nature of resistance. However, these non-segregating
populations showed a wide range in the data values. Segregating populations were
distributed very widely, as expected. There were more susceptible than resistant
individuals in F2 population, while backcross to resistant parent had about equal numbers
of susceptible and resistant individuals. There was no clear distinction between resistance
and susceptibility among populations observed, with intermediates that made it difficult
to define a classic 3:1 segregation. Nevertheless, the backcross to resistant parent
appeared to provide strong evidence of 1:1 segregation. There were fewer intermediates
in the backcross to resistant parent than in the F2. Although the backcross to the
susceptible parent had the same range (4 ~ 9) of rating scores as the susceptible parent,
most data fell between 6 and 9, with mean of 7.13. The frequency distributions of
segregating populations suggest that the resistance in Hi38-71 may be controlled by a
single recessive locus.
46

Hi38-71 (Resistance) Hi27 (Susceptible)
42cJSa.H-o6
2 3 4 5 6 7 8 9 10
Aphid coverage rating
1 2 3 4 5 6 7 8 9 10
Aphid coverage rating
Fi30
42 25c45 20 -Q.o 15 -
dz 10 - - - - - - -
5
0 n r-iT I m1 2 3 4 5 6 7 8 9 10
42 c4SQ.O 6
Aphid coverage rating Aphid coverage rating
BC to Hi38-71 BC to Hi27
1 2 3 4 5 6 7 8 9 10
Aphid coverage rating
1 2 3 4 5 6 7 8 9 10
Aphid coverage rating
Fig. 8. Frequency distribution of aphid coverage rating in six generations of Hi38-71 X Hi27 family from combined data.
47

Generation mean analysis
Since analysis o f variance showed significant seasonal effects, generation mean
analyses (GMA) were conducted on each season and then two seasons were combined for
the analysis. Individual scaling tests for each season and across seasons were performed
as an initial investigation to uncover possible involvement o f non-allelic interactions
among or between genes contributing to resistance (Table 6). One of scaling tests in
spring trial indicated a significant deviation from zero while no significant differences
were found in the fall trial or from the combined data. It is concluded that a simple
additive-dominance model explains the data, without consideration of epistatic variances.
Generation mean analyses with additive-dominance model on each season and
across seasons were carried out by a joint scaling test using a weighted least square
technique. Joint scaling test has advantages over individual scaling test that this test can
not only confirm the individual scaling test result, but also provide estimates o f genetic
parameters (m, a & d) and expected means for each generations, which can then be used
for goodness o f fit for the model applied.
Table 6. Individual scaling tests on aphid coverage ratings from Hi38-71 x Hi27
Test Spring Fall Combined
A = 2 B C r - P r - F , 1.17 ±0.729 * 0.78 ± 0.764 0.97 ± 0.528
B = 2 B C s - P s - F i 1.39 ±0.603 -0.83 ±0.501 0.28 ± 0.392
C = 4F2 - 2F , - P r - P s -0.87 ± 1.540 0.67 ± 1.066 -0.10 ±0.937
significant deviation from zero, according to a M est at the 5% level o f probability. not significant.
48

Generation means predicted from the 3-parameter additive-dominance model fit
to the observed means from the fall trial and combined data. Goodness o f fit of test for
the spring trial, however, turned out to be significant (Table 7 & 8). This is in agreement
with individual scaling tests. For spring trial, individual scaling tests and generation mean
analysis implied that there might be non-allelic interaction involved and a need of
incorporating additional set of parameters. However, in combination with fall trial, the
significant deviation of expected means from observed means became insignificant.
2. 3. 3. Survival and reproduction of aphids
Com leaf aphids were evaluated on four different maize genotypes of varying
aphid tolerance. Tahle 9 shows general trends of aphid performance during a complete
cycle. In general, observations presented in Table 9 were in agreement with level of
resistance/ susceptibility observed over years under natural conditions. Aphids on Hi38-
71 had the poorest performance over all.
Total number of progenies produced by 10 aphids ranged from 65 for Hi38-71 to
213 for inhred 190. Aphids fed on Hi27 have produced slightly more offspring than
Hi38-71, hut far less than G24 and 190. There seemed to be no difference in juvenile
period among genotypes. Instars took about 7 days to become adults. All aphids morphed
into winged forms except two on 190. Those two wingless form adults produced 100
progenies that constituted half the population on 190.
Aphids started to give birth 7 to 9 days after heing bom. Aphids on the most
susceptible inbred 190 took the shortest time (7 days) to have the first progeny emerge.
49

Table 7. Joint scaling test of the additive-dominance (3 parameter) model on Hi38-
Generation Season No. of
PlantVariance of mean Weighf
Model
m [a] [d]Mean
Observed ExpectedDifference
0 - E
Ps Spring 18 0.117 8.526 1 1 0 6.56 6.93 -0.370
Fall 18 0.043 23.478 7.94 7.81 0.132
Pr Spring 18 0.050 20.000 1 -1 0 1.83 1.87 -0.035
Fall 18 0.070 14.336 3.94 4.10 -0.153
Fi Spring 18 0.109 9.153 1 0 1 6.06 6.48 -0.422
Fall 18 0.038 26.557 7.39 7.35 0.034
F2 Spring 54 0.110 9.051 1 0 0.5 4.91 5.44 -0.530
Fall 54 0.055 18.313 6.83 6.65 0.178
BCs Spring 36 0.034 29.094 1 0.5 0.5 7.00 6.70 0.299
Fall 36 0.043 23.486 7.25 7.58 -0.334
BCr Spring 36 0.093 10.743 1 -0.5 0.5 4.53 4.17 0.355
Fall 36 0.119 8.386 6.06 5.73 0.329
)C (3) Spring
Fall
9.31
4.88t weight = 1 / V ariance o f mean * significant deviation at the 5% level o f probability,
not significant
Table 8. Joint scaling test of the additive-dominance (3 parameter) model on the
Generation No. of Variance Model Mean Differenceplant of mean w ei^ni
m [a] [dl Observed Expected O -E
Ps 36 0.040 25.019 1 1 0 7.25 7.28 -0.031
Pr 36 0.030 33.402 1 -1 0 2.89 2.97 -0.085
F, 36 0.037 27.227 1 0 1 6.72 6.85 -0.132
F2 108 0.041 24.229 1 0 0.5 5.87 5.99 -0.120
BCs 72 0.019 51.982 1 0.5 0.5 7.13 7.07 0.058
BCr 72 0.053 18.838 1 -0.5 0.5 5.29 4.91 0.378
f (3) = 3.95t w eight = 1 / Variance o f mean
not significant
50

whereas those on the resistant inbred Hi38-71 took longer (9 days) than others.
Reproductive period lasted only 6.1 days for Hi38-71, while that for others lasted longer
(8.1 days for Hi27, 8.5 days for G24 and 11.3 days for 190). However, there was great
difference in days to 50% mortality between resistant inbred Hi38-71 and others. Half of
the aphids on Hi38-71 died by the 12th day. Other inbreds had 50% mortality at 23rd
(G24) and 25th day (190 and Hi27). When compared to Hi27, which was the susceptible
inbred used in the genetic study, difference in days to 50% mortality may be the major
cause o f difference of aphid coverage ratings seen in the previous genetic study.
Table 9. Performance of corn leaf aphid on different maize genotypes^
Hi38-71 Hi27 G24 190
Level of aphid tolerance High Intermediate Low Very
low
Total no. of progenies produced 65 74 128 213
Days to first winged form aphid emergence 7 7 7 7
Numbers of wingless form emerged 0 0 0 2
Number of progenies produced by wingless form - - - 100
Days to first progeny emergence 9 8 8 7
Days to 50% mortality 12 25 23 25
Average life cycle (days) 17.7 21.4 19.8 23.9
Average reproduction period (days) 6.1 8.1 8.5 11.3
Ten sam ples per genotype.
51

2 .4 . DISCUSSION
2, 4 .1 . Yield loss
Yield losses due to com leaf aphid infestations were observed in this study to
range widely and occasionally very high. Previous studies indicate that significant yield
reduction by aphids may occur when a dry spell occurs during the growing season
(Triplehom, 1959; Foott and Timmins, 1973). Our observation, however, clearly shows
that heavy infestation o f com leaf aphid itself can cause great yield reduction without
drought stress in maize. This may be particularly tme in tropical areas where com leaf
aphid is present throughout the year. Com leaf aphids have no trouble finding their host
plants even when there is no maize growing near them.
Population dynamics of com leaf aphids in Hawaii correlates with population of
their predators and parasites. Potential for aphid outbreaks is present throughout the year
except during the summer growing season in Hawaii. It is unlikely that aphids can
survive during hot and dry summer of Hawaii. During summer, aphids were rarely
observed in the field. When temperatures and day-length began to drop, aphid
populations started building up and reached a peak around October and November in
fields, where tassels were about to emerge. It appears that it takes some time for predators
and parasites to reach population levels at which biological control takes effect. If aphids
successfully increase their population in absence of predators and parasites, yield could
be greatly reduced. This exactly happened in a hybrid seed com production nursery
during the winter o f 2000, where an average of 72% reduction in yield was observed. It
seemed that arrival of predators and parasites after mid-silking was too late to prevent
yield reduetion in the field. This pattern of aphid population inerease and biological
52

control repeated in early spring (late February to middle of March) when populations of
predators and parasites had disappeared in the field. It must be emphasized that biological
control has of great value in controlling aphid pest where no chemical treatment is needed.
The use of resistant cultivars also plays a key role to prevent potential yield loss,
particularly during the period where predators and parasites are absent from the field.
Predators and parasites found in the Waimanalo Research Station are illustrated in
Appendix A. It appeared that ladybird beetles and their larvae were the most prevalent
species followed by syrphid fly larvae. Lacewing larvae were also found occasionally.
Major causes o f yield loss seem to be related to barren ears and poor set of
kernels by heavy infestation during tassel development and emergence. Foott and
Timmins (1973) suggested that the most critical and vulnerable time for plant damage is
two weeks prior to pollen shed during the late whorl stage. Excessive number of com leaf
aphids on emerging tassel consumes ample amount of phloem sap and dismpts pollen
shed. Poor kernel set on ears o f heavily infested plants does not only seem to be caused
by the dismption of pollen shed but also by excessive honeydew produced by the aphids
that land on silks.
The emerging tassel and whorl of maize were major feeding sites of com leaf
aphid. Aphids were rarely observed on exposed areas of plants, such as the leaf surfaces
and stalks, due both to predators and parasites and to unfavorable environmental
conditions like direct sunlight. Com leaf aphids in the seed production nursery, however,
were found all over the H1012Crf plants, literally covering entire maize plants when the
tassels were not detached from H1012Crf
53

There is no evidence that C-cytoplasmic male sterility is linked to com leaf aphid
susceptibility. Male florets provide a protective hiding place for aphids. One, however,
should be aware of the possibility o f linkage of certain type of cytoplasm to disease or
insect susceptibility. Historical yield loss on seed com production in early 1970’s by
southern com leaf blight (Bipolaris maidis) is a great example of this kind.
2. 4. 2. Inoculation and quantification
Artificial inoculation and quantification methods developed in this study
provided reasonable results. Although aphids responded differently in two seasons, there
was no interaction between aphid performance and seasons. Thus, field evaluation with
artificial inoculation still has some environmental effects on aphids. It is doubtful
whether this kind of environmental effect could be eliminated under screenhouse or
growth chamber. Crops like maize and sorghum are difficult to evaluate in large numbers
under such conditions.
Some predators were able to crawl in and attack aphids confined in the cages.
Lacewing larvae and, most frequently, syrphid fly larvae were occasionally found in
some of cages, especially those in the spring trial. Readings from attacked cages might
have biased the generation mean analysis of spring data, resulting in significant deviation
from additive-dominance model. As the experiment was repeated and population size
became larger, observed generation means became adequately explained by three-
parameter model.
Aphids used in the artificial inoculation were collected from a natural population.
There was no study done on the genetic structure nor biotypes of com leaf aphid
54

populations in Hawaii. Genetic diversity does exist in com leaf aphid populations in
nature (Caballero et al., 2001; Steiner et al., 1985; Brown and Blackman, 1988) despite
their parthenogenetic reproduction system. Aphids colleeted in the same field were
assumed to be genetically identical, having come from a single clone of aphids.
An attempt was also made to utilize Digital Image Analysis (DIA) to measure the
exact area covered by aphids in confined area. Since there were aphids at all different
growth stages, sizes and forms, counting the number o f aphids per cage alone may not
accurately represent the population. DIA uses digital image softwares to analyzes a color
property in a digital image and effectively separates two distinctive colors. DIA was
demonstrated to effectively quantify turfgrass cover on the ground (Richardson et al.,
2001). DIA in this study, however, failed to separate aphids from their cast skins and
from leaf areas since aphids were more or less similar to maize leaves in terms o f color.
DIA may be useful with different species of aphids which are distinctive in color from
leaves of their host crops.
2. 4. 3. Resistance to corn leaf aphid
The hair-pin clip-cage approach was effective in distinguishing resistant and
susceptible maize plants and intermediates. Hi38-71 supported fewer aphids than the
susceptible parent. Hi 27. Our data clearly shows that the resistance to com leaf aphid in
Hi 38-71 is controlled by a single recessive factor. This agrees with the previous findings
o f Lu and Brewbaker (1999) who evaluated Hi38-71 under natural com leaf aphids
infestation. Chang and Brewbaker (1974, 1976) also reported that resistance to com leaf
aphid in a maize inbred, AA8sh2, was under monogenic control. It is likely that the gene
55

discovered by Chang and Brewhaker (1974, 1976) may be the same since Hi38-71 has its
origin from sweet com inhred AA8sh2. Unfortunately, AA8sh2 has lost viability over the
intervening time and there is no way to confirm this hypothesis. In addition to the
monogenic resistance, resistance to com leaf aphid in maize is also present in the form of
multiple genes (Bing et al., 1992). Resistance to com leaf aphid was also reported in
barley and sorghum (Ram, 1983; Fisk, 1978).
The resistance described in this work was not completely toxic to the point of
lethality to the aphids, but feeding on resistant plants may have altered somehow the
growth or reproduction o f the aphids, resulting in fewer aphids on resistant plants than on
susceptible ones. Chang (1976) examined the resistance mechanism in AA8sh2 and
found a strong antibiotic effect on com leaf aphid, based on the number o f days to
reproduction, the number of nymphs produced and the rate of reproduction. In his study,
com leaf aphid was not completely eliminated by feeding on resistant parents. His
observation also indirectly supports the hypothesis that the resistance in Hi38-71 may
have been derived from the sweet com inbred AA8sh2 by chance.
Plant secondary metabolites such as hydroxamic acid have been widely studied
in relation to antibiotic effects on com leaf aphids. Early studies demonstrated that
DIMBOA concentrations had significant positive correlation with com leaf aphid
populations in maize (Chang, 1976; Long et al., 1977; Beck et al., 1983). This result was
further supported by the fact generally accepted factor, that the maize seedling was
almost immune to com leaf aphid, and maize seedlings contained high concentration of
DIMBOA. Recent studies, however, produced a conflicting result in which DIMBOA in
maize may have no direct effects on com leaf aphid (Bing et ah, 1990). Cambier et al.
56

(2001) perceived that DIMBOA is not present in phloem sap when plants were not
injured. Thus, rather than DIMBOA itself, they studied antibiotic effects of DIMBOA
derivatives such as DIMBOA-Glc and HDMBOA-Glc present in phloem sap in the
absence of wounding. The authors reported a negative correlation between high levels of
these compounds and performance of Metopolophium dirhodum on artificial diet. It may
help to understand the underlying mechanism of resistance in Hi38-71 to examine high
dosage effect o f those compounds on com leaf aphid. CrylAb protein produced by Bt
gene did not have significant effect on com leaf aphid fed on artificial diets (Head et ah,
2001).
Plant morphology may make some contribution to com leaf aphid response in
addition to chemical factors. Maize genotypes in which the tassel emerges quickly and
completely from the upper leaves tend to reduce the aphid population (Coon, 1945). In
contract those that enclose the tassel longer in the whorl provide a favorable habitat for
aphids (Painter, 1968) and protection from their predators and parasites. Inbred Mo 17 is
known to exhibit moderately high resistance to com leaf aphids. Tassels of this inbred
emerge out o f whorl quickly and completely. In contract, susceptible inbred 217 in the
aphid performance test here has broad and tender leaves with its tassel very close to the
uppermost leaf and often not completely emerged. Morphological traits such as leaf color,
glossiness of leaf, days to maturity and number of tillers per row were not found to
contribute towards resistance or susceptibility to com leaf aphid in barley (Narang et al.,
1997).
Breeding for resistance against com leaf aphid appears to have received little
attention so far due mainly to the periodic and sporadic nature o f its occurrence in nature.
57

It is very difficult to attain uniform infestation under field conditions and there has been
no effective inoeulation technique for maize. Since com leaf aphids are present year-
round and hold potential threat to yield in this study, the use o f resistant cultivars would
be of benefit to small-scale farmers who hardly can afford the eost of insecticides.
Breeding for resistance to aphids could be achieved through backcrossing and
selfing with the resistanee gene of Hi38-71 and the clip-eage method under field
conditions. Backcross procedure will be straightforward and will include hybridization to
recurrent parents, followed by self-pollination and screening o f BCF2 for resistant
individuals. The use of DNA markers associated with the resistance gene can replace the
tedious artificial inoculation procedure and will improve the efficiency o f backcross
breeding.
58

CHAPTER THREE
ESTIMATION OF GENETIC PARAMETERS FOR
POLYSORA RUST RESISTANCE
ABSTRACT
Polysora rust of maize {Puccinia polysora Underw.) is found primarily in the
tropics and occurs throughout the year in Hawaii. Most temperate maize varieties are
highly susceptible and must be sprayed regularly to minimize yield loss. In contrast,
tropical maize varieties often are highly resistant to the rust. However, little genetic
information has been published on this resistance. This information would be of special
value in Hawaii, where hybrids of temperate x tropical maize are exploited. The genetic
parameters for the rust resistance were estimated by evaluating six generations following
the hybridization of inbreds G24 and Hi38-71 under uniform epiphytotics of the rust at
Waimanalo Research Station. A visual rust rating score of 1 to 9 was adopted 15 to 20
days after mid-silking. Mean rating scores for Hi38-71 and G24 were 3.22 and 6.90,
respectively. The F| hybrid showed high resistance to the rust (2.93), while F2 had a
higher mean (4.20) but showed a wide range of variation about the mean. A simple 3-
parameter model (m, [a] & [</]) did not fully explain the data. However, the 5-parameter
model that incorporated epistasis adequately explained the variation in resistance.
Epistatic interactions aa and dd were highly significant, while the ad interaction was not.
The high significance o f non-additive and epistatic effects makes clear that polysora
resistance breeding cannot be based on selection of a single parent. A hybrid-breeding or
reciprocal-recurrent selection approach appears justified.
59

Polysora rust or southern com rust is caused by Puccinia polysora Underwood.
Host range of polysora mst is confined to maize and its relatives such as teosinte and
Tripsacum speices (Ullstmp, 1977). Polysora mst is favored by high temperatures (27°C)
and high relative humidity (Shurtleff, 1980). It mainly occurs in the tropics at elevations
below 4,000 ft (1,220 m) and is present throughout the year in Hawaii. In the continental
United States, the disease is principally seen in the southeastern states but has been
reported as far north as Wisconsin (Pavgi and Flangas, 1959).
Polysora mst can be distinguished from common rust caused by Puccinia sorghi
Sche. by its pustule size, shape and color (Ullstmp, 1977). However, it is considerably
more devastating and has ability to kill the plants which common mst rarely does (Scott
etal., 1984).
Severe polysora epiphytotics were observed in Africa during early 1950’s
(Robinson, 1996) and the Mississippi Valley during 1972-74 (Zummo, 1998). Observed
yield losses by polysora rust range from 4% to 50% (Rhind et al., 1952; Rodriguez-Ardon
et al., 1980).
Although several monogenic resistant genes have been identified so far (Ullstmp,
1965), these race-specific resistances were not durable and have been overcome by racial
variation of the pathogen (Robinson, 1996). The resistance gene, Rpp9, was introduced to
South Africa but soon broke down before commercial release of hybrids with the gene.
General resistance has been identified in field com (Bailey et al., 1987; Zummo, 1988;
Moon, 1995, Holland et al., 1998). This type of resistance is also available in sweet com
3 .1 . INTRODUCTION
60

gemplasm and is particularly important in sweet com breeding program for tropical
regions.
In the winter cropping season of 2002, a uniform natural infection of the disease
occurred at Waimanalo Research Station. Genetic variation was observed in F2 and
backcross families from the hybrid o f Hi38-71 x G24, and attempts have been made to
determine mode of gene action and to estimate genetic parameters through generation
mean analysis.
3. 2. MATERIALS AND METHODS
3. 2 .1 . Parent inbreds for generation mean analysis
Tropical super sweet com inbred Hi38-71 (resistant) and a semi-dent maize
inbred G24 (susceptible) were used to produce Fj, F2 and two backcross populations (BCr
and BCs). Hi38-71 was intermediate in mature-plant resistance and many tropical inbreds
show greater resistance. The G24 inbred derived its susceptibility from com belt dent
inbred B68 . G24 is one o f the G Set Recombinant Inbred Lines (RILs) from the cross of
Ki 14 (a Thailand inbred) and B68 (as Hawaii conversion, Hi31). This G Set of RILs
segregated approximately 50% susceptible: 50% resistant (Moon, 1995).
3. 2. 2. Disease evaluation
The experiment design and plot size were similar to those in studies of com leaf
aphid resistance. The epiphytotic of polysora mst in winter o f 2002 was uniformly severe,
and genotype evaluation relied on the natural infection. About two weeks after mid-
61

silking, ten individual plants per row were visually rated using 1 to 9 scale based on the
plant appearance in relation to percent o f leaf surfaee with rust infection, chlorosis and
necrosis beyond the lesions. The rating scale was modified from a rating scale used in
common rust evaluation by Kim et al. (1980):
1 = No symptom or less than 1% area on the lower leaves infected and
considered monogenic resistance
2 ~ 3 = Resistant; 2 - 20% area on the lower leaves and an ear leaf covered by the
pustules.
4 = Moderately resistant; 21 - 35 % area on the lower leaves and an ear leaf
covered by the pustules.
5 = Intermediate ; 36 ~ 50% area of the lower leaves and an ear leaf covered
by the pustules and ambiguous for classifieation into resistant or
susceptible. Light infection on stalks.
6 = Moderately susceptible ; 51 - 65% area on the lower leaves, an ear leaf
and upper leaves covered by pustules. Intermediate infection on stalks.
7 ~ 8 = Susceptible ; 66-80% are on the lower leaves, an ear leaf and upper leaves
covered by pustules. Heavy infection on stalks.
9 = Highly susceptible ; More than 80% of the area on entire plant covered by
pustules and premature death of plants.
62

Initial analysis began with a three-parameter model that excludes non-allelic gene
interactions. The model was tested by simple scaling tests followed by a joint scaling test,
also used in the genetic study of resistance to com leaf aphid. When the simple and joint
scaling tests with three-parameter model were significant, the simple additive-dominance
model (monogenic model) was judged inadequate, and non-allelic interactions were
considered. The genetic model thus became digenic involving the six parameters m, [a\,
[d\, [aa\, [ad\ and [dd\. No test of goodness of fit was possible with the six generation
means, since no degree of freedom would be left for a new six-parameter model. In other
words, a joint scaling test with six generations cannot test the six-parameter model.
Estimates of the six parameters and their variances for the test o f significance
were obtained from the following formulas of Mather and Jinks (1977);
m = \/2P x+\/2P2+4F2-2Bx-2B2 V(w) = \/4Pi+\/4P2+\6F2+4Bi+4B2
[a] = \I2P x-\I2P2 V([a]) = \l4Px+\l4P2
[d\ = 65i+652-8F2-Fi-3/2Pi-3/2P2 V([t/]) = 365,+3652+64F2+Fi+9/4Pi+9/4R2
[ad\ = 2Bx+2B2-4p2 V([aa]) = 4 5 i+452+l 6F2
[ad\ = 2 Bx-Px-2 B2+p2 ^([ad]) = 4Bx+Px+4B2+P2
[dd\ = Px+P2+2Fi+4F2-^Bi^B2 ^{[dd]) = Pi+P2+4Fi+\6F2+\6Bi+\6B2
Standard errors of estimates were attained as the square root o f variance and the
test of significance for parameter estimates was equivalent to finding significant
deviations from zero in the simple scaling tests.
3 .2 .3 . Statistical methods
63
Any non-significant gene effects were then eliminated resulting in a new genetic
parameter model. For the computation, matrices C and M were modified to accommodate
genetic parameters with significant difference. With a reduced number of genetic
parameters, it became possible to have a test of goodness o f fit for the new model in the
joint scaling test.
3 .3 . RESULTS
Epiphytotics of polysora rust started approximately one week before tasseling
and became so uniform as to clearly distinguish individuals with different degree in
resistance and susceptibility. Common rust (sorghi) infection is often observed in
Waimanalo Research Station to follow after polysora rust, and can make it difficult to
separate those two rusts for visual rating purpose. However, there was no common rust
infection in these nurseries.
Generation means and standard errors are summarized in Tahle 10. Mean rating
scores for resistant (Hi38-71) and susceptible (G24) were 3.22 and 6.90 with mid-point of
5.06, respectively. Hi38-71 showed high uniformity in expression o f resistance to
polysora rust. The Fi hybrid showed uniformly high resistance to the rust (2.93), while F2
had a higher mean (4.20) hut showed a wide range of variation about the mean.
F1 hybrid resistance was a bit higher than the resistant parents. Heterosis evidently
played a role in contributing to resistance of the hybrids. Mean ratings for backcrosses to
resistant and susceptible parents tended to lean toward its parental mean with a wider
range. Standard errors for non-segregating generations were generally lower than those
for segregating generations except the susceptible parent.
64

Table 10. Estimates of mean, variance, number of plant, variance of mean and standard error of polysora rust rating for the Hi38-71 x G24 family.
Generations Mean^ Variance C.V.(%)
No. of Plant
Variance of mean
StandardError
Pr 3.22 0.176 13.0 60 0.0029 0.0542Ps 6.90 0.377 8.9 60 0.0063 0.0793
Mid-parent 5.06
F, 2.93 0.195 15.1 60 0.0033 0.0570
F2 4.20 0.922 22.9 180 0.0051 0.0716BCr 3.82 0.452 17.6 120 0.0038 0.0614BCs 5.70 0.706 14.7 120 0.0059 0.0767
t Rating scale (1~9); 1 = higly resistant, 9=higly susceptible
Genetic differences in response to polysora rust became clear in frequency
distributions (Fig. 9). Parental distributions differed greatly in response to polysora rust
infection. Rating scores for Hi38-71 had a very narrow range, reflecting high uniformity
in resistance to polysora resistance. A somewhat wider range in polysora rust ratings was
observed in G24, largely a function of scale. G24 was produced by six successive self-
pollinations from a cross between Ki 14 and B68 followed by a few sib-matings for seed
production while Hi38-71 results from years of self- and sib-pollinations and is
considered highly homozygous.
The Fi hybrid showed a lower mean and wider range than the resistant parents.
Segregation in F2 population resulted in a very wide range o f response to polysora rust,
hut the mean (4.2) remained toward resistance. None o f the F2 plants exceeded parental
ranges. The distribution of polysora rust ratings in backcross to resistant and susceptible
parents showed wider ranges, with their means biased toward those of the parents.
65

Hi38-71 (Resistance) G24 (Susceptible)
c«aod
Bci5Q.
k*-od
BcnQ.
Od
i2c«a.od
Polysora rust rating Polysora rust rating
F280 - 80
60 BcjS
60
40 — - -Q.O 40 — |— 1
20dz 20
n n 1— 1 n ruU
1 2 3 4 5 6 7 8 9u
1 2 3 4 5 6 7 8 9
Polysora rust rating
BC to Hi38-71
Polysora rust rating
BC to G24
Polysora rust rating
2 3 4 5 6 7 8 9
Polysora rust rating
Fig. 9. Frequency distributions of polysora rust rating in the six generation of the Hi38-71 X G24 family.
66

The possible involvement of non-allelic interaction was initially investigated with
individual scaling tests (Table 11). All scale tests were found to be significant, implying
that non-allelic interactions were involved in the observed genetic variation. The joint
scaling test for additive-dominance model (Table 12) was also employed. It confirmed
the individual scaling test with a goodness o f fit value for additive-dominance model that
was highly significant. Thus it can be concluded from the individual and joint scaling
tests that observed variation among six generations can not be explained with three
genetic parameters.
Three epistatic interactions, [aa], [ad] and [dd] were then included for analysis.
All six parameters were computed by the perfect fit method proposed by Mather and
Jinks (1977). The test revealed that all but the additive x dominance interaction were
highly significant (Table 13). No test of the adequacy of the six-parameter model was
possible because the number o f estimated components was equal to that of observed
means, leaving no degree of freedom for the test o f goodness of fit. However, since there
was no significant [ad] interaction, the non-significant component was omitted to fit a
five-parameter model. This provided a mean to test the goodness o f fit o f the five-
parameter model, with one degree of freedom. At the same time, it improved the
precision with which the remaining parameters were estimated.
The joint scaling test for the five-parameter model produced a value of 0.13,
indicating no significance departure from expectation (Table 13) and validating the
model. Moreover, all five parameters remained significant after fitting the five-parameter
model.
67

Table 11. Individual scaling tests on polysora rust rating from the Hi38-71 x G24 family.
Test
A = 2 B C r - P r - F i
B = 2 B C s - P s - F i
C = 4 F 2 - 2 F i - P r - P s
1.49 ±0.146
1.57 ± 0 .1 8 2 ’
0.82 ±0.323
*, ** significant deviation from zero, according to a t-test at the 5% and 1% level of probability, respectively.
Table 12. Joint scaling test of the additive-dominance (3 parameter) model on a cross between Hi38-71 and G24 for polysora rust rating.
Gene No. of Variance WeighF ■Model Mean Difference
ration plant m a d Observed Expected O -E
Pr 60 0.176 5.6818 1 1 0 3.22 3.40 -0.1814
Ps 60 0.377 2.6525 1 -1 0 6.90 7.15 -0.2458
F, 60 0.195 5.1282 1 0 1 2.93 3.26 -0.3281
F2 180 0.922 1.0846 1 0 0.5 4.20 4.27 -0.0659
BCr 120 0.452 2.2124 1 0.5 0.5 3.82 3.33 0.4902
BCs 120 0.706 1.4164 1 -0.5 0.5 5.70 5.20 0.4980
5C'(3) =160.77’
t weight = 1 / Variance of mean** significant deviation at the 1% level of probability.
68

Thus, observed genetic variations can be fully explained by the five parameters including
two types o f epistatic interactions, [aa] and [dd], Trigenic interactions and similar
complex factors appear not to be making a significant contribution to the difference
among the generation means. There was also a marginal improvement in the precision,
reflected in slightly lower standard errors.
Table 14 shows estimates of expected generation means using the three- and five-
parameter models. As previously observed, the three-parameter model produced expected
means that differed significantly from observed means (x^= 160.77). Expected means by
the five-parameter model were essentially identical to observed means, with value of
0.13.
69

Table 13. Estimates of the components of the generation means for the cross Hi38-71 X G24 fitting a six-parameter model by perfect fit estimation and a five-parameter model by the weighted least square.
Six-parameter model Five-parameter model
m 2.82 ±0.351** 2.84 ±0.347**
[a] -1.84 ±0.048 ** -1.85 ±0.043 **
[d \ 5.41 ±0.836** 5.36 ±0.825*
[a a \ 2.24 ±0.347** 2.23 ±0.345 *
[a d \ -0.08 ±0.219"^
{d d \ -5.30 ±0.509** -5.27 ±0.500**
z ' ( i ) - 0.13"^*, ** significant at 5% and 1% levels, respectively: not significant.— gene effect identified as non-significant from perfect fit estim ation and, therefore, excluded in the weighted least square analysis.
Table 14. Estimates of expected generation means of 3- and 5 parameter model by the weighted least square.
„ . Observed Expected meanVJCIlcraLlVJll mean 3 parameter 5 parameter
Pr 3.22 3.401 3.215
Ps 6.90 7.146 6.911
F| 2.93 3.258 2.930
F2 4.20 4.266 4.200
BCr 3.82 3.330 3.833
BCs 5.70 5.202 5.680
id 160.77 ** 0.13"^t X test at 3 d f and 1 d f for expected generation means by 3- and 5-param eter model. ** significant at 1%: "* not significant.
70

This study demonstrates conclusively the involvement of epistasis in the
resistance to polysora rust. A digenic model with additive x additive and dominance x
dominance type epistasis adequately explained the observed genetic variation. Therefore,
higher order interactions such as trigenic epistasis and similar complex factors do not
make significant contributions to the differences in polysora rust resistance among the
generations studied. The involvement of epistatic interactions for polysora rust resistance
in field com was also reported by Holland et al. (1998).
When epistasis is significant in such a study, some bias in estimating additive and
dominance effects is expected (Hallauer and Miranda, 1981). This observation should be
considered to provide a better understanding of maize-polysora mst association rather
than to obtain precise estimates of gene effects.
Gene effects of quantitative traits often show interaction with environment
(Gonzalez-Morezo and Dudley, 1981). No information was gained on gene effects in
different genetic backgrounds or environments in this study. Further study is
recommended to evaluate genotype x environment interactions of polysora resistance.
The results of this study provide direction for the breeding of polysora-resistant
maize cultivars. A negative sign for [dd\ suggests interaction between increasing and
decreasing alleles. This gives evidence for some level of dispersion in the inbred, Hi38-
71, and indicates that further improvement in the level o f resistance in Hi38-71 is
possible. Significance of [a] and [aa\ also implies that part of resistance can be fixed in
inbred lines of maize. Due to simultaneous significance of [ /] and [dd\, a reciprocal
recurrent selection scheme seems most appropriate. Genetic gains through reciprocal
3 .4 . DISCUSSION
71

recurrent selection, however, are slow and time-consuming. If gene effect x environment
interaction is present, testing in more than one location is required to detect favorable
gene effects and for rapid breeding progress. In terms of selection sites in Hawaii,
Waimanalo Research Station provides appropriate levels of natural infection in most
years, although severity is somewhat higher during the winter. Development o f artificial
inoculation technique under field conditions and quantification of this kind of foliar
disease might provide better understanding of plant-pathogen relationships.
Polysora rust resistance is more important in field com, as sweet corns are often
harvested before leaf diseases become serious. High levels of polysora resistance exist in
tropical field corns, but using them in sweet com improvement may result in having
undesired traits such as thick pericarp along with the resistance.
Hi38-71 is a sib line o f Hi38 which was bred from a bt-\ conversion (6
backcrosses) o f AA8sh2. It was studied for its resistance to com leaf aphid in 1970’s in
H aw aii and was converted to common rust resistance, i?/?l-D which broke down due to
racial variation of the pathogen. R/?l-D is located on a short arm o f chromosome 10 of
maize which carries a cluster of complex resistance gene loci to common mst as well as
polysora mst (Hulbert et al., 2001; Holland et ah, 1998). Chang (1976) observed a
possible linkage of com leaf aphid resistance to the common mst resistance in AA8sh2.
Resistance to com leaf aphid in Hi38-71 probably originated from AA8sh2. Thus, it
might be possible that the resistance to com leaf aphid is somehow linked to the polysora
rust resistance in Hi38-71 on a short arm of chromosome 10 in maize. Mapping with
molecular markers will help determining the relationship between two resistances in
Hi38-71.
72

Hi38-71 is particularly of value in sweet com breeding for tropical regions not
only due to its dual resistance to com leaf aphid and polysora resistance, but to erectness,
high sweet com qualities, and generally good combining abilities (Nourse, 2000).
73

Appendix A. Predators of corn leaf aphid in Waimanalo Agricultural Research Station
Yellow shouldered ladybird beetle {Scymnodes lividigastei)
Slim-line ladybird beetle {Coelophora inaequalis)
74

Appendix B. Rating scores of corn leaf aphid coverage among Hi38-71 x Hi27 family.
Generation
Aphid coverage rating score (1-9)Spring Fall Grand
R1 R2 R3 AVG R1 R2 R3 AVG mean6 9 6 9 8 76 4 7 7 9 8
H27 77
77
68
6.56 58
99
88
7.94 7.25
7 4 5 7 9 76 7 9 8 9 81 1 1 3 4 63 3 1 4 4 6
Hi38-71 32
13
11 1.83 3
244
75 3.94 2.89
1 2 2 2 3 31 4 2 3 5 36 6 7 8 8 86 5 9 9 8 7
Fi47
95
77
6.06 76
86
78
7.39 6.72
4 4 6 7 7 74 5 8 8 7 77 2 8 9 8 44 1 8 8 7 76 4 7 7 5 73 5 3 6 5 81 8 4 7 7 86 3 3 7 9 92 7 3 8 4 46 4 2 9 7 5
F2 74
33
18
4.91 88
88
78
6.83 5.87
6 7 3 9 9 45 9 2 9 8 73 8 3 8 5 52 1 7 9 4 62 8 6 7 3 66 8 8 5 7 35 9 8 4 9 83 7 6 9 8 5
75

Appendix B. (continued)
Generation
Aphid coverage rating score (1-9)Spring Fall
BCr
BCs
R11
3 2 24 3 1
1
23 2 24 7 6 778
7 778
6 7
R24 2 2 9 9 7 2 1
5 2 2 3768
9 5 8
978
78
7
4.53
R3 AVG 8
7 6 9 778
8
77 9 68
778
8
7 4 7 6 7 7 6
7.00
R1 R248
4 9 8
8 8
758
7
13 2 24 3 1
1 2 3 2 2
78
4 44 75 4 934
T2299721
5 2 2 3
R3933 84 8 7 7 4 9 3 7
~8~769778
8
7 7 9 6
GrandAVG mean
6.06 5.29
4.53 5.76
76

Appendix C. Rating scores of polysora rust among Hi38-71 x G24 family.
Generation ReplicationMean
Re P 1 Re p2 Re p3
Hi38-71
3 4 4 3 3 3
3.22
3 3 3 3 3 33 3 3 3 3 33 3 3 3 3 34 3 3 4 3 43 3 3 3 4 33 3 3 3 3 44 4 3 3 4 33 3 3 4 3 43 4 3 3 3 3
G24
7 7 7 6 7 7
6.90
7 7 6 6 67 7 8 6 7 77 7 8 6 7 67 7 8 7 7 77 7 7 6 6 67 7 7 8 6 7
7 8 8 7 77 7 7 7 6 67 7 9 7 7 6
F,
3 2 3 3 3 3
2.93
2 3 3 3 3 42 3 3 3 3 33 2 3 3 3 42 2 4 3 3 32 2 4 3 3 32 3 3 4 4 32 3 3 3 3 32 3 3 4 3 32 3 3 4 3 3
BCr
6 4 3 4 3 5
3.82
4 4 3 3 3 34 4 5 5 3 33 4 3 3 3 33 4 3 5 3 44 4 4 4 3 44 5 4 4 3 44 5 3 6 4 34 4 4 4 4 54 5 3 3 3 34 4 4 3 4 44 4 4 3 3 34 4 4 3 3 34 5 4 4 4 33 4 4 4 3 34 4 4 5 3 45 4 4 4 3 54 4 4 4 3 44 4 5 4 3 35 5 3 3 5 4
Generation ReplicationRep 1 Rep 2 Rep 3
Mean
4 3 3 4 3 73 3 3 4 3 55 5 6 4 4 34 5 5 4 4 44 4 3 4 5 43 3 4 5 3 43 4 6 4 6 33 4 5 5 3 33 6 3 4 4 46 4 5 6 3 53 4 3 5 4 6
5 4 4 5 6 55 3 3 4 3 44 5 3 3 4 4
t: 4 4 4 4 4 5 A OA7 5 4 5 4 4 4 . z U
4 4 5 4 5 44 5 6 4 3 45 4 5 4 4 54 5 3 3 3 46 4 3 4 4 45 6 4 4 3 34 4 5 3 4 44 4 3 4 4 54 5 4 4 4 44 4 3 5 3 45 7 3 5 5 55 4 3 4 4 6
4 7 4 4 4 34 7 5 3 5 47 6 7 7 6 47 6 6 5 5 57 6 6 6 6 57 6 6 6 5 47 7 7 6 5 6
7 6 7 5 6 6
5 6 6 5 6 46 6 5 6 5 47 7 5 5 5 4
BCs7 7 7 5 4 6 5.708 8 6 6 5 48 6 6 5 5 55 8 6 6 4 55 5 6 6 4 6
7 4 6 6 4 6
6 5 5 7 6 6
6 5 5 6 4 57 6 5 5 4 56 7 5 6 4 6
6 7 5 6 3 5
77

REFERENCES
Argandona, V. H., J. G. Luza, H. M. Niemeyer and L. J. Corcuera. 1980. Role ofhydroxamic acids in the resistance of cereals to aphids. Phytochemistry 19: 1665- 1668.
Bailey, B. A., W. Schuh, R. A. Frederiksen, A. J. Bockholt and J. D. Smith. 1987.Identification of slow-rusting resistance to Puccinia polysora in maize inhreds and single crosses. Plant Disease 71: 518-521.
Beck, D. L., G. M. Dunn, D. G. Routley and J. S. Bowman. 1983. Biochemical basis of resistance in com to the com leaf aphid. Crop Science 23: 995-998.
BeMiller, J. N. and A. J. Pappelis. 1965. 2,4-dihydroxy-7-methoxy-l,4-benzoxazin-3-one glucoside fractions content of pith cores and stalk rot resistance. II. Isolation of 6- methoxy-2 (3)-benzoxazolinone fraction as a measure of glucoside content and tissue differences of glucoside content. Phytopathology 55: 1237-1243.
Bergquist, R. R. 1975. Sugarcane mosaic vims on com and sorghum in Flawaii. pp. 5-6.In Hawaii Agricultural Experiment Station, Univ. o f Hawaii, Miscellaneous Publication 122.
Berry, R. E. 1969. Effects o f temperature and light on takeoff of Rhopalosiphum maidis and Schizaphis graminum in the field (Homoptera: Aphididae). Ann. Entomol.Soc. Am. 62(5): 1176-1184.
Bing, J. W. and W. D. Guthrie. 1991. Generation mean analysis for resistance in maize to the com leaf aphid (Homoptera: Aphididae). J. Econ. Entomol. 84: 1080-1082.
Bing, J. W., M. G. Novak, J. J. Obrycki and W. D. Guthrie. 1991. Stylet penetration and feeding sites of Rhopalosiphum maidis (Homoptera: Aphididae) on two growth stages o f maize. Ann. Entomol. Soc. Am. 84(5): 549-554.
Bing, J. W., W. D. Guthrie and F. F. Dicke. 1992. Genetics of resistance in maize to the com leaf aphid (Homoptera: Aphididae). J. Econ. Entomol. 85(4): 1476-1479.
Bing, J. W., W. D. Guthrie, F. F. Dicke and J. J. Obrycki. 1990. Relation of com leaf aphid (Homoptera: Aphididae) colonization to DIMBOA content in maize inbred lines. J. Econ. Entomol. 83(4): 1626-1632.
Blackman, R. E. and V. F. Eastop. 1984. Aphids of the world’s crops: an identification and information guide. Wiley, New York.
78

Branson, T. F. and E. E. Ortman. 1967. Biology of laboratory-reared com leaf aphids,Rhopalosiphum maidis (Homoptera: Aphididae). Ann. Entomol. Soc. Am. 60(5): 1118-1119.
Brown, P. A. and R. L. Blackman. 1988. Karyotype variation in the com leaf aphid, Rhopalosiphum maidis (Fitch), species complex (Homoptera: Aphididae) in relation to host-plant and morphology. Bulletin o f Entomological Research 78: 351-363.
Caballero, P. P., C. C. Ramirez and H. M. Niemeyer. 2001. Specialisation pattern of the aphid Rhopalosiphum maidis is not modified by experience on a novel host. Entomologia Experimentalis et Applicata 100: 43-52.
Caillaud, C. M. and H. M. Niemeyer. 1996. Possible involvement of the phloem sealing system in the acceptance o f a plant as host by an aphid. Experientia 52: 927-931.
Cambier, V. T. Hance and E. De Hoffmann. 2001. Effects of l,4-benzoxazin-3-onederivatives from maize on survival and fecundity of Metopolophium dirhodum (Walker) on artificial diet. J. Chem. Ecol. 27(2): 359-370.
Cammack, R. H. 1954. Observation in Puccinia polysora Underwood in West Africa. West African Maize Rust Res. Unit Annu. Rep. 1(1953): 16-31.
Cartier, J. J. 1957. On the biology of the com leaf aphid. J. Econ. Entomol. 50: 110-112.
Cavalli, L. L. 1952. An analysis o f linkage in quantitative inheritance. In Quantitative Inheritance (Ed. E. C. R. Reeve and C. H. Waddington) pp. 135-144. HMSO, London.
Chan, C. K., A. R. Forbes and D. A. Raworth. 1991. Aphid-transmitted vimses and their vectors of the world. Agric. Canada Res. Branch Tech. Bull. 1991-3E. 216 pp.
Chang, S. H. 1976. The genetics o f resistance to the com leaf aphid, Rhopalosiphum maidis (Fitch), in com. Ph.D. thesis University o f Hawaii.
Chang, S. H. and J. L. Brewbaker. 1974. Aphid resistance under apparent monogenic control. Maize Genet. Coop. Newsl. 48: 37-38.
Chang, S. H. and J. L. Brewbaker. 1976. The genetics of resistance to the com leaf aphid, Rhopalosiphum maidis (Fitch). Maize Genet. Coop. Newsl. 50: 31-32.
Coon, B. F. 1945. The influence of tassel type on aphid infestation in the field corn nursery. Penn. Agr. Expt. Sta. Dept. Zoo. and Ent. Rpt. lOp.
79

Coon, B. F., R. C. Miller and L. W. Aurand. 1948. Correlation between the carotene content of com and infestation by the com leaf aphid. Penn. Agr. Expt. Sta. Dept. Zoo. and Ent. Rpt. 8p.
Corcuera, L. J., C. B. Queirolo and V. H. Argandona. 1985. Effects of 2-P-D-glucosyl-4- hydroxy-7-methoxy-l,4-benzoxazin-3-one on Schizaphis graminum (Rondani) (Insecta, Aphididae) feeding on artificial diets. Expeientia 41: 514-516.
Dadd, R. H. 1985. Nutrition: organisms. In Comprehensive Insect Physiology,Biochemistry and Pharmacology (ed. By G. A. Kerkut and L. I. Gilbert), Vol. 4, pp. 313-391. Pergamon Press, Oxford.
Davis, J. J. 1909. Biological studies of three species of Aphididae. USDA Bur. Entomol. Tech. Ser. 12(8): 123-168.
Dicke, F. F. and S. M. Sehgal. 1990. Com leaf aphids relationship to maize growth and implication in mosaic vims disease. Maydica 35: 47-53.
Dixon, A. F. G. 1988. Aphid ecology, 2nd edition. Chapman and Hall. New York, USA.
Douglas, A. E. 1993. The nutritional quality of phloem sap utilized by natural aphid populations. Ecol. Entomol. 18: 31-38.
Eastop, V. F. 1954. The males of Rhopalosiphum maidis (Fitch) and a discussion on the uses of males in aphid taxonomy. R. Soc. London Proc. Ser. A 29: 84-86.
El-Ibrashy, M. T., S. El-Ziady and A. A. Riad. 1972. Laboratory studies on the biology of the com leaf aphid, Rhopalosiphum maidis (Homoptera: Aphididae). Entomologia Experimentalis et Applicata 15: 166-174.
Elliott, N. C., R. W. Kieckhefer and D. D. Walgenbach. 1988. Effects of constant and fluctuating temperatures on developmental rates and demographic statistics for the com leaf aphid (Homoptera: Aphididae). J. Econ. Entomol. 81(5): 1383-1389.
Everly, R. T. 1960. Loss in com yield associated with the abundance o f the com leaf aphid, Rhopalosiphum maidis, in Indiana. J. Econ. Entomol. 53: 924-932.
Fisk, J. 1978. Resistance of Sorghum bicolor to Rhopalosiphum maidis and Peregrinus maidis as affected hy differences in the growth stage of the host. Ent. Exp. Appl. 23: 227-236.
Fitch, A. 1856. The maize aphis. Aphis maidis new species. Report on the noxious, beneficial and other insects of the State of New York. Rep. 2: 318-320.
Foott, W. H. 1977. Biology of the com leaf aphid, Rhopalosiphum maidis (Homoptera: Aphididae), in southeastern Ontario. Can. Ent. 109: 1129-1135.
80

Foott, W. H. and P. R. Timmins. 1973. Effects of infestations by the com leaf aphid, Rhopalosiphum maidis (Homoptera; Aphididae), on field com in south western Ontario. Can. Entomol. 105: 449-458.
Forbes, S. A. 1905. Twenty-third report of the state entomologist of Illinois, pp. 123-133. Chicago, 111.
Futrell, M. C. 1975. Puccinia polysora epidemics on maize associated with cropping practice and genetic homogeneity. Phytopathology 65: 1040-1042.
Gamble, E. E. 1962. Gene effects in com {Zea mays L.): 1. Separation and relative importance of gene effects for yield. Can. J. Plant Sci. 42: 339-348.
Gemert, W. B. 1917. Aphis immunity of teosinte-com hybrids. Science 46(1190): 390- 394.
Gonzalez-Moreno, J. and J.W. Dudley. 1981. Epistasis in related and unrelated maize hybrids determined by three methods. Crop Sci. 21: 644-651.
Haber, E. S. and W. G. Gaessler. 1942. Sugar content of sweet com pollen and kernels of inbred and hybrid strains susceptible to tassel infestation by aphids. Proc. Amer. Soc. Hort. Sci. Proc. 40: 429-431.
Hallauer, A.R. and J.B. Miranda Fo. 1981. Quantitative genetics in maize breeding. Iowa State University Press, Ames, Iowa.
Head, G., C. R. Brown, M. E. Groth and J. Duan. 2001. CrylAb protein levels inphytophagous insects feeding on transgenic com: implications for secondary exposure risk assessment. Entomologia Experimentalis et Applicata 99: 37-45.
Hinds, W. E. 1914. Reducing insect injury in stored com. J. Econ. Entomol. 7: 203-211.
Holland, J. B., D. V. Uhr, D. Jeffers and M. M. Goodman. 1998. Inheritance of resistance to southern com mst in tropical-by-com-belt maize populations. Theor. Appl. Genet. 96: 232-241.
Hulbert, S. H., C. A. Webb, S. M. Smith and Q. Sun. 2001. Resistance gene complexes: Evolution and utilization. Annu. Rev. Phytopathol. 39: 285-312.
Johnson, C. G. 1969. Migration and dispersal of insects by flight. Methuen and Co., London.
Johnson, C. G. and L. R. Taylor. 1957. Periodism and energy summation with special reference to flight rhythms in aphids. J. Exp. Biol. 34: 209-221.
81

Kennedy, J. S. and C. O. Booth. 1963. Free flight of aphids in the laboratory. J. Exp. Biol. 40: 67-85.
Kieckhefer, R. W. and J. L. Gellner. 1988. Influence of plant growth stage on cereal aphid reproduction. Crop Sci. 28: 688-690.
Kieckhefer, R. W., W. F. Lytle and W. Spahler. 1974. Spring movement of cereal aphids into South Dakota. Environ. Entomol. 3: 347-350.
Kiesselbach, T. A. 1980. Structure and reproduction of com. Univ. o f Nebraska Press, Lincoln.
Kim, S. K., I. W. Buddenhagen and J. L. Brewbaker. 1980. Changes in the apparent resistance o f maize to Puccinia sorghi Schw. during development. SABRAO journal 12(2): 139-147.
Klun, J. A. and T. A. Brindley. 1966. Role of 6-methoxybenzoazolinone in inbredresistance o f host plant (maize) to first-brood larvae of the European com horer. J. Econ. Entomol. 59: 711-718.
Klun, J. A., C. L. Tipton and T. A. Brindley. 1967. 2,4-dihydroxy-7methoxy-l,4-benzoxazin-3-one (DIMBOA), an active agent in the resistance o f maize to the European com borer. J. Econ. Entomol. 60: 1529-1533.
Klun, J. and J. F. Robinson. 1969. Concentration o f two 1,4-benzoxazinones in dent com at various stages of development of the plant and its relation to resistance o f the host plant to the European com borer. J. Econ. Entomol. 62(1): 214-219.
Kogan, M. and E. E. Ortman. 1978. Antixenosis-a new term proposed to replace Painter’s “Non-preference” modality of resistance. Bull. Entomol. Soc. Am. 24: 175-176.
Lumbers, D. H. R. 1966. Polymorphism in Aphididae. Annu. Rev. Entomol. 11: 47-78.
Long, B. J., G. M. Dunn and D. G. Routley. 1975. Relationship of hydroxamic acidcontent in maize and resistance to northern com leaf blight. Crop Science 15: 333- 335.
Long, B. J., G. M. Dunn, J. S. Bowman and D. G. Routley. 1977. Relationship of hydroxamic acid content in com and resistance to the com leaf aphid. Crop Science 17: 55-58.
Lu, X. and J. L. Brewbaker. 1999. Genetics of resistance in maize to the com leaf aphid (Homoptera: Aphididae). Maize Genet. Coop, newsl. 73: 36-37.
82

Ma, R., J. C. Reese, W. C. Black IV and P. J. Bramel-Cox. 1990. Detection o f pectin esterase and polygalacturonase from salivary secretions of living greenbugs, Schizaphis graminum (Homoptera; Aphididae). Insect Physiol. 36: 507-512.
Massardo, F., G. E. Zuniga, F. J. Perez and L. J. Corcuera. 1994. Effects of hydroxamic acids on electron transport and their cellular location in cron. Phytochemistry 35: 873-876.
Mather, K. 1949. Biometrical genetics (U* Edn.) Methuen, London.
Mather, K. and J. L. Jinks. 1977. Introduction to biometrical genetics. Chapman and Hall Ltd., London.
Mayoral, A. M., W. F. Tjallingii and P. Castanery. 1996. Probing behaviour of Diuraphis noxia on five cereal species with different hydroxamic acid levels. Entomol. Exp. Appl. 78: 341-348.
McAllan, J. W. and J. B. Adams. 1961. The significance of pectinase in plant penetration by aphids. Can. J. Zool. 39: 305-310.
McColloch, J. W. 1921. The com leaf aphid {Aphis maidis Fitch) in Kansas. J. Econ. Entomol. 14; 89-94.
Ming, R. G. 1995. Restriction fragment length polymorphism analysis of host-plant resistance to four maize pathogens. Ph.D. thesis. University of Hawaii.
Molyneux, R. J., B. C. Campbell and D. L. Dreyer. 1990. Honeydew analysis fordetecting phloem transport of plant natural products. J. Chem. Ecol. 16(6): 1899- 1909.
Moon, H. G. 1995. Quantitative genetic analysis o f recombinant inbred lines (RILs) from tropical maize singlecrosses. Ph.D. thesis. University o f Hawaii.
Narang, S., J. S. Rana and S. Madan. 1997. Morphological and biochemical basis of resistance in barley against com leaf aphid, Rhopalosiphum maidis (Fitch.). Tropical Agricultural Research 9; 340-345.
Nourse, S. M. 2000. Molecular marker analysis of quantitative genetic traits in maize. Ph.D. thesis. University o f Hawaii.
Painter, R. H. 1968. Insect resistance in crop plants. The university press of Kansas.
Painter, R. H. and M. D. Pathak. 1962. The distinguishing features and significance of the four biotypes o f the com leaf aphid Rhopalosiphum maidis (Fitch). Proc. XI Int. Congr. Entomol. 11: 110-115.
83

Parry, W. H. 1971. Differences in the probing behaviour of Elatobium abietinum feeding on Sitka and Norway spruces. Ann. Appl. Biol. 69: 177-185.
Pavgi, M. S. and A. L. Flanges. 1959. Occurrence of southern com mst in Wisconsin. Plant Dis. Rep. 43: 1239-1240.
Raid, R. N., S. P. Pennypacker and R. E. Stevenson. 1988. Characterization of Puccinia polysora epidemics in Pennsylvania and Maryland. Phytopathology 78(5): 579- 585.
Ram, M. 1983. Inheritance of com leaf aphid resistance in hull-less barley. SAB RAO Journal 15(1): 1-5.
Reese, J. C., J. R. Schwenke, P. S. Lamont and D. D. Zehr. 1994. Importance andquantification of plant tolerance in crop pest management programs for aphids: greenbug resistance in sorghum. J. Agric. Entomol. 11(3): 255-270.
Rhind, D., J. M. Waterston and F. C. Deighton. 1952. Occurrence of Puccinia polysora Underw. in West Africa. Nature 169: 631.
Richardson, M. D., D. E. Karcher and L. C. Purcell. 2001. Quantifying turfgrass cover using digital image analysis. Crop Science 41(6): 1884-1888.
Robert A. L. 1962. Host ranges and races of the com rusts. Phytopathology 52: 1010- 1015.
Robinson, R. A. 1996. Maize in tropical Africa. In Return to resistance: Breeding crops to reduce pesticide dependence. agAccess, Davis, CA, pp. 173-199.
Rodriguez-Ardon, R., G. E. Scott and S. B. King. 1980. Maize yield losses caused by southern com mst. Crop Science 20: 812-814.
Rowe, K. E. and W. E. Alexander. 1980. Computations for estimating the genetic parameters in joint-scaling tests. Crop Science 20: 109-110.
Ryland, A. K. and H. H. Storey. 1955. Physiological races of Puccinia polysora Underw. Nature (London) 176: 655-656.
Scott, G. E., S. B. King and J. W. Armour, Jr. 1984. Inheritance of resistance to southern com rust in maize populations. Crop Science 24: 265-267.
Shurtleff, M. C. 1980. Compendium of com diseases (2nd Ed.). The American Phytopathological Society, St. Paul, Minnesota.
84

Singh, R. K. and B. D. Chaudhary. 1977. Biometrical methods in quantitative genetic analysis. New Delhi.
Smith, C. M. 1997. An overview of the mechanisms and bases of insect resistance inmaize. In Proc. o f an international symposium held at CIMMYT 27 Nov.-3 Dec., 1994. pp. 1-12.
Sorin, M. 1966. Physiological and morphological studies on the suction mechanism of plant juice by aphids. Bull. Univ. Osaka Prefect. Ser. B Agric. Biol. 18: 95-137.
Staniland, L. A. 1924. The immunity of apple stocks from attacks o f the woolly aphids (Eriosoma lanigerum Hausmann). Part 11. The causes of the relative resistance of the stocks. Bull. Entomol. Res. 15: 157-170.
Steiner, W., D. J. Voegtlin and M. E. Irwin. 1985. Genetic differentiation and its bearing on migration in North American populations of the com leaf aphid, Rhopalosiphum maidis (Fitch) (Homoptera: Aphididae). Aim. Entomol. Soc. Am. 78: 518-525.
Stoetzel, M. B. and G. L. Miller. 2001. Aerial feeding aphids of com in the United States with reference to the root-feeding Aphis maidiradicis (Homoptera: Aphididae). Florida Entomologist 84(1): 83-98.
Thackray, D. J., S. D. Wratten, P. J. Edwards and H. M. Niemeyer. 1990. Resistance to the aphids Sitobion avenae and Rhopalosiphum padi in Gramineae in relation to hydroxamic acid levels. Ann. Appl. Biol. 116: 573-582.
Tipton, C. L., J. A. Klun, R. R. Husted and M. D. Pierson. 1967. Cyclic hydroxamic acids and related compounds from maize. Isolation and characterization. Biochemistry 6: 2866-2870.
Triplehom, C. A. 1959. The possible effect of weather on incidence of com leaf aphid infestation and damage. Proc. North Central Branch, Entomol. Soc. Am. 14: 28.
Ullstmp, A. J. 1965. Inheritance and linkage of a gene determining resistance in maize American race of Puccinia polysora. Phytopathology 55: 425-430.
Ullstmp, A. J. 1977. Diseases of com. In Com and com improvement (Ed. G. F. Spraque). American Society o f Agronomy, Inc., Publisher, Madison, Wisconsin.
van Emden, H. F. 1996. Studies on the relations of insect and host plant. 111. Acomparison of the reproduction of Brevicoryne brassicae and Myzus persicae (Hemiptera: Aphididae) on Bmssels sprout plants supplied with different rates of nitrogen and potassium. Entomologia Experimentalis et Applicata 9: 444-460.
85

Wahlroos, V. and A. I. Virtanen. 1959. The precursors of 6- MBOA in maize and wheat plants, their isolations and some of their properties. Acta Chem. Scan. 13: 1906- 1908.
Wilde, G. and H. Feese. 1973. A new com leaf aphid biotype and its effect on some cereal and small grains. J. Econ. Entomol. 66(2): 570-571.
Wildermuth, V. L. and E. V. Walter. 1932. Biology and control o f the com leaf aphid with special reference to the Southwestern States. USDA Tech. Bull. 306: 1-21.
Zera, A. J. and R. F. Denno. 1997. Physiology and ecology of dispersal polymorphism in insects. Annual Review o f Entomology 42: 207-231.
Zummo, N. 1988. Components contrihuting to partial resistance in maize to Puccinia polysora. Plant Disease 72: 157-160.
86