Corn Ethanol Viability: An Analysis of Corn Ethanol as...
47
1 Corn Ethanol Viability: An Analysis of Corn Ethanol as an Alternative to Petroleum Based Fuel in the United States Energy And Energy Policy Professor Tolley Professor Berry December 10, 2012 Group 7 Gabriel Tamez Christopher Cheng John Tabash Alexander Golovin John-Reynold Lopez JJ Luria Leonardo Copanski
-
Upload
trinhkhanh -
Category
Documents
-
view
217 -
download
0
Transcript of Corn Ethanol Viability: An Analysis of Corn Ethanol as...

1
Corn Ethanol Viability: An Analysis of Corn Ethanol as an Alternative to Petroleum
Based Fuel in the United States
Energy And Energy Policy
Professor Tolley
Professor Berry
December 10, 2012
Group 7
Gabriel Tamez
Christopher Cheng
John Tabash
Alexander Golovin
John-Reynold Lopez
JJ Luria
Leonardo Copanski

2
Table of Contents
1) Introduction
a) Milling
b) Hydrolysis
c) Fermentation
d) Distillation
2) Consequences of corn ethanol on the economy
a) Prices of agricultural products
b) Job creation
3) Prices
a) Government subsidies
b) Government tax benefits
c) Price of ethanol
d) Other factors contributing to gasoline prices
e) Effects of the 2012 drought on price of ethanol and gasoline
f) Economics efficiency of E85
g) What the future holds for ethanol prices
4) Cost- Benefit Analysis
a) Energy efficiency
i) Energy efficiency of corn ethanol
ii) A negative look at corn ethanol efficiency
iii) A more positive look at corn ethanol efficiency
iv) Energy efficiency of petroleum-based gasoline
b) Infrastructure costs of a transition to corn ethanol
i) Trucking transportation conversion costs
ii) Distribution infrastructure conversion costs
iii) Total potential E85 ethanol usage costs
c) Emissions and environmental concerns for the production process of corn ethanol

3
i) Calculation for total extra CO2 emissions in lbs. to achieve 100% E85 efficiency
in ground transportation
ii) Calculation for total cost of CO2 emissions to achieve 100% E85 efficiency in
ground transportation
iii) Environmental concerns from ethanol production process
iv) Percent increase in CO2 emissions to achieve 100% E85 efficiency in ground
transportation
d) Emissions and environmental concerns for the consumption of corn ethanol
i) Average ethanol miles per gallon
ii) CO2 emissions comparison on a per mile basis
iii) CO2 emissions comparison on a total consumption basis
iv) Total CO2 emissions on an economic cost basis
v) Consumption level pollution cost benefit analysis summary
5) Conclusion

4
1) Introduction
When it comes to ethanol, there is no disagreement about its potential and viability
as an alternate fuel source for the future. Due to heightened concern and fears of an
American nation dependent upon foreign oil, our government has been promoting ethanol
for decades now as an alternative to gasoline. However, is ethanol truly the grand solution
to the problem? Ethanol is a form of alcohol, derived from the fermentation of glucose,
which can be used as a combustible fuel source for cars. Although ethanol can be produced
from a number of sources, the primary fountain for ethanol production in the United States
is the corn crop. Dating back to 1908, with the first Model-T car, developed by Henry Ford,
we can see early attempts of ethanol as a fuel source. In fact, the engine of the Model-T was
originally developed and designed to be capable to run on gasoline, kerosene, and ethanol.1
However, ethanol production never reached fruition as gasoline prices declined and the era
of prohibition retarded the production of ethanol.2 As a fuel source, ethanol has come a
long way since then. In the current state of alternative fuels, ethanol is one of the front-
runners, as it has begun to be integrated into the fuel infrastructure of the United States.
Specifically, car engines are being developed more widely to be “flex fuel engines,” which
are able to use a gasoline-ethanol mixture as fuel. In this paper, we will make a cost benefit
analysis on the feasibility of shifting our primary fuel source for ground transportation to
e85 using corn ethanol, e85 being a blend of 85% ethanol and 15% gasoline.
There are numerous advantages of ethanol fuel. It can be produced on a large-scale
basis domestically, thus reducing use of imported petroleum, and it requires relatively few
technological breakthroughs.3 However, using a food crop as the primary resource in fuel
production comes with certain notable drawbacks. Specifically, the negative impact on food
prices, the poorer fuel efficiency compared to gasoline, and the environmental impact of
ethanol pollution. The debate rests on the argument of whether or not the advantages
outweigh the disadvantages and costs of converting to e85 for ground transportation 1 Ethanol Fuel History, http://www.fuel-testers.com/ethanol_fuel_history.html, (December 9th 2012)
2 Ethanol Fuel History, http://www.fuel-testers.com/ethanol_fuel_history.html, (December 9th 2012)
3 Ethanol Fuel History, http://www.fuel-testers.com/ethanol_fuel_history.html, (December 9th 2012)

5
purposes. But first, it is important to gain a clear understanding of the production cycle and
chemical process in creating ethanol to further support our argument.
Ethanol is created through two distinct yet similar processes: dry milling and wet
milling. Although ethanol can be derived from several different sources, corn is the primary
source due to its abundance in the United States. The majority of US ethanol is produced
through dry milling, as it has a higher efficiency and lower capital and operating costs than
wet milling, specifically when producing ethanol.4 As a result, dry milling is by far the most
popular method, and it will be the method focused on during this paper. The process of
producing ethanol from corn on a small scale is fairly simple, but in order to produce on a
large-scale basis, there must be a rigid step-by-step system in place.
a) Milling
To obtain the end product of ethanol from corn, a series of steps must be taken to
convert the starch present in the corn kernel into the simple sugar glucose. More
specifically, the corn kernel must first be broken down to allow for the conversion of starch
into glucose. Starch is found in nature as “insoluble, non-dispersant granules resistant to
enzymatic breakdown.”5 The starch is protected within the biological makeup of a corn
kernel; it is difficult to break down due to its protective barrier. (See diagram below).
4 Cole Gustafson, Ethanol Production – Dry versus Wet Grind Processing,
http://www.ag.ndsu.edu/energy/biofuels/energy-briefs/ethanol-production-dry-versus-wet-grind-
processing, (December 9th 2012)
5 Gerald B. Borglum, Starch Hydrolysis for Ethanol Production,
http://web.anl.gov/PCS/acsfuel/preprint%20archive/Files/25_4_SAN%20FRANCISCO_08-80_0264.pdf,
(December 9th 2012)

6
6
Therefore, the starch must first be separated from its counterparts in order to expose it to
enzymatic breakdown. This presents the initial step in the production cycle: “milling.”
Once the corn kernels have reached the factory, are offloaded from the trucks, and
have gone through the necessary inspection procedures, they travel through grain lines to
the “hammer mills.” As the name suggests, the hammer mills grind down the corn kernels
into a fine powder referred to as “corn flour.” Within the mill, the kernels are struck by
several hammers attached to a shaft which rotates at high speeds, and, as a result, are
crushed by the repeated impact.7 A various alignment of screens allows the separation of
the finished corn flour from the oversized materials which repeat another cycle in the mill.8
This step is a crucial because it exposes the starch from its protective barrier. Now,
enzymes are able to attack the starch and break it down further and into the eventual end
product of glucose.
b) Hydrolysis
From the hammer mills, the corn flour is transported via conveyer belts to the “cook
area,” where the corn flour is soaked in a mixture of water and enzymes to break down the
6 The Corn Kernel ,http://t1.gstatic.com/images?q=tbn:ANd9GcQesmiObsFga8wl-
g27e_n6PR71GMxYOEdYDbJtmv0EMwhuPd49FLC0D4YpGw, (December 9th 2012)
7 How Does a Hammer Mill Work?, http://www.hammermills.com/how-does-a-hammer-mill-work,
(December 9th 2012)
8 How Does a Hammer Mill Work?, http://www.hammermills.com/how-does-a-hammer-mill-work,
(December 9th 2012)

7
starch into sugar (this is the same process used to ferment alcohol). Starch is insoluble at
room temperature; therefore, the water is briefly heated in order to weaken the hydrogen
bonds of the starch9. When the hydrogen bonds are broken, water is absorbed and the
starch molecules swell in a process known as gelatinization.10 The starch is now a gel-like
substance which is vulnerable to enzymatic breakdown. With the addition of water,
however, another problem arises which must be addressed: the increased viscosity of the
substance. The gel-like mash is difficult to work with and process; therefore, the enzyme
“alpha amylase” must be added. This enzyme is essential in the production of ethanol
because it works against the viscosity by breaking down the long starch molecules into
smaller chains. In order to attain the energy from starch molecules, the glucose polymers
must first be broken down into smaller sugars, which can then convert to glucose. Alpha
amylase breaks down long starch molecules into smaller and shorter polymers, known as
dextrins. The breakdown of starch molecules into dextrins reduces the viscosity of the
substance. This is referred to as “liquefacting” the solution. 11
Following liquefaction, the corn mash undergoes temperature changes once more
and an additional enzyme must be included. The temperature is cooled to 30 degrees
Celsius and the enzyme, glucoamylase, is added to the equation. This enzyme is necessary
in order to complete the breakdown of dextrins into the fermentable sugar glucose.
Glucoamylase hydrolyzes both alpha-1,4 and alpha-1,6 bonds to “completely degrade the
9 Alcohol Production by Yeasts, http://dwb4.unl.edu/Chem/CHEM869P/CHEM869PLinks/www-
dept.usm.edu/~bsclabs/380/yeasts.htm, (December 9th 2012)
10 Gerald B. Borglum, Starch Hydrolysis for Ethanol Production,
http://web.anl.gov/PCS/acsfuel/preprint%20archive/Files/25_4_SAN%20FRANCISCO_08-80_0264.pdf,
(December 9th 2012)
11 Gerald B. Borglum, Starch Hydrolysis for Ethanol Production,
http://web.anl.gov/PCS/acsfuel/preprint%20archive/Files/25_4_SAN%20FRANCISCO_08-80_0264.pdf,
(December 9th 2012)

8
dextrins to glucose.”12 The hydrolyzation of dextrins to glucose with glucoamylase is a
process known as “saacharification.”
c) Fermentation
Once the starch has been broken down by alpha amylase and glucoamylase
enzymes, it is transported to a fermentation tank where yeast is added. Starch, through the
addition of water and enzymes, has been successfully reduced to the fermentable simple
sugar glucose. In order to tap into the energy of glucose, it must undergo a fermentation
process which results in the end products of ethanol and carbon dioxide. Fermentation,
simply put, is the process in which yeast “converts glucose to ethyl alcohol and carbon
dioxide.”13 When glucose comes into contact with the yeast, it enters the yeast and is
broken down through a process called glycolysis.14 This is the initial step in converting
sugar to ethanol and is the method humans use to produce energy anaerobically. The
process of glycolysis requires a minimal input of energy, but results in a positive net gain.
The end product of glycolysis is the creation of two 3-carbon pyruvate molecules from one
6-carbon glucose. The yeast then converts the two pyruvate molecules into ethanol and
carbon dioxide.15
12 Gerald B. Borglum, Starch Hydrolysis for Ethanol Production,
http://web.anl.gov/PCS/acsfuel/preprint%20archive/Files/25_4_SAN%20FRANCISCO_08-80_0264.pdf,
(December 9th 2012)
13 Making Ethanol, http://e85.whipnet.net/ethanol.faq/make.ethanol.html, (December 9th 2012)
14 Gerald B. Borglum, Starch Hydrolysis for Ethanol Production,
http://web.anl.gov/PCS/acsfuel/preprint%20archive/Files/25_4_SAN%20FRANCISCO_08-80_0264.pdf,
(December 9th 2012)
15 Making Ethanol, http://e85.whipnet.net/ethanol.faq/make.ethanol.html, (December 9th 2012)

9
16
The yeast converts the 3-carbon pyruvate chains into ethanol by removing a carbon
dioxide molecule from the pyruvate using the enzyme pyruvate decarboxylase, creating
acetaldehyde, and then converting the acetaldehyde into ethanol using the enzyme alcohol
dehydrogenase.17 The diagram above briefly illustrates the chemical conversion of glucose
to ethanol.
d) Distillation
Following the fermentation process, the substance which remains is coined “beer”
and is ready to move to the final step, distillation. Distillation is the process of separating
mixtures of liquids by utilizing the difference in boiling points of each liquid. There is a
“higher” and “lower” liquid, and by heating the mixture to a certain temperature, the lower
liquid evaporates first, therefore separating itself from the higher.
In the particular situation at hand, the “beer” moves through three columns which
separate and purify the ethanol. The first column the beer passes through is called the
“beer column.”18 The beer moves through a series of metal plates, and while under higher
heat, emits a water and alcohol vapor. The water and alcohol vapors, now separated from
the solids, rise and move through two additional columns to further purify the vapor. The
16 Alcohol Production by Yeasts, http://dwb4.unl.edu/Chem/CHEM869P/CHEM869PLinks/www-
dept.usm.edu/~bsclabs/380/yeasts.htm, (December 9th 2012)
17 Gerald B. Borglum, Starch Hydrolysis for Ethanol Production,
http://web.anl.gov/PCS/acsfuel/preprint%20archive/Files/25_4_SAN%20FRANCISCO_08-80_0264.pdf,
(December 9th 2012)
18 The Dry Mill Ethanol Process, http://www.ethanol.org/index.php?id=73, (December 9th 2012)

10
final step moves the ethanol and water vapors to a molecular sieve in which the vapors are
separated from one another.19 The sieve contains thousands of small clay pellets; these
pellets absorb the water vapors, thus isolating the ethanol vapor.20 The final product being
200 proof alcohol and yielding a total return on energy of 3.65:1.
2) Consequences of Corn Ethanol on the Economy
Despite the possible gains on energy return and ecological impact, including the
reduction of greenhouse gasses, other factors need to be looked at as well, chiefly the
ancillary effects of job growth and food production and scarcity. During the 2005 Energy
Policy Act ethanol was established as a fuel additive which replaced the oxygenate
requirement with the Renewable Fuel Standard (RFS) which was developed to increase the
volume of renewable fuel that is blended into transportation fuels21. The mandates and
incentives of the Energy Policy Act of 2005 accelerated ethanol production at an alarming
rate. Under the renewable fuels standard, gasoline was mandated to contain 7.5 billion
gallons of renewable fuel annually by 2012, with almost all of this being met with ethanol22.
Such a rapid growth in the ethanol industry causes a substantial diversion of grain out of
the food system. Given the fact that almost 40 percent of America’s corn production goes
toward the creation of ethanol it is important to consider the potential impact ethanol has
had on the prices of corn23.
a) Prices of agricultural products
Just like corn is used in the production of ethanol, it is also used in the production of
various types of food such as bread, juice, yogurt, cereal, meat and many more. According
to Corn Refiners Association, more than 4,000 food items in a typical grocery store contain
19 The Dry Mill Ethanol Process, http://www.ethanol.org/index.php?id=73, (December 9th 2012)
20 The Dry Mill Ethanol Process, http://www.ethanol.org/index.php?id=73, (December 9th 2012)
21 Cushman, John. "In Drought, a Debate Over Quota for Ethanol." Nytimes.com. New York Times, 16th Aug. 2012. Web. 22 Oct. 2012 22 "Corn Has Deep Economic Roots as High Prices Create Ripple Effect - USATODAY.com." Corn Has Deep Economic Roots as High Prices Create Ripple Effect. Usatoday.com, 24 Jan. 2007. Web. 08 Nov. 2012. 23 "Corn as Food." SDCorn.org. N.p., 2012. Web. 08 Dec. 2012.

11
corn products24. This begs the question; does the use of corn ethanol affect food prices? If
so, to which degree does the use of corn ethanol affect food prices? Unfortunately, this issue
has been lingering in the minds of both of opponents and supporters of ethanol for the past
decade without a clear answer. Opponents of ethanol often argue that the existence of corn
ethanol increases the price of corn which results in the direct rise of food prices since corn
is an important food ingredient for many different types of foods. In addition, it is the main
product used for livestock feed. On the other hand, ethanol supporters argue that an
increase in corn prices have a very small impact on food prices because the value of corn
makes up such a small share of the final consumer food dollar.
It is clear that there is a relationship between ethanol production and corn prices.
The real question is to what degree the production of ethanol affects corn prices. There is a
direct link between higher corn prices and food costs because higher corn prices translate
directly into livestock feed costs, which eventually translate into higher prices for meat,
eggs, and dairy products25. However, the extent to which higher corn prices are caused by
ethanol production is difficult to calculate considering that it’s nearly impossible to know
how much corn products are in all the foods we eat today. The demand for ethanol,
particularly within the past decade, has always fluctuated due to things such new blending
mandates and constantly changing oil prices. Additionally, the price of corn is not only
dependent on ethanol. One major factor that has a large impact on the price of corn is the
supply and demand for livestock feed within the United States and abroad. The livestock
feed demand usually depends on the population and incomes levels since it sets how much
people can spend on food during a certain time of the year. On the other hand, livestock
feed supply is heavily dependent on the weather and the quality of the soil26. Additionally,
24 Carter, Colin, Gordon Rausser, and Aaron Smith. "The Effect of the U.S. Ethanol Mandate on Corn Prices."
Egecon.com. Colin Carter, 22 July 2007. Web
25 McDonald, Kay, and The Opinions Expressed in This Commentary Are Solely Those of Kay McDonald. "Paying More for Food? Blame the Ethanol Mandate." CNN. Cable News Network, 20 Aug. 2012. Web. 20 Nov. 2012. 26 Weiss, Elizebeth. "USA TODAY." USATODAY.COM. Elizebeth Weiss, 14 Feb. 2011. Web. 27 Nov. 2012.

12
ethanol is impacted by the price of gas since more than 70 percent of ethanol is used
toward transportation27.
b) Job creation
The United States currently produces 700 billion lbs. of corn, which takes up a total
of 32,900,000 hectares of land, or approximately 2 states the size of Illinois. Based on our
analysis, it would take about 4.9 trillion lbs. of corn to produce enough corn to convert all
the gasoline in the United States to e85 which takes up 188,700,000 hectares of land, or
approximately ten more states the size of Illinois. From this we can see that it would be
economically and geographically inefficient to convert gasoline into e85. However, this is
not to say that the current amount of ethanol that is used is not efficient28. Ethanol
production directly benefits U.S. agriculture and leads rural economic development.
Because ethanol is primarily made up of corn, ethanol greatly increases demand for corn
which in turn increases the amount of money farmers receive for corn. Rural areas that
have an opportunity to develop ethanol see large financial gains. Over the past decade,
farmer-owned and locally-owned ethanol plants have driven the dramatic growth in the
U.S. ethanol industry. Although many different private companies are currently producing
ethanol, at least 22 percent of the industry is still owned by local owners and farmers29.
The ethanol industry within the United States has increased demand for corn and has
played a significant role in raising the prices of corn from historically low prices. The first
result of this is that it has allowed farmers to earn a higher income since corn is the most
heavily grown crop. Independent studies that have analyzed the prices of corn around
areas with an ethanol plant has shown that the local price of corn increases by at least 5-10
per bushel in the area around an ethanol plant, evidence of ethanol significantly adding to
the farmer’s income within that area30. However, not everyone benefits from the price
27 "American Coalition for Ethanol : Home." American Coalition for Ethanol : Home. N.p., 2012. Web. 03 Dec. 2012. 28 Neimeyer, Garry, and Rick Tolman. "2012 World of Corn." Ncga.com. N.p., 2012. Web. 15 Nov. 2012.
29 "Bankers: Ethanol at Heart of Corn, Farm Pricing Structure." Chicago Tribune. N.p., 05 Sept. 2012. Web. 03 Dec. 2012 30 Plumer, Brad. "Study: U.S. Could Put a Big Dent in Food Prices by Relaxing Ethanol Rules." Washingtonpost.com. Washingtonpost.com, 21 Aug. 2012. Web. 02 Dec. 2012.

13
increase of corn. Given the fact that livestock producers use corn as their main feed source
and increase in the price of corn has negative impacts. Producers are already reducing
some feeding as evidenced by lower reported weights for hogs and chickens being sold in
current market.
The creation of ethanol plants has had a very positive impact on the economy in
terms of job production. In 2011, the production of nearly 14 billion gallons of ethanol
helped support more than 401,000 jobs in all sectors of the economy31. It is important to
note that the production of ethanol is not a labor-intensive industry considering the fact
that there only 12,500 full time ethanol manufacturing. The majority of the jobs come from
agriculture, research and development. The reason why the majority of the jobs come from
these fields is because the production of ethanol is more capital than labor intensive, the
number of direct jobs supported by the ethanol industry is relatively small and is
concentrated primarily in manufacturing and agriculture. The majority of the agricultural
jobs supported by the ethanol industry are farm workers and laborers associated with
grain production. However, a wide range of jobs in support activities related to crop
production ranging from farm managers and bookkeepers to farm equipment operators
are supported by ethanol production. As the impact of the direct spending by the ethanol
industry expands throughout the economy, the employment impact expands significantly
and is spread over a large number of sectors.
3) Government Intervention and Prices Concerning Ethanol
i) Government subsidies
Subsidies directly impact the feasibility of ethanol and as such they need to be
examined. Currently Corn farmers in the United States have been benefiting from annual
federal subsidies of around $6 billion in the past few years, all due to the ethanol being
used as an additive for the nation's vehicles. That ended January 1st of this year, however,
31 Urbanchuk, John. "Contribution of the Ethanol Industry." Cardnoentrix.com. Renewable Fuel Association,
Feb. 2011. Web. 22 Nov. 2012.
14
when the companies making ethanol lost a tax credit of 46 cents per gallon.32 This was
particularly due to high oil prices, which makes ethanol a very competitive commodity. An
outcome the industry does not want to see is an end to a separate tax credit for ethanol
made not from corn but non-foodstuffs such as switchgrass, wood chips, and even the
leaves and stalks of corn.33 This is known as cellulosic ethanol, but no one is selling it just
yet because of its higher research and development demands as well as production costs.
ii) Government tax benefits
To elaborate further on the government tax benefits towards ethanol, from the
1980s to 2011, domestic ethanol producers were protected by a 54-cent per gallon
import tariff as well, mainly intended to curb the Brazilian sugarcane importation of
ethanol.34 Starting in 2004, transportation fuel blenders received a tax credit for each
gallon of ethanol they mix with gasoline.35 Originally, the tariff was intended to offset the
federal tax credit that applied to ethanol without regard to country of origin.36 Several
countries in the Caribbean Basin imported and reprocessed Brazilian ethanol, typically
converting hydrated ethanol into anhydrous ethanol for re-exportation into the United
States. They bypassed the 2.5% duty and tariff, mainly due to the Caribbean Basin Initiative
(CBI) and free trade agreements. This process was limited to 7% of U.S. ethanol
consumption.37
32 Llanos, Miguel. "$6 Billion-a-year Ethanol Subsidy Dies -- but Wait There's More." NBC News. N.p., 29 Dec.
2011. Web. 3 Dec. 2012.
33 Llanos, Miguel. "$6 Billion-a-year Ethanol Subsidy Dies -- but Wait There's More." NBC News. N.p., 29 Dec.
2011. Web. 3 Dec. 2012.
34 "Ethanol Subsidies: Fiscal Sobriety." The Economics. N.p., 23 June 2011. Web. 3 Dec. 2012.
35 Krauss, Clifford. "Ethanol Industry Is Unruffled by Senate Vote Against Tax Breaks."The New York Times.
N.p., 17 Jan. 2011. Web. 3 Dec. 2012.
36 Rohter, Larry. "With Big Boost From Sugar Cane, Brazil Is Satisfying Its Fuel Needs."The New York Times.
The New York Times, 10 Apr. 2006. Web. 06 Dec. 2012
37 Austin, Anna. "Brazil Launches Campaign to Remove Ethanol Tariff." Ethanol Producer Magazine. N.p., 04
Aug. 2008. Web. 5 Dec. 2012.

15
As previously mentioned, blenders received a 46-cent per gallon tax credit as of
2011 regardless of feedstock; in addition, small producers received an additional 10-cents
on the first 15 million U.S. gallons while producers of cellulosic ethanol received credits up
to $1.01. Tax credits to promote the production and consumption of biofuels date back to
the 1970s.38 A study in 2010 conducted by the Congressional Budget Office (CBO) found
that in fiscal year 2009, biofuel tax credits reduced federal revenues by around $6 billion,
of which corn and cellulosic ethanol accounted for $5.16 billion and $50 million,
respectively. Another study in the same year conducted by the Environmental Working
Group estimated that the total ethanol subsidies between 2005 and 2009 were $17 billion.
The same study estimated the future cost to taxpayers at $53.59 billion if these tax credits
were extended until 2015, yielding 15 billion US gallons.39
Also in 2010, CBO estimated that the strain on taxpayers to reduce gasoline
consumption by one gallon was $1.78 for corn ethanol and $3.00 for cellulosic ethanol. The
costs to taxpayers of lowering greenhouse gas emissions through the tax credits were
roughly $750 per metric ton of CO2, equivalent for ethanol and around $275 per metric ton
for cellulosic ethanol.40 On June 16, 2011, the U.S. Congress approved an amendment to an
economic development bill to repeal both the tax credit and the tariff, but it did not move
forward.41 Nonetheless, the U.S. Congress did not extend the tariff and the tax credit,
allowing both to end on December 31, 2011. Since 1980 the ethanol industry was awarded
an estimated $45 billion in subsidies. 42
38 Elmendorf, Douglas W. "Using Biofuel Tax Credits to Achieve Energy and Environmental Policy Goals."
Congressional Budget Office, July 2010. Web. 6 Dec. 2012.
39 Cox, Craig, and Hug, Andrew. "Driving Under The Influence: Corn Ethanol & Energy Security".
Environmental Working Group. June 2010. Web 27July 2010.
40 Elmendorf, Douglas W. "Using Biofuel Tax Credits to Achieve Energy and Environmental Policy Goals."
Congressional Budget Office, July 2010. Web. 6 Dec. 2012.
41 Krauss, Clifford. "Ethanol Industry Is Unruffled by Senate Vote Against Tax Breaks."The New York Times.
N.p., 17 Jan. 2011. Web. 3 Dec. 2012.
42 Pear, Robert. "After Three Decades, Tax Credit for Ethanol Expires." The New York Times. N.p., 1 Jan. 2012.
Web. 6 Dec. 2012.

16
iii) Price of ethanol
Since 2007 ethanol prices in the U.S. have traded in a wide and erratic price range.
The average price of gasoline was $2.97, while the average price of E85 ethanol was
$2.41.43 A good illustration of the ethanol price variance is to observe the price changes in
the state of Iowa in 2008. The ethanol price high was $2.82 per gallon, which occurred in
early July 2008, while the low of $1.40 per gallon occurred in mid-December 2008.44 The
prices of ethanol in Iowa declined approximately 51% during this 6-month span. Since the
market low in late 2008, Iowa ethanol prices have been trending slightly higher through
early June 2009, closing at $1.69 per gallon on June 5, 2009,45 with the U.S. following suit.
Given the relative strength of corn prices during this period, low ethanol prices have
severely narrowed if not completely eliminated the profitability of operating ethanol plants
in some areas of Iowa, Kansas, and various other locations in the Midwestern United
States.46 Other regulatory and environmentally oriented mandates by the U.S. Federal
government have a smaller, yet pronounced impact on the market supply-demand and
prices of ethanol.
President Bush and other politicians have pushed for ethanol as a possible long-
term solution for the American addiction to fossil fuels, mainly with the intention of
substituting high-priced gasoline.47 At this moment, however, it is actually pushing gas
prices higher because the U.S. demand for ethanol (as an additive to gasoline at the pump)
has caused its price to soar about 65 percent since early May to around $4.50 a gallon in
43 E85 Prices. Web. 6 Dec. 2012. <http://e85prices.com/>.
44 O’Brien, Daniel, and Mike Woolverton. "The Relationship of Ethanol, Gasoline and Oil Prices." AGManager.
N.p., n.d. Web. 6 Dec. 2012.
45 O’Brien, Daniel, and Mike Woolverton. "The Relationship of Ethanol, Gasoline and Oil Prices." AGManager.
N.p., n.d. Web. 6 Dec. 2012.
46 O’Brien, Daniel, and Mike Woolverton. "The Relationship of Ethanol, Gasoline and Oil Prices." AGManager.
N.p., n.d. Web. 6 Dec. 2012.
47 McKay, Peter A. "Ethanol Pushes Gas Prices Higher: Demand for Ethanol Aggravates Pain at the
Pump." Energy Refuge. N.p., 2009. Web. 6 Dec. 2012.
17
U.S. spot markets, according to the Oil Price Information Service.48 That makes it far more
expensive than pure gasoline, which costs about $2.90 a gallon at the pump on average,
according to the AAA driving club. Amazingly, this price is higher than the retail price of
gas, which includes taxes, transportation costs, additives, etc.49
Currently, at gas stations across the U.S., the gasoline that drivers use to fuel their
cars is up to 15 percent ethanol. The source of this can be seen easily enough: If you mix
something into a product that is more expensive than the product itself, as a result, the
overall price of the product will rise as well.
iv) Other factors contributing to gasoline prices
Other factors are that are contributing to high pump prices are hefty crude oil prices
and a tight global refining capacity. The ethanol squeeze has gradually become yet another
catalyst in gasoline's recent climb, becoming counterproductive to many consumers'
perception of ethanol as a source of relief.50 Many people think of ethanol and gasoline as
competitors, or substitutes when they are actually complements of each other. Ethanol is
used as an additive to gasoline, so when the price ethanol increases, the price of gasoline
moves in tandem. Despite widespread anxiety about gas prices, fuel additives such as
ethanol are not essential, still they are an important part of the process of refining crude oil
into gasoline.
v) Effects of the 2012 drought on price of ethanol and gasoline
This past year the United States has experienced a drought that had a significant
impact on the price of ethanol and consequently gasoline. The everyday citizen filling up at 48 McKay, Peter A. "Ethanol Pushes Gas Prices Higher: Demand for Ethanol Aggravates Pain at the
Pump." Energy Refuge. N.p., 2009. Web. 6 Dec. 2012.
49 McKay, Peter A. "Ethanol Pushes Gas Prices Higher: Demand for Ethanol Aggravates Pain at the
Pump." Energy Refuge. N.p., 2009. Web. 6 Dec. 2012.
50 McKay, Peter A. "Ethanol Pushes Gas Prices Higher: Demand for Ethanol Aggravates Pain at the
Pump." Energy Refuge. N.p., 2009. Web. 6 Dec. 2012.

18
the gas pump has seen the effects of falling corn production first-hand, which has also
negatively impacted the U.S. economy. Prices for ethanol in the U.S., largely derived from
corn and accounting for some 10% of volume of gasoline consumed by U.S. drivers, have
jumped by nearly one-third to $2.60 per gallon since May of this year due to uncertainties
relating to hot, dry weather that has baked most of the country since June.51 Nearly all of
the ethanol consumed in the U.S. comes from corn, of which the production will fall to the
lowest level in nearly two decades due to this drought, as circulated by the U.S. Department
of Agriculture.
vi) Economic efficiency of E85
For the overall economy, the increases in prices of ethanol and gasoline come at a
bad time for a nation tunneling its way out of an economic slump. The average American
household spends roughly 4% of its income on gasoline and fuel, according to federal
Bureau of Economic Analysis.52 Whenever the prices increases, over time it will add up
until the few extra cents spent on gasoline is money not spent in the wider economy, said
Richard Hastings, macroeconomic analyst at Global Hunter Securities.53
A hot topic of debated is whether or not switching from the current blend of
gasoline to one of which is composed of 85% ethanol would be economically efficient. E85
ethanol contains a higher ethanol concentration than current blends such as E10 and E15,
mixing 85 percent ethanol with 15 percent regular gasoline. As of October 2012, regular
gasoline averaged $3.80 per gallon across the U.S. whereas E85 was cheaper at $3.39 per
gallon at the time.54 This means that E85 was roughly the same price that gasoline was one
51 LEFEBVRE, Ben. "Midwest Drought Hits Gas Pump." The Wall Street Journal. The Wall Street Journal, 10
Aug. 2012. Web. 7 Dec. 2012.
52 LEFEBVRE, Ben. "Midwest Drought Hits Gas Pump." The Wall Street Journal. The Wall Street Journal, 10
Aug. 2012. Web. 7 Dec. 2012.
53 LEFEBVRE, Ben. "Midwest Drought Hits Gas Pump." The Wall Street Journal. The Wall Street Journal, 10
Aug. 2012. Web. 7 Dec. 2012.
54 Ingram, Anthony. "Is E85 Ethanol The Solution To High Gas Prices?" Green Car Reports. N.p., 8 Oct. 2012.
Web. 6 Dec. 2012.

19
year before; but as E85 contains less energy than regular gasoline, which means that the
fuel efficiency is lower, making the overall advantage much smaller.
Ethanol producers, especially those in favor of the E85 system, argue that in October
the wholesale price of the fuel was about 70 cents per gallon less than standard gas, instead
of the estimated 40 cents, which presents E85 as the much more cost-effective choice.55 An
example is the Chevrolet Tahoe. It comes in a FlexFuel model, meaning that it runs on E85,
but only gets 13 miles per gallon, compared to 17 mpg its gasoline model gets, which is
23% lower mileage. At this level, E85 would have to be lower than $3 per gallon for Tahoe
drivers to see any benefit. Another factor is availability.56 There are only 3,000 listed E85
stations currently in the U.S. 57, the majority of which are in the Midwest. As a point of
contrast, there are about 168,000 gas stations in the U.S. 58 Simply put, E85 is not very
likely to be a widely-used fuel in the near future without a significant reduction in price and
increase in availability.
vii) What the Future Holds For Ethanol Prices
Looking ahead, most analysts believe ethanol prices will eventually pull back from
their current highs, but it could also take much longer before supply and demand really
stabilize, a process that will also require refiners and energy companies to invest in
facilities to produce and deliver ethanol. It is very difficult to project future prices of
gasoline and E85 due to the fact that global current events and macroeconomic supply and
demand levels, which we cannot currently account for, determine many of the influencing
factors of price. For Example, gasoline prices rely heavily on the price of crude oil, which
have been fairly high in the past year because experts believed the global oil demand was
55 Ingram, Anthony. "Is E85 Ethanol The Solution To High Gas Prices?" Green Car Reports. N.p., 8 Oct. 2012.
Web. 6 Dec. 2012.
56 Ingram, Anthony. "Is E85 Ethanol The Solution To High Gas Prices?" Green Car Reports. N.p., 8 Oct. 2012.
Web. 6 Dec. 2012.
57 E85 Prices. Web. 6 Dec. 2012. <http://e85prices.com/>.
58 "How Many Gas Stations Are There in the U.S?" FuelEconomy.gov. N.p., n.d. Web. 09 Dec. 2012.

20
going to reach a record high as the developing nations of Asia, Latin America and
the Middle East increase their need for oil to further their growing industries.59 There have
also been a few small supply interferences in South Sudan, Syria and Nigeria. In addition,
oil prices have been pushed higher by commodity traders worried that nuclear tensions
with Iran, the world’s third largest exporter of oil, could lead to more intense supply
disruptions.60
4) Cost Benefit Analysis
a) Energy efficiency
In the following section, we will take a look at the energy efficiency and energy
balance of the two aforementioned fuel sources in question in this study. In the end, we will
produce a final energy balance or net energy value figure for both corn ethanol and
gasoline.
i) Energy efficiency of corn ethanol
According to the United States Department of Energy, in order to successfully evaluate
the net energy of ethanol, four variables must be considered:
I. The amount of energy contained in the final ethanol product
II. The amount of energy directly consumed to make the ethanol product (such as the
diesel used in tractors, refinery energy sources etc.)
III. The quality of the resulting ethanol compared to the quality of refined gasoline
IV. The energy indirectly consumed (in order to make the ethanol processing plant,
etc.)
59 Fahey, Jonathan. "What -and Who - Make Gasoline Prices Rise." USATODAY.COM. Associated Press, 23 Mar.
2012. Web. 07 Dec. 2012.
60 Fahey, Jonathan. "What -and Who - Make Gasoline Prices Rise." USATODAY.COM. Associated Press, 23 Mar.
2012. Web. 07 Dec. 2012.
21
Much of the current discussion regarding ethanol revolves around system borders.
This refers to how complete of a picture is drawn when evaluating energy inputs. For
example, there is academic debate on whether to include items like the energy required to
feed the people processing the corn, to maintain the equipment, or even the amount of
energy a tractor represents. Also, there is no consensus as to what energy value to give the
rest of the corn (that which is not used for ethanol refining, i.e.: the stalk), commonly
known as the co-product. Depending on the ethanol study in question, these issues result in
a net energy return variation of 0.7-1.5 units of ethanol per unit of fossil fuel energy
consumed.
ii) A negative look at corn ethanol efficiency
Opponents of corn ethanol often point to the 2005-research paper of David
Pimentel, a retired Entomologist, and Tadeusz Patzek, a Geological Engineer from UC
Berkeley. In their study of corn ethanol energy efficiency, they boldly concluded that corn
ethanol was not only more inefficient than petroleum-based gasoline, but that it in fact had
a negative energy balance. The following calculations and analysis refers to their findings.
The conversion of corn and other food/feed crops into ethanol by fermentation is a
well-established technology. The ethanol yield from a large production plant is about 1 liter
of ethanol from 2.69 kilograms of corn grain.
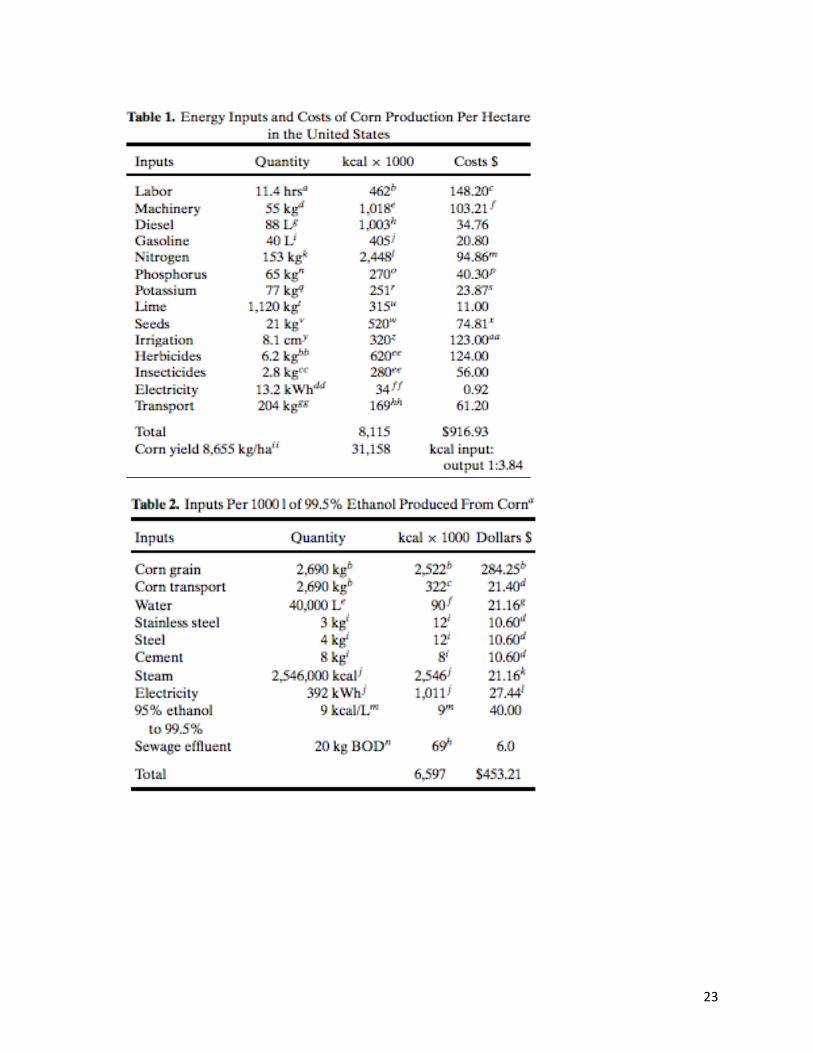
The production of corn in the United States requires a significant amount of energy
and dollar investment. To produce an average corn yield of 8,655 kg/ha of corn using
average production technology requires the expenditure of about 8.1 million kcal for the
large number of inputs listed in Table 1. This includes about 271 gallons of gasoline or
equivalents/ha. The production costs end up being about $917/ha for the 8,655 kg/ha,
which translates to about $0.11/kg of corn produced.
It should be noted that the corn feedstock alone requires about 50% of the energy
input. Also, the mean energy input associated with irrigation is 320,000 kcal per ha as seen
in Table 1.

22
The average costs in terms of energy and dollars for a large (produces around 245-
285 million liters/year), modern ethanol plan are listed in Table 2. Note that the largest
energy inputs are for the corn feedstock, the steam energy, and the electricity used in the
fermentation/distillation process. The total energy input to produce a liter of ethanol is
6,597 kcal (Table 2). However a liter of ethanol has an energy value of only 5,130 kcal.
Thus, there is an energy loss of 1,467 kcal of ethanol produced.
This results in an energy balance, or net energy value of only 0.77x.
To produce a liter of ethanol requires 29% more fossil fuel energy that is produced
by the ethanol and it ends up costing $0.42 per liter or $1.59 per gallon to produce.
Note that not included in this analysis was the distribution energy to transport the
actual physical ethanol. The DOE estimates this to cost about $0.02 per liter, or
approximately more than 331 kcal/liter of ethanol.61
61 Pimentel, Patzek. Ethanol Production Using Corn, Switchgrass, and Wood; Biodiesel Production Using
Soybean and Sunflower. Diss. Natural Resources Research, 2005. Web.
<http://www.sehn.org/tccpdf/Energy-biofuel outputs &inputs.pdf>.
23

24
iii) A more positive look at corn ethanol
Pimentel’s assessment of corn ethanol concluded that corn ethanol achieved a
negative energy balance (which is usually defined as the energy in a product minus the
energy used to produce it). However, it is possible to argue that this assessment took into
consideration variables that were present in the 70’s and 80’s, and thus failed to take into
account technological improvements over the last 20 years and their impacts on energy
requirements of corn farming and ethanol production.
Michael Wang and Dan Santini from the Argonne National Laboratory claim that
corn-based ethanol does indeed achieve positive energy benefits. The following analysis
and calculations refer to their findings.
Technological advancements have undoubtedly helped increase productivity and
product performance and reduce input energy requirements in almost every U.S. sector.
Problems with Pimentel’s 2005 assessment are found in three key areas: energy use of corn
farming, energy use of ethanol production, and failure to credit co-products from ethanol
plants.
The most controversial issue on corn ethanol efficiency analysis is how to deal with
co-products from corn plants. Ethanol is not the only product created during production.
Co-products also have energy content. Corn is typically 66% starch and the remaining 33%
is not fermented. This unfermented component must be accounted for somehow.
Dry milling ethanol plants produce distiller’s grains and soluble together with
ethanol, while wet milling plants produce corn gluten feed, corn gluten meal, corn oil, and
other high-value products together with ethanol. These products are currently sold in the
marketplace as animal feeds or for other uses.
While there are several ways of estimating energy and emission credits of co-
products, most researchers agree that the displacement method should be used to estimate
the credits. This method assigns a co-product credit based on the input energy
25
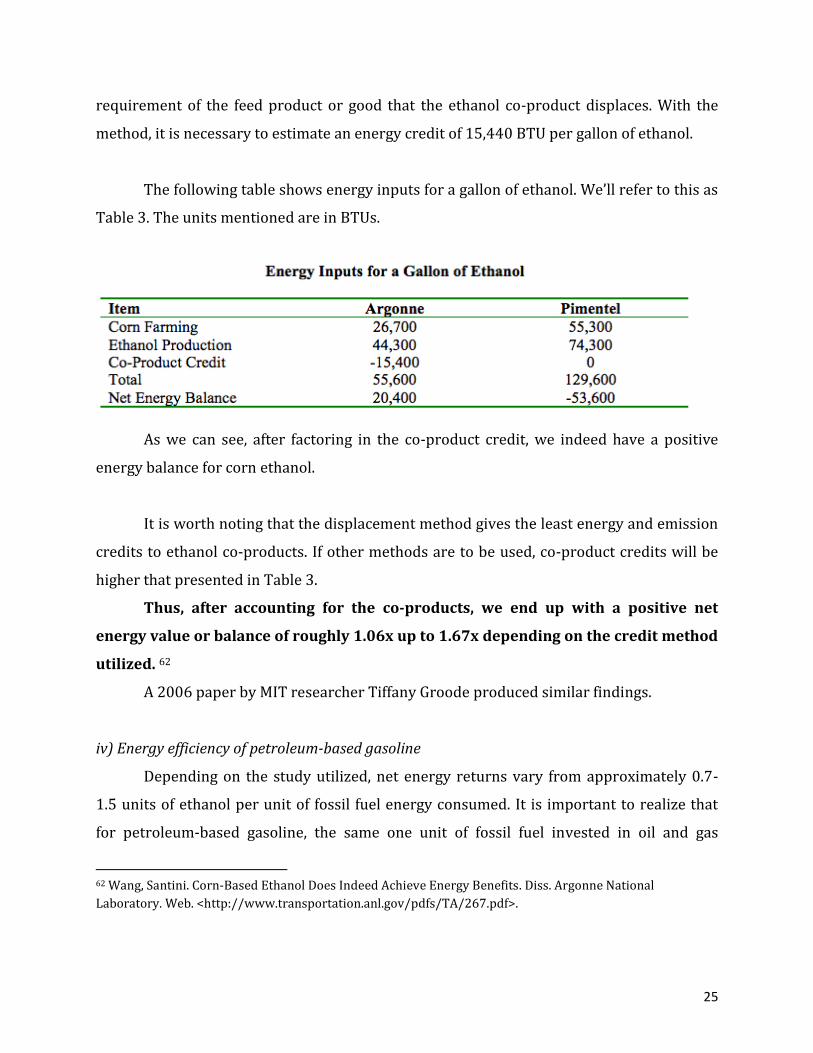
requirement of the feed product or good that the ethanol co-product displaces. With the
method, it is necessary to estimate an energy credit of 15,440 BTU per gallon of ethanol.
The following table shows energy inputs for a gallon of ethanol. We’ll refer to this as
Table 3. The units mentioned are in BTUs.
As we can see, after factoring in the co-product credit, we indeed have a positive
energy balance for corn ethanol.
It is worth noting that the displacement method gives the least energy and emission
credits to ethanol co-products. If other methods are to be used, co-product credits will be
higher that presented in Table 3.
Thus, after accounting for the co-products, we end up with a positive net
energy value or balance of roughly 1.06x up to 1.67x depending on the credit method
utilized. 62
A 2006 paper by MIT researcher Tiffany Groode produced similar findings.
iv) Energy efficiency of petroleum-based gasoline
Depending on the study utilized, net energy returns vary from approximately 0.7-
1.5 units of ethanol per unit of fossil fuel energy consumed. It is important to realize that
for petroleum-based gasoline, the same one unit of fossil fuel invested in oil and gas
62 Wang, Santini. Corn-Based Ethanol Does Indeed Achieve Energy Benefits. Diss. Argonne National
Laboratory. Web. <http://www.transportation.anl.gov/pdfs/TA/267.pdf>.

26
extraction will yield approximately 15 units of gasoline, a yield significantly higher than
current ethanol production technologies. However, this is ignoring energy quality
arguments and the fact that this yield is both declining and not carbon neutral.
Energy return on investment can be derived from the biophysical model of resource
scarcity, meaning the use of increasing amounts of natural capital to deliver a unit of
resource to society. Energy is commonly used to reflect and measure the costs associated
with such process. In general, there is an evident inverse relation between the quality of
the resource and energy costs. A decline in the quality of the natural resource due to
cumulative depletion, an increase in the rate of exploitation, or an increases in the scale of
extraction, all increase the amount of energy used to extract a unit of a natural resource.
It is evident that there has been a decline in the energy return on investment (EROI)
over the last decades, suggesting that depletion of the resource has raised the energy costs
of extraction. We do not have a single measure of the quality of the oil or gas resource, but a
number of such measurements point towards physical deterioration. Also, on the discovery
side, an important indicator is the average size of new discoveries. We find that the average
oil field has declined in size roughly 20-40 million barrels in the 1930’s to less than 1
million today. The average depth of exploratory oil wells has also increased by an average
of 3,000 ft over the past 80 years.
Opposing these effects that have reduced the EROI of petroleum, technological,
organizational and institutional changes have worked to reduce the costs of oil extraction
in the industry. On the technological side, 3D seismology, horizontal drilling, and
deepwater production systems have worked to reduce costs over the past 15 years.
However, on energy balance, the effects of these changes on the energy cost of extraction
have been outweighed by the depletion effects and thus producing a decline in EROI.63
63 Cleveland, Cutler J. Net Energy From the Extraction of Oil and Gas in the United States, 1954-1997. Diss.
Boston University, 2000. Center for Energy and Environmental Studies and Department of Geography, Print.

27
Although the energy balance or net energy value of petroleum-based gasoline has
been declining, it is important to realize that this figure is still significantly higher that that
of corn-based ethanol. Without taking into account the quality of the energy, it is clear that
on a purely efficiency-based argument, gasoline is the superior fuel source.
b) Infrastructure cost of a transition to corn ethanol
In addition to the costs of actually growing corn, converting it to ethanol, increased
food prices and environmental effects, there remain the costs of retooling our
infrastructure in order to make pure ethanol a true viable alternative to gasoline.
Converting cars to run on pure ethanol costs about as much as it does to run it on an e85
blend; on an individual basis this runs some $250-700 depending on the car and engine
type. 64 People not wanting to convert their entire car to ethanol can see gasoline fuel
savings of some 30 percent with a $1000 investment into an ethanol turbo and a few
gallons of ethanol a month; this would pay for itself in some 4 years at current gasoline
prices.65 However for an industrial move to ethanol as a fuel it would only cost some $70-
100 more than a tradition direct fuel injected gasoline motor.66 With greater possible
power output and increased fuel efficiency the industry is heading towards direct fuel
injection anyways and many cars already utilize it. In addition advances in the direct fuel
injection technology have helped lead the resurgence of diesel power vehicles. With this
shift to direct fuel injection already occurring, the problem of cold-starting with an ethanol
motor would be a thing of the past and range issues due to the lower volume efficiency of
ethanol would be partly alleviated. With about 247 million registered vehicles on the road
in the United States, excluding heavy trucks and busses, the total cost to have each
passenger vehicle eventually running on ethanol would total some 24.7 billion dollars67 at
the higher range for ethanol engine production costs.
64 Mongers, Inc. "E85 Conversion Kits." E85 Conversion Kits Change2E85.com. Mongers, June 2012. Web.
65 Stauffer, Nancy. "The MIT Energy Research Council." MIT Energy Research Council : Research Spotlight. MIT,
n.d. Web.
66 Lang, Jim. "E100 Engines and Vision." E100ethanolgroup. N.p., n.d. Web.
67 (247 million * $100)

28
i) Trucking transportation conversion costs
Trucking as well would have to be converted to run on ethanol. Productions costs
wouldn’t be significantly more and in fact some countries like Sweden, without a large
ethanol fuel base, have begun employing light and heavy trucks without detriment.68
However there is a major cost involved with operating trucks that work on ethanol versus
diesel. According to a government case study, the fuel injector requires replacing every
60,000 miles on average for ethanol trucks to the cost of some $1000 apiece.69 With the
shipment of goods by trucks returning to pre-recession levels representing some 140
billion miles per year,70 the cost here could be some $2.33 billion yearly. Finding the
present value for the next 50 years of costs running semi trucks on ethanol vs. diesel and
discounting by the average US inflation rate since 1913 (3.23%) gives us some $58.2
billion.71 This combined with the cost to convert the passenger vehicles gives us a present
day cost of some $82.9 billion that would be paid gradually as new vehicles are produced at
rates that continue to match demand and fuel injectors wear out in semi trucks.
ii) Distribution infrastructure conversion costs
Beyond the extra costs of producing and running vehicles on e85 ethanol on an
industrial scale are the costs associated with the retrofitting of fueling stations across the
United States. Currently there are some 168,000 gas stations located in the United States.72
With a cost of $23,000 to have a fuel dispenser dispense ethanol and $102,000 to have a
tank than can store it, if each gas station were to only install 4 e85 capable dispensers and 2
68 Scania. "Green Light for Ethanol Trucks." Scania.com. N.p., n.d. Web
69 United States. Illinois DCCA. By Paul Norton, Kenny J. Kelley, and Norman J. Marek. N.p.: n.p., n.d. Web. p.5
70 "Truck Stats." Trucking Statistics. N.p., n.d. Web.
71 (2.33(1-.9677^50))/(.0323))
72 "How Many Gas Stations Are There in the U.S?" How Many Gas Stations Are There in the U.S? N.p., n.d.

29
tanks (below the level of current gas storage tanks and dispensers) that would cost some
$49.7 billion dollars.73
Rather than convert all gas stations in the country to use ethanol, a viable
alternative to start spurring more ethanol use as a main fuel could be convert only 12,000
gas stations in the most crucial and highly populated places. This would be enough for 1
every 2 miles in each of America’s 100 most populated cities, as well as one every 25 miles
along it’s highway system. The total cost of this would be $3.552 billion using the same
assumptions on ethanol storage tanks and dispensers built per gas station.74
After the cost of the actual corn, the next largest portion of ethanol costs goes to its
transportation. Currently in the United States 40% of the ethanol is transported by rail,
another 40% by truck, and the remaining 20% by barge. Ethanol shipped via pipeline is
possible but it isn’t a very probable occurrence.75 The primary reason for this is ethanol’s
affinity for water. It is water soluble and as such it absorbs water lowering the fuel grade,
and often water finds its way into pipelines. As well ethanol has more issues with corrosion
in pipelines when it is at high concentrations and pressures.76 However this does not mean
ethanol pipelines are impossible. The US Department of Energy did a feasibility study of a
large pipeline from producers in the Midwest to the Northeast and came to the conclusion
that it would cost some $4.25 billion and be able to transport some 2.8 billion gallons of
ethanol a year.77 About 134 billion gallons of gasoline was consumed in the US last year
with 10% of that being ethanol. This represents a total of some 4,764.5 billion kwh worth
of energy. To make that equivalent amount of energy would take some 180.67 billion
73 (168,000)*((23,000*4)+(102,000*2))
74 (12,000)*((23,000*4)+(102,000*2)
75 Roger Brown, Erin Orwig, Jefferey Nemeth, and Carolos S. Rocha, “The Economic Potential for Ethanol
Expansion in Illinois”, (Illinois Institute for Rural Affairs at Western Illinois University)
76 "In The Pipe: Increased Ethanol Use Creates Challenges." In The Pipe: Increased Ethanol Use Creates
Challenges. N.p., n.d. Web.
77 "DOE Finds Ethanol Pipeline Feasible, with Conditions." Ethanol Producer Magazine. N.p., n.d. Web.

30
gallons of e85, 153.6 billion gallons of which is ethanol, taking into account of course of
energy densities and holding the energy for ground transportation needs constant. To do
this by building new pipelines (converting old ones doesn’t really help as petrol production
locations differ from those of ethanol), even at the generous price to gallons transported
yearly ratio found by the DOE for that large project which would be tough to replicate in
smaller projects, would amount to a total cost of some $233.1 billion.78
iii) Total potential E85 ethanol usage costs
Due to some of the issues previously stated, it is likely that the majority of
transportation for this new ethanol would be by truck, barge, and rail. The total amount of
gallons needed at e85 by current energy used to drive is some 180.9 billion gallons
(calculated using current gallons of gasoline used a year and dividing it by .7186 which
represents the lower energy density of e85 compared to gasoline)7980. This would
represent an increase of some 27.3 billion gallons of liquid needing to be transported,
equivalent to 179.907 billion lbs, or approximately some 90 million tons. Considering that
ethanol refining is mostly located in the Midwest far from most of the population centers,
the distance travelled from the refinery to the station would have to average at least some
200 miles. At the average freight prices of $.27, $.2, and $.1 per mile-ton freight
transportation by truck, rail, and barge respectively,81 the weighted cost by transportation
type breakdown currently would be $.208 per mile-ton shipped on average. That would
cost some $3.75 billion a year currently, with the discounted present value of that for the
next including price increase that match inflation 50 years would cost some $187 billion.82
78 (153.6/2.8)*4.25
79 http://www.epa.gov/oms/rfgecon.html, N.p. Nnd. Web.
80http://alternativefuels.about.com/od/resources/a/gge.html, N.p. n.d. Web.
81 "Freight Transportation." Center for Climate and Energy Solutions. N.p., n.d. Web.
82 (3.75*50, assuming the price increase matches inflation)

31
The costs to convert the system to run on e85 would come chiefly from the
conversion of engines and the replacement of fuel injector in semi-trucks, the creation of an
e85 compatible fuel delivery infrastructure, and a delivery system for all ethanol, whether
by a new pipeline network or by more traditional means of truck, rail, and barge
transportation. The total present value cost for the next 50 years under the pipeline
scenario is estimated to be some $390.4 billion. Under the other means of transportation
scenario it would only be $344.3; however this only takes into account the transportation
costs for the next 50 years and none after that, so in the longer term this would be much
costlier.
c) Emissions and environmental concerns from production process of ethanol
As well as the monetary costs of converting our infrastructure on e85, the emissions
from the production process also have to be taken into account as part of the total costs of
conversion. According to the Congressional Budget Office of the United States (CBO) and
research conducted by Argonne National Laboratory (ANL) it has been suggested that in
the short run, the processes of production, distribution, and consumption of ethanol will
create 20% less greenhouse gas emissions than the same processes create for gasoline.83
This creates a reduction of about 14 million metric tons of carbon dioxide and other
equivalent gases, which are known to be the main causes of greenhouse gases.84 In
choosing to convert all of the gasoline used for ground transportation into e85 we would
end up emitting 1,277 billion lbs. of CO2 into the atmosphere during the production
process, compared to the 91 billion lbs. we produce today.
83 Elmendorf, Douglas W. "The Impact of Ethanol Use on Food Prices and Greenhouse-Gas
Emissions." Congressional Budget Office. Congress of the United States Congressional Budget Office, Apr.
2009. Web. 6 Dec. 2012.
84 Elmendorf, Douglas W. "The Impact of Ethanol Use on Food Prices and Greenhouse-Gas
Emissions." Congressional Budget Office. Congress of the United States Congressional Budget Office, Apr.
2009. Web. 6 Dec. 2012.

32
i) Calculation for total extra CO2 emissions in lbs. to achieve 100% E85 efficiency in ground
transportation
In order to calculate total extra CO2 emissions from the extra ethanol production
needed to fuel America’s ground transportation, a few calculations need to be done. Today,
all energy needed for transportation is 4,343.3 billion kWh. To make that much energy in
e85 we would need to make 180.67 billion gallons of e85 (4,343.3 billion kWh/2.404 kWh
per gallon of e85). 85% of e85 is ethanol, which results in 153.6 billion of the total 180.67
billion gallons of e85. 153.6 billion gallons of ethanol x 22.27 kWh per gallon of pure
ethanol is equivalent to 3,420.69 billion kWh worth of ethanol. For every 3.65 kWh of
ethanol produced it costs us 1 kWh85. Taking the 3,420.69 billion kWh worth of ethanol and
dividing it by 3.65 kWh we come up with 937.18 billion kwh, which is the amount of energy
used to convert all gasoline into ethanol. On average the amount of CO2 produced per kWh
is 1.363 lbs. When we take into consideration all the kWh of energy used to convert all
gasoline into e85 and multiply it by the lbs. of CO2 produced per kWh, we get a total of
1,277 billion lbs. of CO2, approximately 14x the amount of CO2 produced today.
ii) Calculation for total cost of CO2 emissions to achieve 100% E85 efficiency in ground
transportation
According to the Environmental Protection Agency, one ton of CO2 released into the
atmosphere led up to $35 in economic damage according to a social cost of carbon discount
rate of 2.5% which estimates the monetized damage associated with the incremental
increase in carbon emissions.86 This means that currently in the United States 45,500,000
tons of CO2 are produced from ethanol production, which costs $1,592,500,000. If we were
to switch to 100% e85 in our pumps, the total cost of CO2 emissions from production
85 Pimentel, David. "Ethanol Fuels: Energy Balance, Economics, and Environmental Impacts Are
Negative." Natural Resources Research. Washington University St. Louis, June 2003. Web. 5 Dec. 2012.
86 Environmental Protection Agency, “Social Cost of Carbon for Regulatory Impact Analysis” (Washington D.C.,
2010), 2.

33
would come out to be 638,500,000 million tons of CO2 produced x $35 per ton =
$22,347,500,000. This results in a total change of $20,755,000,000.
iii) Environmental concerns from ethanol production process
As well as the total costs of CO2 emissions, the release of harmful toxins and
greenhouse gases are also a major concern in the production process of ethanol. Land
conversion has been a topic of discussion recently in regards to the environmental
concerns that ethanol has created. Producing ethanol for use in motor fuels increases the
demand for corn, which increases the demand for land conversion across the United States.
To produce more ethanol, farmers can engage in deforestation practices, which releases a
significant amount of carbon to the atmosphere that was previously stored in plants and
soil.87 Deforestation and the removal of conservation lands also forego ongoing carbon
sequestration as plants continue to grow each year. The foregone carbon sequestration
needs to be considered and is the equivalent of additional emissions.88 Also, with these
large increases in the use of nitrogen fertilizer as a result of land conversion in order to
keep up with the growing demand for corn, the fertilizer in fact has increased nitrous oxide
emissions, thus leading to more Greenhouse gas emission problems as well.
In a study conducted by the University of Nebraska an ethanol biorefinery’s
Greenhouse gas emissions were documented and publicized. Ethanol biorefineries are the
other major contributor to the Greenhouse gas emission process. Further studies showed
that at this ethanol biorefinery, which can be representative of other Midwest ethanol
biorefineries, natural gas contributed to about 2/3 of the emissions that were produced.89
87 Searchinger, Timothy, Ralph Heimlich, R. A. Houghton, Fengxia Dong, Amani Elobeid, Jacinto Fabiosa, Simia
Tokgoz, Dermot Hayes, and Tun-Hsiang Yu. "Use of U.S. Croplands for Biofuels Increases Greenhouse Gases
Through Emissions from Land-Use Change." Science Magazine. N.p., 7 Feb. 2008. Web. 06 Dec. 2012.
88 Searchinger, Timothy, Ralph Heimlich, R. A. Houghton, Fengxia Dong, Amani Elobeid, Jacinto Fabiosa, Simia
Tokgoz, Dermot Hayes, and Tun-Hsiang Yu. "Use of U.S. Croplands for Biofuels Increases Greenhouse Gases
Through Emissions from Land-Use Change." Science Magazine. N.p., 7 Feb. 2008. Web. 06 Dec. 2012.
89 Hofstrand, Don. "Greenhouse Gas Emissions of Corn Ethanol Production." Agricultural Marketing Resource
Center. AgMRC Renewable Energy Newsletter, Aug. 2009. Web. 05 Dec. 2012.

34
Electricity combined with the natural gas contributed to 90% of the Greenhouse gas
emissions.90 According to the study, “The distillers grains co-product provides a 29 percent
GHG emission credit. Most of the credit is due to the reduction in emissions resulting from
substituting distillers grains for other feeds (that emit GHG in their production) in cattle
rations.”91 From the results displayed below, it can clearly be seen that the net emissions
from the production process of ethanol come out to be 42 units of emissions per unit of
energy produced.92 The energy produced is measured in grams of CO2 equivalent
emissions per megajoule of energy produced. Compared to gasoline, which net emissions
are 92 units; this represents a 54 percent reduction in Greenhouse gas emissions when it is
compared to gasoline.
90 Hofstrand, Don. "Greenhouse Gas Emissions of Corn Ethanol Production." Agricultural Marketing Resource
Center. AgMRC Renewable Energy Newsletter, Aug. 2009. Web. 05 Dec. 2012.
91 Hofstrand, Don. "Greenhouse Gas Emissions of Corn Ethanol Production." Agricultural Marketing Resource
Center. AgMRC Renewable Energy Newsletter, Aug. 2009. Web. 05 Dec. 2012.
92 Hofstrand, Don. "Greenhouse Gas Emissions of Corn Ethanol Production." Agricultural Marketing Resource
Center. AgMRC Renewable Energy Newsletter, Aug. 2009. Web. 05 Dec. 2012.

35
93
The production process of ethanol, although less harmful then the production
process of gasoline in regards to net emissions as described previously, is accountable for
the release of harmful toxins and other greenhouse gases. “Crop production accounts for 50
percent of the total emissions from ethanol production. One-half of these emissions are in
the form of nitrous oxide (N2O.)”94 Nitrous oxide proves to be an extremely powerful
Greenhouse gas as it is recorded as being 289x more powerful than carbon dioxide95 is,
thus creating a powerful impact for Greenhouse gas concerns, even in small doses. N20 is
93 Hofstrand, Don. "Greenhouse Gas Emissions of Corn Ethanol Production." Agricultural Marketing Resource
Center. AgMRC Renewable Energy Newsletter, Aug. 2009. Web. 05 Dec. 2012.
94 Hofstrand, Don. "Greenhouse Gas Emissions of Corn Ethanol Production." Agricultural Marketing Resource
Center. AgMRC Renewable Energy Newsletter, Aug. 2009. Web. 05 Dec. 2012.
95 Hofstrand, Don. "Greenhouse Gas Emissions of Corn Ethanol Production." Agricultural Marketing Resource
Center. AgMRC Renewable Energy Newsletter, Aug. 2009. Web. 05 Dec. 2012.

36
found in the soil and produced from the processes of nitrification and de-nitrification.
According to Dan Hofstrand in his 2009 renewable energy newsletter, “during nitrification,
ammonium (NH4) produces nitrates (NO3.) During de-nitrification, nitrates (NO3,) are
reduced to nitrogen gas (N2). An intermediate step in both of these processes is the
creation of nitrous oxide (N20).”96
Separate from the greenhouse gases are the harmful toxins (VOCs) produced by the
ethanol production process. Upon the arrival of corn to the production plant, tiny particles
from the corn are released into the air. These same particles are released into the air
during the drying process of production. These small, invisible particles are known as
particulates and can be harmful if inhaled. Results from a study performed by the
Minnesota Pollution control agency concerning ethanol production in Minnesota, showed
that “during fermentation, distillation and drying, volatile organic compounds (VOCs) are
released. Some of these VOCs are known as ‘hazardous’ or ‘toxic’ at certain levels. These
include some or all of the following: acetaldehyde, acrolein, ethanol, formaldehyde, 2-
furaldehyde, methanol, acetic acid and lactic acid.”97 Besides the VOC’s released, other toxic
gases such as carbon monoxide and nitrogen oxide are generated from the combustion in
the boilers of the plant.
iv) Percent increase in CO2 emissions to achieve 100% E85 efficiency in ground
transportation
The economic costs in CO2 pollution if we were to convert entirely to e85, would be,
according to self conducted calculations, the percentage difference between 1,592,500,000
and 22,347,500,000 which equals 173.39%, and the 20,755,000,000 rise (from
1,592,500,000 to 22,347,500,000) equates to a 1303.30% increase in CO2 emissions. This
96 Hofstrand, Don. "Greenhouse Gas Emissions of Corn Ethanol Production." Agricultural Marketing Resource
Center. AgMRC Renewable Energy Newsletter, Aug. 2009. Web. 05 Dec. 2012.
97 "Ethanol Production in Minnesota." Minnesota Pollution Control Agency. Ed. Rhonda Land. N.p., 20 Oct.
2002. Web. 04 Dec. 2012.

37
can be accompanied by the environmental concerns in regards to greenhouse gas
emissions and the emission of other harmful toxins into the atmosphere.
d) Emissions and Environmental Concerns from the Consumption of Ethanol
To examine the use of ethanol on the consumption level, it should be stated that
ethanol is considered a cleaner burning alternative to using gasoline. The amount of
greenhouse gas emissions released by ethanol is considerably lower. This has led many to
believe that ethanol is a viable replacement for gasoline, as gasoline has had a detrimental
effect on the environment. However, it has been shown that ethanol is less efficient than
gasoline in terms of fuel economy. 98 What that means is that the output of energy for
ethanol is less than that of gasoline giving cars less miles per gallon. So, while ethanol
burns cleaner than gasoline, cars must use more ethanol in order to travel the same
distance, and thus releasing more pollutants like carbon dioxide. When comparing the two
inputs on the consumption level, the relative amount of pollution per equivalent energy
output must be realized in order to judge whether or not ethanol would be a viable
replacement of gasoline.
Ethanol has been developed to be used in automobiles as an alternative motor fuel
source to help prevent air pollution. It contains 35% oxygen which results in a more
complete fuel combustion that reduces tailpipe emissions. Ethanol is biodegradable in
nature, non toxic, and also reduces the amount of greenhouse gases and tailpipe emissions.
This is compared to fossil fuels which are a major contribution to the emissions of carbon
dioxide among other pollutants. According to the EPA, CO2 emissions through fossil fuel
combustion by commercial means totaled to 224.2 metric tons in 2010.99 Ethanol in the
United States is currently used as additive to gasoline, with cars slowly developing the
technology to handle higher concentrations of ethanol blends. The idea behind this is that
98 The Truth About Ethanol, http://www.ucsusa.org/clean_vehicles/smart-transportation-
solutions/cleaner_fuels/ethanol-and-other-biofuels/the-truth-about-ethanol.html (July 2007).
99 Environmental Protection Agency, “US GHG Inventory 2012 Executive Summary” (Washington D.C., 2012),
5.
38
the more ethanol is being used as fuel in motor vehicles, the less gasoline will be used, and
these numbers of CO2 emissions from commercial vehicles will go down.
The efficiency of Ethanol burning must first be examined in order to determine if it
is a viable replacement to gasoline. Ethanol contains less energy than gasoline when being
burned, thus leading to worse fuel economy. In addition, most cars have not been designed
to handle higher blends of ethanol into gasoline, thus leading to worse fuel efficiency. The
E10, or gasohol, blend of 10% ethanol and 90% gasoline has become more commonly
available in the United States where 10 states have sanctioned it as mandatory. In terms of
efficiency, the E10 blend will generally run about 3-4% fewer miles per gallon on an
automobile than straight gasoline would.100 E85 blends contain much higher
concentrations of ethanol as fuel and are used in Flexible Fuel vehicles (FFVs). E85 blends
will typically experience a 25-30% drop in the miles per gallon of a vehicle due to the lower
energy content.101 Even with replacing most common gasoline stations in the United States
with E10 gas, it is uncertain if ethanol will have a significant impact on the reduction of CO2
emissions given its less efficient nature compared to gasoline.
To approach the question of pollution by ethanol on the consumption level and
whether it is or is not a viable replacement of gasoline, carbon dioxide levels must be
measured. This will determine which releases more based on the same level of usage,
gasoline or ethanol. The burning of fossil fuels has largely contributed to the increase in
carbon dioxide in the Earth’s atmosphere, and the introduction of ethanol sought to reduce
the levels of carbon dioxide being released into the atmosphere. While other greenhouses
gases being released into the atmosphere are prevalent, this analysis will focus on carbon
dioxide because it has irreversibly long term effects in the atmosphere. This is due to the
100 Knoll, Keith, Brian West, Wendy Clark, Ronald Graves, John Orban, Steve Przesmitzki, and Timothy Theiss,
“Effects of Intermediate Ethanol Blends on Legacy Vehicles and Small Non-Road Engines, Report 1 – Updated”
Prepared by the National Renewable Energy Laboratory, February 2009. P. 3-3.
101 West, Brian H., Alberto J. Lopez, Timothy J. Theiss, Ronald L. Graves, John M. Storey, and Samuel A. Lewis,
“Fuel Economy and Emissions of the Ethanol-Optimized Saab 9-5 Biopower” Prepared for SAE International,
January 2007.

39
greenhouse gas effect, where gases like carbon dioxide will raise the temperature of the
Earth.
To measure the amount of CO2 released into the atmosphere by the different types
of automobiles, this analysis will determine the average miles per gallon of the different
fuel types and with this find the amount of CO2 that is released per mile. With these
numbers we will be able to compare gasoline with the E10 and E85 fuel blends to see what
will release more CO2 per mile.
i) Average ethanol miles per gallon
The change in miles per gallon by blend will first be taken into account. Given
findings found that were mentioned earlier in this paper, 28% will be used for the change
in E85 miles per gallon.
Δ E85 MPG = 28%
The average fuel efficiency for light duty vehicles with short wheel bases is 23.8
mpg.102 Given the average fuel efficiency we can find the average mpg of the different
blends of ethanol by using the change of mpg from the different ethanol blends.
Avg E85 MPG = 23.8 * .75 = 17.1
Using the amount of CO2 release from gasoline, E10, and E85, the CO2 emissions per
mile can be calculated given the average mpg determined above. The CO2 emissions from a
gallon of gasoline are 8,887 grams CO2/gallon.103
ii) CO2 emissions comparison on a per mile basis
102 Bureau of Transportation Statistics, “Average Fuel Efficiency of U.S. Light Duty Vehicles” (Washington D.C.,
2011).
103 Environmental Protection Agency, “Greenhouse Gas Emissions from a Typical Passenger Vehicle”
(Washington D.C., 2011), 1.

40
CO2 emissions per mile gasoline= CO2 emissions per gallon / MPG = 8887/23.8 =
373.4 grams
Given that we converted the average miles per gallon of each ethanol blend on the
basis of gasoline, we can use the same carbon dioxide emissions per mile number as we
used when calculating gasoline.
CO2 emissions per mile E85= CO2 emissions per gallon / MPG = 8887/17.1 = 519.7 grams
iii) CO2 emissions comparison on a total consumption basis
In addition, earlier in our analysis, we found that if the United States were to switch
from gasoline transportation to only E85 fuel for transportation, we would be using 159
billion gallons of E85 blend. Also, we must find the total amount of gasoline consumption.
Total E85 transportation consumption = 159 billion * 17.1 = 2,719 billion miles
Total gasoline consumption = Total fuel consumption (1- % Ethanol Additives) Avg mpg
Total fuel consumption = 134 billion gallons
Total ethanol additives = 10%
Total gasoline consumption = 134 (1-.1)(23.8) = 2,870 billion miles
Comparing these two numbers, we see that total miles driven from E85 fuel blends
would be 2,719 billion. The total miles driven from using gasoline fuel would be 2,870
billion miles. This shows that with the same relative amount of fuel necessary to supply the
United States, gasoline would provide more overall miles. Now, applying the CO2
emissions per mile for E85, we can see the amount of CO2 a switch from gasoline to E85
would yield.
Total CO2 yield E85 = 2,719 billion * 519.7 = 1,413 billion kilograms CO2 released
Total CO2 yield gasoline = 2,870 billion * 373.4 = 1,071 billion kilograms CO2 released

41
iv) Total CO2 emissions on an economic cost basis
Given this analysis, we see that there are in fact more carbon dioxide emissions per
mile and in total consumption by E85 blends compared to gasoline given the increase in
miles driven due to the lower energy content of ethanol. Next, the amount of CO2 released
must be assessed from a cost basis. From an economic stand point, the amount of CO2
emissions leads to a cost of damages that is incurred from climate behavior and the related
physical damages that go along with environmental change. According to the
Environmental Protection Agency, one ton of CO2 released into the atmosphere led up to
$35 in economic damage according to a social cost of carbon discount rate of 2.5% which
estimates the monetized damage associated with the incremental increase in carbon
emissions.104 Analyzing our results from a cost benefit standpoint, we can compare the
total cost of E85 versus the total cost of gasoline and compare the change. The total cost of
gasoline will be the benefit that will be gained because the United States will no longer
suffer from the CO2 emissions from gasoline. The total cost of E85 would be the cost of the
United States because by transitioning to purely E85, the United States would be taking on
new economic costs from the emissions resulting from the use of ethanol.
1 ton = 907 kilograms
Total Cost E85 = (1,413 billion/907) * 35 = $54 billion
Total Cost gasoline = (1,071 billion/907) * 35 = $41 billion
Cost Benefit Analysis:
Total Cost = $54 billion
Total Benefits = $41 billion
Total change = $13 billion in cost
v) Consumption level pollution cost benefit analysis summary
104 Environmental Protection Agency, “Social Cost of Carbon for Regulatory Impact Analysis” (Washington
D.C., 2010), 2.

42
From our cost benefit analysis of ethanol from a consumption pollution standpoint,
we can see that it is currently not a viable solution. The economic costs in CO2 pollution
outweigh the benefits by $13 billion. In order to become a viable pollution reduction
replacement on the consumption level to motor fuel, ethanol first needs to become more
fuel efficient. This can be done when better technology is created and distributed. More
advanced fuel efficient engines that are better designed to operate using ethanol as fuel
would lead to higher potential miles per gallon with ethanol. Better designs would mean
more ethanol would not have to be used by cars in order to consume the same number of
miles that results from gasoline. Until then, ethanol cannot be considered a viable
replacement to gasoline on the consumption level from the basis of pollution.
5) Conclusion
Converting corn to ethanol is an expensive and time consuming process, whose
costs seem to far outweigh its benefits in terms of transportation needs. E85 itself is not as
energy dense as gasoline, the net energy gain isn’t that great or necessarily apparent, and
the process has some negative externalities such as increased pollution. Estimates for the
NEV of ethanol compared to gasoline range a fair bit but average about a 1:1 ratio meaning
the there is a net sum of zero benefits there. Furthermore, much of the progress made
towards ethanol as a main fuel for ground transportation was made possible only with
generous government subsidies that come at a cost to taxpayers. Infrastructure changes to
accommodate the transition to e85 are a major cost and reason to forego this conversion
and they sum to at least $390.4 billion under the long term solution of a pipeline network.
The greenhouse emissions differences total to 970 million extra tons of CO2 from the
consumption and production side when comparing going to e85 versus now. Monetized,
this amounts to some $33.9 billion. However, it is clear from the sheer amount of extra corn
needed that it is unfeasible to grow this amount of corn in the United States. Currently
some 700 billion lbs. are grown yearly and we would need some 4 trillion lbs a year to
satisfy the transportation needs as well as keep other corn consumption constant.
Assuming a similar corn to acre efficiencies as now, there would have to be the equivalent
of some 10 Illinois set aside to grown all the extra corn. Clearly that cannot be done and to
buy this much corn on the market would send prices skyrocketing, further endangering

43
those who already are already struggle to feed themselves. As such for the reasons
summarized above we find it unfeasible to try to run the nations ground transportation on
e85.

44
Works Cited
"American Coalition for Ethanol: Home." American Coalition for Ethanol : Home. N.p., 2012. Web. 03 Dec. 2012.
Austin, Anna. "Brazil Launches Campaign to Remove Ethanol Tariff." Ethanol Producer Magazine. N.p., 04 Aug. 2008. Web. 5 Dec. 2012.
Bailey, Regina. "10 Steps of Glycolysis." About Biology. N.p., n.d. Web. 10 Dec. 2012.
"Bankers: Ethanol at Heart of Corn, Farm Pricing Structure." Chicago Tribune. N.p., 05 Sept. 2012. Web. 03 Dec. 2012
Borglum, Gerald. "Starch Hydrolysis for Ethanol Production." N.p., n.d. Web. 10 Dec. 2012.
Carter, Colin, Gordon Rausser, and Aaron Smith. "The Effect of the U.S. Ethanol Mandate on Corn Prices." Egecon.com. Colin Carter, 22 July 2007. Web
Cleveland, Cutler J. Net Energy From the Extraction of Oil and Gas in the United States, 1954- 1997. Diss. Boston University, 2000. Center for Energy and Environmental Studies and Department of Geography, Print. 10 Dec. 2012.
"Corn as Food." SDCorn.org. N.p., 2012. Web. 08 Dec. 2012.
Cox, Craig, and Hug, Andrew. "Driving Under The Influence: Corn Ethanol & Energy Security". Environmental Working Group. June 2010. Web 27July 2010.
Cushman, John. "In Drought, a Debate Over Quota for Ethanol." Nytimes.com. New York Times, 16th Aug. 2012. Web. 22 Oct. 2012
"DOE Finds Ethanol Pipeline Feasible, with Conditions." Ethanol Producer Magazine. N.p., n.d. Web.
"The Dry Mill Ethanol Process." Ethanol. N.p., n.d. Web. 10 Dec. 2012.
E85 Prices. Web. 6 Dec. 2012. <http://e85prices.com/>.
Elmendorf, Douglas W. "The Impact of Ethanol Use on Food Prices and Greenhouse-Gas Emissions." Congressional Budget Office. Congress of the United States Congressional Budget Office, Apr. 2009. Web. 6 Dec. 2012.
Elmendorf, Douglas W. "Using Biofuel Tax Credits to Achieve Energy and Environmental Policy Goals." Congressional Budget Office, July 2010. Web. 6 Dec. 2012. Environmental Protection Agency, “Social Cost of Carbon for Regulatory Impact Analysis” (Washington D.C., 2010), 2.

45
"Ethanol Production in Minnesota." Minnesota Pollution Control Agency. Ed. Rhonda Land. N.p., 20 Oct. 2002. Web. 04 Dec. 2012.
"Ethanol Fuel History." Fuel Testers. N.p., n.d. Web. 10 Dec. 2012.
Hofstrand, Don. "Greenhouse Gas Emissions of Corn Ethanol Production." Agricultural Marketing Resource Center. AgMRC Renewable Energy Newsletter, Aug. 2009. Web. 05 Dec. 2012.
"Ethanol Subsidies: Fiscal Sobriety." The Economics. N.p., 23 June 2011. Web. 3 Dec. 2012.
Fahey, Jonathan. "What -and Who - Make Gasoline Prices Rise." USATODAY.COM. Associated Press, 23 Mar. 2012. Web. 07 Dec. 2012.
"Freight Transportation." Center for Climate and Energy Solutions. N.p., n.d. Web.
"Historical Price Charts." Gas Buddy. N.p., n.d. Web. 6 Dec. 2012.
"How Does a Hammer Mill Work." HammerMills. N.p., n.d. Web. 10 Dec. 2012.
"How Many Gas Stations Are There in the U.S?" FuelEconomy.gov. N.p., n.d. Web. 09 Dec. 2012.
Hubbard, Bethany. "E85: Fuel of the Future or Cause for Concern?" Medill Reports Chicago. N.p., 1 June 2011. Web. 6 Dec. 2012.
Ingram, Anthony. "Is E85 Ethanol The Solution To High Gas Prices?" Green Car Reports. N.p., 8 Oct. 2012. Web. 6 Dec. 2012.
"In The Pipe: Increased Ethanol Use Creates Challenges." In The Pipe: Increased Ethanol Use Creates Challenges. N.p., n.d. Web.
Krauss, Clifford. "Ethanol Industry Is Unruffled by Senate Vote Against Tax Breaks."The New York Times. N.p., 17 Jan. 2011. Web. 3 Dec. 2012.
Lefebvre, Ben. "Midwest Drought Hits Gas Pump." The Wall Street Journal. The Wall Street Journal, 10 Aug. 2012. Web. 7 Dec. 2012.
Lang, Jim. "E100 Engines and Vision." E100ethanolgroup. N.p., n.d. Web.
Llanos, Miguel. "$6 Billion-a-year Ethanol Subsidy Dies -- but Wait There's More." NBC News. N.p., 29 Dec. 2011. Web. 3 Dec. 2012.
"Making Ethanol." E85 Whipnet. N.p., n.d. Web. 10 Dec. 2012.
McDonald, Kay, and The Opinions Expressed in This Commentary Are Solely Those of Kay

46
McDonald. "Paying More for Food? Blame the Ethanol Mandate." CNN. Cable News Network, 20 Aug. 2012. Web. 20 Nov. 2012.
McKay, Peter A. "Ethanol Pushes Gas Prices Higher: Demand for Ethanol Aggravates Pain at the Pump." Energy Refuge. N.p., 2009. Web. 6 Dec. 2012.
Mongers, Inc. "E85 Conversion Kits." E85 Conversion Kits Change2E85.com. Mongers, June 2012. Web
"North Dakota State University." Ethanol Production. N.p., n.d. Web. 10 Dec. 2012.
Pimentel, David. "Ethanol Fuels: Energy Balance, Economics, and Environmental Impacts Are Negative." Natural Resources Research. Washington University St. Louis, June 2003. Web. 5 Dec. 2012.
O’Brien, Daniel, and Mike Woolverton. "The Relationship of Ethanol, Gasoline and Oil Prices." AGManager. N.p., n.d. Web. 6 Dec. 2012.
Pear, Robert. "After Three Decades, Tax Credit for Ethanol Expires." The New York Times. N.p., 1 Jan. 2012. Web. 6 Dec. 2012.
Pimentel, Patzek, Ethanol Production Using Corn, Switchgrass, and Wood: Biodiesel Production using Soybean and Sunflowers, Diss, Natural Resource Research, 2005. Web. 5 Dec. 2012.
Plumer, Brad. "Study: U.S. Could Put a Big Dent in Food Prices by Relaxing Ethanol Rules." Washingtonpost.com. Washingtonpost.com, 21 Aug. 2012. Web. 02 Dec. 2012.
Robert, Wasserman. "Glucose to Ethanol." LiveStrong. N.p., n.d. Web. 10 Dec. 2012.
Rohter, Larry. "With Big Boost From Sugar Cane, Brazil Is Satisfying Its Fuel Needs."The New York Times. The New York Times, 10 Apr. 2006. Web. 06 Dec. 2012
Scania. "Green Light for Ethanol Trucks." Scania.com. N.p., n.d. Web
Searchinger, Timothy, Ralph Heimlich, R. A. Houghton, Fengxia Dong, Amani Elobeid, Jacinto Fabiosa, Simia Tokgoz, Dermot Hayes, and Tun-Hsiang Yu. "Use of U.S. Croplands for Biofuels Increases Greenhouse Gases Through Emissions from Land-Use Change." Science Magazine. N.p., 7 Feb. 2008. Web. 06 Dec. 2012.
Shaffer, David. "The Road for E85 Fuel Just Got Rougher." StarTribune. N.p., 7 Jan. 2012. Web. 6 Dec. 2012.
Stauffer, Nancy. "The MIT Energy Research Council." MIT Energy Research Council : Research Spotlight. MIT, n.d. Web.

47
"The Truth About Ethanol." Union of Concerned Scientists. N.p., 12 July 2007. Web. 20 Nov. 2012.
"Truck Stats." Trucking Statistics. N.p., n.d. Web.
United States. U.S. Department of Energy. Fuels, Engines and Emissions Research Center. By Keith Knoll, Brian West, and Wendy Clark. N.p.: n.p., n.d. Print.
United States. U.S. Department of Transportation. Bureau of Transportation Statistics. Average Fuel Efficiency of U.S. Light Duty Vehicles. N.p.: n.p., n.d. Print.
United States. United States Environmental Protection Agency. Office of Transportation and Air Quality. Greenhouse Gas Emissions from a Typical Passenger Vehicle. N.p.: n.p., n.d. Print.
United States. Illinois DCCA. By Paul Norton, Kenny J. Kelley, and Norman J. Marek. N.p.: n.p., n.d. Web. p.5
United States. United States Environmental Protection Agency. Department of Energy.Social Cost of Carbon for Regulatory Impact Analysis. N.p.: n.p., n.d. Print.
Wang, Santini. Corn-Based Ethanol Does Indeed Achieve Energy Benefits. Diss. Argonne National Laboratory. Web. 5 Dec. 2012.
Weiss, Elizebeth. "USA TODAY." USATODAY.COM. Elizebeth Weiss, 14 Feb. 2011. Web. 27 Nov. 2012.
West, Brian H., Alberto J. Lopez, Timothy J. Theiss, Ronald L. Graves, John M. Storey, and Samuel A. Lewis. 2007. Fuel Economy and Emissions of the Ethanol-Optimized Saab 9-5 Biopower. SAE Technical Paper 2007-01-3994.
West, Brian H., Alberto J. Lopez, Timothy J. Theiss, Ronald L. Graves, John M. Storey, and Samuel A. Lewis, “Fuel Economy and Emissions of the Ethanol-Optimized Saab 9-5 Biopower” Prepared for SAE International, January 2007.