COREPASOL - report 02 D4.1 20140421 final
50
CEDR Transnational Road Research Programme Call 2012: Recycling: Road construction in a post-fossil fuel society funded by Denmark, Finland, Germany, Ireland, Netherlands, Norway COREPASOL Activity of RA bitumen in cold-recycled mixes Report D4.1 04/2014 Coordinator: Czech Technical University in Prague (CTU) Partner 1: University of Kassel (UK) Partner 2: University College Dublin (UCD) Partner 3: Laboratório Nacional de Engenharia Civil, I.P. (LNEC) Partner 4: Wirtgen GmbH
Transcript of COREPASOL - report 02 D4.1 20140421 final

CEDR Transnational Road Research Programme Call 2012: Recycling: Road construction in a post-fossil fuel society funded by Denmark, Finland, Germany, Ireland, Netherlands, Norway
COREPASOL
Activity of RA bitumen in cold-recycled mixes
Report D4.1 04/2014
Coordinator: Czech Technical University in Prague (CTU) Partner 1: University of Kassel (UK) Partner 2: University College Dublin (UCD) Partner 3: Laboratório Nacional de Engenharia Civil, I.P. (LNEC) Partner 4: Wirtgen GmbH

CEDR Call 2012: Recycling: Road construction in a post-fossil fuel society
CEDR Call2012: Recycling: Road construction in a post-fossil fuel society
COREPASOL
Characterization of Advanced Cold-Recycled Bitumen Stabilised Pavement Solutions
Activity of RA bitumen in cold-recycled mixes
Due date of deliverable: 31.12.2013 Actual submission date: 07.04.2014
Start date of project: 01.01.2013 End date of project: 31.12.2014
Author(s) this deliverable: Diana Simnofske, Universität Kassel, Germany Konrad Mollenhauer, Universität Kassel, Germany Michael Engels, Wirtgen GmbH, Germany Jan Valentin, TU Prague, Czech Republic

CEDR Call 2012: Recycling: Road construction in a post-fossil fuel society
Table of contents Executive Summary .................................................................................................................1 1 Introduction .......................................................................................................................4 2 State of the Art ..................................................................................................................5
2.1 Mechanical properties of cold recycled materials and their influence........................5 2.2 Influence on mechanical properties ...........................................................................7
3 Experimental work and laboratory test............................................................................10 3.1 Sample materials .....................................................................................................10
3.1.1 mix variations....................................................................................................10 3.1.2 Source materials...............................................................................................11 3.1.3 Mix design.........................................................................................................13 3.1.4 Sample preparation ..........................................................................................16 3.1.5 Specimen curing ...............................................................................................17
3.2 Laboratory tests .......................................................................................................18 3.2.1 Bulk density ......................................................................................................18 3.2.2 Indirect tensile strength test (IDT).....................................................................18 3.2.3 CBR ..................................................................................................................20
4 Results of the laboratory tests and discussion................................................................21 4.1 Void content .............................................................................................................21 4.2 Results of indirect tensile strength (ITS) tests .........................................................23
4.2.1 ITS of emulsion mixtures ..................................................................................23 4.2.2 ITS of foamed bitumen mixtures.......................................................................26 4.2.3 Comparison of emulsion mixtures and foamed bitumen mixtures ....................29
4.3 Water susceptibility ..................................................................................................30 4.4 Results of CBR tests................................................................................................32
4.4.1 Emulsion mixtures ............................................................................................32 4.4.2 Foamed bitumen mixtures ................................................................................32 4.4.3 Comparison of CBR results obtained from emulsion and foamed bitumen mixtures ..........................................................................................................................33
4.5 Discussion................................................................................................................33 4.5.1 Influence of mixture composition and bituminous binders on void content.......33 4.5.2 Influence of mixture composition and bituminous binders on indirect tensile strength ..........................................................................................................................34 4.5.3 German mix design requirements.....................................................................36 4.5.4 Limits of inhomogeneity of pavement structure ................................................38 4.5.5 Effect of void content on ITS.............................................................................39 4.5.6 Influence of mixture composition and bituminous binders on CBR ..................39
5 Conclusions.....................................................................................................................41 6 References......................................................................................................................43 A Annex ................................................................................................................................1 AI. Detailed mix composition of test mix variations.............................................................1 AII. CBR results ...................................................................................................................2 AIII. Elastic modulus E (asphalt pavement design from the UK) ..........................................3
CEDR Call 2012: Recycling: Road construction in a post-fossil fuel society
1
Executive Summary Cold recycling techniques is a road construction method for road rehabilitation where a new base layer is built from existing road material. For in situ or in place recycling a cold recycler mills the existing road structure in a depth up to 30 cm. Bituminous (emulsion or foamed bitumen) and/or hydraulic binder (e. g. cement) as well as water are added to the milled road material and the resulting mixture is laid and compacted. According to the applied content of bituminous binder and hydraulic binder in the cold-recycling mix, the properties of the pavement materials range from stabilized unbound behaviour (low bitumen and cement contents), stiff, brittle properties (high contents of cementious binder) and flexible bound "asphaltic" properties (high bitumen content). According to the combination of cementious binder and bituminous binder contents applied, the resulting material properties are a mix of the given behaviours.
Resulting from the structure of the recovered pavement and of the milling depth, there may be different proportions of reclaimed asphalt, reclaimed cement concrete and reclaimed unbound material in the cold recycling base layer.
For cold recycling materials with comparably low bitumen content (≤ 2.5 % by mass) and even lower cementious binder content (≤1 % by mass) - so called bitumen stabilised material (BSM) the bitumen content of the milled road material can be considered for the mix design and therefore the activity of at least 50 % of the old, recovered bitumen is adopted. By setting the addition of hydraulic binders to zero, BSM can be easily adopted to raise the flexibility of the resulting layer. This procedure is for example applied according to Finish mix design specification where comparably soft binders are applied for cold recycling in order to meet specific requirements driven by local climate and soil properties. By varying bitumen and hydraulic binder content a broad range of properties can be adjusted. In Germany for instance, common pavement design aims for structures with significant increased bearing capacity. Therefore, strongly augmented bitumen contents (app. 4 % by mass) and cement contents (2 % by mass) are applied. German national standard is also motivated by a special purpose application of cold in situ recycling. Having used a lot of tar containing material in original road construction in the past, this method allows encapsulate those materials without any transportation and thus allows reliably immobilising PAH at the face. Another example is the practice used in the Czech Republic where bitumen with content around 2-4 % by mass is combined with cement content > 3.5 % by mass. This design for cold recycled asphalt pavements is used mainly for increasing the pavement bearing capacity.
The current study evaluates the RA binder activity for an "extreme" cold recycling material which contains compatibly high proportions of bituminous and hydraulic binder and is applied in central parts of Europe for reaching high bearing capacities of base layer as well as for encapsulation of tar-containing road materials.
In a laboratory study the sensitivity of these bitumen and cement stabilised, cold recycled mixtures to the composition of the milled granular material and its fluctuations on the resulting mechanical properties were evaluated. Therefore, cold recycling mixtures were produced with constant bitumen and cement content by varying the composition of the recovered road material (reclaimed asphalt, reclaimed cement concrete and reclaimed unbound material) in order to evaluate the sensitivity of the material performance on differing pavement structures. As a bias, it is evaluated if the binder of the reclaimed asphalt materials affects the properties of the new cold recycled material. In total, sixteen different cold recycling mixes were produced in laboratory by varying the compositions of the aggregates (reclaimed asphalt, concrete and unbound pavement). All mixtures were produced with the same grading, bituminous binder content of 4 % by mass and cement content of 2 % by mass according to German national guideline for cold-in-situ-recycling. Two different

CEDR Call 2012: Recycling: Road construction in a post-fossil fuel society
2
techniques for the addition of bituminous binder have been applied, which are both available for cold recycling in situ:
a) addition of foam bitumen produced by means of hot bitumen, air pressure and spontaneous water evaporation
b) addition of bitumen emulsion.
After static compaction, indirect tensile strength (ITS) after 7 and 28 days of conditioning on air and in water, water immersions as well as CBR values were measured. The tests showed a connection between reclaimed asphalt content and ITS results.
Following conclusions can be drawn from the laboratory test results for the two cold recycling mix types evaluated. Comparably high contents of bitumen and cement applied presumably to increase bearing capacity of the pavement base layer and encapsulating contaminants: • There is no difference in ITS for using reclaimed cement concrete or unbound material in
a cold recycling mixture with bituminous emulsion.
• The effect of granulate material composition affects the indirect tensile strength stronger for the analysed foamed bitumen mixtures (by factor 3) compared to the analysed cold recycling mixtures with bituminous emulsions (by factor 2).
• Foamed bitumen mixtures with reclaimed cement concrete and unbound material have different behaviour compared to the same mixtures mixed with bituminous emulsion. Differences for indirect tensile strengths were found. Whereas for the cold recycling mixtures with bituminous emulsions reclaimed cementious concrete material resulted in the same properties as crushed basalt aggregates, different strength was evaluated for the foamed bitumen mixtures. This can be explained by complete aggregate coating for the cold recycling mixtures with bituminous emulsions and incomplete, non-homogeneously binder coating for the foamed bitumen mixtures.
• The foamed bitumen mixtures reach higher CBR results compared to cold recycling mixtures with bituminous emulsions. This can be explained by incomplete bitumen coating in the foamed mixtures and therefore remaining internal friction. Internationally this property is assessed in more detail by triaxial tests in order to evaluate internal angle of friction.
• The different behaviour of the two mixes in ITS and CBR test indicate that one can adjust mechanical properties of cold recycling materials. Within these materials BSM material like the foam mix should be considered as their own class of material. From international experience (e.g. Australia, South Africa and the US) it is known that triaxial tests can deliver more precise result to the given question how to qualify their mechanical properties, especially if focusing on non-continuously bound mixtures.
Regarding to an activity of bitumen in reclaimed asphalt, the following statement can be concluded: • Increasing content of RA results in increased ITS. This can be interpreted as "activity" of
the RA binder which may be considered in mix design studies. Regarding the question about the effect of mix granulate on the material performance following recommendation can be drawn from the results of this study: • Cold recycling mixtures with reclaimed asphalt as mix granulate reach better
compactability and higher indirect tensile strengths compared to mix granulate composed from unbound or cementious bound material with same grading and water

CEDR Call 2012: Recycling: Road construction in a post-fossil fuel society
3
content. For the same aggregate grading, the composition of the non-RA granulate (reclaimed cementious material or unbound material) doesn't affect the pavement performance.
• An increased content of reclaimed asphalt in the mix granulate will decrease the CBR value and therefore the bearing capacity of the cold-recycled layer. Therefore, the effect of granulate composition is contrary compared to the indirect tensile strength.
• Curing in water immersion usually reduces the ITS but also may result in increasing strength due to remaining active hydraulic binders for the foamed bitumen mixtures.
• The RA content in the mix granulates affects directly the mechanical properties compactability, indirect tensile strength and CBR value.
• Foamed bitumen mixtures indicates higher sensitivity to RA content compared to emulsion mixtures.
It should be noted, that the cold recycled mixtures with reclaimed natural aggregates and concrete reclaimed material were not optimised in the mix properties which lead to the stated conclusions. But the results show that small non-homogeneities of pavement structure (e. g. repair patches) can be tolerated if the RA content of the mix granulate is still high enough. For larger pavement areas with non-homogeneous structural properties, the mix design shall be extra analysed and the mix properties adopted as necessary. The adoption of this procedure will result in lower water contents and presumably in lower void contents compared to this study.

CEDR Call 2012: Recycling: Road construction in a post-fossil fuel society
4
1 Introduction Nowadays on the basis of reduced availability of resources recycling of material in existing road constructions is a popular topic. In addition to hot recycling process, where reclaimed asphalt is given to new hot asphalt in the mixing plant, cold recycling processes are a possibility to answer these demands. Surface and structural rehabilitation need however to be distinguished: cold recycling thin top layers up to 150 mm of asphalt can be realized “in plant” by transporting milled material to a mobile cold recycling mixing plant or “in situ” using a cold recycler. When structural rehabilitation is needed deep in situ recycling applied to the depth in the pavement at which the problems occurs, thereby creating a new thick homogenous base layer that can be strengthened by the addition of stabilizing agents.
For this purpose countries in the world use bituminous emulsion or foamed bitumen – often in combination with a hydraulic binder – both is mixed in situ in the milled material and the cold recycling layer is arising. The existing pavement structure can be milled till 30 cm depth. So it is possible that the milled mixture consist of different composition in dependence of the structure of the existing pavement. After compaction, additional new top layers may be added where the pavement is to be significantly upgraded.
In general, there are two methods for cold recycling. Cold recycling in plant is a process where milled material is transported to a central plant (usually a mobile unit). For cold recycling in situ the milling, mixing and paving is done on the construction site by a recycling machine.
According to Grilli et al. (2012) and Tebaldi et al. (2012) two cold in situ recycling procedures are defined: • Cold in place recycling (CIR), where the top asphalt layers are milled. After addition of
virgin aggregates and bituminous binders the cold- recycled layer is paved on top of existing bound base layers.
• Full depth reclamation (FDR) is a technology where the recycler mills the whole pavement structure independently of bituminous layer, unbound and cement-treated courses. Bituminous emulsion or foamed bitumen as well as cement are added to the mix. “FDR technologies allow larger amount of material to be recycled, with considerable environmental advantages over CIR” (Grilli et al., 2012).
Figure 1 shows the connection of pavement structure and reclaimed material during FDR technology. In dependent of the milling depth and the road construction different aggregates from the existing road material are used for producing one new base layer. During mixing process different aggregates (reclaimed asphalt, reclaimed cement concrete and reclaimed unbound material) in dependence of the existing pavement structure may influence the characteristics of the new cold recycling base layer.
Because of fluctuations in pavement structure in cold recycling site, the actual composition of milled asphalt, cement, bound material on unbound layers can vary.
The aim of this study is to evaluate on the composition of milled granulate materials influencing the mechanical properties of cold recycling layers. By these results it can be estimated, in what extend inhomogeneities in road structures can be tolerated for in-situ cold recycling works. As a bias, the activity of the bitumen from the reclaimed asphalt can be assessed.

CEDR Call 2012: Recycling: Road construction in a post-fossil fuel society
5
unbounded material
wearing course
cement concrete
Figure 1. Milling depth
2 State of the Art 2.1 Mechanical properties of cold recycled materials and their influence
Cold recycling techniques can be specified as a set of road construction methods for road rehabilitation where a new base or binder layer is built from existing road material. For in situ or in place recycling a cold recycler mills the existing road structure in a depth up to 30 cm. Bituminous (emulsion or foamed bitumen) and/or hydraulic binder (e. g. cement) as well as water are added to the milled road material and the resulting mixture is laid and compacted. According to the applied content of bituminous binder and hydraulic binder in the cold-recycling mix, the properties of the pavement materials range from stabilized unbound behaviour (low bitumen and cement contents), stiff, brittle properties (high contents of cementious binder) and flexible bound "asphaltic" properties (high bitumen content). According to the bitumen contents applied, the resulting material properties are a mix of the given behaviours (compare Figure 2).
Resulting from the structure of the recovered pavement and of the milling depth, there may be different proportions of reclaimed asphalt, reclaimed cement concrete and reclaimed unbound material in the cold recycling base layer.
For cold recycling materials with comparably low bitumen content (≤ 2.5 % by mass) and even lower cementious binder content (≤1 % by mass) - so called bitumen stabilised material (BSM) the bitumen content of the milled road material can be considered for the mix design and therefore the activity of at least 50 % of the old, recovered bitumen is adopted. By setting the addition of hydraulic binders to zero, BSM can be easily adopted to raise the flexibility of the resulting layer. This procedure is for example applied according to Finish mix design specification where comparably soft binders are applied for cold recycling in order to meet special the requirements driven by local climate and soil properties. By varying bitumen and hydraulic binder content a broad range of properties can be adjusted. In Germany for instance, common pavement design aims for more stiff and brittle structures with significant

CEDR Call 2012: Recycling: Road construction in a post-fossil fuel society
6
increased bearing capacity. Therefore, strongly augmented bitumen contents (app. 4 % by mass) and cement contents (2 % by mass) are applied. German national standard is also motivated by a special purpose application of cold in situ recycling. Having used a lot of tar containing material in original road construction in the past, this method allows encapsulate those materials without any transportation and thus allows reliably immobilising PAH at the face.
Figure 2: conceptual behaviour of pavement materials (Collings et al. 2009)
Figure 3: difference between Hot Mix Asphalt and non-continuously-bound foamed bitumen
(Wirtgen 2012) Bitumen-dominant BSM inhibits flexible characteristics, whereas cement-dominant BSM is characterized by high strength and stiffness resulting in high bearing capacity (Grilli et al., (2012), Nkwoncam (2000). Bitumen stabilized materials are non-continuously bound materials with either foamed or emulsified bitumen as binders. They behave like granular materials with retained inter-particle friction but increased cohesion and stiffness. Bitumen is non-continuously dispersed in these materials. The addition of small amounts (up to 1 % by mass) of active filler such as hydrated lime or cement will significantly increase retained strength without affecting the flexibility of the layer. It is important to understand that BSM according to this definition are fundamentally different to normal hot-mix asphalt. BSM are less stiff than cemented materials but do have improved shear properties. The main mechanism of failure of BSM is permanent deformation and loading. BSMs with typical bitumen contents of less than 3 % by mass do not experience fatigue cracking because they are non-continuously-bound. Such non-continuous binding of the individual aggregate

CEDR Call 2012: Recycling: Road construction in a post-fossil fuel society
7
particles makes BSM different from all other pavement materials. The dispersed bitumen changes the shear properties of the materials significantly increasing the cohesion value whilst effecting little change to the internal angle of friction. A compacted layer of BSM will have a void content similar to that of a granular layer, not asphalt. BSMs are therefore granular in nature and are treated as such during construction (Collings et al., 2009; Wirtgen 2012).
Grilli et al. (2012) and Langhammer (1993) summarized positive effects from cement-bitumen-treated mixtures in high bearing capacity and “resistance to permanent deformation, avoiding premature cracking due to shrinkage” (Grilli et al., 2012). Loizos et al. (2012) identified non-linear elastic modulus of BSM with foamed bitumen by increasing the applied load during the tests. Collings et al. (2009) stated that also economic aspects have to be taken into account. As shown in Figure 2 very high bitumen and cement content of a BSM will increase moisture resistance on one hand and PD resistance on the other whilst high cement content reduces and high bitumen content increases flexibility. Therefore this field is marked as “presumed not economically viable”. Though, in many countries in Europe high binder contents are applied in order to achieve an encapsulation of hazardous substances in road materials. Therefore these cold recycling materials with high cement and bitumen contents are applied in road maintenance in order to avoid the generation and costly deposition of hazardous waste material by increasing the bearing capacity of these road materials.
2.2 Influence on mechanical properties
As mentioned before mechanical properties are influenced by type of binder, binder combinations and amount of binder content which characterized bitumen dominant or cement dominant mixtures. Furthermore Jenkins et al. (2012) describes that tensile strength is controlled by “grading, moisture content, density and confining pressure”. The mechanical properties are further influenced in the material in the milled pavement. “Because of the great variability in aggregate quality and composition, type and amount of recycling agents, recycled mixtures produced by Full Depth Reclamation can exhibit a wide range of mechanical behaviours” (Tebaldi et al., 2012).
Grilli et al. (2012) investigated the influence of reclaimed asphalt content on the mechanical properties of cement-treated mixtures and could categorized four cold-recycling families by varying binder agent type and dosage. Saleh (2012) investigate the characteristics of foam stabilised mixtures and the effects of gradation, mineral filler and bitumen source.
Langhammer (1998) classified the numerous parameters influencing the BSM performance into direct and indirect factors:
• direct factors (material caused) o milled road material
composition (asphalt, concrete, unbound material) grading binder content
o composition of cold recycled mixture cement content bituminous binder content water content
• indirect factors (caused by material and processing) o void content o bulk density

CEDR Call 2012: Recycling: Road construction in a post-fossil fuel society
8
Jenkins et al. (2012) evaluated the performance in their study for mixes with foamed bitumen and bituminous emulsion and developed recommendations for mix design.
Experiences show that different countries use different bituminous binders and they have different experience with those mixtures. Bituminous emulsion and foamed bitumen “are the most commonly used recycling agent” (Tebaldi et al., 2012). Experience has shown that the preference of the bituminous binder is very different. The reasons that Finland or similar northern European countries for instance uses foamed bitumen instead of bituminous emulsion are cost and transportation. Spain, Portugal or France prefer bituminous emulsion.
Figure 4: recommended grading envelopes for BSM (Wirtgen 2012)
Table 1: differences in grading envelopes for emulsion or foam bitumen stabilized BSM
(Wirtgen 2012) However, there is a difference in bitumen dispersion when applying emulsified or foamed bitumen for the production of BSMs. Foamed bitumen is during in-situ mixing process distributed exclusively to the finer particles, producing “spot-welds” of mastic bitumen droplets and fines whilst bitumen emulsion disperses preferentially amongst the finer particles, but not exclusively. There is also some cohesion to larger particles leading to a chemical bond between the bitumen and the aggregate promoted by the emulsifier. This is the reason for the minor difference in the recommended grading envelops for BSMs (Collings 2009), please refer to Figure 4 and Table 1.

CEDR Call 2012: Recycling: Road construction in a post-fossil fuel society
9
Langhammer (1998) and Nkwoncam (2000) recognized the problem, that road construction which are suitable for cold-recycling may vary in there construction and layer thickness. In order to evaluate the effect of irregular pavement structural properties (e. g. due to maintenance works, road widening) in this study the effect of varying composition of the granular materials is analyzed.
Iwanski and Chomicz-Kowalska (2013) did investigations of mechanical parameters of foam bitumen mixtures in cold recycling. They found a significant influence of foam bitumen and cement content on the air void content. Their results clearly indicate a correlation between the increase of bitumen content (2.0 up to 3.5 by 0.5 %) and a decrease of void content which varied in total in between 8 to 14.5 %, see Figure 5. Instead, Cement content variation does imply only little variations in void content where no clear tendency is to be observed.
Applying a ratio of ITSwet and ITSDry as TSR (Tensile strength retained) aims at evaluating the moisture susceptibility of the BSM. Meanwhile it will answer how tensile strength is influenced by different bitumen and active filler contents, see Figure 6.
Figure 5: influence of foam bitumen and cement content on void content [Iwanski 2013]
Figure 6: influence of FB (foam bitumen content) and C (cement) -content on the TSR (tensile
strength retained) [Iwanski 2013]

CEDR Call 2012: Recycling: Road construction in a post-fossil fuel society
10
3 Experimental work and laboratory test 3.1 Sample materials
3.1.1 Mix variations The aim of this study is to find out if the composition of milled materials influences the mechanical properties of cold recycling layers and, if there is an activity of the bitumen from the reclaimed asphalt. For BSM as an example cold recycling material type with predominant flexible properties (low bitumen content, no cement, low-viscosity bitumen) the activity of the RA binder is already included in some specification documents (e. g. Tiehallinto 2007). For the other extreme mix composition (high bitumen content, high bitumen viscosity, and cement addition) the RA binder influence on the mix properties is still not researched. In this study, the effect of RA content in the recycled granulate on the cold recycling mix performance will be analysed mixtures with bituminous emulsion and foamed bitumen as binders.
In order to address research questions, variable and fixed parameters must be set. All mix variations were prepared with the same binder content and the same aggregate grading.
So the focus in this case is varying following variables:
• Proportions of reclaimed asphalt, reclaimed cement and reclaimed unbound material • Bituminous binder type (foamed bitumen and bituminous emulsion).
Compositions of reclaimed road material milling depends on the one hand of the milling depth and on the other hand of the existing structure of road according to Figure 1. According to Langhammer (1998) and German mix Design standard (FGSV, 2005) cold recycling technique is adopted at lower traffic roads which contain asphalt layer thickness between 10 to 16 cm. Compared to worldwide state of the art this pavement design approach is tending to more rigid constructions. The corresponding pavement design structures are given in Figure 7 which can vary within a definite road section.
Asphalt surface course
Asphalt base course
Unbound material
Cement concrete
Figure 7. Asphalt pavement construction for cold recycling techniques (FGSV, 2012)

CEDR Call 2012: Recycling: Road construction in a post-fossil fuel society
11
Evaluating the role of the RA properties in a cold recycling mixture the amount of reclaimed asphalt is varied as described before. So in this study cold recycling mixtures with different composition of milled material are evaluated (Table 2).
In mix variations I, II, III one-source aggregates are applied. Mix variation I is the reference mix with maximum content of milled asphalt for which grading and binder contents were optimized in a mix-design study.
Mix variation II was produced by maximum of crushed cement concrete aggregates originating from a reclaimed concrete road. Due to the original grading of crushed concrete 50 % of crushed aggregates had to be added to meet the same grading properties as for mix variation I.
Mix variation III was mixed with virgin aggregates (basalt) to simulate reclaimed unbound layers in BSM. Mix variation Va, Vb and VI were produced with mixtures each from two of the three types of reclaimed material with the same proportions.
Mix variation IV and VII contains all three typed of reclaimed materials.
These mixture variations are prepared with foamed bitumen and bituminous emulsion for investigating influence of bituminous binder type.
Table 2: Scope of investigation – overview mixtures
Mix variations Reclaimed asphalt (RA)
Reclaimed cement concrete (RCC)
(Reclaimed) Unbound material (RUM)
I (RA) 100% - -
II (RCC) - 50% 50 %
III (RUM) - - 100%
IV (RA+RCC+RUM) 50% 25% 25% Va (RA+RUM) Vb (RA+RUM)
50% 75%
- -
50% 25%
VI (RCC+RUM) - 25% 75%
VII (RA+RCC+RUM+) 40% 20% 40%
3.1.2 Source materials The reclaimed asphalt material is obtained from the Hermann Wegener GmbH & Co. KG stockpile in Rhünda (Germany). Figure 8 shows the grading of the reclaimed asphalt particles.

CEDR Call 2012: Recycling: Road construction in a post-fossil fuel society
12
0,06
3
0,12
5
0,25 1 2
5,6 8
11,2 16
22,4
31,5 45
0
20
40
60
80
100
siev
e pa
ssag
es [%
by
mas
s]
sieves d [mm]
asphalt granulate
Figure 8. Grading of particle size for reclaimed asphalt.
The properties of the bitumen recovered from reclaimed asphalt are given in Table 3.
Table 3: Properties of Bitumen in reclaimed asphalt Penetration grade [1/10 mm] 23 Softening point R&B [°C] 63,5 Bitumen content in RA material [M.-%] 5,4
The reclaimed cement concrete was obtained from a jobsite section of a German motorway BAB A7, Bockenem. Figure 9 shows the grading of reclaimed cement concrete particles.
0,06
3
0,12
5
0,25 1 2
5,6 8
11,2 16
22,4
31,5 45
0
20
40
60
80
100
siev
e pa
ssag
es [%
by
mas
s]
sieves d [mm]
reclaimed cement concrete
Figure 9. grading for reclaimed cement.
For the unbound material basalt aggregate originating from Melato-quarry in Fritzlar are used.
As hydraulic binder Portland cement CEM I 42.5 N was added to each mixture in a percentage of 2.0 %. As cationic bituminous emulsion C60B1-BEM provided by Escher Straße GmbH, Gotha, was applied. This type of emulsion is especially produced for mixtures bound by bituminous emulsion (BEM) in Germany (FGSV, 2007) with following characteristics (Table 4):

CEDR Call 2012: Recycling: Road construction in a post-fossil fuel society
13
Table 4: characteristic for bituminous emulsion C Cationic emulsion 60 Bitumen content 60% by mass B Unmodified bitumen
bituminous emulsion
1 Class of breaking value Penetration grade @ 25° [1/10mm] < 100 Recovered
bitumen Softening point R&B [°C] ≥ 43 Bitumen with penetration grade 50/70 (provided by Shell) was used for production of foamed bitumen. The bitumen characteristics penetration grade and softening ring and ball are given in Table 5. Table 5: Binder properties of the bitumen used for foaming and the bitumen recovered from the
bituminous emulsion Foamed bitumen 50/70
(before foaming) Recovered bitumen in bituminous emulsion
Penetration grade [1/10mm] 65.7 78 Softening point R&B [°C] 49.5 46
3.1.3 Mix design The cold recycling mix was designed according to German mix Design standard (FGSV, 2005) indicating a comparably stiff material resulting in high bearing capacity (comparably stiff bitumen 50/70, high contents of cement and bitumen). According to this design guide, the mixtures must reach following requirements:
• For mixtures with bituminous emulsion: o content of fines (< 0.063 mm) between 2 % and 10 % by mass o content of aggregates < 2 mm: ≥ 20 % by mass
• for mixtures with foamed bitumen: o content of fines (< 0.063 mm) between 3 % and 12 % by mass o content of aggregates < 2 mm ≥ 25 % by mass.
In order to reach the requirements for the content of fines, 3,6 % of non-hydrated limestone filler was added to the reclaimed asphalt. The resulting grading is plotted in Figure 10. In order to evaluate the effect of aggregate type only on the mixture properties, all mix variations were composed according the same grading as shown in Figure 10.
For a first conservative approach according to German standard (FGSV 2005), the content of bitumen and cement was chosen also in accordance to Langhammer (1998) and Nkwoncam (2000). Therefore, following binder content were applied for mixes prepared in this study:
• bitumen content: 4 % (this results in an content of 6,4% of bituminous emulsion) • cement content: 2 %
These values are prescribed by German standard FGSV 2005 and indicates a cold-recycling mix composition aiming at high bearing capacity and encapsulating dangerous substances. Therefore, the mix analysed in this study is the other extreme composition of bituminous bound cold recycling material compared to the BSM as specified in Finish specification document (Tiehallinto 2007) which already considers an active role of RA bitumen (see

CEDR Call 2012: Recycling: Road construction in a post-fossil fuel society
14
Figure 2). Therefore the results of the study conducted cannot be generalised on all existing cold recycling mixtures.
0,06
3
0,12
5
0,25 1 2
5,6 8
11,2 16
22,4
31,5 45
0
20
40
60
80
100
siev
e pa
ssag
es [%
by
mas
s]
sieves d [mm]
asphalt granulate + limestone
Figure 10. Particle size distribution of reclaimed asphalt
Table 6 shows the composition for each mix variation, detailed compositions are given in annex AI.
Table 6: Mix composition of test mix variation
Mix variation RA RCC virgin aggregate limestone fillerI 96,4 3,6II 50,0 50,0III 100,0IV 48,2 25,0 25,0 1,8Va 48,2 50,0 1,8Vb 77,1 20,0 2,9VI 25,0 75,0VII 38,6 20,0 40,0 1,4
Mix variation RA RCC virgin aggregate limestone fillerI 96,4 3,6II 50,0 50,0III 100,0IV 48,2 25,0 25,0 1,8Va 48,2 50,0 1,8Vb 77,1 20,0 2,9VI 25,0 75,0VII 38,6 20,0 40,0 1,4
Foamed bitumen
Bituminous emulsion
The moisture of the BSM influences the compactability of the material. The water content affects the mixing properties especially of foamed bitumen stabilised mixtures. Wwater add em = wOFC – wair-dry – wem – 0.5 * PRB

CEDR Call 2012: Recycling: Road construction in a post-fossil fuel society
15
Wwater add em = percentage of water to be added for BSM with bituminous emulsion [%] wOFC = optimum fluid content [%] wair-dry = moisture content of air-dried mix variation [%] wem = water content from bituminous emulsion [%] PRB = percentage residual bitumen in emulsion [%]
According to German national standard (FGSV2005) wem and PRB can be set with 0 when using foamed bitumen. This recommendation was followed in this study.
However, international literature (Collings 2009, Wirtgen 2012) would recommend the following procedure when using foamed bitumen instead. W water add foam = 0,75 WOFC-W air dry Fluffpoint moisture - the moisture content that results in the maximum bulk volume of loose mineral aggregate during agitation – should be used as a target. This value ranges from 70 to 90% of the optimum moisture content. Therefore the targeted mixing moisture content when adding foamed bitumen is 75 % OFC.
Proctor test according to EN 18127 was applied to determine the water content for optimal compaction. The corresponding parameters are the optimum water content and Proctor density. The water content was evaluated for mix variation I (100 % RA) and kept constant for the other mix variations in order to simulate the effect happening, when the mix granulate composition significantly varies without special adoption of the mix design.
Figure 11 shows the results for dry density in dependence of the water content of the reference mix I (100 % RA).
A suitable water content of 7.8M.-% could be determined from the point of intersection of Proctor curve and the curve of 65 % of saturation.
1,95
1,97
1,99
2,01
2,03
2,05
2,07
2,09
2,11
2,13
2,15
0 2 4 6 8 10 12
dry
dens
ity
[g/c
m³]
water content [%]
dry density
dry density at Sr = 1,0
dry density at Sr = 0,65
Poly. (dry density)
Figure 11. results of proctor test
If varying pavement structures are known and one road site shows different associated pavement sections, than one mix design for each section with mostly homogeny pavement section should be evaluated. Therefore, if it is known and evaluated, that the pavement structure changes considerably, a optimum water content shall be evaluated for each known section.
In laboratory, the foamed bitumen was produced with Wirtgen WLB 10 S Laboratory plant (Figure 12).

CEDR Call 2012: Recycling: Road construction in a post-fossil fuel society
16
Figure 12. Wirtgen WLM30 pugmill mixer and WLB10S laboratory plant
A suitable foam quality is characterized by high expansion ratio and high half life time of the foam. The foam quality is influenced by:
• bitumen temperature (foam characteristics are improved by higher temperatures); • water content: higher foaming water content results in higher expansion ratio, but
decreasing half life; • bitumen pressure: low pressure reduces expansion ratio and half life.
According to Figure 13 following parameter were applied for foaming of 50/70 in this study:
• 4.5 M.-% water content; • 180°C bitumen temperature; • 5.5 bar bitumen pressure.
4%
5%
6%
0
5
10
15
20
25
30
35
0 5 10 15 20 25 30 35 40
Expa
nsio
n ra
tio [-
]
Half life [s]
ExpansionPoly. (Expansion)
optimum range
Figure 13. Foam characteristics
3.1.4 Sample preparation The BSM mix variations were mixed using a Wirtgen compulsory pugmill mixer WLM 30. After pre-mixing of aggregates and cement for 1 minutes, water is added to the mixture and mixed 1 minute additionally. After adding the binder emulsion or spraying the foamed bitumen into the mix, the mixing was produced for 1 minute until the aggregates and binder

CEDR Call 2012: Recycling: Road construction in a post-fossil fuel society
17
are distributed homogenously and the aggregates are fully covered. From the freshly-produced mix 9 cylindrical specimens (diameter 149.6 mm. height 80 mm) were compacted.
For compaction, a bottom loading plate is put into the compaction mould. The mixture was filled into the mould and covered by a top loading plate. After placing the mould into a static loading device, the load pistons are moved together up a compression force of 45.9 kN. Due to consolidation of the mix the force decreases. At a compression force of 44.7 kN the load pistons were moved together with 1.27 mm/min again up to a compression force of 45.9 kN. These cycles of consolidation and compaction were repeated 7 times.
stamp
stamping plate with drainage groove
cold recycling mixture
form of compaction
149,6 mm
300,
0 m
m
P
P
load piston
compaction mould
Stamping plate withdrainage groove
Figure 14. Form of compaction Ø 150 mm and stamping plate Ø 149. mm with four drainage
grooves for drainage (FGSV, 2005) The compacted specimens were stored in their moulds at r20°C, 80 % relative moisture for approximately 24 hours and demoulded afterwards.
3.1.5 Specimen curing The curing condition affects strength development in cold-recycled mixtures. Figure 15 presents the curing procedures applied for the 9 prepared specimens.
After compaction, the moulded specimens were stored in a climate control chamber at 20°C and 80% relative humidity for 1 day. After demoulding, the specimens were cured for additional 2 days in humid conditions (20°C, 80 % humidity). Afterwards 2 specimens were stored at room conditions for 4 days, 5 specimens at room conditions for 25 days. Two specimens were stored for 11 days at room conditions and afterwards 14 days immersed in water (20°C) (Figure 15).

CEDR Call 2012: Recycling: Road construction in a post-fossil fuel society
18
Immersed in water (20°C)
Roomconditions
20°C,
80% humidity
Compaction
1 daymoulded
2 days
25 days
CBR and IDT
4 days
IDT
11 days
14 days
IDT
demoulding
Figure 15. Curing procedure
3.2 Laboratory tests
3.2.1 Bulk density At the end of the dry curing procedure, the specimen mass and dimension (diameter, height) were measured. From these values the bulk density of conditioned specimens were calculated. For the immersed specimens, the bulk density was determined after 14 days of dry storage.
3.2.2 Indirect tensile strength test (IDT) The indirect tensile strength test (IDT) is applied to determine deformation behaviour of a mixture during tension. The specimen is temperature conditioned for 20 h at 5°C. Afterwards it is placed directly between an upper and lower timber plate and the bottom loading strip is raised with a rate of 50 mm/min until failure of the specimen. In this study, test conditions according to EN 13286-42 were applied (compare Figure 16).
60°60°
d0
d0
d60d60
Figure 16. Indirect Tensile Strength Test, loading mode (left), broken specimen after stress
(Srinivasan, 2004)
CEDR Call 2012: Recycling: Road construction in a post-fossil fuel society
19
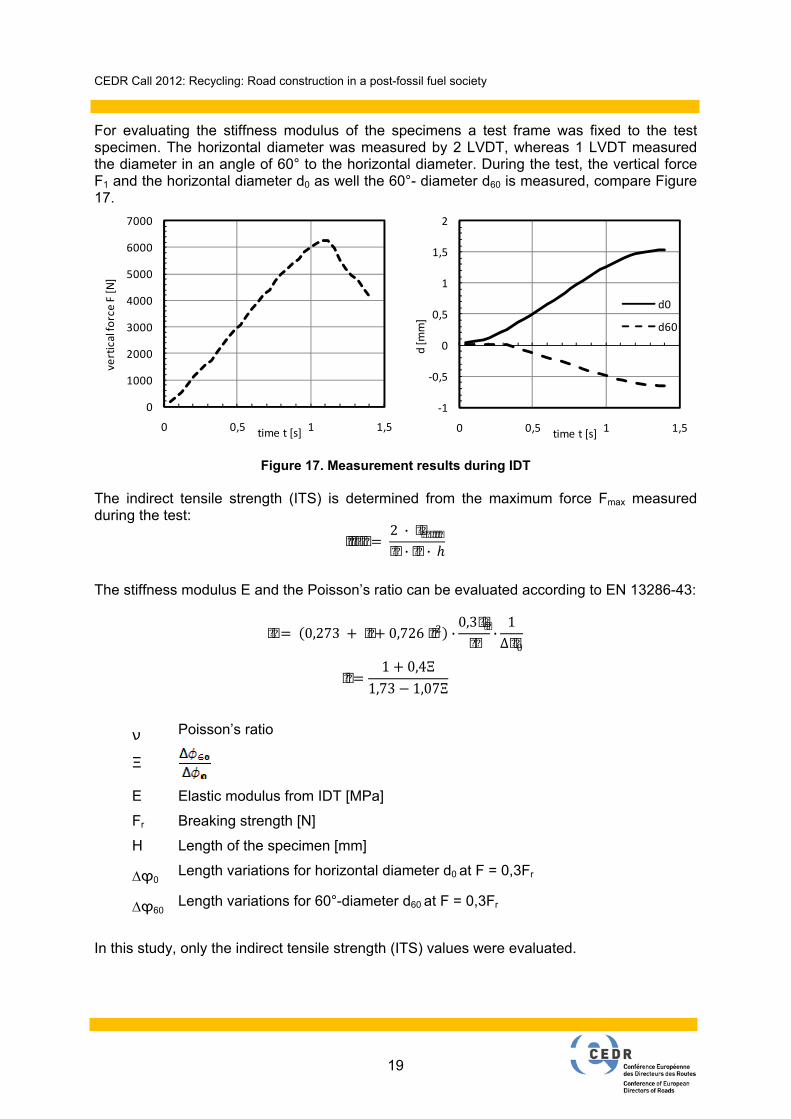
For evaluating the stiffness modulus of the specimens a test frame was fixed to the test specimen. The horizontal diameter was measured by 2 LVDT, whereas 1 LVDT measured the diameter in an angle of 60° to the horizontal diameter. During the test, the vertical force F1 and the horizontal diameter d0 as well the 60°- diameter d60 is measured, compare Figure 17.
‐1
‐0,5
0
0,5
1
1,5
2
0 0,5 1 1,5d
[mm
]time t [s]
d0
d60
0
1000
2000
3000
4000
5000
6000
7000
0 0,5 1 1,5
vert
ical
forc
e F
[N]
time t [s]
Figure 17. Measurement results during IDT The indirect tensile strength (ITS) is determined from the maximum force Fmax measured during the test: 2 ·· ·
The stiffness modulus E and the Poisson’s ratio can be evaluated according to EN 13286-43: 0,273 0,726 2 · 0,3 · 1∆ 0
1 0,4Ξ1,73 1,07Ξ
ʋ Poisson’s ratio
Ξ
E Elastic modulus from IDT [MPa]
Fr Breaking strength [N]
H Length of the specimen [mm]
∆ϕ0 Length variations for horizontal diameter d0 at F = 0,3Fr
∆ϕ60 Length variations for 60°-diameter d60 at F = 0,3Fr
In this study, only the indirect tensile strength (ITS) values were evaluated.

CEDR Call 2012: Recycling: Road construction in a post-fossil fuel society
20
3.2.3 CBR In several pavement design procedures, California Bearing Ratio (CBR) is applied for estimating the bearing capacity of unbound and hydraulically stabilised soils and base layers. Therefore, CBR tests according to EN 13286-47 were applied on the cold recycled mix variations. In CBR tests, the cylindrical specimen (diameter 150mm) is filled into a mould. A piston (diameter 50mm) is forced into the specimen with a velocity of 1.27 mm/min. The force is measured during the test. For piston penetrations of 2.5 and 5.0 mm the force is recorded and evaluated against values optimal from a standard base material (Figure 18). The CBR value is calculated as the quotient of the measured force divided by the force obtained from the standard base material: max 2,513,2 ; 520
Figure 18. Example for force-penetration-curve with correction of point of origin
The CBR value of soil or unbound base materials are applied in several pavement design methods in order to include the soil and/or base material properties for the bearing capacity. For example, UK pavement design allows the calculation of layer modulus E [MPa] from CBR results (Brown, 2013). The CBR values are converted into elastic modulus E and four classes for bearing capacity are distinguished (Table 7):
64.06.17 CBRE ⋅= [MPa]
Table 7: Classes for E (Huang, 1993) Class 1 50 MPa Capping Only (<20 msa)
Class 2 100 MPa Granular Subbase (< 80 msa)
Class 3 200 MPa Weak Cemented Subbase (including hydraulically bound)
Class 4 400 MPa Strong Cemented Subbase (including hydraulically bound)
In German standards (FGSV, 2007) a minimum threshold value for soil stabilisation of CBR ≥ 40% is defined.

CEDR Call 2012: Recycling: Road construction in a post-fossil fuel society
21
4 Results of the laboratory tests and discussion In this section the results of the laboratory tests are summarised. Firstly, the void content is discussed, followed by indirect tensile strength tests (ITS) and the California bearing ratio test (CBR). The diagrams indicate the arithmetic mean evaluated for the test results as well as the range of single values measured. All single test results are synthesizes in Annex II.
Whereas all tests were conducted with two or three repetitions, for several tests only one single IDT result is displayed for some mix variations, reason is a malfunctioning crack detection which was indicated during test evaluation. For a number of specimens, the IDT stopped without a clear failure of the specimen due to force fluctuations which were interpreted as crack by the test device. Therefore, the tests were repeated on the non-cracked specimens. These tests are identified in the test result tables. Note that the test results obtained on repeated conditioning are very similar to the results obtained after the original conditioning time.
4.1 Void content
From the bulk density, which was measured on the specimens before temperature conditioning for test (in case of dry conditioned specimen after 7 and 28 days of curing) or water immersion (for the water-conditioned specimens) after 14 days of dry curing, and the maximum density calculated from the constituent densities and material composition, the voids content V was calculated. Because the specimens were not dried to constant mass and the water contents were not evaluated, the void contents are overestimated slightly.
The void contents evaluated for the specimens produced from cold recycled mixtures with bituminous emulsion are plotted in Figure 19.
Mix variation I, composed of reclaimed asphalt only, reaches the lowest void content with 14 % and therefore was easier to compact compared to the other mix variations. The other mix variations can be sorted to two groups of void contents. Mix variations II, III and VI have the highest void contents of about 25 %. These mix variations don’t contain any reclaimed asphalt. The void contents calculated for mix variations IV, Va and Vb composed of half or more of reclaimed asphalt reach void contents of around 23 %. Mix variation VII lies with 24 % in between the later groups and contain 40 % of reclaimed asphalt. Whereas the content of reclaimed asphalt seems to have the largest influence on compactibility and therefore on the void content reached, the results doesn't show significant differences between cold recycling mixtures with bituminous emulsion composed of natural aggregates and reclaimed cement concrete. Please note, that optimum water content was evaluated for the reference mix (I) only and kept constant for all other mix granulate compositions evaluated. This explains that these void contents are comparably high according to recommended values given by e.g. Colling et al. (2009), Wirtgen (2012). For BSM mixes void contents should thereafter not exceed 15%, acceptable is even the interval 12-16 %. Compaction as well as the high added water amount of 7.8% in case of foam mixes can be assumed to strongly influence the void content in the observed way.
The calculated void contents for the specimens compacted from foamed bitumen mixtures are shown in Figure 20. For the specimens which were cured dry for 14 and 28 days the void contents allow to separate three groups of mix variations. Mix variation I (100 % RA) and Vb (75 % RA) reaches the lowest void contents of 14 %. Second group contain mix variations IV, Va and VII with void contents of 19 %. These mix variations are composed of 50 (40) % of RA. Mix variations II, III and VI without any RA indicate the highest void content of 23 %.

CEDR Call 2012: Recycling: Road construction in a post-fossil fuel society
22
0,0
5,0
10,0
15,0
20,0
25,0
30,0
I II III IV Va Vb VI VII
void
s [%
]
mix variatons (bituminous emulsion)
ITS7daysITS14daysITS28days
I 100/0/0II 0/50/50III 0/0/100IV 50/25/25Va 50/0/50Vb 75/0/25VI 0/25/75VII 40/20/40
RA / RCC / RUM
Figure 19. Void contents of specimens compacted from mixtures with bituminous emulsion
0,0
5,0
10,0
15,0
20,0
25,0
30,0
I II III IV Va Vb VI VII
void
s [%
]
samples (foamed bitumen)
ITS7daysITS14daysITS28days
I 100/0/0II 0/50/50III 0/0/100IV 50/25/25Va 50/0/50Vb 75/0/25VI 0/25/75VII 40/20/40
RA / RCC / RUM
Figure 20. Void contents of specimens compacted from foamed bitumen mixtures
Significant differences between the void contents after 7days, 14days and 28 days of dry curing can be observed. The specimens have differences in water content which may result in differences of estimated void contents. The water content of the specimens was not measured.
0,0
5,0
10,0
15,0
20,0
25,0
30,0
I II III IV Va Vb VI VII
void
s [%
]
mix variations
foamed bitumen
bituminous emulsion
I 100/0/0II 0/50/50III 0/0/100IV 50/25/25Va 50/0/50Vb 75/0/25VI 0/25/75VII 40/20/40
RA / RCC / RUM
Figure 21. Comparison of void contents after 28days from bituminous emulsion and foamed
bitumen mixtures

CEDR Call 2012: Recycling: Road construction in a post-fossil fuel society
23
If comparing void contents ITS28days for specimens from bituminous emulsion and foamed bitumen, higher results for foamed bitumen mixtures can be recognized, so mixtures with bituminous emulsion could be compacted more easily (Figure 21). Anyway the observed void contents are far beyond threshold values for cold recycling mixes as stated before. For known variation of the pavement composition of longer pavement sections, for each section a mix design is recommended in order to apply optimum contents added water and additive materials during in-situ stabilisation process.
4.2 Results of indirect tensile strength (ITS) tests
4.2.1 ITS of emulsion mixtures Table 8 presents the results of indirect tensile strength tests of the specimens compacted from cold recycling mixtures with bituminous emulsions and tested after 7 days (ITS7days) of dry conditioning. For each specimen, the bulk density and ITS are given. The mean for two tests are further used for the test interpretation. Note, that for several tests the failure detection did not work properly (specimens are marked by *), so for most mix variations only one valid test results will be discussed.
Figure 22 presents the results of ITS for specimens mixed with bituminous emulsion after 7 days of dry conditioning.
Table 8: ITS results for emulsion mixtures (ITS7 days) (T = 5 °C)
Single value Average Single value AverageE_I1 2,213 0,757
E_I2*E_II1*E_II2 2,086 0,559
E_III1 2,279 0,575E_III2*E_IV1*E_IV2 2,172 0,709E_Va1 2,187 0,619
E_Va2*E_Vb1*E_Vb2 2,323 0,487E_VI1 2,178 0,594E_VI2E_VII1 2,197 0,592E_VII2 2,211 0,525
*no value because false detection of test device
0,757
0,559
2,200
2,315
2,176
2,204
ITS7days [MPa]
0,575
0,487
Bulk densitiy
2,245
2,115
2,269
2,180
0,594
0,559
0,709
0,619
IV
Va
Vb
VI
VII
III
Emulsionmix variations
I
II
The results for mix variations with bituminous emulsion for indirect tensile strength are obviously affected by mixture compositions. In comparison between the first three mix variations – mix variations with the maximum of reclaimed asphalt (I), reclaimed cement concrete (II) and reclaimed unbound material (III) – mix variation I reach after 7 days the highest result for ITS with ITS7days= 0.757 N/mm². Results for mix variations II and III have approximately the same level as well as mix variation VI (ITS7days = 0.599, ITS7days = 0.575 N/mm², ITS7days = 0.594). In this case there is no difference between the properties of reclaimed cement concrete and unbound material for a cold recycling mixture with emulsion used as a binder.

CEDR Call 2012: Recycling: Road construction in a post-fossil fuel society
24
0,000
0,200
0,400
0,600
0,800
1,000
1,200
1,400
1,600
I II III IV Va Vb VI VII
indi
rect
tens
ile s
tren
gth
ITS 7
days
[N/m
m²]
mix variations (bituminous emulsion)
I 100/0/0II 0/50/50III 0/0/100IV 50/25/25Va 50/0/50Vb 75/0/25VI 0/25/75VII 40/20/40
RA / RCC / RUM
Figure 22. ITS after 7 days (dry conditions) for bituminous emulsion (T = 5 °C)
In Figure 23 the same test results are sorted according to the content of RA in the mix variation mix. All mix variations containing RA of varied percentage are coloured in red, whereas mix variations without RA are coloured in grey. Further the content of RA / RCC / virgin aggregates for each mix variation is added to the test results.
For the red result bars, it can be observed in tendency, that a decreasing content of RA in the mix composition will result in decreasing ITS7days values. Though, the mix variation Vb containing 75 % of RA does not fit into this line. Here it has to be considered that for most mix variations only one test result could be used for test evaluation. The mix variations without RA show similar ITS results independently from their actual composition of reclaimed cementious concrete or crushed aggregates.
100/0/0
75/0/25
50/25/25
50/0/5040/20/40
0/50/500/0/100
0/25/75
0,000
0,200
0,400
0,600
0,800
1,000
1,200
1,400
1,600
I Vb IV Va VII II III VI
indi
rect
tens
ile s
tren
gth
ITS 7
days
[N/m
m²]
mix variations (bitumen emulsion)
Figure 23. ITS results for emulsion mixtures after 7 days of conditioning, sorted according to the RA content (T = 5 °C)
The results of ITS obtained for specimens after 28 days of dry conditioning are summarised in Table 9. Again for a specific number of tests the failure detection of the test device malfunctioned. For these specimens, the indirect tensile strength tests were repeated on the same specimen, which did not crush at the first test. The test repetition was conducted after

CEDR Call 2012: Recycling: Road construction in a post-fossil fuel society
25
37 days of dry curing (marked with**). The ITS results obtained fit well to the results obtained on the specimens tested originally after 28 days and therefore are included to the test evaluation. The values are marked in Table 9.
In Figure 24 the mean values of ITS calculated from three single test results as well as their value range are plotted. For mix variation I (100 % RA) as well as for mix variation Vb (75 % RA) the highest ITS results with values > 1.3 MPa are obtained. Mix variations IV, Va and VII prepared with 50 (40) % of RA still reach ITS higher than 1.0 MPa. The mix variations II, III and VI which doesn't contain RA indicate comparably low ITS results of about 0.7 MPa.
Table 9: ITS results for emulsion mixtures (ITS28 days) (T = 5 °C)
Single value Average Single value AverageI5 2,262 1,355I6 2,262 1,358I7 2,243 1,416II5 2,033 0,568II6 2,087 0,779II7 2,037 0,734
III5** 2,210 0,777III6 2,209 0,648
III7** 2,225 0,707IV5 2,093 1,105IV6 2,160 1,021IV7 2,147 1,257Va5 2,204 1,026
Va6** 2,234 1,154Va7** 2,222 1,063
Vb5 2,270 1,359Vb6** 2,275 1,430Vb7** 2,296 1,592
VI5 2,172 0,768VI6 2,127 0,700VI7 2,127 0,728VII5 2,181 1,086VII6 2,170 1,062VII7 2,151 1,100
**test repetition after 37 days
2,215
2,133
2,220
2,280
2,142
2,167
III
IV
Va
Emulsion Bulk densitiy ITS28days [MPa]mix variations
I
II
1,376
0,6942,052
Vb
1,083
0,711
1,128
1,109
1,460
0,732VI
VII
2,255
0,000
0,200
0,400
0,600
0,800
1,000
1,200
1,400
1,600
I II III IV Va Vb VI VII
indi
rect
tens
ile s
tren
gth
ITS 2
8day
s[N
/mm
²]
mix variations (bituminous emulsion)
I 100/0/0II 0/50/50III 0/0/100IV 50/25/25Va 50/0/50Vb 75/0/25VI 0/25/75VII 40/20/40
RA / RCC / RUM
Figure 24. ITS after 28 days (dry conditions) for bituminous emulsion (T = 5 °C)

CEDR Call 2012: Recycling: Road construction in a post-fossil fuel society
26
In Figure 25, the mean values for ITS are plotted sorted according to their content of RA. As already observed for the ITS measured after 7 days of conditioning, again a decreasing content of RA will result in decreasing ITS values. When comparing the results obtained on mix variations without RA (II, III and VI) it can be concluded that the actual composition of crushed aggregates and reclaimed concrete does not affect the ITS results obtained.
100/0/075/0/25
50/25/2550/0/50
40/20/40
0/50/500/0/100
0/25/75
0,000
0,200
0,400
0,600
0,800
1,000
1,200
1,400
1,600
I Vb IV Va VII II III VI
indi
rect
tens
ile s
tren
gth
ITS 2
8day
s[N
/mm
²]
mix variations (bituminous emulsion)
Figure 25. Results for bituminous emulsion sorted according to the RA content (T = 5 °C)
4.2.2 ITS of foamed bitumen mixtures The results obtained in indirect tensile strength tests on specimens compacted from mixtures with foamed bitumen after 7 days of dry conditioning are summarised in Table 10. Again, several single test values (on specimens marked with *) could not be used for test interpretation due to malfunctioning crack detection of test device.
Table 10: Overview results foamed bitumen (ITS 7 days) (T = 5 °C)
Single value Average Single value AverageS_I1*S_I2 2,242 0,825S_II1 2,088 0,439S_II2 2,031 0,471
S_III2 (S_III1) 2,162 0,303S_III3 (S_III2) 2,146 0,332
S_IV1*S_IV2 2,145 0,508S_Va1 2,241 0,400S_Va2 2,184 0,476S_Vb1 2,244 0,707S_Vb2 2,175 0,606S_VI1 2,061 0,334S_VI2 2,094 0,398S_VII1 2,154 0,580S_VII2 2,153 0,545
*no value because false detection of test device
mix variations
0,508
0,438
2,210
Foames bitumen Bulk densitiy ITS7days [MPa]
2,113
2,060
2,154
2,160
2,213
Vb
I
II
III
IV
Va
0,657
0,366
0,563
2,077
2,154
0,825
0,455
0,318
VI
VII
The mean values and for the mix variations with two valid ITS results their range are plotted in Figure 26. The maximum ITS after 7 days of conditioning is obtained for the mix variation I

CEDR Call 2012: Recycling: Road construction in a post-fossil fuel society
27
(100 % RA). When sorted according to the content of RA (see Figure 27), again the effect of RA content on the reached ITS as already observed for the cold recycling mixtures with bituminous emulsions can be confirmed for the foamed bitumen mixtures.
I II III IV Va Vb VI VII0,000
0,200
0,400
0,600
0,800
1,000
1,200
1,400
1,600
mix variations (foamed bitumen)
indi
rech
t ten
sil s
tren
gth
ITS 7
days
[N/m
m²]
I 100/0/0II 0/50/50III 0/0/100IV 50/25/25Va 50/0/50Vb 75/0/25VI 0/25/75VII 40/20/40
RA / RCC / RUM
Figure 26. ITS after 7 days (dry conditions) for foamed bitumen (T = 5 °C)
100/0/0
75/0/25
50/25/25/50/0/50
40/20/400/50/50
0/0/100 0/25/75
I Vb IV Va VII II III VI0,000
0,200
0,400
0,600
0,800
1,000
1,200
1,400
1,600
mix variations (foamed bitumen)
indi
rech
t ten
sil s
tren
gth 7
days
[N/m
m²]
Figure 27. Results for foamed bitumen sorted according to the RA content (T = 5 °C)
The results of ITS after 28 days of dry conditioning are summarised in Table 11 and plotted as mean values and value range in Figure 28. For these mix variations, only one test for mix variation I had to be repeated after 37 days (value is marked with **). Again, mix I reaches the highest ITS results, followed by mix variation IV.

CEDR Call 2012: Recycling: Road construction in a post-fossil fuel society
28
Table 11: Overview results foamed bitumen (ITS28 days) (T = 5 °C)
Single value Average Single value AverageI5** 2,234 1,126
I6 2,226 1,138I7 2,204 1,235II5 2,012 0,576II6 1,981 0,589II7 1,979 0,499III6 2,085 0,304III7 2,109 0,486III8 2,102 0,332IV5 2,136 0,961IV6 2,140 0,891IV7 2,143 0,944Va5 2,147 0,555Va6 2,101 0,553Va7 2,113 0,604Vb5 2,132 0,700Vb6 2,126 0,760Vb7 2,163 0,802VI5 2,029 0,371VI6 2,043 0,357VI7 2,021 0,342VII5 2,146 0,632VII6 2,120 0,595VII7 2,112 0,573
**test repetition after 37 days
Foamed bitumen Bulk densitiy ITS28days [MPa]mix variations
III 2,099 0,374
IV 2,140 0,932
I 2,221 1,166
II 1,991 0,555
VI 2,031 0,357
VII 2,126 0,600
Va 2,120 0,571
Vb 2,140 0,754
0,000
0,200
0,400
0,600
0,800
1,000
1,200
1,400
1,600
I II III IV Va Vb VI VII
indi
rect
tens
ile s
tren
gth
ITS 2
8day
s[N
/mm
²]
mix variations (foamed bitumen)
I 100/0/0II 0/50/50III 0/0/100IV 50/25/25Va 50/0/50Vb 75/0/25VI 0/25/75VII 40/20/40
RA / RCC / RUM
Figure 28. ITS after 28 days (dry conditions) for foamed bitumen (T = 5 °C)
After sorting the results according to the RA content the clear decrease of ITS with decreasing RA content as observed for the bituminous cold recycling mixtures with bituminous emulsions cannot be observed. Especially for mix variation IV with 50 % of RA the ITS is significantly higher compared to mix variation Va, also prepared with 50 % RA and even mix variation Vb (75 % RA).

CEDR Call 2012: Recycling: Road construction in a post-fossil fuel society
29
For foamed bitumen mixtures after 28 days of conditioning the content of reclaimed cementious concrete (RCC) seems to affect the results. Mix variations II (50 % RCC) reaches significantly higher ITS results compared to mix variation III (0 % RCC). Same observation can also be made for mix variations with reclaimed asphalt when comparing mix variation IV (25 % RCC) with mix variation Va (0 % RCC), where again the higher RCC content results in higher strength values.
100/0/0
75/0/25
50/25/25
50/0/50
40/20/40
0/50/500/0/100
0/25/75
0,000
0,200
0,400
0,600
0,800
1,000
1,200
1,400
1,600
I Vb IV Va VII II III VI
indi
rect
tens
ile s
tren
gth 2
8day
s[N
/mm
²]
mix variations (foamed bitumen)
Figure 29. Results for foamed bitumen sorted (T = 5 °C)
4.2.3 Comparison of emulsion mixtures and foamed bitumen mixtures If comparing ITS for specimens of mixtures with bituminous emulsion and foamed bitumen generally higher strength values can be observed for cold recycling mixtures with bituminous emulsions both after 7 and 28 days of dry curing (Figure 30 and Figure 31). Only for the indirect tensile strength values obtained after 7 days of dry curing, mix variations I and Vb, representing mixes with highest RA content the strength of foamed bitumen mixtures is higher compared to emulsion mixtures.
Figure 30. Comparison of ITS from bituminous emulsion and foamed bitumen mixtures after 7 days of curing (T = 5 °C)

CEDR Call 2012: Recycling: Road construction in a post-fossil fuel society
30
Figure 31. Comparison of ITS from bituminous emulsion and foamed bitumen mixtures after 28
days of curing (T = 5 °C)
4.3 Water susceptibility
Influence of curing conditions are investigated according to German standards where differences between ITS after 28 days under dry conditions and ITS after 28 days under a combination of dry and wet condition (14 days dry/14 days wet) are measured.
Table 12 and Table 13 presents the results of bulk density, ITS as well as elastic modulus for bituminous emulsion mixtures and foamed bitumen mixtures. The average value (mean value) of results shown in the diagrams is calculated by results of two specimens. In first measurement no value could be detected for mix variations marked with ***. The test repetition was conducted after 24 days (12 days under dry conditions/ 12 days under dry conditions marked by **). The repetition of 14 days of dry and wet curing was not possible because of bulk holiday closure of the research institution.
Table 12: Overview results bituminous emulsion (ITS14/14days under dry/wet conditions)
Single value Average Single value AverageE_I3 2,278 1,31
E_I4*** 2,272 0,564E_II3 2,099 0,605E_II4 2,113 0,707E_III3 2,218 0,6E_III4 2,225 0,68E_IV3 2,151 1,016E_IV4 2,182 0,978
E_Va3*** 2,210 0,509E_Va4*** 2,242 0,294E_Vb3*** 2,294 0,46E_Vb4*** 2,305 0,369
E_VI3 2,131 0,679E_VI4 2,171 0,72E_VII3 2,200 0,932E_VII4 2,191 0,891
*** test repetition after 24 days
2,221
2,275
Emulsion Bulk densitiy
II
IV
2,151
2,167
2,226
Vb
0,656
III 0,640
ITS 14/14 [MPa]mix variations
I 0,937
2,106
0,415
VI 0,700
0,997
Va 0,402
2,300
0,912VII 2,196
Difference in ITS between the two storage condition is given in Figure 32 for mixtures with bituminous emulsion and mixtures with foamed bitumen (Figure 33).

CEDR Call 2012: Recycling: Road construction in a post-fossil fuel society
31
Bars in blue present the values for the combination of dry and wet condition. Furthermore the percentage between these results and results after dry condition are given in the chart.
Mixtures with bituminous emulsion as binder agent show a decrease in ITS after dry/wet conditions. It is also for further discussion that for all mixes including RA & RCC or RA & RUM the difference is approximately > 10 %.
7,1%
5,4% 9,9%
11,6% 13,5%
18,2%
4,4%
15,8%
0,000
0,200
0,400
0,600
0,800
1,000
1,200
1,400
1,600
I II III IV Va Vb VI VIIindi
rect
tens
ile s
tren
gth
ITS 1
4/14
days
[N/m
m²]
mix variations (bituminous emulsion)
ITS28days dry ITS28days wet I 100/0/0II 0/50/50III 0/0/100IV 50/25/25Va 50/0/50Vb 75/0/25VI 0/25/75VII 40/20/40
RA / RCC / RUM
Figure 32. ITS after dry conditions in comparison to dry/wet conditions for bituminous
emulsion For foamed bitumen mixtures the smallest decrease of ITS is recognized for mix variation II and III (Figure 33). For mix variation Va, Vb, VI and VII it is seen, that the tensile strength increase after conditioning/curing specimens under dry/wet conditions independent of mixture containing reclaimed asphalt or not.
Table 13: Overview results foamed bitumen (ITS 28 days under dry/wet conditions)
Single value Average Single value AverageS_I3 2,259 1,192S_I4 2,267 0,883S_II3 2,044 0,542S_II4 2,042 0,549S_III4 2,112 0,425S_III5 2,105 0,307S_IV3 2,118 0,804S_IV4 2,148 0,791S_Va3 2,174 0,615S_Va4 2,169 0,646S_Vb3 2,164 0,830S_Vb4 2,157 0,812S_VI3 2,030 0,416S_VI4 2,055 0,403S_VII3 2,009 0,648S_VII4 2,096 0,622
mix variations
I 1,038
Foamed bitumen Bulk densitiy ITS 14/14 [MPa]
2,263
0,798
Va 0,631
0,546
III 0,366
2,043II
2,171
2,108
2,133IV
VII 2,052 0,635
0,821
VI 2,043 0,410
2,161Vb

CEDR Call 2012: Recycling: Road construction in a post-fossil fuel society
32
11,0%
1,7%
2,1%
14,4%
-10,5%
-8,9%
-14,8%
-5,8%
0,000
0,200
0,400
0,600
0,800
1,000
1,200
1,400
1,600
I II III IV Va Vb VI VII
indi
rect
tens
ile s
tren
gth
ITS 1
4/14
days
[N/m
m²]
mix variations (foamed bitumen)
ITS28days dry ITS28days wet I 100/0/0II 0/50/50III 0/0/100IV 50/25/25Va 50/0/50Vb 75/0/25VI 0/25/75VII 40/20/40
RA / RCC / RUM
Figure 33. ITS after dry conditions in comparison to dry/wet conditions for foamed bitumen
4.4 Results of CBR tests
4.4.1 Emulsion mixtures The CBR values measured on the compacted cold recycling mixtures with bituminous emulsions after 28 days of dry curing are plotted in Figure 34. Single values are given in annex AII.
The mix variations can be classified in three groups of CBR values. Mix variation II, III and VI (without any RA) reach CBR values above 150 %. Results for mix variations IV, Va and VII with RA contents between 25 % and 40 % reach CBR values of about 120 %, whereas for mixes I and Vb with high contents of RA comparably low CBR values were measured (75-100%).
0
50
100
150
200
250
300
I II III IV Va Vb VI VII
CB
R-v
alue
[%]
mix variations (bituminous emulsion)
I 100/0/0II 0/50/50III 0/0/100IV 50/25/25Va 50/0/50Vb 75/0/25VI 0/25/75VII 40/20/40
RA / RCC / RUM
Figure 34. CBR values of specimens compacted from bitumen mixtures
4.4.2 Foamed bitumen mixtures The CBR value evaluated for the specimens produced from emulsion mixtures are plotted in Figure 35. All measured CBR values are higher than 100 %. Again, the mix variations without

CEDR Call 2012: Recycling: Road construction in a post-fossil fuel society
33
any RA (II, III and VI) show high CBR values ≥ 200 %. Furthermore it is possible to group mixes IV, Va and VII to CBR values between 150 to 200% and mixes I and Vb in a third group (CBR value100 – 150 %).
0
50
100
150
200
250
300
I II III IV Va Vb VI VII
CB
R-v
alue
[%]
mix variations (foamed bitumen)
I 100/0/0II 0/50/50III 0/0/100IV 50/25/25Va 50/0/50Vb 75/0/25VI 0/25/75VII 40/20/40
RA / RCC / RUM
Figure 35. CBR values of specimens compacted from foamed bitumen mixtures
4.4.3 Comparison of CBR results obtained from emulsion and foamed bitumen mixtures
If comparing CBR for specimens from bituminous emulsion and foamed bitumen generally significantly higher bearing capacity can be recognized for foamed bitumen mixtures (Figure 36).
0
50
100
150
200
250
300
I II III IV Va Vb VI VII
CB
R-v
alue
[%]
mix variations
bituminous emulsion
foamed bitumen
I 100/0/0II 0/50/50III 0/0/100IV 50/25/25Va 50/0/50Vb 75/0/25VI 0/25/75VII 40/20/40
RA / RCC / RUM
Figure 36. Comparison of CBR from bituminous emulsion and foamed bitumen mixtures
4.5 Discussion
4.5.1 Influence of mixture composition and bituminous binders on void content As shown in section 4.1, the composition of the granular material in the cold recycling mixture has a large effect on the void content estimated from bulk and maximum density measurements on ITS specimens, despite the same grading of the aggregates. One reason

CEDR Call 2012: Recycling: Road construction in a post-fossil fuel society
34
is that all mix variations were produced with a constant water content which was estimated for mix variation I. As the lowest void content was measured for this mix variation, it can be argued, that the other mixtures may need other water contents for optimum compactability. Though, for this study, the resulting differences in mixture performance for constant mix designs but changing granular material composition as occurring in non homogeneous pavement structures were in focus of research.
4.5.2 Influence of mixture composition and bituminous binders on indirect tensile strength
With regard to the composition of a cold recycling mixture it is shown, that the reclaimed asphalt content has an influence to the results for ITS. Langhammer (1998) found in his study on cold recycling mixtures with bituminous emulsions that higher contents of reclaimed asphalt result in higher tensile strengths. He determined indirect tensile strength for following mixtures with 4 % bituminous emulsion and 2 % cement:
• 20M.-% reclaimed asphalt / 80M.-%% unbound material (20/0/80) • 50M.-% reclaimed asphalt / 50M.-% unbound material (50/0/50)
His results are compared in following section to mix variations in the presented study to check this statement that ITS increases in dependence to RA content (Table 14):
Table 14: Comparison ITS with results from literature Langhammer COREPASOL D4.1
0/0/100 (III) 20/0/80 50/0/50 50/0/50 (Va)
75/0/25 (Vb) 100/0/0 (I)
As shown in Figure 37, the results for ITS measured after 28 days of curing in this study confirm the statement of Langhammer. With increased RA content in the cold recycled mixture, the indirect tensile strength will also increase.
0,000
0,200
0,400
0,600
0,800
1,000
1,200
1,400
1,600
0/0/100 20/0/80 50/0/50 75/0/25 100/0/0
indi
rect
tens
ile s
treng
th IT
S 28d
ays
[N/m
m²]
Langhammerbituminous emulsion
Figure 37. Comparison result Langhammer (1998) and university of Kassel

CEDR Call 2012: Recycling: Road construction in a post-fossil fuel society
35
Considering the ITS results on mix variations without RA composed of granulate material of reclaimed cement concrete or crushed aggregates, no differences can be observed (Figure 38). For mixtures with foamed bitumen, mix variation II with higher RCC content results in higher ITS values.
0,000
0,100
0,200
0,300
0,400
0,500
0,600
0,700
0,800
0,900
II III VI II III VI
bituminous emulsion foamed bitumen
indi
rect
tens
ile s
tren
gth
[N/m
m²]
II 0/50/50III 0/0/100VI 0/25/75
RA / RCC / RUM
ITS7days
ITS28days
ITS7days
ITS28days
bituminous emulsion
foamed bitumen
Figure 38. ITS for mix variation with cement concrete and unbound material
For all evaluated mixtures except of two mix variations for 7 days of dry curing the ITS measured on foamed bitumen mixtures were lower compared to cold recycling mixtures with bituminous emulsions with the same nominal binder content. One reason can be the choice of curing condition. Jenkins et al. (2012) confirmed differences in curing between bitumen stabilised material with foamed bitumen and bituminous emulsion.
One reason for the discrepancy in results between bitumen emulsion and foam bitumen mixes is that the emulsion mix is a type of cold mix asphalt that addresses other needs. According to the total coverage of the aggregates by bitumen it behaves more like conventional asphalt. In contrast, the foam mix is a type of BSM-material that does behave like an unbound material with increased shear properties. This is the reason why you find lower ITS values whilst CBR results are significantly increased.
Other reason for the results of reduced tensile strength for foam bitumen mixes may be:
a) problems with sufficient compaction level may be assumed to take negative influence as well, this assumption is strongly motivated by the abnormal high void content observed;
b) comparably high addition of water amount for foam mixes presumably leading to a higher void content and in consequence to lower ITS results;
c) low fine content of 4 % only. According to Xu et al. (2012) and Grilli et al. (2012), foamed bitumen mixtures require minimum fines contents of at least 5 % in order to reach a homogeneous distribution of foamed bitumen. In accordance, the Wirtgen cold recycling manual (2009) foresees 4-10 % as ideal.
For this reasons it will be necessary to analyse other cold recycling material with lower binder contents and more flexible character and carefully review foaming process parameters and compaction execution in accordance to acknowledged standards for BSM materials. Any addition of active filler >1 % per mass will be carefully reviewed too. Use of partly active filler as blending material to meet the grading envelop must be taken into account for the total amount of active filler in the mix.

CEDR Call 2012: Recycling: Road construction in a post-fossil fuel society
36
In accordance to the effectiveness of bitumen in BSM (see Figure 3) one can observe that during mixing single bitumen spots occur.
Whereas the bitumen is concentrated in some parts of the specimen, others stay unbound and therefore react highly sensitive to tensile loading. A phase of foamed bitumen mortar is able to form at high fine aggregate content. This mortar “spot welds the coarser aggregates together” (Xu et al., 2012). Figure 39 shows the cracked specimen after ITS test for mix variation I (100 % RA) with bituminous emulsion (left) and foamed bitumen (right). On the left side it can be seen that the specimen with reclaimed asphalt has black colour and some single aggregates of the reclaimed asphalt can be recognized. Bituminous emulsion covers filler and reclaimed asphalts homogenously. On the right side the specimens with foamed bitumen show that filler is exposed and that there are punctual black spots. Generally this effect grants for the desired behaviour or BSM-material that should be non-continuously bound and behave like granular material with better shear properties.
Figure 39. Specimens with bituminous emulsion (left) and foamed bitumen (right)
4.5.3 German mix design requirements In order to evaluate the quality of the mix variations analysed, it is referred to the German mix design standard (FGSV, 2005), which defines minimum indirect tensile strength values of 0.5 N/mm² (after 7 days of dry curing) and 0.7 N/mm² after 28 days of dry curing as well as minimum remaining strength after water immersion of 30 % (Table 15).
Table 15: Requirements for ITS according to German cold-recycling mix design standard Testing day after demoulding Curing Conditions Requirements
7 days Dry conditions ITS7days, 5°C ≥ 0.5 N/mm² (≥ 500 kPa)
28 days Dry conditions ITS28days, 5°C ≥ 0.7 N/mm² (≥700 kPa)
28 days ITS14days dry conditions/ ITS14days soaking < 30 %
The test results obtained on cold recycling mixtures with bituminous emulsions are plotted in Figure 40 for comparing with the mix design requirement. For the 28-day ITS results, all mix variations containing RA meet the mix design requirement.
If this requirement is applied for evaluating the feasibility of material performance resulting from varied pavement structure, it can be concluded, that a change of composition of the granulate material (for example due to decreased thickness of asphalt layer) will still result in adequate performance of the emulsion mix. As far as 20 % of the milled granulate is composed of reclaimed asphalt the inhomogeneous pavement structure won't prohibit the application of cold recycling procedure for this pavement.

CEDR Call 2012: Recycling: Road construction in a post-fossil fuel society
37
0,000
0,200
0,400
0,600
0,800
1,000
1,200
1,400
1,600
I II III IV Va Vb VI VII
indi
rect
tens
ile s
tren
gth
[N/m
m²]
mix variations (bituminous emulsion)
ITS7days [N/mm²]
ITS28days dry [N/mm²]Requirement after 7 days > 0,5 N/mm²Requirement after 28 days > 0,75 N/mm²
Figure 40. German requirements for bituminous emulsion mixtures
This conclusion cannot be drawn for the foamed bitumen mixtures. Only three mix variations fulfil the requirement for minimum ITS (100 % RA, 75 % RA and 50 % RA) (Figure 41). Therefore, less variability in pavement structure may be allowed compared to cold recycling mixtures with bituminous emulsions.
0,000
0,200
0,400
0,600
0,800
1,000
1,200
1,400
1,600
I II III IV Va Vb VI VII
indi
rect
tens
ile s
tren
gth
[N/m
m²]
mix variations (foamed bitumen)
ITS7days [N/mm²]
ITS28days dry [N/mm²]Requirement after 7 days > 0,5 N/mm²Requirement after 28 days > 0,75 N/mm²
Figure 41. German requirements for foamed bitumen mixtures
According to German standards the difference between ITS after 28 days under dry conditions and ITS after 28 days under a combination of dry and wet condition (14 days dry/14 days wet) should not be greater than 30%. Difference in ITS between the two curing condition are given in Figure 32 and Figure 33 for mixtures with bituminous emulsion and mixtures with foam bitumen. Furthermore the percentage between these results and results after dry condition are given in the charts. Mixtures with bituminous emulsion as binder agent

CEDR Call 2012: Recycling: Road construction in a post-fossil fuel society
38
show a decrease in ITS after dry/wet conditions. The requirements for all mix variations with smaller values than 30 % are complied.
With regard to mixtures with foamed bitumen the requirements are complied, too. But for mix variations Va, Vb, VI and VII the water curing results in a strength increase. Cement as a hydraulic binder needs a certain amount of water for hydration and strength development A reason for increased strength after water immersion can be that the mixture still contained reactive cement binder perhaps due to low mix water content. During water immersion the binding of cement may have continued resulting in a strength increase. Saleh (2006) recognizes same effects after soaking and described that “active mineral filler reacts with water over the soaking period, resulting in higher strength”.
4.5.4 Limits of inhomogeneity of pavement structure Regarding the question about the effect of inhomogeneous pavement structure and its effect on the material performance following recommendation can be drawn from the results of this study.
Figure 42 shows the results of void content evaluation and ITS versus the RA content in the mix granulate. The RA content affects both properties significantly. Decrease of RA content will result in a increase of void content (left) and an increase of ITS. The figure also contains the specification requirements according to German mix design standard (FGSV, 2005) for (a) the mix design values and (b) for the compliance tests on samples cored from the pavement. From these results it can be concluded, that for cold recycling mixtures with bituminous emulsions non-homogeneous pavement structures may be tolerated if the RA content in the mix granulate is higher than 50 %, whereas for foamed bitumen mixtures the limit value is 70 %. In both cases the void content requirement is the limiting property. These differences won’t lead to incompliance for water susceptibility as all samples evaluated fulfilled the mix design requirement. Furthermore, the bearing capacity of the mix samples with reduced RA content will be higher compared to the mix design material and therefore, the overall pavement structure won’t be under-designed.
Figure 42. Void content (left) and ITS after 28 days of dry conditioning (right) versus the RA
content in the mix granulate for bituminous emulsion and foamed bitumen mixtures. German specification requirements are plotted in dotted lines.

CEDR Call 2012: Recycling: Road construction in a post-fossil fuel society
39
4.5.5 Effect of void content on ITS In Figure 43 results of ITS after 28 days of dry curing are plotted versus the specimens void content. Results with dots represent mix variations with bituminous emulsion; results marked with crosses represents mix variations with foamed bitumen.
Besides high dependency of the measured ITS values from the void content, for bituminous emulsion as well as for the foamed bitumen mixtures specific groups of values can be identified.
y = -0,073x + 2,485R² = 0,882
y = -0,060x + 2,018R² = 0,844
0,000
0,200
0,400
0,600
0,800
1,000
1,200
1,400
1,600
1,800
0,0 5,0 10,0 15,0 20,0 25,0 30,0
ITS 2
8day
s[N
/mm
²]
voids [%]
RCC & RUM80-100% RA40-50% RARCC & RUM - foamed bitumen100% - foamed bitumen40-50% - foamed bitumen80% - foamed bitumen
Figure 43. ITS in comparison with void content
4.5.6 Influence of mixture composition and bituminous binders on CBR With regard to bearing capacity one objective is to find out if there is a connection between the compositions of cold recycling mixtures and their results for bearing capacity. So in this case bearing capacity depends on cold recycling mixture composition with special influence of reclaimed asphalt content.
The CBR results increase with decreasing RA content, so mixtures without reclaimed asphalt content reach highest CBR. Figure 44 presents the three groups in which the results for foamed bitumen mixtures as well as for bituminous emulsion mixtures can be divided.
Group I contains mixtures with 80-100% reclaimed asphalt, group II contains mixtures with 40-50 % and group III mixtures without reclaimed asphalt.
Therefore the effect of granulate composition on CBR is exactly different as for ITS. Whereas in ITS the strength of the mixture regarding tension loads is evaluated, in CBR the permanent deformation properties are evaluated. Especially reclaimed asphalt seems to allow more deformation compared to pure unbound aggregates. Further the homogeneous coating of the binder resulting from the emulsion mixtures reduces the internal friction in the cold recycled material and therefore higher deformations occur compared to the less homogeneously coated foamed bitumen mixtures.

CEDR Call 2012: Recycling: Road construction in a post-fossil fuel society
40
0,00
50,00
100,00
150,00
200,00
250,00
300,00
I Vb IV Va VII II III VI
CB
R [%
]
mix variations
I 100/0/0II 0/50/50III 0/0/100IV 50/25/25Va 50/0/50Vb 75/0/25VI 0/25/75VII 40/20/40
RA / RCC / RUM
III
III
bituminous emulsionRA content
without RA
foamed bitumenRA content
without RA
Figure 44. Classification of CBR values.
According to the asphalt pavement design used in the UK Figure 45 was plotted in order to classify the resulting materials for sub-base courses. Independently from the mix compositions, the calculated modules E are higher than 200 MPa and therefore, cold recycled materials fulfil the bearing capacity requirements of a class 3 in some cases of a class 4 sub-base. Single values are given in annex AIII.
0,0
100,0
200,0
300,0
400,0
500,0
600,0
700,0
I II III IV Va Vb VI VII
E [M
Pa]
mix variations
bituminous emulsionfoamed bitumenClass 1Class 2Class 3Class 4
I 100/0/0II 0/50/50III 0/0/100IV 50/25/25Va 50/0/50Vb 75/0/25VI 0/25/75VII 40/20/40
RA / RCC / RUM
Figure 45. Stiffness evaluated from CBR-value (asphalt pavement design, UK).
According to Wirtgen (2012) CBR values >80 % will meet requirements for base layer construction on pavements with a structural capacity in excess of 3 million ESALs.
To date, the most comprehensive research program on BSMs was carried out in South Africa between 2004 and 2009 and cumulated in the Guidelines TG2 (Collings et al.) Accordingly it

CEDR Call 2012: Recycling: Road construction in a post-fossil fuel society
41
is recommended for design methods of BSM to use not only ITS but also triaxial (monotonic and repeated-load) testing to fully characterize and classify BSM. This can be motivated also by the results of this study showing an apparent discrepancy of CBR and ITS results where emulsion and foam mix change ranking.
Tri-axial tests help to gain a better understanding of the mechanical behaviour and properties of BSM materials. Jenkins et al. (2006) observed the influence of RAP-content, active filler content, different binding agents (emulsion or foam bitumen) as well as grading on the Cohesion and angle of internal friction. Cohesion values increase strongly when adding active filler but also significantly when changing from 25 % to 75 % of RAP-content, independently of bitumen binder type. Angle of friction is neither influenced by the binder type. But during dynamic tri-axial testing foam bitumen mixes perform much better in terms of permanent deformation than emulsion mixes.
5 Conclusions In this study it is tried to answer following questions:
• Is there an influence of different cold recycling aggregates (especially reclaimed asphalt content) from a pavement structure on mechanical properties and it is possible to see an activity of reclaimed asphalt bitumen?
• Is there an influence of different bituminous binder agents (bituminous emulsion/foamed bitumen) on activity of reclaimed asphalt bitumen?
For answering these questions eight mixtures with different content of reclaimed asphalt (with an existing, old binder content), reclaimed cement concrete and unbound material were prepared and ITS and CBR values were determined.
• There is no difference in ITS for using reclaimed cement concrete or unbound material in a cold recycling mixture with bituminous emulsion.
• The effect of granulate material composition affects the indirect tensile strength stronger for the analysed foamed bitumen mixtures (by factor 3) compared to the analysed cold recycling mixtures with bituminous emulsions (by factor 2).
• Foamed bitumen mixtures with reclaimed cement concrete and unbound material have different behaviour compared to the same mixtures mixed with bituminous emulsion. Differences for indirect tensile strengths were found. Whereas for the cold recycling mixtures with bituminous emulsions reclaimed cementious concrete granulate resulted in the same properties as crushed basalt aggregates, different strength was evaluated for the foamed bitumen mixtures. This can be explained by complete aggregate coating for the cold recycling mixtures with bituminous emulsions and incomplete, non-homogeniously binder coating for the foamed bitumen mixtures.
• The foamed bitumen mixtures reach higher CBR results compared to cold recycling mixtures with bituminous emulsions. This can be explained by incomplete bitumen coating in the foamed mixtures and therefore remaining internal friction. Internationally this property is assessed in more detail by triaxial tests in order to evaluate internal angle of friction.
• The different behaviour of the two mixes in ITS and CBR test indicate that one can adjust mechanical properties of cold recycling materials. Within these materials BSM material like the foam mix should be considered as their own class of material. From international experience (e.g. Australia, South Africa and the US) it is known that Triaxial

CEDR Call 2012: Recycling: Road construction in a post-fossil fuel society
42
tests can deliver more precise result to the given question how to qualify their mechanical properties.
Regarding to an activity of bitumen in reclaimed asphalt, the following statement can be concluded:
• Increasing content of RA results in increased ITS. This can be interpreted as "activity" of the RA binder which may be considered in mix design studies.
Regarding the question about the effect of mix granulate on the material performance following recommendation can be drawn from the results of this study:
• Cold recycling mixtures with reclaimed asphalt as mix granulate reach better compactability and higher indirect tensile strengths compared to mix granulate composed from unbound or cementious bound material with same grading and water content. For the same aggregate grading, the composition of the non-RA granulate (reclaimed cementious material or unbound material) doesn't affect the pavement performance.
• An increased content of reclaimed asphalt in the mix granulate will decrease the CBR value and therefore the bearing capacity of the cold-recycled layer. Therefore, the effect of granulate composition is contrary compared to the indirect tensile strength.
• Curing in water immersion usually reduces the ITS but also may result in increasing strength due to remaining active hydraulic binders for the foamed bitumen mixtures.
• The RA content in the mix granulates affects directly the mechanical properties compactability, indirect tensile strength and CBR value.
• Foamed bitumen mixtures indicate higher sensitivity to RA content compared to emulsion mixtures.
Please note, that the cold recycled mixtures with reclaimed natural aggregates and cementious granulate were not optimised in the mix properties which lead to the stated conclusions. But the results show, that small non-homogeneities of pavement structure (e. g. repair patches) can be tolerated if the RA content of the mix granulate is still high enough. For larger pavement areas with non-homogeneous structural properties, the mix design shall be extra analysed and the mix properties adopted as necessary. The adoption of this procedure will result in lower water contents and presumably in lower void contents compared to this study.

CEDR Call 2012: Recycling: Road construction in a post-fossil fuel society
43
6 References Brown, S. F. 2013. An introduction to asphalt pavement design in the UK. Transport, Volume 166 Issue TR4
FGSV, Forschungsgesellschaft für Straßen- und Verkehrswesen. 2005. Merkblatt für Kaltrecycling in situ im Straßenoberbau – M KRC.
FGSV, Forschungsgesellschaft für Straßen- und Verkehrswesen. 2007. Technische Lieferbedingungen für Asphaltmischgut für den Bau von Verkehrsflächenbefestigungen – TL Asphalt.
FGSV, Forschungsgesellschaft für Straßen- und Verkehrswesen. 2009. Zusätzliche Technische Vertragsbedingungen und Richtlinien für Erdarbeiten im Straßenbau – ZTV E-StB.
FGSV, Forschungsgesellschaft für Straßen- und Verkehrswesen. 2012. Richtlinien für die Standardisierung des Oberbaus von Verkehrsflächen – RStO 12.
Grilli, A., Graziani, A. and Bocci, M. 2012. Compactability and thermal sensitivity of cement-bitumen –treated materials. Road Materials and Pavement Design. Vol. 13, No. 4
Huang, Y. 1993. Pavement analysis and design. Englewood Cliffs, NJ : Prentice-Hall.
Iwanksy, M.; Chomicz-Kowalska, A. 2013. Laboratory Study on mechanical parameters of foamed bitumen mixtures in the cold recycling technology. Procedia Engineering 57. Pp 433-442.
Jenkins, K.J. 2000. Mix design considerations for cold and half-warm bituminous mexes with emphasis on foamed bitumen. Dissertation. University of Stellenbosch, Faculty of Engineering, Departement of Civil Engineering, Stellenbosch
Jenkins, K.J., Twagira, M.E., Kelfkens, R.W and Mulusa, W.K. 2012.New laboratory testing procedure for mix design and classification of bitumen-stabilised materials. Road Materials and Pavement Design. Vol. 13, No. 4, page 618-641
Jenkins, K.J.; Ebels, L.J. 2006. Determination of Material properties of Bitumen stabilised Materials using tri-axial testing. 10th international conference on asphalt pavements. Quebec City Canada. Vol1. Pp195-204.
Langhammer, L., 1993. Stoffliche und konstruktive Untersuchungen zum Kaltrecycling für Tragschichten. Dissertation. Institut für Stadtbauwesen und Straßenbau. Professur für Straßenbau. TU Dresden. Schriftenreihe Heft 6, Dresden.
Loizos, A., Papavasiliou, V. and Plati, C. 2012. Investigating in situ stress-dependent behavior of foamed asphalt-treated pavement materials. Road Materials and Pavement Design. Vol. 13, No. 4, page 678-690
Nkwoncam, J.E. 2000. Untersuchungen zum Festigkeits-, Formänderungs- und Ermüdungsverhalten von zement-bitumen-gebundenen Kaltrecyclinggemischen unter Verwendung der Spaltzugprüfung. Dissertation. Institut für Stadtbauwesen und Straßenbau. Professur für Straßenbau. TU Dresden. Schriftenreihe Heft 9, Dresden
Nyatanyi, I. 2001. Einsatzmöglichekiten von Schaumbitumen im Straßenbau von Entwicklungsländern am Beispiel Burundi. Universität Bochum, Institut für Straßenwesen und Eisenbahnbau. Schriftenreihe Heft 14, Bochum
Saleh, M. F. 2006. Effect of Aggregate Grading, Mineral Fillers, Bitumen Grade and Source on Mechanical Properties of Foamed Bitumen-Stabilised Mixes. Transportation Research

CEDR Call 2012: Recycling: Road construction in a post-fossil fuel society
44
Record: Journal of the Transportation Research Board, No. 1952. Transportation Research Board of the National Academies, Washington D.C. pp. 90-100
Srinivasan, G. 2004. Evaluation of Indirect Tensile Strength to Identify Asphalt Concrete Rutting Potential. West Virginia University, Department of Civil and Environmental, West Virgina. Engineering; Download: http://wvuscholar.wvu.edu:8881//exlibris/dtl/d3_1/ apache_media/L2V4bGlicmlzL2R0bC9kM18xL2FwYWNoZV9tZWRpYS83MDQ3.pdf
Tebaldi et al. 2012. Synthesis of Specimen Preparation and Curing Processes for Cold Recycled Asphalt Mixes. ISAP 2012
Tiehallinto. 2007. Päällysrakenteen - stabilointi (engl.: Superstructure; stabilization - the design control). ISBN ISBN 978-951-803-971-9. Helsinki.
Wirtgen. 2012. Cold recycling manual 2nd. Ed. Windhagen.
Xu, Jin-Zhi and Hao, Pei-Wen. 2012. Study of aggregate gradings in foamed bitumen mixes. Road materials and Pavement Design. Vol. 13, No. 4, page 660-677

CEDR Call 2012: Recycling: Road construction in a post-fossil fuel society
A.1
A Annex
AI. Detailed mix composition of test mix variations Bituminous emulsion
limestone filler
total 16/22 11/16 8/11 5/8 2/5 0/2I 96,4 - - - - - - - - 3,6II 50,0 50,0 - - 8,0 6,2 43,4 42,4III 100,0 13,3 2,2 12,6 6,7 29,9 35,3IV 48,2 25,0 25,0 8,0 6,2 43,4 42,4 1,8Va 48,2 50,0 13,3 2,2 12,6 6,7 29,9 35,3 1,8Vb 77,1 20,0 13,3 2,2 12,6 6,7 29,9 35,3 2,9VI 25,0 75,0 8,9 1,5 11,1 6,5 34,4 37,7VII 38,6 20,0 40,0 6,6 1,1 10,3 6,4 36,7 38,9 1,4
Emulsion
Sample RA RCC virgin aggregate
Foamed bitumen
limestone fillertotal 16/22 11/16 8/11 5/8 2/5 0/2
I 96,4 - - - - - - - - 3,6II 50,0 50,0 - - 8,0 6,2 43,4 42,4III 100,0 13,3 2,2 12,6 6,7 29,9 35,3IV 48,2 25,0 25,0 - - 8,0 6,2 43,4 42,4 1,8Va 48,2 50,0 13,3 2,2 12,6 6,7 29,9 35,3 1,8Vb 77,1 20,0 13,3 2,2 12,6 6,7 29,9 35,3 2,9VI 25,0 75,0 8,9 1,5 11,1 6,5 34,4 37,7VII 38,6 20,0 40,0 6,6 1,1 10,3 6,4 36,7 38,9 1,4
Foamed bitumen
Sample RA RCC virgin aggregate

CEDR Call 2012: Recycling: Road construction in a post-fossil fuel society
A.2
AII. CBR results Bituminous emulsion
single value averageE_I8 -E_I9 95E_II8 215E_II9 175E_III8 190E_III9 205E_IV8 125E_IV9 125E_Va8 130E_Va9 100E_Vb8 85E_Vb9 70E_VI8 150E_VI9 170E_VII8 105E_VII9 130
VII
95
195
197,5
125
115
77,5
160
III
IV
Va
Vb
VI
samplesbitumen emulsion CBR
117,5
I
II
Foamed bitumen
single value averageS_I8 150
- -S_II8 215S_II9 255
- -S_III9 220S_IV8 220S_IV9 210S_Va8 180S_Va9 125S_Vb8 110S_Vb9 130S_VI8 210S_VI9 180S_VII8 175S_VII9 150
195
162,5
150
235
220
215
152,5
120
I
VI
VII
II
III
IV
Va
Vb
foamed bitumen CBRsamples

CEDR Call 2012: Recycling: Road construction in a post-fossil fuel society
A.3
AIII. Elastic modulus E (asphalt pavement design UK) Bituminous emulsion
single value averageE_I8 -E_I9 324,5E_II8 547,4E_II9 479,8E_III8 505,7E_III9 530,9E_IV8 386,8E_IV9 386,8E_Va8 396,7E_Va9 335,4E_Vb8 302,2E_Vb9 266,9E_VI8 434,7E_VI9 471,0E_VII8 346,0E_VII9 396,7
IV
Va
Vb
VI
VII
bitumen emulsionsamples
I
II
III
453,1
371,8
asphalt pavement design (UK)
324,5
514,2
518,4
386,8
366,7
284,9
Foamed bitumen
single value averageS_I8 434,7
- -S_II8 547,4S_II9 610,5
- -S_III9 555,5S_IV8 555,5S_IV9 539,2S_Va8 488,5S_Va9 386,8S_Vb8 356,5S_Vb9 396,7S_VI8 539,2S_VI9 488,5S_VII8 479,8S_VII9 434,7
Vb
VI
VII
434,7
376,9
514,2
457,6
579,4
555,5
547,4
asphalt pavement design (UK)
439,3
foamed bitumensamples
I
II
III
IV
Va