CoreBrand BrandPower Favorability Report - Tenet Partners · 4 BrandPower Series: Favorability...
12
BrandPower Series: Favorability Report A shake-up ahead? Leadership perceptions create opportunities for Tier 2 brands. © Copyright 2013 CoreBrand, LLC, New York, NY
Transcript of CoreBrand BrandPower Favorability Report - Tenet Partners · 4 BrandPower Series: Favorability...

BrandPower Series: Favorability Report
A shake-up ahead? Leadership perceptions create opportunities for Tier 2 brands.
© Copyright 2013 CoreBrand, LLC, New York, NY

2www.corebrand.com
Table of contents
3 Executive summary
4 Understanding Favorability
5 Favorability is poised to rebound
6 Perception of Management is the most critical factor for top brands
7 Tier 5 companies plagued by poor performance
8 The core of the economy remains strong
9 Is a shake-up coming at the top?
10 Built from more than 20 years of research
11 Upcoming reports
11 For more information
BrandPower Series: Favorability Report

3www.corebrand.com
BrandPower Series: Favorability Report
Executive summaryIn March 2013, CoreBrand released its 6th annual Top 100 BrandPower Rankings Report,
showcasing the best and strongest corporate brands. In our report, we analyzed the performance
of brands in 2012, as well as brand trends over the past fi ve years. The report demonstrated a
downward pressure of the economy across all sectors, but it also heralded the ability of a strong
brand to buoy a company in tough economic times. We noted that the primary driver of the
downward trend was a decrease in Favorability, as most brands were still performing well in
Familiarity. These fi ndings led to our conclusion that while many companies maintained or
improved in brand awareness, overall market sentiment toward corporations was skeptical.
In this follow-up report, we take a closer look at the three attributes that comprise Favorability
to better understand the factors behind this downward trend: Overall Reputation, Perception of
Management, and Investment Potential. To gain further insight, we compare the Favorability
scores of the Top 100 brands with those of other tiers of tracked companies to better understand
the dynamics that infl uence brand performance and separate the winners from the laggards.
Some key fi ndings include:
• The downward trend in Favorability across the entire Top 100 seems to have started slowing
down and leveling off in 2010. There has been a clear, but gradual, rebound in sentiment
towards companies since the fi nancial crisis, although there is still some way to go until we
reach the point of recovery.
• The “Perception of Management” attribute is the critical driver of the decrease in Favorability
scores. This fi nding tells us that companies need to focus on building their leadership image
through frequent and transparent communication to build trust.
• Overall, there is evidence of strength and confi dence returning to corporate brands,
suggesting that the economic recovery is assuredly underway.
• Companies in Tier 2 (ranked 101–200) have a surprising upward momentum in Favorability,
showing that they are poised to overtake many of the Top 100. If this trend continues, it is
quite possible there will be a huge shake-up in the Top 100 BrandPower Rankings over the
next few years.
We have identifi ed the expected negative trends in Favorability, given the persistent adverse
economic conditions and identifi ed some core strengths and possible resiliency among the
companies we track. Companies who proactively build trust through their business processes,
their culture and behavior, and their communications have an obvious opportunity to push
ahead. This is no more apparent than in the brand scores for companies that fall just behind
our Top 100.

4www.corebrand.com
BrandPower Series: Favorability Report
Understanding FavorabilityWe originally included over 30 Favorability attributes in our study. After doing a factor analysis,
we discovered these attributes clustered into three broad dimensions: general perception,
corporate leadership and fi nancial factors. We were able to simplify our process and still explain
almost all of the variability in total Favorability by asking respondents to focus in on these broad areas.
The Favorability attributes behave in a predictable way for a strong brand. We expect to see a
hierarchy in score, with alignment, in an ordered trend: Overall Reputation highest, followed
by Perception of Management and Investment Potential. The reason for the hierarchy is the
increasing commitment required to give a strong score for each of the dimensions — from
declaring you like the company, to having an opinion about its leadership to whether you
would be willing to (hypothetically) put your own money behind them. When the Favorability
attributes do not behave as we would expect, it raises a red fl ag. Misalignment can help
diagnose and prescribe specifi c action to improve overall brand effectiveness.
Report criteriaTo be considered for our Rankings and this report require brands to be: • A corporate brand (not a product or divisional brand)
• Publicly traded for 5+ years
• Tracked by CoreBrand for 5+ years
Over 500 companies meet our criteria and were ranked based on their BrandPower scores. We will look most closely at the Top 100 and the next tier of brands.
Tier 1 Rank 1–100
Including Coca-Cola, Target, Apple
Tier 2 Rank 101–200
Including Amazon, H.J. Heinz, Citigroup
Tier 3 Rank 201–300
Including Sunoco, 3M, Limited Brands
Tier 4 Rank 301–400
Including Berkshire-Hathaway, EA, Novartis
Tier 5 Rank 401–500
Including Rockwell Automation, MeadWestvaco, Accenture

5www.corebrand.com
BrandPower Series: Favorability Report
Favorability is poised to reboundThe Top 100 brands (Tier 1) represent companies that perform well in both Familiarity and
Favorability. Tier 1 companies have well-established, high profi les; therefore, large growth in
both scores from year to year is rare. In general, maintaining strength is considered success.
However, we noted in our Top 100 Rankings Report that, on average, companies in this tier
are experiencing a downward pressure being driven by decreasing Favorability scores. Brand
awareness has essentially held steady while sentiments towards brands have plummeted. This
is a clear refl ection of continued depressed market sentiment and skepticism, and highlights
an opportunity for brands to build trust and regain positive perception.
The good news is that the decline in Favorability seems to have leveled off in 2010, when we
observe an infl ection point. While it remains to be seen how quickly companies can regain lost
Favorability, the downward momentum has stopped. When awareness is holding strong, it is
the time to focus on adjusting marketing messages. Audience research and message testing can
be excellent tools to help refi ne brand messages to ensure they resonate with key targets.
The process to revise messages and implement them externally can take some time. Companies
who begin now will be poised to collect the greatest rewards as their updated brands regain
positive sentiments.
Tier 1 Familiarity and Favorability
Familiarity
Favorability
100
95
90
85
80
75
702007 2008 2009 2010 2011 2012
Rebuilding Favorability will be critical to
regain brand strength. Clear, consistent
communications with targeted messaging
are required to rebuild positive momentum.

6www.corebrand.com
BrandPower Series: Favorability Report
Perception of Management is the most critical factor for top brandsWhen you dig one layer deeper into the attributes comprising Favorability for Tier 1, we see a
startling pattern. The downward trend in Favorability is primarily due to a dramatic drop in
Perception of Management, causing the Favorability attributes to come out of alignment. We
would expect to see an ordered hierarchy between the three Favorability attributes, but starting
with the economic meltdown of 2008, Perception of Management has dipped well below
Investment Potential.
This is a clear indicator of mistrust in corporate leadership and is likely a result of the economic
crisis of 2008. Executives in this tier of companies are being held personally accountable
on some level for corporate and overall economic performance. The drop in Perception of
Management represents a backlash against the corporate culture that audiences feel is
responsible for creating the meltdown.
The good news is that 2010 marks the beginning of a clear upturn. Investment Potential
continues to decline as consumer confi dence remains shaky, but the attributes are back in their
expected alignment and stabilizing. This bodes well for a slow-but-steady economic recovery.
It is critical that corporate leadership maintain a public face and promote clear, consistent and
transparent communication to the market.
Tier 1 Favorability Attributes
Overall Reputation
Perception of Management
Investment Potential
85
80
75
70
65
60
2007 2008 2009 2010 2011 2012
During the beginning of the economic
downturn, the Perception of Management
attribute came out of alignment. This
underscores the critical role executives play
in guiding brands through times of crisis.
Audiences look to leadership to build trust.

7www.corebrand.com
BrandPower Series: Favorability Report
Tier 5 companies plagued by poor performanceFor comparison, we looked at the lowest performers in our set of tracked companies. For Tier 5
(ranked 401–500) we see a pattern of Favorability attributes that behaves as we would expect
in challenging times. This leads us to suspect that poor image performance has less to do with
brand management than other business factors.
Out of the 500 companies examined in this report, Tier 5 shows the greatest overall decline in
the Favorability attributes. These are the lowest ranked brands that we track and they have
generally sharply declined since 2007. However, unlike the Tier 1 companies, they have done so
in a uniform pattern across all three attributes. This pattern suggests that respondents are not
holding these companies responsible for damaging the economy. The Tier 5 declines are more
likely based on poor corporate performance.
Tier 5’s pattern of Favorability attributes is not uncharacteristic of what you’d expect to see for
weaker brands given the existing economic climate. It provides an interesting counter point to
the Tier 1 performance, which clearly indicates brand is an active driver of success.
Tier 5 Favorability Attributes
70
60
50
40
30
20
10
0
2007 2008 2009 2010 2011 2012
Overall Reputation
Perception of Management
Investment Potential
The downward decline for the bottom
ranked companies is consistent with
poor performance. Brand would need to
be one of many levers pulled to turn a
pattern like this around.
8www.corebrand.com
BrandPower Series: Favorability Report
The core of the economy remains strongAfter looking at the top of the list and the bottom, we wondered what the pattern would be for
the remaining companies. Looking at the average for the middle 300 tracked companies that
meet our report criteria, who represent the core of our economy, we see a comforting pattern of
stability. There has been some downward pressure, but it is far from a catastrophic free-fall and
they are actually the fi rst to stabilize, leveling out before the 2010 infl ection point.
Perception of these brands has not recovered what was lost, but they also have not continued
to decline. It is unclear going forward how long it will take companies to recover perception
that has been damaged by the downturn. The patterns at the core show a strength that can be
transformed into positive momentum with solid performance and careful brand management.
The Middle 300: Tiers 2–4 Favorability Attributes
80
70
60
50
40
30
20
10
02007 2008 2009 2010 2011 2012
Overall Reputation
Perception of Management
Investment Potential
The midrange of our database is a proxy for
the core of our economy. It has remained
relatively stable and strong, despite market
declines, providing the solid base and
optimism for an overall market recovery.
9www.corebrand.com
BrandPower Series: Favorability Report
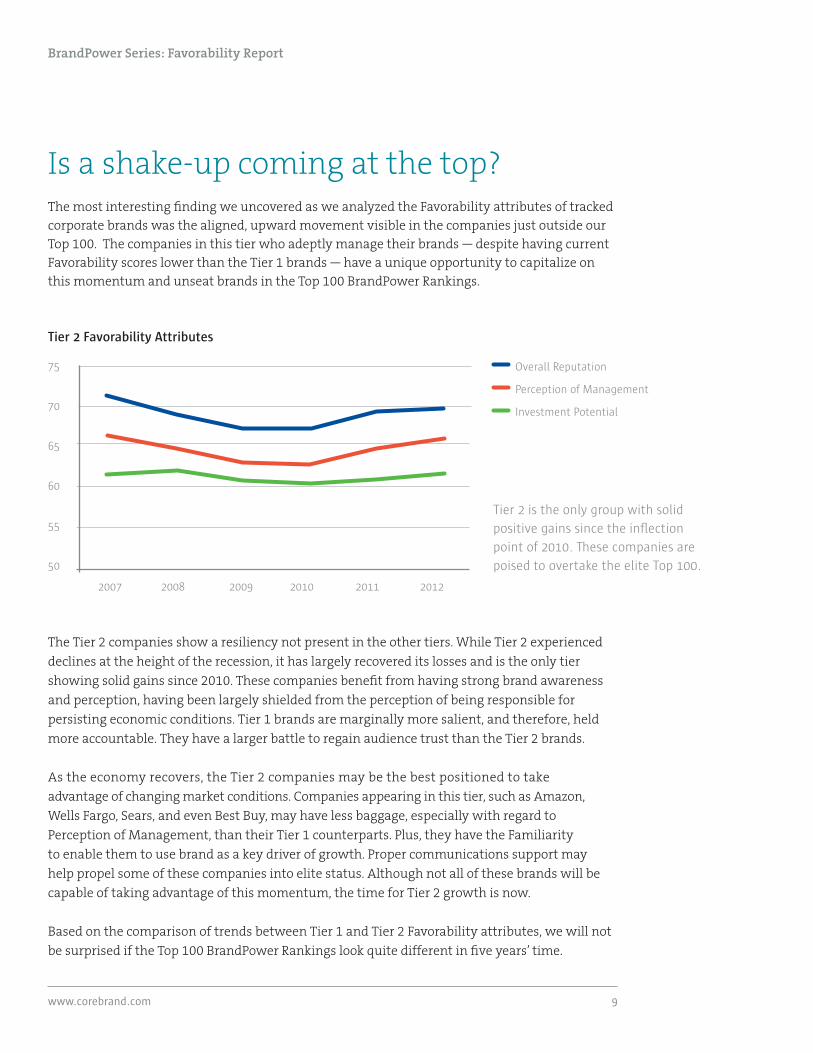
Is a shake-up coming at the top? The most interesting fi nding we uncovered as we analyzed the Favorability attributes of tracked
corporate brands was the aligned, upward movement visible in the companies just outside our
Top 100. The companies in this tier who adeptly manage their brands — despite having current
Favorability scores lower than the Tier 1 brands — have a unique opportunity to capitalize on
this momentum and unseat brands in the Top 100 BrandPower Rankings.
The Tier 2 companies show a resiliency not present in the other tiers. While Tier 2 experienced
declines at the height of the recession, it has largely recovered its losses and is the only tier
showing solid gains since 2010. These companies benefi t from having strong brand awareness
and perception, having been largely shielded from the perception of being responsible for
persisting economic conditions. Tier 1 brands are marginally more salient, and therefore, held
more accountable. They have a larger battle to regain audience trust than the Tier 2 brands.
As the economy recovers, the Tier 2 companies may be the best positioned to take
advantage of changing market conditions. Companies appearing in this tier, such as Amazon,
Wells Fargo, Sears, and even Best Buy, may have less baggage, especially with regard to
Perception of Management, than their Tier 1 counterparts. Plus, they have the Familiarity
to enable them to use brand as a key driver of growth. Proper communications support may
help propel some of these companies into elite status. Although not all of these brands will be
capable of taking advantage of this momentum, the time for Tier 2 growth is now.
Based on the comparison of trends between Tier 1 and Tier 2 Favorability attributes, we will not
be surprised if the Top 100 BrandPower Rankings look quite different in fi ve years’ time.
Tier 2 Favorability Attributes
Overall Reputation
Perception of Management
Investment Potential
75
70
65
60
55
50
2007 2008 2009 2010 2011 2012
Tier 2 is the only group with solid
positive gains since the infl ection
point of 2010. These companies are
poised to overtake the elite Top 100.

10www.corebrand.com
BrandPower Series: Favorability Report
Built from more than 20 years of researchThe data in this report comes from our Corporate Branding Index® (CBI), the only brand research
method to be independently validated by the Marketing Accountability Standards Board.
Founded in 1990, the CBI is a quantitative database based on a continuous benchmark tracking
survey of 1,000 companies across 54 industries and 10 business sectors. CBI research examines
the corporate reputations of major public companies in the United States by polling a neutral
Business Decision Maker audience on Familiarity (awareness) and Favorability (perception) of
tracked brands. The information in this report refl ects data collected through December 31, 2012.
Familiarity
The Familiarity score is a weighted percentage of survey respondents who are familiar
with a certain brand. Familiarity is rated on a fi ve-point scale. Respondents are considered to
be familiar with a brand if they state that they know more than the company name only
(a score of 3 or higher).
Favorability
Those familiar with a corporation are then asked about favorability dimensions:
• Overall Reputation
• Perception of Management
• Investment Potential
Rated on a four-point scale, these metrics are combined into a single Favorability score.
BrandPower
Familiarity and Favorability are aggregated into a metric we call BrandPower. This score allows
easy comparison between companies and across industries and sectors. Our BrandPower
Rankings report showcases the companies who have achieved a high BrandPower score,
meaning they benefi t from both high awareness and positive perceptions.

11www.corebrand.com
BrandPower Series: Favorability Report
Upcoming reportsIn our next report we will concentrate on some of the specifi c brands that were examined in
this analysis. We will focus in on companies with interesting and unusual patterns of
Perception of Management and look to identify which companies are driving growth or declines.
For more information CBI Methodology
www.corebrand.com/brandpower/methodology
All tracked companies
www.corebrand.com/brandpower/tracked-companies
The Top 100 BrandPower Rankings
www.corebrand.com/brandpower2012
To schedule an introductory meeting, please contact
Ellen Sluder
Director, Strategic and Business Relations

CoreBrand, LLC
122 West 27th Street
9th Floor
New York, NY 10001
+1 212 329–3030
+1 212 329–3031 Fax
www.corebrand.com