core.ac.uk · · 2017-10-27chambers into which bricks were loaded and unloaded. The fire ... the...
33
econstor Make Your Publications Visible. A Service of zbw Leibniz-Informationszentrum Wirtschaft Leibniz Information Centre for Economics Baily, Mary Ann Working Paper Dualism in LDC Manufacturing: A Case Study Center Discussion Paper, No. 303 Provided in Cooperation with: Economic Growth Center (EGC), Yale University Suggested Citation: Baily, Mary Ann (1978) : Dualism in LDC Manufacturing: A Case Study, Center Discussion Paper, No. 303 This Version is available at: http://hdl.handle.net/10419/160230 Standard-Nutzungsbedingungen: Die Dokumente auf EconStor dürfen zu eigenen wissenschaftlichen Zwecken und zum Privatgebrauch gespeichert und kopiert werden. Sie dürfen die Dokumente nicht für öffentliche oder kommerzielle Zwecke vervielfältigen, öffentlich ausstellen, öffentlich zugänglich machen, vertreiben oder anderweitig nutzen. Sofern die Verfasser die Dokumente unter Open-Content-Lizenzen (insbesondere CC-Lizenzen) zur Verfügung gestellt haben sollten, gelten abweichend von diesen Nutzungsbedingungen die in der dort genannten Lizenz gewährten Nutzungsrechte. Terms of use: Documents in EconStor may be saved and copied for your personal and scholarly purposes. You are not to copy documents for public or commercial purposes, to exhibit the documents publicly, to make them publicly available on the internet, or to distribute or otherwise use the documents in public. If the documents have been made available under an Open Content Licence (especially Creative Commons Licences), you may exercise further usage rights as specified in the indicated licence. www.econstor.eu
Transcript of core.ac.uk · · 2017-10-27chambers into which bricks were loaded and unloaded. The fire ... the...

econstorMake Your Publications Visible.
A Service of
zbwLeibniz-InformationszentrumWirtschaftLeibniz Information Centrefor Economics
Baily, Mary Ann
Working Paper
Dualism in LDC Manufacturing: A Case Study
Center Discussion Paper, No. 303
Provided in Cooperation with:Economic Growth Center (EGC), Yale University
Suggested Citation: Baily, Mary Ann (1978) : Dualism in LDC Manufacturing: A Case Study,Center Discussion Paper, No. 303
This Version is available at:http://hdl.handle.net/10419/160230
Standard-Nutzungsbedingungen:
Die Dokumente auf EconStor dürfen zu eigenen wissenschaftlichenZwecken und zum Privatgebrauch gespeichert und kopiert werden.
Sie dürfen die Dokumente nicht für öffentliche oder kommerzielleZwecke vervielfältigen, öffentlich ausstellen, öffentlich zugänglichmachen, vertreiben oder anderweitig nutzen.
Sofern die Verfasser die Dokumente unter Open-Content-Lizenzen(insbesondere CC-Lizenzen) zur Verfügung gestellt haben sollten,gelten abweichend von diesen Nutzungsbedingungen die in der dortgenannten Lizenz gewährten Nutzungsrechte.
Terms of use:
Documents in EconStor may be saved and copied for yourpersonal and scholarly purposes.
You are not to copy documents for public or commercialpurposes, to exhibit the documents publicly, to make thempublicly available on the internet, or to distribute or otherwiseuse the documents in public.
If the documents have been made available under an OpenContent Licence (especially Creative Commons Licences), youmay exercise further usage rights as specified in the indicatedlicence.
www.econstor.eu

ECONOMIC GROWTH CENTER
YALE UNIVERSITY
Box 1987, Yale Station New Haven, Connecticut
CENTER DISCUSSION PAPER NO. 303
DUALISM IN LDC MANUFACTURING: A CASE STUDY
Mary Ann Baily
November 1978
Notes: Port·ions of this research were financed by funds provided by the Agency for International Development under Contract AID/ort C-1326. However, the views expressed in this paper do not necessarily reflect those of AID.
Cent~r Discussion Papers are preliminary materials circu-lated to stimulate discuss.ion and critical comment. Ref-erences in publications to Discussion Papers should be cleared with the author to protect the tentative character of these papers.

,:. ..
INTRODUCTION
The phenomenon of dualism is frequently observed in the
manufacturing sectors of developing countries. In many industries,
there is a "modern" sector using sophisticated, capital-intensive
technology similar to that used in developed countries, and a
"craft" or "traditional" sector using old-fashioned, labor-inten-
sive techniques. The causes of this dualism and its significance
for the development process have been considered important by
many development economists.
One interpretation can be called the diffusion model.
According to this interpretation, the development of the manu-
facturing sector takes place by the expansion of the modern
sector and the contraction and eventual disappearance of the
craft sector as superior modern technology diffuses throughout
each industry, much as newly invented technology diffuses in a
developed country. Existing firms do not instantly adopt the
modern technology especially if (as is usually the case) it is
embodied in capital goods. Instead, the technology diffuses at
a rate determined by the rate of spread of the new information
and the rate at which it becomes profitable to replace existing
equipment. In a developing country, one might expect diffusion
to proceed much more slowly, explaining the bigger spread in the
technology observed in place. Information, which comes from more
technologically sophisticated countries, is likely to spread
more slowly. Managers in LDCs tend to be less effective as

-_· . ~·.
2
profit-maximizers and therefore, slower to recognize the value
of new technology. _ If there are imperfections in input or
output markets, the cost advantage of the superior modern tech-
nology might be weakened and thus the traditional technoloisy could
survive longer, in spite of its lower productivity.
A particularly explicit discussion of this diffusion ap-
proach to dualism in manufacturing, developed with reference
to Colombia, is that of Richard Nelson. 1
Nelson assumes differential productivity between the two
parts of each industry: there are two distinct production functions.
Scale economies are more important in the modern sector production
function. The efficiency difference between the two production
functions varies with the capital-labor ratio, so that modern
technology has a greater advantage at higher capital-labor ratios.
Factor markets are imperfect; modern sector firms pay higher wages
and have lower capital costs than craft sector firms.
The industry is not in equilibrium but is moving toward
it. Since the modern sector technology has a cost advantage
over the craft sector, even given factor market imperfections,
and the relative rate of expansion of each sector is determined
by unit profits (or losses), the modern sector is expanding faster
than the craft sector.
Together, all of these assumptions imply that the dualism
is a disequilibrium phenomenon. There is a final equilibrium
in which all firms are modern, large and capital-intensive; the
craft sector with its traditional, small, labor-intensive firms
is entirely eliminated.

3
The policy implications depend to some extent on the
causes of market imperfections. But in general, the model tends
to support the "modern is better" attitude found in many develop-
ing countries. It suggests that factor market imperfections
allow obsolete techniques to survive rather than encourage
premature adoption of socially inefficient techniques. It por-
trays the traditional sector as composed of people not smart
enough to see that they are obsolete. Speeding up the process
by which the craft sector is eliminated and the modern sector
grows is a good thing. Efforts to provide assistance to small
and medium size firms are suspect on efficiency grounds. Any
efforts to provide technology information should focus on spread-
ing information about the superior modern technology, not on
spreading information about craft technology, or looking for
more productive forms of craft technology.
The model is plausible, it fits with casual observation,
and it is consistent with aggregate industry statistics. How-
ever, casual observation has often proved misleading in the
past and industrial statistics can be difficult to interpret.
For example, Nelson argues that Colombian statistics show that
the size composition of industry is changing over time in the
direction of larger firms. However, the statistics are not
very suitable for examining the composition of industry by
size over time, and are likely to contain a built-in bias
toward showing that result. The industrial statistics in Colombia
(and in nearly all LDC's) include all of the largest and the
4
great majority of middle-size firms but only a small fraction
of the small firms. Very little information is available about
the number of firms in the smaller size classes of any industry,
so it is hard to know just what fraction is included in any given
year. Firms generally grow over time. Some firms go out of
business, and it is reasonable to think that turnover is greater
among smaller firms. For both these reasons, the average size
of firm in a sample will automatically grow over time unless
adjustments are made for entry and exit. But it is hard to
make the correct adjustment. The larger firms entering will tend
to be included, but given the lack of information about small
firms, it is very unlikely that small firms will be added to the
sample in the right proportions to maintain a sample which accu-
rately reflects the real size distribution of firms in the
industry.
Thus, it is useful to look at a specific industry at the
micro-level in the context of the diffusion model. The Colombian
clay brick industry is a perfect example of a dualistic industry.
The technology in operation in the industry ranges from a modern,
large, capital-intensive factory to tiny artisan establishments
using centuries-old techniques. In this paper, the questions
asked are, To what extent does this industry fulfill the asstnnp-
tions in the diffusion model, and does it seem to be evolving
toward the equilibrium described by the model?
This paper is complementary to another paper by this author 2 on the brick industry which examines an alternative hypothesis:

5
that industry structure (size distribution and technology choice)
represents a long-r_un equilibrium generated by entrepreneurs
maximizing profits subject to a particular set of factor market
imperfections.
It is argued there that the empirical evidence is con-
sistent with a model in which there is one industry production
function, not two. A higher scale of production, higher capital-
labor ratio and a higher ex post wage rental ratio are all as-
sociated but small-scale, labor-intensive firms coexist with
large-scale, capital-intensive firms indefinitely.
In this paper, we show that the empirical evidence is not
consistent with the diffusion model.
A BRIEF HISTORY OF BRICK TECHNOLOGY
The main processes in the production of clay bricks are
the excavation and preparation of the clay, the forming and
drying of the raw bricks, and the firing of the bricks in kilns.
For each process, there is a variety of alternatives available,
from purely manual to highly mechanized.
Until the nineteenth century, production was characterized
by hand-digging, natural weathering, hand-making , outdoor drying,
and batch-firing in primitive kiln~, either temporary structures
("open clamps") or simple permanent structures.
In the nineteenth century, molds were developed which
made as many as 15 bricks at once. The process (the "soft mud"

6
process) was mechanized, using animal and then steam power. By
the end of the century, a new alternative, the extrusion process,
had been developed and was well-established. In the extrusion
process, instead of being molded, the bricks were extruded as
a column of clay which was then cut with a wirecutting machine.
Heated floors were first used to speed up drying. Then
chamber dryers were used, in which hot air was circulated around
the formed bricks. In 1845, a continuous process dryer (the tun-
nel dryer), was invented, although it did not become a practical
alternative to the hot floor and chamber dryer until the end of
the century. In the tunnel dryer, bricks moved on cars through
a tunnel as warm air was passed over them.
In kilns, the important innovation was the Hoffmann kiln,
invented in 1858. This kiln transformed the firing process into
a continuous process. It was composed of a series of individual
chambers into which bricks were loaded and unloaded. The fire
was moved from chamber to chamber as the bricks in each chamber
were fired.
With the twentieth century came mechanization of the
excavation step, with power shovels, bulldozers, etc. There
was a shift toward more elaborate preparation of the clay and
the development of stone separation, crushing and mixing machinery.
De-airing was introduced into the extrusion process. This is
the removal of air from the clay as it is being extruded in
order to produce a denser, stronger product.

7
The tunnel kiln had been invented in 1840 but was not
adapted for brickmaking until the twentieth century. It, like
the Hoffmann kiln, involved a continuous firing process, but
in the case of the tunnel kiln, the fire was stationary and the
product moved through the kiln on cars.
Finally, mechanical methods of handling the bricks with-
in and between processes were developed.
To summarize, there has been a substantial increase in
the minimum scale of plant with the development of new techno-
logical alternatives, particularly in the case of kilns. General-
ly, the newer the technique, the less labor is used relative to
capital in each process, and some substitution of skilled for
unskilled labor has occurred. Also, for efficient operation,
the tunnel kiln and tunnel dryer require skilled management of
temperature controls.
THE STRUCTURE OF THE COLOMBIAN BRICK INDUSTRY
The characterization of technology is a difficult
problem, particularly the measurement of the capital input.
Book value is a poor measure because depreciation relates much
more to tax law then to the economic value of capital. Measures
of electrical energy consumed and rated horsepower measure eco-
nomists' desperation, not capital. Replacement cost is perhaps
the best alternative, but most firms have no idea what replace-
ment cost is or even what the original cost of their capital was.

8
Moreover, firms are suspicious of surveys and reluctant to
waste their time gathering information. Therefore, we sought
a method that would capture the main alternatives but would be
feasible.
After preliminary factory visits and discussion with local
industry experts, the Colombian industry was divided into eight 3 major categories of technology choice, based on the major al-
ternatives observed in the forming, drying and firing processes:
(The choices are arranged here from most to least capital-inten-
sive, within each process).
Forming: semi-dry press process
extrusion with de-airing--imported process
Colombian adaptation
without de-airing
manual molding
Drying: artificial drying - tunnel dryer
chamber dryer
natural drying
Firing: continuous kiln - tunnel kiln
Hoffmann kiln
intermittent kiln - vertical flame (updraught)
or inverted flame(downdraught)
Table 1 shows the combinations of choices represented by
the categories. The division between modern and craft sector
can be roughly considered to fall between categories 4 and 5,

-· ·····
although as the table shows, the structure of the industry 4 is more complicated than just a two way division.
9
A tentative specification of a representative plant was
prepared for each category based on information from a small
number of cooperative firms. These were used in designing the
survey instrument. Brief questions on key points of the produc-
tion process were included in the survey to determine what
category each firm was in. The results of the survey were used
to modify the original categories and plant designs. Then a
single composite capital-labor ratio was computed for each of
categories 2 to 8 from the modified plant designs. The capital
figure was the approximate cost in Colombian pesos of purchasing
plant and equipment new in 1975 plus the costs of construction
in 1975 for kilns, drying sheds, and simple factory structures. 5
Labor was the number of full-time production workers employed 6 per month.
A capital-labor ratio could not be computed for category
1. This category consists of a single, very large scale firm
using a sophisticated capital-intensive process. Since the firm
refused to cooperate it is incorporated in the analysis only
to the extent that information about it is available from other
sources. Although a capital-labor ratio could not be computed,
there is no doubt that this category is the most capital-intensive.
It is obvious that the capital-labor ratios are very ap-
proximate. We know that there is variation within categories
but we do not have the quantitative data to say how large the

0 ~
Table 1: Categories of Technology Choice
"Modern" Sector .. Craft" Sector
~· 1 2 3 4 ~
8
5 6 ~
Forming
Drying
Firing
Composite Capital/Labor
Ratio
Semi-Dry Extrusion Extrusion Press with with Process De-airing: De-airing:
Imported Imported Process Process
Tunnel Combination* Combination* Drying of Tunnel of Chamber
and Natural and Natural ..,, Drying Drying
Tunnel Tunnel Hoffman Kiln Kiln Kiln
Unavailable 872.1 512.9
"
Extrusion with
. De-airing: I Imported
Process
Natural Drying
Hoffman i
Kiln
410.3
Ell: li
DE In PI
Na DI
lI1 mj
I
i
t i
.p 0
t y
t t
'.1
7
rusion Extrusion th with airing: De-airing orted Colombian cess Adaptation
ural Natural ing Drying
er- Inter-tent mittent ln Kiln
.3 45.1
Only the single firm in category 1 dries all of its output artificially
. 7 8
Extrusion without Manual
De-airing Molding
Natural Natural Drying Drying
Inter- Inter-mittent mittent
Kiln Kiln
25.8 7.4

11
variation is. Little significance can be attached to the
numerical values; however, we feel that the ordering is robust.
In this paper, capital-intensity is used mainly as an ordinal
ranking of the categories.
The table, combined with the history of the development
of the technology, shows that, as the diffusion model assumes,
capital-intensity and "modernity" of the technology generally
give the same ordering of categories. There is one partial
exception. Category 6 uses a Colombian adaption of imported
technology. This is a case where an "obsolete" type of foreign
machinery has been reduced in size and copied for local manufac-
ture. This adaptation began in the very early 1970's. More will
be said about the significance of this later.
Size of firm was not used in the determination of the
categories. However, in the sample, size of firm proved to be
strongly correlated with category and therefore with capital-
intensity and modernity, as the diffusion model assumes. Two
measures of size were used: total employment and value of 7 capacity output. Quantitative information was available for
47 firms in categories 2 to 8. The correlation between size
and capital-intensity as measured by category is given below.
Kendall · Correlation Significance
Category Coefficient Level
VS, size measured by employment -0.5087 .001
vs. size measured by value of capacity output -0.5944 .001

12
The correlation coefficient is negative since capital-intensity
is measured ordinally from 2 to 8, from most to least capital-
intensive. The factory in category 1 is known to be the largest
brick factory in Colombia; therefore, its inclusion would
strengthen the result.
FACTOR MARKET STRUCTURE
The Nelson model assumes that modern firms have a higher
wage/rental ratio than traditional firms. With respect to wages,
aggregate data show that the average wage increases with size
of firm. Nelson assumes that this represents different wages
for the same type of labor and that it results from a market
imperfection tied to the type of technology chosen by the firm.
He argues that the cause of the market imperfection is labor
legislation which applies unevenly across firms. Similarly
the rental rate is tied to the choice of technology. Baily ("Factory Market Structure and Technology Choice in the
Colombian Brick Industry") gives a detailed discussion of the structure
of Colombian factor markets, in general and in the brick industry
specifically. Quantitative evidence from the brick survey is
presented to show that wages vary positively with size of firm
even after allowing for education, experience, and stability
of the labor force, firm location, and technology choice (as
measured by technology category). It is argued that labor
legislation is probably a major factor in this result but
that its impact varies with size of firm (measured by capacity
output) rather than with choice of technology.

13
It was difficult to obtain direct quantitative data on
capital costs for individual firms. However, a study of the lend-
ing policies of the major sources of industrial credit leads to
the conclusion that capital access does differ across firms.
An elaborate system of capital market controls gives wide scope
for the use of noneconomic factors in credit allocation. It is
argued that capital access depends to some extent on the nature
8 of a project, but much more on characteristics of the borrower
such as family background, social position and educational back-
ground. The survey showed that the larger, more capital-intensive
firms had entrepreneurs with the characteristics associated with
better capital access.
To summarize, our evidence indicates that there is the
predicted association between size, modernity and capital-inten-
sity, and a higher wage/rental ratio, although the association
is not directly related to the type of technology chosen by the
firm, but to ether characteristics of the firm and its owners.
RELATIVE PRODUCTIVITY BY CATEGORY
The diffusion model assumes that modern technology
dominates craft technology, i.e. is more efficient in the use
of both capital and labor. This assumption has been much debated
in the development literature. The debate is complicated by the
fact that the production function is usually presented in terms
of two homogeneous factors of production, labor and capital,

14
while it is recognized that modern technology often requires a
different labor skill mix as well as a different kind of entre-
preneur. In the brick industry, there are also differences in
the kind and amount of fuel per unit of output.
One approach would be to compare the different techniques
directly, valuing inputs and output characteristics at the
prices faced by the firms and at appropriate shadow prices. This
must be done using not only the technical data on machine capaci-
ties, staffing ratios, etc. but data on the actual operations
of Colombian firms; machines and people may operate differently
9 than expected under everyday conditions in a developing country.
One aspect of this is the quantity and quality of the
managerial input, which is hard to measure but very important.10
Nelson argues that the high profit rates which Colombian ac-
countants believe characterize large modern firms are evidence
for the greater productivity of the modern technology but they
may actually represent rents to scarce entrepreneurial skills
and/or rents to the entrepreneurial characteristics which give
favorable access to investment funds.
We had originally hoped to get micro data of sufficient
quality to enable us to tackle the problem directly, but this
goes to the heart of the most sensitive issue to the businessman,
his profitability, and we were unsuccessful. We did get enough
evidence to convince us that the validity of Nelson's assumption
is by no means obvious.
~- .: ....

.· ....
15
Some of this evidence is swnmarized in Figure 1. The
value of output less the value of fuel (at actual domestic
prices) was computed by category from the plant designs and used
as a rough measure of output. The figure shows production labor
and fixed capital per unit of output for categories 2 to 8; this
gives an approximation of a unit isoquant (at the scale of
operation assumed for the representative plant in that category,
i.e. incorporating any economies of scale that may exist.) The
plant designs incorporate a host of approximating assumptions,
since there were substantial variations in the efficiency of
firms within categories in their use of the same basic techni-
que: variations from firm to firm, and for the same firm over
time. (The notes to the figure contain further discussion of
some of the more important aspects of this) Thus the figure
is far from conclusive but it suggests that neigher the craft
nor the modern technology clearly dominates.
EVOLUTION OF THE INDUSTRY OVER TIME
Although we cannot resolve the relative productivity
question, we can see if the industry is evolving over time
as the diffusion model predicts.
If the new technology dominates the old, new firms
should be large, modern and capital-intensive; old firms
should gradually become so as expected profits from the change
dominate the costs. (A possible exception: some new small
scale firms may be set up with cheap secondhand capital goods

K Q-F Figure 1
FIXED CAPITAL AND LABOR COEFFICIENTS (Forming, Drying and Firing)
37 .5 - - - ---------~
31.8 - - - -i-
I 23 .a - - - -I
I I
I t
I I I I
I
CAT 2
CAT 3
CAT 4
I 10.9 - - -1-·-,- --- ~ ----+------
1 I 1 I
, I I I t
I 5.5 - - r !- - -
4 .6 - - -1- 1-I - - - - :- 1-
1 I 2 .7 - - r rl - - - .! _I
I I I I I
I )
.043 .062
.058 .122 .141' .178
CAT 5
CAT 6 CAT 7
16
.367 L Q-F

17
Notes to Figure 1
Some important reasons why the isoquants shown are very
approximate:
1. As noted earlier, the pattern of shiftwork did not differ
across firms within categories, but there was variation in the
number of firings of the kilns per unit of time and the intensity
of machinery use within a shift., across firms as well as across
categories. Also, utilization rates varied for the same firm
at different points in time.
2. There were variations in fuel efficiency, across firms within
the same category, and in the same firm at different points in
time. Fuel use varies with:
the content of sand and other substances in the clay;
the moisture content of the product at the end of the
drying process;
(This means that fuel use varies with the weather, since
both artificial and natural drying are less efficient
in wet weather; in the wet seasons, the kiln does some
of the drying. Also, minor variations iri construction
of the drying sheds can affect drying efficiency.)
the altitude;
the design of the kiln, within a particular kiln type;
(Minor variations in the structure of the air vents, etcetera,
can have major effects on fuel efficiency.)
3. Not all inputs were included. For example, the labor coefficient
includes only production labor, not managerial labor. Land is
not included, either land for the factoiyor the land which comprises

18
Notes to Figure 1 (continued)
the clay reserves. It is virtually impossible to value the land
in a consistent meaningful way, because typically the brick factories
(of various sizes and categories, side-by-side) are located on
land on the outskirts of the major cities--land which is unsuit-
able for agriculture and whose value is expected to increase as
the city grows. In many cases, removal of the clay makes the
land more suitable for eventual development.
Some specific points on a comparison of categories 3
and 4, and categories 5 and 6:
Category 3 is dominated by Category 4, given the coefficients
shown. The difference between these two categories is in the use of
artificial drying. Category 3 uses more fixed capital (in the
form of the cost of the artificial dryer) and more fuel, but it uses
less land and less working capital, since the drying time is shorten-
ed. The change in the value of work in pro~ress between the two
categories is at most, about 5% of the difference in fixed capital
cost between the two categories, which is a negligible addition
to the capital cost. The difference in land per thousands of
pesos of Q-F (value of output less value of fuel) is substantial:
2 5. 7 mt • However, to balance the Col. $8000 difference in fixed
capital investment, the land would have to cost about Col. $1400
2 per mt , or Col. $14,000,000 per hectare, which is a very subs-
tantial sum indeed, (over $400,000 U.S. per acre) especially
when it is considered that the land will appreciate in value
while the dryer will depreciate. Thus the difference in land
and working capital costs is unlikely to be sufficient to justify
the increased fixed capital investment.

19
Notes to Figure 1 (continued)
Category 5 seems to be dominated by category 6. The main
difference between these two categories is in the use of a simple
domestic machine in preparation and forming in Cat. 6 compared
to larger and more expensive imported machinery in Cat. 5. The
utilization rate has been assumed to be rather low in category 5
(about 60%) on the grounds that this is representative, while
the utilization rate in category F has been assumed to be 100%.
To make a rough correction for this, if it is assumed that
factors can be adjusted proportionally to give 100% utilization
in both categories, then the capital coefficient is very close
to that in category 6. (The capital coefficient in preparation
and forming is still somewhat higher in 5 than in 6, but this
is offset by the lower coefficient in firing). Thus it seems
that an important aspect of the Colombian capital is the fact
that it enables firms to produce at lower scales of production
without having underutilized capacity.

discarded by the modernizing firms, since if there is any market
in secondhand capital goods, their prices must adjust until the
old capital is competitive with the new. But this is merely a
transitional phenomenon.)
Although historical information was difficult to obtain,
the survey provided data on the age of the firm, the size of
the labor force at the end of the first year of operation and
the ages of the major items of capital equipment, as well as
whether they were bought new or secondhand.
Table 2 shows that the more modern, larger firms tend
to be older, not younger, although the correlations are not
strong. More direct evidence is provided by looking at changes
in category and size of individual firms over time. The data
were sufficient to identify an initial category for 37 of the
48 firms (The remaining eleven were the oldest firms; all
date from 1957 or earlier). Categories 3 and 4 are identical
except that Category 3 firms have chamber dryers which may be
used to dry part of the output. All of the firms in this
category acquired their dryers after the start of the firm and
20
at about the same time (the early 70's), so all moved from category
4 to 3 (and two firms may have moved from some other category
since their initial category could not be determined). However,
with that exception, Table 2 shows that the general picture
is not one of firms changing categories to become more modern.
Of course, for 11 firms, nearly one-fourth of the sample, we
do not know the initial category. But 8 of the 11 are now in
categories S to 8, the "craft" sector, so would not change the
overall picture.

21
Table 2
Kendall correlation Significance
Current category coefficient Level
vs. Age of Firm -0.2167 .024
vs. Employment at end of first year -0.3550 .002
Pearson correlation Significance
Age of Firm coefficient Level
vs. Current Size Measured by Employment 0.3082 .018
vs. Current Size Measured by Capacity 0.1791 .114
Changes in Category
I of firms known to I of firms I of firms
I of have started in for whom initial set up in 70s Category firms same category category tmknown Others and category
1 1 0 0 1 firm started 0 in cat 4
2 1 1 0 0 0
3* 4 0 2 z firms started ......... , .... in cat 4
4 7 5 1 1 firm started 3 in cat 5 s 9 6 3 0 5
6 4 3 1 0 3
7 10 6 4 0 3
8 12 12 0 0 8
Total 48 33 11 4 24
* Categories 3 and 4 are identical except that category 3 firms have chamber dryers which may be used to dry part of the output. All the firms acquired their dryers after the start of the firm and at about the same time (the early 70s), so all moved from category 4 to 3.
** Both started in category 4 •
.,.· .: ....
One-half of the sample consists of firms established
during the construction boom in the early 70's. All of these
firms are still in the same category they started in except
the two which moved" from category 4 to 3. The distribution of.
firms by category in this subgroup is not that different from
the distribution of firms in the sample as a whole, contrary
to the prediction that only modern firms would be set up.
The survey showed that firms generally do grow over
time. The change in the labor force is biased downward as
an indicator of change in firm size, because of a severe slump
in demand at the time of the survey and also because the
capital-labor ratio. and the output-labor ratio are likely to
increase with size. Nevertheless employment had increased for
36 of the firms and decreased for only 7 (unknown for five).
Capital equipment had generally been added over time. However,
Table 2 suggests that growth comes primarily within the same
category or with a movement to the next category only.
·The age of the firm can be ambiguous. Many firms had
changed their form of legal organization and their share-
holders over time and it was not always clear what date to
take ·for the founding of the company. Thus it is useful to
look at the major items of capital equipment to see if there
is a pattern of introduction of technology over time. If the
age of the equipment is uniformly older, the higher the category
number, then one could argue that coexistence of the categories
..,,.· .: ....
22
23
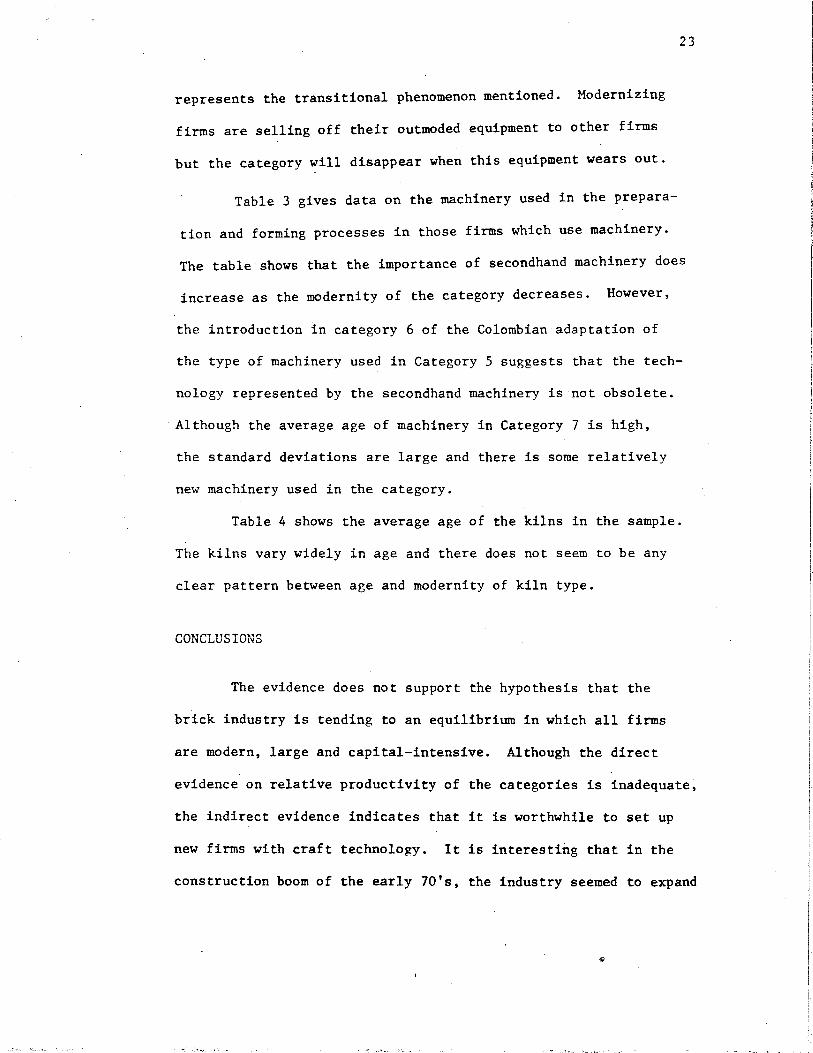
represents the transitional phenomenon mentioned. Modernizing
firms are selling off their outmoded equipment to other firms
but the category will disappear when this equipment wears out.
Table 3 gives data on the machinery used in the prepara-
tion and forming processes in those firms which use machinery.
The table shows that the importance of secondhand machinery does
increase as the modernity of the category decreases. However,
the introduction in category 6 of the Colombian adaptation of
the type of machinery used in Category 5 suggests that the tech-
nology represented by the secondhand machinery is not obsolete.
Although the average age of machinery in Category 7 is high,
the standard deviations are large and there is some relatively
new machinery used in the category.
Table 4 shows the average age of the kilns in the sample.
The kilns vary widely in age and there does not seem to be any
clear pattern between age and modernity of kiln type.
l"'\r\.'l.,.,.,T TT rt Tn'l.Tt""' \.,Uft\.,LUi:>J.Ul~i:>
The evidence does not support the hypothesis that the
brick industry is tending to an equilibrium in which all firms
are modern, large and capital-intensive. Although the direct
evidence on relative productivity of the categories is inadequate~
the indirect evidence indicates that it is worthwhile to set up
new firms with craft technology. It is interesting that in the
construction boom of the early 70's, the industry seemed to expand
,: ...

24
Table 3: Preparation and Forming Machinery
# of Firms In Cat. Total '# Machines A;!,e of Machines -Type of Tech With This - # of Bought Standard
Machinerv Cat Type Machine Machines Second-hand Mean Deviation :.Jinimum Maximum
Preparation 1 NA Machinery 2 1 5 0 21.01 0 21 21
3 4 23 r) o. 4: 7.0 4 30 4 7 20 10 15.5 7.~ 4 28 5 6 17 5 9. 5; 9.3 2 26 6 3 4 4 18.o' 4.o 12 20 7 3 6 2 21. 3 18.0 4 48 8 4 4 3 15.01 7.8 4 21 -
Extruder 1 ~iA I Without ') 0 i '-
De-airing 3 0 ' ' Chamber 4 0 I
5 0 i
6 0 I
7 9 11 10 21 o' 20.3 1 51 ....... , 8 0 I
I
Extruder 1 NA r 21.01 With 2 1 1 0 0 21 21
De-airing ~ 4 7 0 13.9, 10. 3 I 4 30 _J
Chamter 4 I 7 7 2 13. 7! 5.3 I 5 21 5 9 10 2 9. 31 7.2 i 4 26 6 5 5 3 13.4! 5.5
I 6 21
7 0 ! 8 0 I - -- I , NII ....... \.41..1.\A.~..J... ... .. ,,.. ' I Cutters 2 0 I I
3 1 1 1 29.0i 0 20 29 4 0 5 1 1 0 6. () 0 6 6 I) 4 4 1 9.5 3,0 6 12 7 8 10 9 20.6 18.5 3 51 8 0
Automatic 1 NA Cutter 2 1 1 0 21.0 0 21 21
3 4 7 0 8.1 6.o 4 20 4 7 7 2 12.4 4.9 5 21 5 9 9 2 7.9 4.4 4 16 6 0 7 0 I 8 0 l i .
NA = Not Available ·

Table 4: Kilns
-·-- - ·- -··---·----· I
- -···
Type of Kiln
. -
Intermittent (Vertical Flame) -Intermittent (Inverted Flame) - -·-------- -Hoffmann
Tunne1 3 I I
Age of Kilns1 ')
Capacity in Common Brick Volume ~quivalents~ -- -
Total I l . I -------1 Standard Min- Max- Total l Standard # Mean Deviation imum ~ imum ! # I Mean Deviation Minimum Maximum i l
I ·--~- ----- ----
! ----· . I
102 11.8 11.1 I 0 46 101 40,925 I 2:1.,339 6,000 86,100
26 26.7 15.6 1 49 18 47,797 22,506 20,000 84,060
--··--·-· -·--L-----·----- '-· ----· '--- ----··----- -16 18.7 I 56 I 14 286,106 ' 127,881 147,600 508,096 13.1 5 '
I -+ I i I
1 19 0 I 19 19 I l 1,300,000 i 0 1,300,000 1,300,000 ' -·
1i3ased on data for 148 kilns
2Based on data for 137 kilns
3Quantitati ve data available only for kiln in category 2. Tunnel kiln in category 1 is known to be newer and larger.
N \JI

26
across the board. The largest, most technologically sophisticated
brick factory in the country (in Category 1) was built. Category
3 was created, with the introduction of artificial chamber dryers
for the first time ·in Colombia. But this was also the period
of introduction of an adaptation of imported technology, the
Colombian-produced de-airing extruder, which enabled firms to
be smaller in scale, and less capital-intensive. In addition,
there was a great expansion in the number of tiny artisan firms
which use technology even simpler than the simplest craft tech-
nology discussed here.
The diffusion model is not a good description of this
industry. The structure to this author looks more like the long-
term coexistence of a set of representative firms with no
tendency to converge on one type.
In another paper, we have argued that the structure of
capital and labor markets in Colombia,.a structure which is
highly imperfect and whose imperfections can to a great extent
be traced to government policies, creates an environment in
which profit-maximizing entrepreneurs face different constraints
and therefore choose to build firms in the different categories.
The input market imperfections have existed for a long
time and show no great tendency to change (although the whole
wage structure is moving upward over time). Thus the industry
is likely to continue to develop with a structure of parallel
lines of entrepreneurs who never meet. The individual categories
may change over time, but the coexistence of different categories
is not tending to be eliminated.
w" .: ••••
27
The evidence presented is for only one industry, but we
think it can be generalized. The coexistence of widely different
techniques of production is characteristic of other ·industries.
The input market imperfections are not unique to the brick industry,
but operate throughout the economy. Therefore we think it is
quite likely that the results would be duplicated in other
industries.
The analysis suggests that modern may not be better. Al-
though it is hard to measure productivity directly, what data
we have suggests that the craft technology is not necessarily
dominated, and we know that in addition to capital, unskilled
labor and fuel, (which are incorporated in Figure 1) modern
technology does tend to use more of other factors that are in
short supply such as managerial labor. Since the market imper-
fections are such that the wage/rental ratio that produces the
large capital-intensive modern-style firm is farther from the
social opportunity cost wage/rental ratios than for the smaller
firms, perhaps the "right" industry structure would eliminate
the large firms rather than the small firms.
,: ...
28
FOOTNOTES
*Portions of this research were supported by the Agency
for International Development and the Edna McConnell Clark Founda-
tion. The collaboration of FICITEC (Fundacion para el Fomento
de la Investigacion Cientifica y Technologica) of Bogot~, Colombia
and the cooperation of brick industry manufacturers and consultants
were very important. The research assistance of Eleanor Sylvan
and typing of Joann Young are gratefully acknowledged, as are the
comments of Martin Baily and my colleagues at the Economic Growth
Center. Of course, the responsibility for the views expressed in
this paper is my own.
1R. Nelson, T. P. Schultz, R. L. Slighton, Structural
Change in a Developing Economy, (Princeton, N.J.: Princeton
University Press, 1971), Chapter IV.
~.A. Baily, "Factor Market Structure and Technology
Choice in the Colombian Brick Industry," Journal of Development
Economics, forthcoming.
3There was an additional category of tiny artisan estab-
lishments using temporary kilns (open clamp kilns) which we
have not included in the study because it was impossible to
get any survey data on them.
4 Also, we should note that by specifying the industry
narrowly, product heterogeneity was greatly lessened but not elim-
inated. Within the clay brick industry, there are different
products whose characteristics are related to variations in choice
of technology. However the products are much closer substitutes
... - -··-··

than in broader industry classifications and no technology
category produces a product which has no close substitute
produced by some other category.
29
5since the more capital-intensive categories tend to use
more imported machinery and historically the Colombian exchange
rate has generally been overvalued, the use of social opportunity
cost prices instead of peso prices would not change the order
of the categories and would increase the dispersion of the capital-
intensities.
6rhe pattern of shiftwork did not differ across firms with-
in categories. There was variation in the number of firings of
the kilns per unit of time and the intensity of machinery use
within a shift, across firms and across categories. The composite
capital-labor ratio for the category was adjusted in a rough way
to reflect the pattern of utilization that was representative of
the category operating at capacity as defined in footnote 7. In
other words, since the capital figure is a stock figure and the
labor figure is number of full-time workers per month (hours per
month per full-time worker did not vary across firms) the composite
ratio implicitly incorporates the choice of capital utilization
rates as well as size of capital stock.
Further details of the data and the representative plant
designs can be obtained in M.A. Baily, "Technology Choice in
the Brick and Men's Leather Shoe Industries in Colombia," Final
"Report to Agency for International Development, Contract No.
AID/ctr C-1326, 1977, or by request to author.

30
7capacity output was defined as the value of output that
the firm would be willing and able to produce, on a long term
basis, with no more than a 5% additional expenditure on plant
and equipment, and with as many additional workers as would be
needed (assuming that they could be hired at the current wage
rate, and that all output could be sold at current prices).
Since the industry was experiencing an unanticipated slump,
which was having uneven effects across the industry, it is felt
that capacity output is the best measure of size of firm
available.
8Formal credit lines generally require the security of
a machine or building and thus to some extent encourasi;e the use
of capital relative to labor. Credit tPnn~ t~n~ to be better
for imported machinery than for domestic machinery, since the
former comes from large international companies with favorable
access to capital themselves, and the latter is generally made
in small Colombian workshops, which have poor access to capital.
Of course any lender will be interested in the ability of the
borrower to repay the loan, which gives him an interest in the
profitability of the project.
9For example, we found evidence of significant variation
in the productivity of technology as used in Colombia compared
to the original models in foreign countries, particularly in
the more sophisticated categories. Minor differences in
construction and operation techniques led to lower efficiency

31
in the Hoffmann and tunnel kilns. None of the chamber dryers
in the sample worked as well as they had been expected to, and
several did not function at all.
lOThe quantitative data on labor force composition showed
that while production workers hardly differed at all in skill
level (being all relatively unskilled), the managerial staff tend-
ed to be better educated in the more modern categories .. There
was qualitative evidence that the more modern the firm in tech-
nology, the more sophisticated the entrepreneurs.