
Core-scale characterisation of flow in tight Arabian formations
9
ORIGINAL PAPER - PRODUCTION ENGINEERING Core-scale characterisation of flow in tight Arabian formations Lateef T. Akanji • Ghasem G. Nasr • Mohamed Bageri Received: 26 September 2012 / Accepted: 7 May 2013 / Published online: 24 June 2013 Ó The Author(s) 2013. This article is published with open access at Springerlink.com Abstract Production from tight reservoirs usually requires enhancement due to problems associated with very low permeability. The collection of the fundamental knowledge database needed to fully understand the key mechanisms affecting flow behaviour in tight formation is still sparse. In this paper, we applied a new technique of measuring flow properties in porous media to characterise flow behaviour in core samples of tight carbonate forma- tions. A high-pressure automatic mercury injection appa- ratus was used to directly estimate basic routine data of tight core samples. The result of this experimental study showed that entry capillary pressure required for the mer- cury to intrude the pore-space, is strongly dependent on pore-size distribution; typically high (&13.79 MPa) for average pore-size of about 70 nm and low ( \ 0.07 MPa) for average pore-size of 1 lm in the carbonate core samples. Moreover, the permeability of the samples is higher for the core samples obtained vertically through the parent rock. Keywords Tight formation Entry capillary pressure Pore intrusion Pore-size Permeability Introduction Tight formations are considered to be reservoirs with an absolute permeability of generally less than 10 mD and can range down to micro-Darcy range, (lD or 10 -6 Darcy) in many situations. These reservoirs could potentially serve as media for the storage of commercial accumulation of hydrocarbon. However, production and ultimate recovery are usually uneconomical due to a number of factors which include: poor reservoir quality, unfavourable initial satu- ration condition, formation damage caused by drilling and completion operations, hydraulic or acid fracturing, kill or work-over treatments and other production-related prob- lems (Bahrami et al. 2011). Many tight reservoirs are extremely complex producing oil or gas from multiple layers with low permeabilities that often require enhancement by natural fractures. Despite the marginal economics and low productivity from these res- ervoirs, the soaring demands for energy has necessitated a devotion of technologies to optimise recovery. Description of the pore geometry of reservoirs plays a major role in understanding the degree of pore inter-connectivity, pore- shapes and sizes, capillary trapping potentials and flow behaviour (e.g. Bliefnick and Kaldi 1996; Melas and Friedman 1992; Vavra et al. 1992). Mercury injection method is a widely used technique for the evaluation of capillary pressure and pore-size and pore- size distribution of porous formation (e.g. Purcell 1949; Brooks and Corey 1981; Katz and Thompson 1987; Pitt- man 1992). Other petrophysical characteristics such as porosity and irreducible water saturation are determined using mercury porosimetry. These petrophysical properties determine the shape, slopes and plateau of the capillary pressure curve. Although, the differences between air/ mercury and brine/hydrocarbon systems do not allow mercury injection method to reproduce reservoir-specific conditions; it provides a very accurate analogue when calibrated to measured and calculated values of reservoir fluid properties (Vavra et al. 1992). L. T. Akanji (&) G. G. Nasr Petroleum and Gas Engineering Division, School of Computing Science and Engineering, University of Salford, Manchester, UK e-mail: [email protected] M. Bageri Department of Petroleum and Natural Gas Engineering, King Saud University, Riyadh, Saudi Arabia 123 J Petrol Explor Prod Technol (2013) 3:233–241 DOI 10.1007/s13202-013-0062-1
Transcript of Core-scale characterisation of flow in tight Arabian formations

ORIGINAL PAPER - PRODUCTION ENGINEERING
Core-scale characterisation of flow in tight Arabian formations
Lateef T. Akanji • Ghasem G. Nasr •
Mohamed Bageri
Received: 26 September 2012 / Accepted: 7 May 2013 / Published online: 24 June 2013
� The Author(s) 2013. This article is published with open access at Springerlink.com
Abstract Production from tight reservoirs usually
requires enhancement due to problems associated with very
low permeability. The collection of the fundamental
knowledge database needed to fully understand the key
mechanisms affecting flow behaviour in tight formation is
still sparse. In this paper, we applied a new technique of
measuring flow properties in porous media to characterise
flow behaviour in core samples of tight carbonate forma-
tions. A high-pressure automatic mercury injection appa-
ratus was used to directly estimate basic routine data of
tight core samples. The result of this experimental study
showed that entry capillary pressure required for the mer-
cury to intrude the pore-space, is strongly dependent on
pore-size distribution; typically high (&13.79 MPa) for
average pore-size of about 70 nm and low (\0.07 MPa) for
average pore-size of 1 lm in the carbonate core samples.
Moreover, the permeability of the samples is higher for the
core samples obtained vertically through the parent rock.
Keywords Tight formation � Entry capillary pressure �Pore intrusion � Pore-size � Permeability
Introduction
Tight formations are considered to be reservoirs with an
absolute permeability of generally less than 10 mD and can
range down to micro-Darcy range, (lD or 10-6 Darcy) in
many situations. These reservoirs could potentially serve as
media for the storage of commercial accumulation of
hydrocarbon. However, production and ultimate recovery
are usually uneconomical due to a number of factors which
include: poor reservoir quality, unfavourable initial satu-
ration condition, formation damage caused by drilling and
completion operations, hydraulic or acid fracturing, kill or
work-over treatments and other production-related prob-
lems (Bahrami et al. 2011).
Many tight reservoirs are extremely complex producing
oil or gas from multiple layers with low permeabilities that
often require enhancement by natural fractures. Despite the
marginal economics and low productivity from these res-
ervoirs, the soaring demands for energy has necessitated a
devotion of technologies to optimise recovery. Description
of the pore geometry of reservoirs plays a major role in
understanding the degree of pore inter-connectivity, pore-
shapes and sizes, capillary trapping potentials and flow
behaviour (e.g. Bliefnick and Kaldi 1996; Melas and
Friedman 1992; Vavra et al. 1992).
Mercury injection method is a widely used technique for
the evaluation of capillary pressure and pore-size and pore-
size distribution of porous formation (e.g. Purcell 1949;
Brooks and Corey 1981; Katz and Thompson 1987; Pitt-
man 1992). Other petrophysical characteristics such as
porosity and irreducible water saturation are determined
using mercury porosimetry. These petrophysical properties
determine the shape, slopes and plateau of the capillary
pressure curve. Although, the differences between air/
mercury and brine/hydrocarbon systems do not allow
mercury injection method to reproduce reservoir-specific
conditions; it provides a very accurate analogue when
calibrated to measured and calculated values of reservoir
fluid properties (Vavra et al. 1992).
L. T. Akanji (&) � G. G. Nasr
Petroleum and Gas Engineering Division, School of Computing
Science and Engineering, University of Salford, Manchester, UK
e-mail: [email protected]
M. Bageri
Department of Petroleum and Natural Gas Engineering,
King Saud University, Riyadh, Saudi Arabia
123
J Petrol Explor Prod Technol (2013) 3:233–241
DOI 10.1007/s13202-013-0062-1

Mercury injection capillary pressure (MICP) measure-
ments may also be integrated with seismic and micro-
structural data to provide a robust basis for interpretation of
the reservoir sealing capacity, storage and trapping poten-
tials and stability/strength of individual strata. Analysis of
the MICP curve is, therefore, important for various phases
of reservoir production, especially secondary and tertiary
recovery from tight formation. These data may also be
evaluated in conjunction with additional special and rou-
tine core data to accurately assess the reservoir and/or
sealing potential.
In order to optimise production from tight reservoirs,
adequate pore-to-macro-scale characterisation is required
to establish the influence of pore-scale geometries on flow
properties at the macro-scale (e.g. Akanji and Matthai
2010). A lot has been done on estimation of both air and
absolute permeability of basic rock properties from MICP
measurements (e.g. Klinkenberg 1941; Archie 1950;
Brooks and Corey 1981; Katz and Thompson 1981;
Thompson et al. 1987; Dastidar et al. 2007; Walls and
Amaefule 1985; Khan et al. 2011); however, technologies
required for the acquisition of accurate rock–fluid interac-
tion data necessary to understand flow behaviour in tight
formations with permeability in the micro-Darcy (lD)
range are currently being researched (e.g. Swanson 1966;
Huet et al. 2005; Comisky et al. 2007). Furthermore, the
effect of capillarity on flow property variation in a verti-
cally and horizontally obtained tight core samples is still
not well understood.
The aim of this work is therefore to investigate the
interrelation between pore capillary data and flow param-
eters of tight core samples obtained vertically and hori-
zontally from parent rock. An advanced state-of-the-art
automatic pore intrusion (AutoPore IV) apparatus capable
of injecting non-wetting phase (mercury) in user-defined,
step-like pressure increments up to 414 MPa (60,000 psi)
was utilised. Each core sample was evacuated and cleaned/
dried prior to the running of the experiment. An innovative
laboratory approach was used to control injection direction
thereby allowing basic petrophysical parameters to be
accurately derived and flow behaviour determined.
Capillary pressure determination using high-pressure
mercury injection
High-pressure automatic mercury injection apparatus was
used in the characterisation of the tight core samples. The
volume of injected mercury (SHg) at each pressure incre-
ment is automatically recorded until the maximum ana-
lytical pressure, or 100 % pore-volume mercury saturation
is achieved. Pressure is then plotted against incremental
mercury saturation (SHg) readings to generate the drainage
curve.
When two immiscible fluids co-exist, the rock–fluid
interaction can be defined by the capillary pressure mea-
sured across the interface. Mercury is used as the injection
fluid since it is non-wetting and non-reactive with most
solid surfaces. Furthermore, it has a contact angle of about
140� for most solids and therefore requires the application
of pressure before intruding the pore-spaces. Utilising this
approach, air is then assumed to be the wetting phase while
mercury is the non-wetting phase (Melrose et al. 1994);
capillary pressure is therefore defined as:
Pc ¼ Pnw � Pw; ð1Þ
where Pw and Pnw are the wetting (air) and non-wetting
(mercury) capillary pressure, respectively.
The wetting-phase is retained within the porous medium
by surface adhesion forces holding the fluid as a film
completely covering the rock surfaces and by capillary
forces separating it and the liquid.
Estimation of porosity and permeability from mercury
injection method
The porosity / from the mercury injection method is
estimated using the bulk and total intrusion (pore) volumes
thus:
/ ¼ Vpore
Vbulk
; ð2Þ
where Vpore is the total intrusion volume, (m3) and Vbulk is
the volume of the penetrometer minus volume of mercury
in the penetrometer, measured at the end of the low
pressure mercury injection, i.e.
Vbulk ¼ Vpenetrometer �Dw
qHg
; ð3Þ
where Dw is the difference in weight of the penetrometer
with sample at the end of the low pressure mercury
injection minus penetrometer with sample under vacuum
and qHg is the density of mercury (kg/m3)
The permeability (in mD) calculation from the mercury
injection is based on the power law approximation of
Swanson (1966). Swanson showed that by drawing a line at
45�, tangent to the hyperbolic plot between mercury satu-
ration and the capillary pressure, the portion of the sample
effectively contributing to fluid flow can be determined.
The permeability is then estimated thus:
j ¼ 399SHg
Pc
� �1:691
A
; ð4Þ
where Pc is the capillary pressure, (Pa); SHg is the mercury
saturation, (% of bulk volume); A is the maximum value of
SHg/Pc derived from the intersection between the 45� line
and the hyperbolic plot.
234 J Petrol Explor Prod Technol (2013) 3:233–241
123

Pore-size determination using the concept of most
frequent pore
At every mercury injection pressure, the variations in sat-
uration within the pore-space corresponding to certain radii
r, is a variable fraction of the pore volume representing a
percentage of the entire porous media. The peak of the
curve corresponds to a certain pore-radius called ‘‘the most
frequent pore’’ (e.g. Monicard 1980). Mercury intrusion is
based on the capillary law governing liquid invasion into
small pores.
Capillary forces in the reservoir are functions of surface
and interfacial tensions, pore-size and shape and rock
wettability. This law, in the case of a non-wetting liquid
like mercury and assuming cylindrical pores is expressed
by the (e.g. Washburn 1921) equation:
Pc ¼ PHg � Pair
¼ 2rHg�air cos hHg�air
r;
ð5Þ
where Pc is the capillary pressure, r is the surface tension
interfacial tension between mercury and air in dynes/cm
(typically 480 dynes/cm), r is the pore-size (lm) and hHg-air
is the contact angle between mercury and air in degrees
(typically 140�).Equation 5 can convert a measured function a (Pc) into
an equivalent function a(r) curve which is a cumulative
pore-size distribution (PSD); indicating the combined pore
volume with opening radius less than r. Basically, the pore-
size distribution (PSD) is then simply the derivative (e.g.
Leij et al. 2002):
f ðrÞ ¼ daðPcÞdr
ð6Þ
Experimental set-up, techniques and procedures
Formation geological background
Data set investigated comprised of seven whole core plug
samples, representing two Arabian fields; Khuff and Wasia
formations. Khuff is a massive interbedded limestone,
dolomite and dolomitic limestone, with occasional anhy-
drite found in southern Ghawar Field, Eastern Saudi Ara-
bia. The geologic age of the formation sampled ranges
from Permian to Triassic. Laboratory experiments were
conducted on five (5) carbonate samples obtained from
Duhaysan which is a member of the Khuff formation
(Dukhayyil and Tawil 2006).
The sandstone core samples were obtained from the
Wasia formation. Lithologically, the middle cretaceous
Wasia formation in the area can be divided into two major
units: the Lower Wasia sequence of mainly siliciclastic
facies (Khafji, Safaniya, Mauddud and Wara Members) of
Albian-early Cenomanian age and the Upper Wasia fine-
grained siliciclastic and carbonate sequence (Ahmadi,
Rumaila and Mishrif Members) of Cenomanian–Turonian
age. The sample member investigated is the Khafji which
is of middle cretaceous age. It is composed of sandstone
and siltstone. A detailed description of the sedimentary
facies in the Wasia members and their inter-relationships in
terms of depositional environment can be found in Sharief
et al. (1989).
Experimental set-up
Table 1 shows the description and measurements of the
seven samples before the tests. The letters V and H are used
to differentiate samples cut vertically through the parent
rock from those obtained horizontally. The essence of
obtaining samples in vertical and horizontal alignment is to
investigate the effect of bedding strata on flow character-
istics within the pore space. The core samples have been
numbered 1-7 for easy identification.
Each core sample was prepared by first drilling out
3.81 cm diameter core both vertically and horizontally to
the parent rock (Fig. 1). The samples are then cut into
smaller pieces of 1:27 � 1:27 � 0:51 cm sizes (Fig. 2)
using core cutting machine. These smaller pieces allow the
cores to fit into the penetrometer cup (see ‘‘Experimental
procedure’’) with enough clearance round the whole sur-
faces to enable the mercury to intrude the pores.
Experimental technique
An automatic pore intrusion (Fig. 3) combines an advanced
pressure transducer system with a high-resolution analog-
to-digital converter and specialised equilibration and
measurement routines for data collection (Poston et al.
2011). The penetrometer (Fig. 4) is made of a sample cup
bonded to a metal-clad, precision-bore and glass capillary
stem. The choice of a penetrometer for the test is dependent
Table 1 Core sample data
Sample
name
Core
number
Sample
weight (g)
Sample ?
penetrometer
weight (g)
Assembly
weight (g)
Duhaysan V 1 4.58 65.84 133.95
Duhaysan H 2 4.68 65.95 133.53
QT18 V 3 3.57 64.82 136.75
QT18 H 4 5.39 66.64 130.46
QT19 V 5 12.26 79.62 238.1
Khafji V 6 3.99 65.23 131.46
Khafji H 7 3.18 64.49 136.27
J Petrol Explor Prod Technol (2013) 3:233–241 235
123

upon the sample volume and porosity. A valid test will
normally require evacuation to remove contaminant gases
and vapours (usually water) and also ensuring that not less
than 20 % of the penetrometer stem volume is displaced
into the sample (Dsouza and More 2008).
Experimental procedure
The core samples are first cleaned by extracting reservoir
oil contained in it using a Soxhlet apparatus (Fig. 5). This
is achieved by dripping a solvent usually toluene or a
mixture of acetone and chloroform, over the core samples.
In this method, the water and solvent are vapourised,
recondensed in a cooled tube in the top of the apparatus and
the water collected in a calibrated chamber (Soxhlet 1879).
The solvent overflows and drips back over the samples.
The oil removed from the samples remains in solution in
the solvent. The duration of the cleaning process varies
between 1 week for the carbonate, and 3 weeks for the
sandstone core samples. The core samples are then dried in
oven in readiness for the mercury intrusion experiment.
Mercury injection procedure
The mercury injection procedure can be described as
follows:
1. The core sample is placed in the penetrometer and
loaded in the low-pressure chamber of the equipment.
The penetrometer is evacuated to a pressure of less
than 20 lm of mercury, and then filled with mercury at
Fig. 1 Typical core samples from a sandstone and b carbonate
Arabian formations
Fig. 2 Core samples cut into cuboidal shapes to allow placement into
the penetrometer. a Horizontally and b vertically obtained core
samples
Fig. 3 Micro-Meritics automatic mercury intrusion apparatus (Auto-
Pore IV)
Fig. 4 Cross-section of a penetrometer in which pressure has forced
some mercury into the pores of the sample and about 50 % of the
stem capacity has been used (Modified from Dsouza and More 2008).
Stem volumes of penetrometer used ranges from 0.392 to 1.131 mL
236 J Petrol Explor Prod Technol (2013) 3:233–241
123

a pressure of 0.01 MPa (1.5 psia). The volume of
mercury entering the larger pores in the core sample is
monitored. During this stage, pores of diameters down
to about 0.36 mm are filled.
2. Mercury is injected incrementally into the core sample
from 0.01 MPa (1.5 psia) to 0.2 MPa (30 psia), using
nitrogen gas as the displacing medium. At each
pressure increment, mercury intrusion is monitored
while the pressure is held constant. Equilibrium is
reached when the intrusion rate drops below 0.001 lL/
g/s. The pressure and the total volume for each point
are recorded.
3. The low-pressure stage is complete at the end of the
0.2 MPa (30 psia) injection. The pressure is then
reduced to atmospheric and the penetrometer together
with the mercury intruded sample removed and
weighed (the assembly weight).
4. The sample is then loaded into the high-pressure
chamber of the equipment and mercury injected
incrementally from 0.2 MPa (30 psia) to 414 MPa
(60,000 psia), using hydraulic oil as the displacing
medium.
5. The test is complete when the high pressure stage of
414 MPa (60,000 psia) is reached and the injection
pressure is reduced to atmospheric. During this stage,
pores down to about 0.003 lm are filled.
The volume of mercury injected at each pressure
determines the non-wetting (i.e., mercury) saturation, SHg.
The equilibrium time for the low and high pressure cells
are generally 20 and 45 s, respectively. In the equilibration
mode, an accurate measurement of pressure is achieved
with the high-resolution system. These data provide the
basis for the calculation of pore volume, pore area, pore
distribution and sample density. The assigned operating
conditions can be stored as a template and reassigned to
other samples, thereby saving time and minimising the
potential for human error.
Results and discussion
The capillary pressure versus mercury saturation (Pc - SHg)
plots for all the samples are shown in Figs. 6, 8 and 10 while
the pore-size distribution for all the core samples studied are
shown in Figs. 7, 9 and 11. The Pc - SHg and pore-size
distribution plots for the cores 3 and 5 are similar; hence only
3 is shown.
As can be seen in Figs. 6, 8 and 10, the capillary pres-
sure required for the mercury to intrude the pore-space, is
strongly dependent on pore-size distribution (Figs. 7, 9 and
11). The entry pressures (Pentry) were observed to be con-
sistently high for all the carbonate core samples obtained
vertically as opposed to those obtained horizontally. The
sandstone have relatively smaller entry pressure (Pentry)
with the pore-size distribution well shifted to the right. The
estimated permeability–porosity (j - /) relationship for
the five (5) tight carbonate samples and two (2) sandstone
samples is displayed in Fig. 12.
The root mean square error (RMSE) between the pre-
dicted and actual intrusion volumes; Vpredicted and Vactual,
respectively, over n pressure data points for each of the
core samples is calculated thus:
Fig. 5 Soxhlet apparatus containing some of the core samples used in
this work
Fig. 6 Plots of capillary pressure versus mercury saturation for the
carbonate core samples 1 and 2. The red and blue colours represent
vertically and horizontally obtained samples, respectively. The dash
and thick lines represent the uncorrected and conformance corrected
data, respectively
J Petrol Explor Prod Technol (2013) 3:233–241 237
123

RMSE ¼
ffiffiffiffiffiffiffiffiffiffiffiffiffiffiffiffiffiffiffiffiffiffiffiffiffiffiffiffiffiffiffiffiffiffiffiffiffiffiffiffiffiffiffiffiffiffiffiffiffiPni¼1ðVpredicted � VactualÞ2
n
s; ð7Þ
and the pore fractal dimension which quantifies the fractal
geometry of the core sample is estimated (see Webb 2001).
Table 2 shows the root mean square (RMSE) and the
fractal dimension of the core samples investigated. The
volumetric RMSE are generally low for all the samples and
0 for the sample QT19 V with a fractal dimension of 3.
It is known that the accuracy of the mercury injection
experiment particularly for tight samples, is dependent on
the degree of sample roughness (or external irregularity)
and must be removed from the capillary pressure curve
before an estimate of permeability is attempted. This is
known as conformance correction and always occurs in the
low pressure portion of the injection profile. Therefore, a
systematic approach similar to that suggested by Comisky
et al. (2007) was employed in the conformance correction
of all the samples. In all the capillary pressure curves
(Figs. 6, 8, 10), the dash curves represent the uncorrected
injection profile while the thick curves are the conformance
corrected injection profile.
Further, in the high pressure region, the capillary pres-
sure should be corrected for the effect of material
Fig. 7 Normalised pore-size distribution (PSD) for samples 1 and 2
Fig. 8 Plots of capillary pressure versus mercury saturation for the
carbonate core samples 3 and 4. The red and blue colours represent
vertically and horizontally obtained samples, respectively. The dash
and thick lines represent the uncorrected and conformance corrected
data, respectively
Fig. 9 Normalised pore-size distribution (PSD) for samples 3 and 4
Fig. 10 Plots of capillary pressure versus mercury saturation for the
carbonate core samples 6 and 7. The red and blue colours represent
vertically and horizontally obtained samples, respectively. The dash
and thick lines represent the uncorrected and conformance corrected
data, respectively
238 J Petrol Explor Prod Technol (2013) 3:233–241
123
compression, void collapse or both. Although, this cor-
rection, known as the ’blank’ correction tends to have little
effect on the estimated permeability due to the fact that
most of the permeability models use the low pressure
region of the capillary pressure curve; it can lead to the
deviation of the data from expected asymptotic trend (see
for instance Webb 2001). The penetrometers used in this
work were all calibrated with a set of ’blank’ runs made
with plugs of varying sizes to give a blank corrected cap-
illary pressure data.
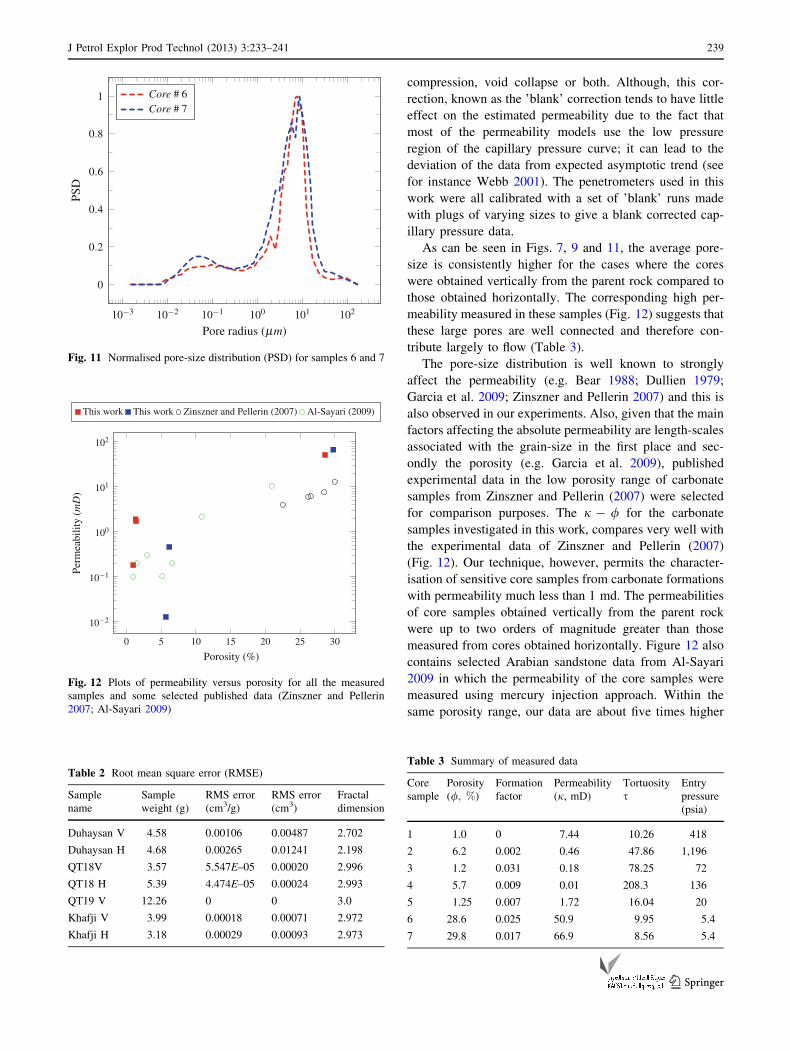
As can be seen in Figs. 7, 9 and 11, the average pore-
size is consistently higher for the cases where the cores
were obtained vertically from the parent rock compared to
those obtained horizontally. The corresponding high per-
meability measured in these samples (Fig. 12) suggests that
these large pores are well connected and therefore con-
tribute largely to flow (Table 3).
The pore-size distribution is well known to strongly
affect the permeability (e.g. Bear 1988; Dullien 1979;
Garcia et al. 2009; Zinszner and Pellerin 2007) and this is
also observed in our experiments. Also, given that the main
factors affecting the absolute permeability are length-scales
associated with the grain-size in the first place and sec-
ondly the porosity (e.g. Garcia et al. 2009), published
experimental data in the low porosity range of carbonate
samples from Zinszner and Pellerin (2007) were selected
for comparison purposes. The j - / for the carbonate
samples investigated in this work, compares very well with
the experimental data of Zinszner and Pellerin (2007)
(Fig. 12). Our technique, however, permits the character-
isation of sensitive core samples from carbonate formations
with permeability much less than 1 md. The permeabilities
of core samples obtained vertically from the parent rock
were up to two orders of magnitude greater than those
measured from cores obtained horizontally. Figure 12 also
contains selected Arabian sandstone data from Al-Sayari
2009 in which the permeability of the core samples were
measured using mercury injection approach. Within the
same porosity range, our data are about five times higher
Fig. 11 Normalised pore-size distribution (PSD) for samples 6 and 7
Fig. 12 Plots of permeability versus porosity for all the measured
samples and some selected published data (Zinszner and Pellerin
2007; Al-Sayari 2009)
Table 2 Root mean square error (RMSE)
Sample
name
Sample
weight (g)
RMS error
(cm3/g)
RMS error
(cm3)
Fractal
dimension
Duhaysan V 4.58 0.00106 0.00487 2.702
Duhaysan H 4.68 0.00265 0.01241 2.198
QT18V 3.57 5.547E–05 0.00020 2.996
QT18 H 5.39 4.474E–05 0.00024 2.993
QT19 V 12.26 0 0 3.0
Khafji V 3.99 0.00018 0.00071 2.972
Khafji H 3.18 0.00029 0.00093 2.973
Table 3 Summary of measured data
Core
sample
Porosity
(/; %)
Formation
factor
Permeability
(j, mD)
Tortuosity
sEntry
pressure
(psia)
1 1.0 0 7.44 10.26 418
2 6.2 0.002 0.46 47.86 1,196
3 1.2 0.031 0.18 78.25 72
4 5.7 0.009 0.01 208.3 136
5 1.25 0.007 1.72 16.04 20
6 28.6 0.025 50.9 9.95 5.4
7 29.8 0.017 66.9 8.56 5.4
J Petrol Explor Prod Technol (2013) 3:233–241 239
123

than their reported data; which is very good, given that
permeability can range by several orders of magnitude in
the same geological formation.
In order to further understand the effects of low porosity
and low permeability on the flow behaviour in the tight
carbonate samples, the tortuosity s and formation resis-
tivity measured experimentally were analysed. Comparing
samples 1, 3, 5 and 6, 7 shown in Table 3, it can be seen
that the tortuosity and formation resistivity factor decrease
as the permeability increases at relatively constant poros-
ity. This trend exhibited by the rock-pore characteristics
investigated in this work is comparable to the published
trends of s and porosity / in the literature (Amyx et al.
1960; Owolabi and Watson 1993; Pape et al. 1998).
Conclusion
A high-pressure automatic mercury injection apparatus was
used to derive basic routine core data governing flow in tight
formations. The entry capillary pressures in the carbonate
samples which have very low permeability, were observed to
be much higher than the fairly homogeneous clastic core
samples by up to three orders of magnitude. Also, the per-
meabilities of core samples obtained vertically from the
parent rock were up to two orders of magnitude greater than
those measured from cores obtained horizontally.
Although, our technique already considered the con-
formance correction as suggested by previous authors (e.g.
Comisky et al. 2007); it is clear that additional work is
required in characterising and improving the precision of
methods for estimating permeability of tight cores using
mercury injection tests. Further analysis of core images
under high resolution in both lateral and vertical coordi-
nates, could also improve our understanding of flow
behaviour in tight formations.
Acknowledgments The authors acknowledge the members of the
Oil and Gas Research Institute at King Abdul Aziz Center for Science
and Technology (KACST), Riyadh Saudi Arabia, for their supports in
carrying out this research. We are also grateful to the members of
staff and Al-Amoudi chair at the Petroleum and Natural Gas Engi-
neering Department, King Saud University for providing us with the
sandstone core samples used in this work.
Open Access This article is distributed under the terms of the
Creative Commons Attribution License which permits any use, dis-
tribution, and reproduction in any medium, provided the original
author(s) and the source are credited.
References
Akanji LT, Matthai SK (2010) Finite element-based characterization
of pore-scale geometry and its impact on fluid flow. Transp
Porous Media 81:241–259
Al-Sayari S (2009) The influence of wettability and carbon dioxide
injection on hydrocarbon recovery. PhD thesis, Department of
Earth Science and Engineering, Imperial College London
Amyx JW, Bass DM, Whiting RL (1960) Petroleum reservoir
engineering. McGraw-Hill Book Co., New York
Archie GE (1950) Introduction to petrophysics of reservoir rocks.
AAPG Bull 34:943–961
Bahrami H, Rezaee R, Ostojic J, Nazhat D, Clennell B (2011)
Evaluation of damage mechanisms and skin factor in tight
reservoirs. In: SPE, 142284, pp 1–13
Bear J (1988) Dynamics of fluids in porous media. Dover INC, New
York
Bliefnick DM, Kaldi JG (1996) Pore geometry; control on reservoir
properties, walker creek field, columbia and lafayette counties,
arkansas. Am Assoc Petroleum Geol Bull 80:1027–1044
Brooks RH, Corey AT (1981) A simple correlation between
permeability and mercury capillary pressures. J Petroleum
Technol 3:2488–2504
Comisky JT, Newsham KE, Rushing JA, Blasingame TA (2007) A
comparative study of capillary-pressure-based empirical models
for estimating absolute permeability in tight gas sands. In: SPE,
110050, p 18
Dastidar R, Sondergeld CH, Rai CS (2007) An improved empirical
permeability estimator from mercury injection for tight clastic
rocks. Petrophysics 48(3):186–187
Dsouza J, More HN (2008) Mercury intrusion porosimetry: a tool for
pharmaceutical particle characterization. Pharm Inf 6(2):1–10.
Available at: http://www.pharmainfo.net/reviews/mercury-
intrusion-porosimetry-tool-pharmaceutical-particle-characterizat
ion. Accessed 23 July 2012
Dukhayyil RKA, Tawil AAA (2006) Reservoir architecture of the
triassic khartam carbonate sequence, khuff outcrop analogue in
al-qassim, central saudi arabia. In: GEO Middle East Conference
and Exhibition, p 1
Dullien F (1979) Porous media: Transport and microstructure, 2nd
edn. Academic Press, New York
Garcia X, Akanji LT, Blunt MJ, Matthai SK, Latham JP (2009)
Numerical study of the effects of particle shape and polydisper-
sity on the single-phase permeability. Phys Rev E 80:1539–3755
Huet CC, Rushing JA, Newsham KE, Blasingame TA (2005) A
modified purcell/burdine model for estimating absolute perme-
ability from mercury injection capillary pressure data. In:
International Technology Conference, Doha, no. 10994 in
2118, p 21
Katz AJ, Thompson AH (1981) Quantitative prediction of perme-
ability in porous rock. Phys Rev B 34(11):8179–8181
Katz AJ, Thompson AH (1987) Prediction of rock electrical
conductivity from mercury injection measurements. J Geophys
Res 92(B1):599–607
Khan AA, Rehman SA, Akram AH, Ahmad A (2011) Factors
affecting production behaviour in tight gas reservoirs. In: SPE,
no. 149045 in 2118, p 21
Klinkenberg LJ (1941) The permeability of porous media to liquids and
gases. In: API Drilling and Production Practice paper presented at
the API 11th Mid-Year Meeting, Tulsa, OK, pp 200–213
Leij FJ, Ghezzehei TA, Or D (2002) Modeling the dynamics of the
soil pore-size distribution. Soil & Tillage Reseach 64:61–78
Melas FF, Friedman GM (1992) Petrophysical characteristics of the
jurassic smackover formation, jay field. Am Assoc Petroleum
Geol Bull 76:81–100
Melrose JC, Dixon JR, Mallinson JE (1994) Comparison of different
techniques for obtaining capillary pressure data in the low-
saturation region. In: Annual Technical Conference and Exhi-
bition, Dallas, Texas, SPE, pp 185–192
Monicard RP (1980) Properties of Reservoir Rocks: Core Analysis.
Gulf Publishing Company, Houston
240 J Petrol Explor Prod Technol (2013) 3:233–241
123

Owolabi OO, Watson RW (1993) The influence of porosity,
permeability, tortuosity, wettability and mercury porosimetry
properties on limestone waterflood residual oil saturation. In:
SCA Conference, SCA, 9309, p 16
Pape H, Clauser C, Iffland J (1998) Permeability prediction for
reservoir sandstones and basement rocks based on fractal pore
space geometry. In: SEG, pp 1447–1460
Pittman ED (1992) Relationship of porosity and permeability to
various parameters derived from mercury injection- capillary
pressure curves for sandstone. AAPG Bull 76(2):191–198
Poston M, Dudu L, Thornton T, Bouza P, Thiele G, Brown R (2011)
Effects of particle shape on measured particle size. In: Microm-
eritics, micromeritics, p 1
Purcell WR (1949) Capillary pressures-their measurement using
mercury and the calculation of permeability. Trans AIME
186:39–48
Sharief FA, Magara K, Abdulla HM (1989) Depositional system and
reservoir potential of the middle cretaceous wasia formation in
central-eastern arabia. Marine Petroleum Geol 6:303–315
Soxhlet F (1879) Die gewichtsanalytische bestimmung des milchf-
ettes. Polytechnisches J (Dingler’s) 232:461–465
Swanson BF (1966) Properties of porous media affecting fluid flow.
J Irrigation Drainage Eng 92:61–88
Thompson AH, Katz AJ, Raschke RA (1987) Prediction of rock
electrical estimation of absolute permeability from capillary
pressure measurements. In: Annual technical conference and
exhibition, 16794, pp 599–607
Vavra CL, Kaldi JG, Sneider RM (1992) Geological applications of
capillary pressure: A review. Am Assoc Petroleum Geol Bull
76:840–850
Walls JD, Amaefule JO (1985) Capillary pressure and permeability
relationships in tight gas sands. In: SPE Low Permeability Gas
Reservoir Denver, CO, 13879, pp 186–187
Washburn EW (1921) The dynamics of capillary flow. Phys Rev
17(3):273
Webb PA (2001) An introduction to the physical characterization of
materials by mercury intrusion porosimetry with emphasis on
reduction and presentation of experimental data. MicroMeritics
Instrument Corp, Norcross, Georgia. Available at: http://www.
particletesting.com/docs/intro_mip.pdf. Accessed 12 Mar 2013
Zinszner B, Pellerin FM (2007) A Geoscientist’s Guide to Petro-
physics. IFP Publications, Paris
J Petrol Explor Prod Technol (2013) 3:233–241 241
123