Core Oil Delaware Basin Pure- · PDF fileCore Oil Delaware Basin Pure-Play ... Core Delaware...
12
Core Oil Delaware Basin Pure-Play J.P. Morgan Energy Equity Conference June 26, 2017
Transcript of Core Oil Delaware Basin Pure- · PDF fileCore Oil Delaware Basin Pure-Play ... Core Delaware...

Core Oil
Delaware Basin Pure-Play
J.P. Morgan Energy
Equity Conference
June 26, 2017

Important Information
2
Forward-Looking Statements
The information in this presentation includes “forward-looking statements” within the meaning of Section 27A of the Securities Act of 1933,
as amended, and Section 21E of the Securities Exchange Act of 1934, as amended. All statements, other than statements of historical fact
included in this presentation, regarding our strategy, future operations, financial position, estimated revenues and losses, projected costs,
prospects, plans and objectives of management are forward-looking statements. When used in this presentation, the words “could,”
“believe,” “anticipate,” “intend,” “estimate,” “expect,” “project” and similar expressions are intended to identify forward-looking statements,
although not all forward-looking statements contain such identifying words. These forward-looking statements are based on management’s
current expectations and assumptions about future events and are based on currently available information as to the outcome and timing of
future events. We caution you that these forward-looking statements are subject to all of the risks and uncertainties, most of which are
difficult to predict and many of which are beyond our control, incident to the development, production, gathering and sale of oil and natural
gas. These risks include, but are not limited to, commodity price volatility, inflation, lack of availability of drilling and production equipment
and services, environmental risks, drilling and other operating risks, regulatory changes, the uncertainty inherent in estimating reserves and
in projecting future rates of production, cash flow and access to capital, the timing of development expenditures and the other risks
described in our filings with the Securities and Exchange Commission. Except as otherwise required by applicable law, we disclaim any
duty to update any forward-looking statements, all of which are expressly qualified by the statements in this section, to reflect events or
circumstances after the date of this presentation.

3
Centennial Resource Development OverviewCore Delaware Basin Pure-Play
Su
mm
ary
op
era
tio
na
l s
tati
sti
cs
▪ Large, contiguous acreage positions in oil-window of Delaware Basin
▪ Low-risk, oil-rich base with rapid growth potential
▪ Increased first quarter 2017 average daily oil production volumes by
64% compared to the period from October 11, 2016 through
December 31, 2016
▪ Best-in-class balance sheet provides significant financial flexibility
– No debt outstanding and $55MM in cash at Q1’17Co
mp
an
y h
igh
lig
hts
(1) As of 12/31/2016 plus incremental GMT acquisition acreage / inventory
(2) Midpoint of updated 2017 FYE guidance
(3) Represents gross horizontal drilling locations; for legacy Centennial assumes credit for the Upper and Lower Wolfcamp A, Wolfcamp B, Wolfcamp C and 3rd Bone Spring Sand; assumes no locations in Pecos County; for GMT assumes
credit for the Avalon Shale, 2nd Bone Spring Sand, 3rd Bone Spring Sand and Wolfcamp A
(4) Does not include any proved reserve impact from GMT acquisition
Northern Delaware
▪ Net acres: 11,860
▪ Inventory3: 255 locations
▪ 2017 drilling plan: 1 rig
Southern Delaware
▪ Net acres: 76,067
▪ Inventory3: 1,951 locations
▪ 2017 drilling plan: ~5.5 rigs
Operational overview
Production
Q1 2017
Actual
2017 FYE
Guidance2
Total production (Boe/d) 18,469 25,750
Oil production (Bo/d) 10,489 15,750
% oil 57% 61%
Acreage1
Total net acreage ~88,000
% Operated 84%
Drilling inventory1,3
Gross horizontal drilling locations 2,206
Gross operated horizontal drilling locations 1,394
Proved reserves
Total proved reserves at 12/31/16 (MBoe)4 82,959
% oil 56%

4
Differentiated Delaware Basin Pure-Play
Asset quality
Technical expertise
Financial flexibility
Inventory depth and production growth
Management team with track-record of execution

Big
Fundamental
4-52 1H
Collins 2HBalmorhea
State 2H
Q1 2017
average
Lateral length (ft.) 4,600 6,315 5,750 6,250
Targeted zone WC UA WC UA WC UA –
IP30 (Bo/d) 1,135 976 1,079 959
IP30 (Boe/d) 1,700 1,183 1,311 1,363
% oil 67% 83% 82% 70%
IP30 / 1,000' (Bo/d) 247 155 188 153
IP30 / 1,000' (Boe/d) 370 187 228 218
5
Delivering production growth
5.2 5.4 6.1 6.4
10.5
7.27.8
8.99.7
18.5
Q1 2016 Q2 2016 Q3 2016 Q4 2016 Q1 2017
Oil Gas NGL
Big Fundamental 4-52 1H
Collins 2H
Balmorhea State 2H
Q1 2017 highlights
Production history (MBoe/d)
▪ Q1 2017 oil production of 10,489 Bo/d and total production of 18,469 Boe/d
▪ On-track for FY 2017 guidance of 15,750 Bo/d and 25,750 Boe/d1
▪ Increased first quarter 2017 average daily oil production volumes by 64% compared to
the period from October 11, 2016 through December 31, 2016
▪ Drilled 15 operated wells with ~5 rigs running for the majority of the quarter, 11 operated
wells placed on production
▪ Big Fundamental 4-52 1H: IP30 / 1,000’ of 247 Bo/d and 370 Boe/d
▪ Strong results from the Balmorhea State 2H and Collins 2H (~82% oil)
2
3
3
3
(1) Represents midpoint of updated FY 2017 production guidance pro forma for the GMT acquisition
(2) Average includes results from 11 operated wells placed on production in Q1 2017
(3) Based on two-stream production results
(4) Represents predecessor period from October 1, 2016 through October 10, 2016 and successor period from October 11, 2016 through December 31, 2016
Q1 2017 production overview
4

6
Advancements in geosteering and cluster spacing driving progress towards technical leadership
▪ Centennial recently brought the geosteering function in-
house and recent results indicate a material improvement in
the ability to land laterals in the intended drilling window
▪ Isolating where the lateral is landed limits the number of
variables in the equation, driving more efficient analysis of
results and stronger well performance
▪ Q1 2017 average of 93% in-zone represents a material
improvement relative to legacy wells
▪ Targeting a specific drilling window of ~30 feet within the
target zone, determined by technical team as optimal
landing zone
Geosteering advancements
3 Cluster / Stage
Design
15 Cluster / Stage
Design
Stage Stage Stage Stage Stage
Cluster spacing evolution and design overview
▪ Tighter cluster spacing increases near-wellbore stimulation and produces shorter frac wings, resulting in increased well performance and potential for tighter well spacing
▪ Centennial has moved from 3 clusters per stage up to 15 clusters per stage over the last 6 months
▪ Increasing clusters per stage, but decreasing total stages results in meaningful completion cost savings
3
6
10 10
1315
Oct-16 Nov-16 Dec-16 Jan-17 Feb-17 Mar-17
Clusters per stage over time
Cluster design evolution
Sample cross-section: (4,650’ lateral length)
In drilling window for 94% of the lateral
and in zone for 100% of the lateral
Centennial Q1 2017 average: 93% in zone
7
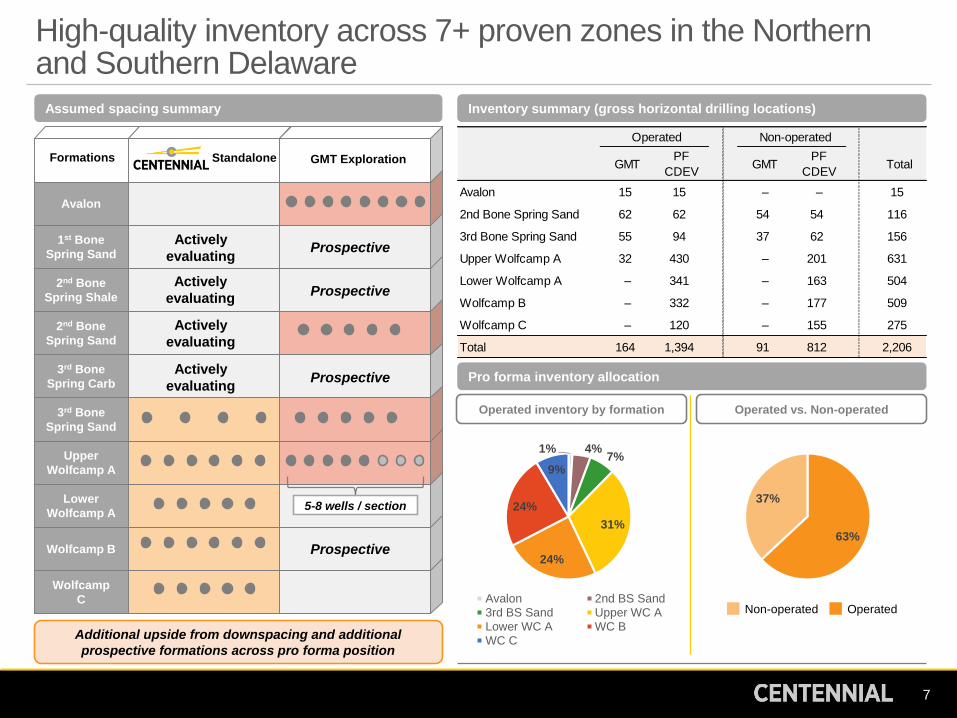
High-quality inventory across 7+ proven zones in the Northern and Southern Delaware
Wolfcamp
C
Wolfcamp B
Lower
Wolfcamp A
Upper
Wolfcamp A
3rd Bone
Spring Sand
3rd Bone
Spring Carb
2nd Bone
Spring Sand
2nd Bone
Spring Shale
1st Bone
Spring Sand
Avalon
AvalonFormations
Assumed spacing summary
Prospective
Additional upside from downspacing and additional
prospective formations across pro forma position
Standalone GMT Exploration
Prospective
Prospective
Prospective
Actively
evaluating
Inventory summary (gross horizontal drilling locations)
Operated Non-operated
GMTPF
CDEVGMT
PF
CDEVTotal
Avalon 15 15 – – 15
2nd Bone Spring Sand 62 62 54 54 116
3rd Bone Spring Sand 55 94 37 62 156
Upper Wolfcamp A 32 430 – 201 631
Lower Wolfcamp A – 341 – 163 504
Wolfcamp B – 332 – 177 509
Wolfcamp C – 120 – 155 275
Total 164 1,394 91 812 2,206
Pro forma inventory allocation
Operated inventory by formation
1% 4%7%
31%
24%
24%
9%
Avalon 2nd BS Sand3rd BS Sand Upper WC ALower WC A WC BWC C
Operated vs. Non-operated
63%
37%5-8 wells / section
Actively
evaluating
Actively
evaluating
OperatedNon-operated
Actively
evaluating
8
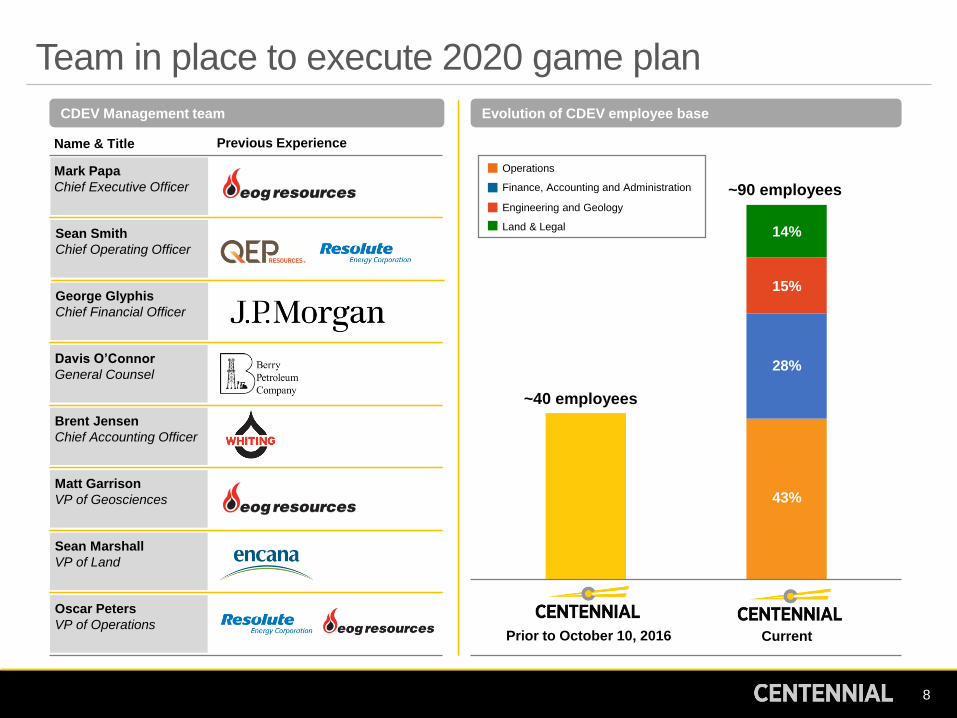
Team in place to execute 2020 game plan
Prior to October 10, 2016 Current
~40 employees
~90 employees
Operations
Finance, Accounting and Administration
Engineering and Geology
Land & Legal
43%
15%
14%
28%
Evolution of CDEV employee base
Mark Papa
Chief Executive Officer
Name & Title
Sean Smith
Chief Operating Officer
George Glyphis
Chief Financial Officer
Davis O’Connor
General Counsel
Brent Jensen
Chief Accounting Officer
Matt Garrison
VP of Geosciences
Sean Marshall
VP of Land
Oscar Peters
VP of Operations
Previous Experience
CDEV Management team

9
Strong liquidity position
$200
$250
$350
$50
$100
Fall 2016redetermination
Incremental capacity fromSilverback acquisition
YE 2016 Spring 2017redetermination
Q2 2017
Borrowing base growth ($ mm)
▪ Significant borrowing base increases driven by organic production growth and
Silverback acquisition
$50mm incremental borrowing base capacity following closing of Silverback
acquisition
Completed Spring 2017 redetermination process: $100mm increase, which raises
the total borrowing base to $350mm
No borrowings outstanding as of March 31, 2017
▪ Continued production ramp on Centennial acreage and current GMT assets / production
expected to drive further borrowing base growth by year-end 2017
25% borrowing base
increase from Silverback
acquisition
40% borrowing base increase
from Spring 2017
redetermination
Incremental capacity
anticipated from GMT
acquisition and
Fall 2017
redetermination
As of
3/31/2017
Pro forma
3/31/20172
Borrowing base $250.0 $350
Less: amount drawn - -
Borrowing base availability $250.0 $350
Plus: Cash and cash equivalents 54.9 54.9
Less: Letters of credit (0.4) (0.4)
Total liquidity $304.4 $404.4
Liquidity summary ($ mm)1
(1) Amounts may not sum due to rounding
(2) Pro forma for $100mm borrowing base increase; does not reflect any adjustments related to GMT acquisition
10
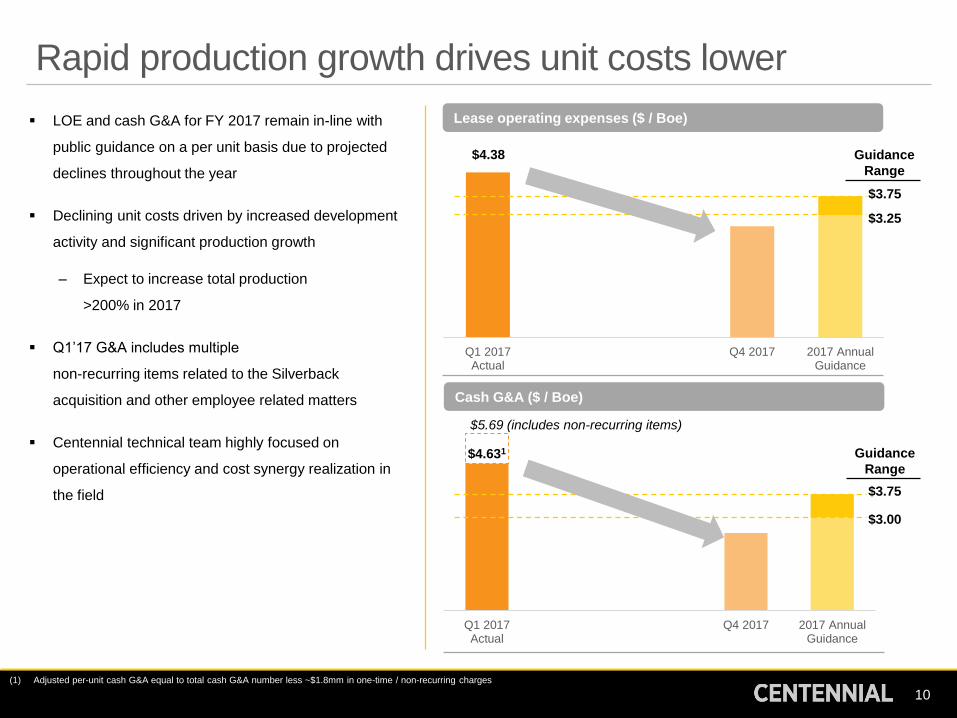
Rapid production growth drives unit costs lower
Q1 2017Actual
Q4 2017 2017 AnnualGuidance
$3.75
Lease operating expenses ($ / Boe)
$3.25
$4.38
Cash G&A ($ / Boe)
Q1 2017Actual
Q4 2017 2017 AnnualGuidance
$5.69 (includes non-recurring items)
$4.631
$3.75
$3.00
▪ LOE and cash G&A for FY 2017 remain in-line with
public guidance on a per unit basis due to projected
declines throughout the year
▪ Declining unit costs driven by increased development
activity and significant production growth
– Expect to increase total production
>200% in 2017
▪ Q1’17 G&A includes multiple
non-recurring items related to the Silverback
acquisition and other employee related matters
▪ Centennial technical team highly focused on
operational efficiency and cost synergy realization in
the field
Guidance
Range
Guidance
Range
(1) Adjusted per-unit cash G&A equal to total cash G&A number less ~$1.8mm in one-time / non-recurring charges

Initial
2017 FY Guidance
Post - GMT
2017 FY Guidance
Net Average Daily Production (Boe/d) 22,500 - 26,500 23,600 - 27,900
Oil Net Average Daily Production (Bo/d) 14,000 - 15,700 14,850 - 16,650
Production Costs (per Boe)
Lease Operating ($3.25) - ($3.75) ($3.25) - ($3.75)
Transportation, Processing, Gathering ($3.10) - ($3.60) ($3.10) - ($3.60)
and Other
Depreciation, Depletion, Amortization and ($18.00) - ($20.00) ($18.00) - ($20.00)
Accretion of Asset Retirement Obligations
Cash General and Administrative ($3.00) - ($3.75) ($3.00) - ($3.75)
Severance and Ad Valorem Taxes (% of revenue) 6% - 8% 6% - 8%
Capital Expenditure Program ($MM) $500 - $585 $535 - $625
D&C Capital Expenditure $440 - $500 $475 - $540
Land $50 - $70 $50 - $70
Facilities, Seismic and Other $10 - $15 $10 - $15
Operated Drilling Program
Wells Spud (Gross) 60 - 70 65 - 75
Wells Completed (Gross) 60 - 70 65 - 75
11
2017 Guidance Summary
Updated FY 2017 guidance
▪ CDEV is currently running 6 rigs
▪ 1 additional rig will be added on the
acquired GMT acreage in Q3 2017
▪ Production guidance updated to reflect
incremental oil-weighted production from
GMT acquisition
Mid-point of average daily production
guidance increased by 5%,
representing over 200% growth from
2016 production
Mid-point of average daily oil
production guidance increased by 6%,
representing ~175% growth from 2016
production
▪ Operated drilling program increased from
60-70 wells spud and completed, to 65-75
wells spud and completed
▪ Drilling & completion capital increased by
~$38mm at the mid-point driven by GMT
development
Guidance summary

Objective: Best equity performance of any U.S. Mid-Cap E&P through 2020
12
Centennial 2020 Game PlanDelivering investor returns through operational outperformance
2017
2018
2020
▪ Grow net oil production from 5,757 Bo/d in 2016 to 60,000 by 2020
▪ Become mid-cap technical leader in G&G and well completion technology
▪ Achieve above average competence in drilling technology
▪ Evaluate Bone Spring Shale prospectivity across Reeves County acreage
▪ Maintain one of the lowest net debt positions of all U.S. E&P companies
▪ Maintain clear, easy to understand financials
▪ Target up to $50-$70 million per year spend for acreage acquisitions
▪ Achieve lowest unit costs among peers – LOE and G&A
▪ Achieve 60,000 Bo/d average annual oil production