Core Network Planning Cell, 614, Bharat Sanchar Bhavan ... · PDF filePresentation to...
37
Page 1 of 37 [email protected] No: 66-07/CNP / MNGT / 09 /51 Dt: 21/12/2009 Sub : Presentation by CNP Cell to Management Committee of BSNL board on Analysis of NIB-II MPLS network along with Recommendation for MNGT 1. A presentation was given by Core Network Planning (CNP) cell indicating the broad points observed while carrying out the analysis of the NIB-II MPLS with respect to traffic generating trends of different access networks such as broadband, IP TAX, Wi- Max, GSM, Enterprise etc which are riding on NIB-II MPLS network. 2. The analysis has provided critical insight into the traffic generating capacity of these access networks. The presentation also included the connectivity requirement of different access networks for the next three years along with broad recommendation related to planning of the different access network. 3. The analysis also indicated about the multiplicity of IP / MPLS network being deployed with project planned by each business vertical. To optimize CAPEX and OPEX, Optimization and sharing have to be an integral part of planning. 4. All the recommendations, as spelt out in the presentation, were approved by the Management Committee of BSNL Board in its 34 th Meeting held on 9 th December 2009. 5. The copy of the presentation is enclosed herewith for information of all field units. Encl: As above (71 slides) (SANJEEV VERMA) Dy, General Manager (Core Network Planning – IV) Copy To: [1] All CGM (Telecom Circles / Metro Districs / Projects / Regions / BBNW / QA / Inspection Circle / Training Centres) for information please – (Through Intranet) [2] PGMs /GMs of BSNL Corporate Office – (Through Intranet) Core Network Planning Cell, 614, Bharat Sanchar Bhavan, Janpath New Delhi: 110001 [email protected]
Transcript of Core Network Planning Cell, 614, Bharat Sanchar Bhavan ... · PDF filePresentation to...

Page 1 of 37
No: 66-07/CNP / MNGT / 09 /51 Dt: 21/12/2009
Sub: Presentation by CNP Cell to Management Committee of BSNL board on Analysis of
NIB-II MPLS network along with Recommendation for MNGT
1. A presentation was given by Core Network Planning (CNP) cell indicating the broad
points observed while carrying out the analysis of the NIB-II MPLS with respect to
traffic generating trends of different access networks such as broadband, IP TAX, Wi-
Max, GSM, Enterprise etc which are riding on NIB-II MPLS network.
2. The analysis has provided critical insight into the traffic generating capacity of these
access networks. The presentation also included the connectivity requirement of
different access networks for the next three years along with broad recommendation
related to planning of the different access network.
3. The analysis also indicated about the multiplicity of IP / MPLS network being
deployed with project planned by each business vertical. To optimize CAPEX and
OPEX, Optimization and sharing have to be an integral part of planning.
4. All the recommendations, as spelt out in the presentation, were approved by the
Management Committee of BSNL Board in its 34th
Meeting held on 9th
December
2009.
5. The copy of the presentation is enclosed herewith for information of all field units.
Encl: As above (71 slides)
(SANJEEV VERMA) Dy, General Manager (Core Network Planning – IV)
Copy To:
[1] All CGM (Telecom Circles / Metro Districs / Projects / Regions / BBNW / QA /
Inspection Circle / Training Centres) for information please – (Through Intranet)
[2] PGMs /GMs of BSNL Corporate Office – (Through Intranet)
Core Network Planning Cell,
614, Bharat Sanchar Bhavan, Janpath
New Delhi: 110001

Presentation to Management Committee Analysis of NIB-II MPLS Network
Core Network Planning Page 2 of 37
Annexure – I
Analysis of Analysis of Analysis of Analysis of
NIB NIB NIB NIB –––– II MPLS Network II MPLS Network II MPLS Network II MPLS Network
24 November 2009 Core Network Planning 1
Approach FollowedApproach FollowedApproach FollowedApproach Followed• Identify who are the users?
• What are their Requirements?
Bottom – Up Approach
• Internal:
• Different Access Networks such as broadband, GSM, Wi-Max, IP TAX, Class V NGN, FTTX (GPON / GEPON),SSTP
• External:
• Enterprise users: For provisioning of VPN circuits, Internet Leased Line
Target Users
• For Internal user: Discussion done with respective GM Network planning.
• For External user: Discussion done with GM (Business Strategy) – E at Corporate Office / Field.
One-to-One Discussion
• The current expansion is not a green field deployment
• A realistic picture on traffic as on day is available for different type of traffic
• A balanced approach (mix of realistic and visionary) is followed.
Optimize CAPEX and
OPEX
24 November 2009 Core Network Planning 2
Presentation to Management Committee Analysis of NIB-II MPLS Network
Core Network Planning Page 3 of 37
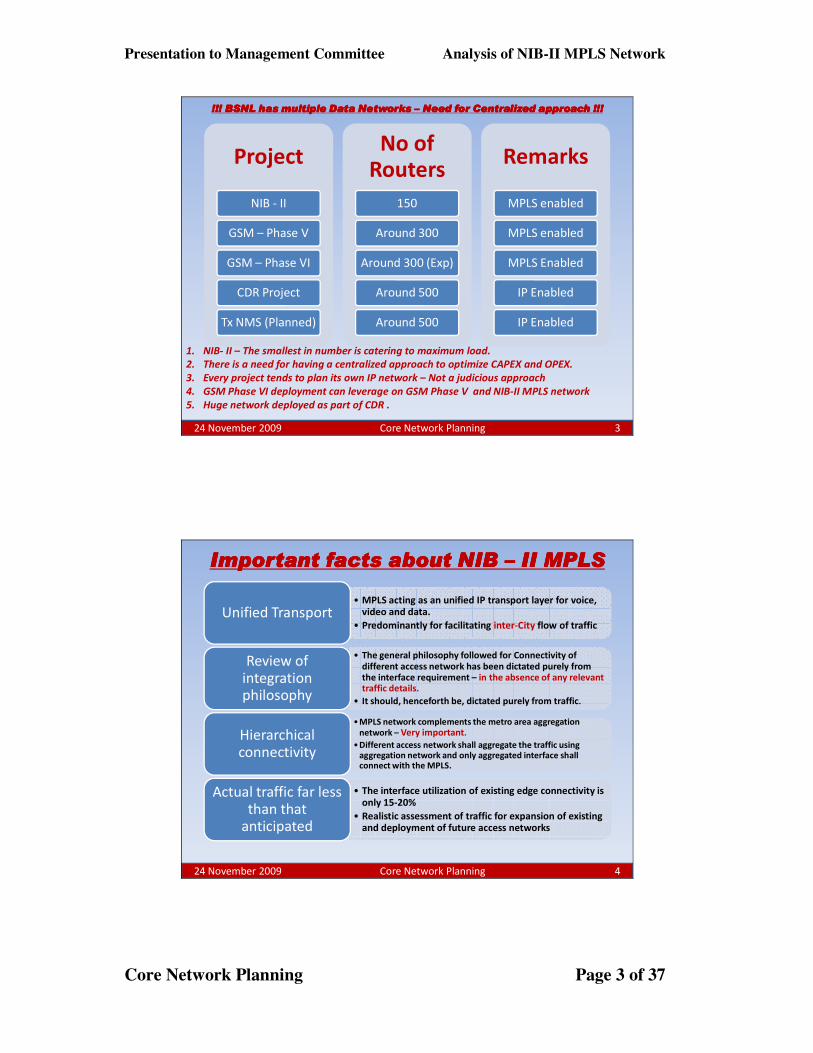
Project
NIB - II
GSM – Phase V
GSM – Phase VI
CDR Project
Tx NMS (Planned)
No of Routers
150
Around 300
Around 300 (Exp)
Around 500
Around 500
Remarks
MPLS enabled
MPLS enabled
MPLS Enabled
IP Enabled
IP Enabled
1. NIB- II – The smallest in number is catering to maximum load.
2. There is a need for having a centralized approach to optimize CAPEX and OPEX.
3. Every project tends to plan its own IP network – Not a judicious approach
4. GSM Phase VI deployment can leverage on GSM Phase V and NIB-II MPLS network
5. Huge network deployed as part of CDR .
!!! BSNL has multiple Data Networks !!! BSNL has multiple Data Networks !!! BSNL has multiple Data Networks !!! BSNL has multiple Data Networks –––– Need for Centralized approach !!!Need for Centralized approach !!!Need for Centralized approach !!!Need for Centralized approach !!!
24 November 2009 Core Network Planning 3
Important facts about NIB Important facts about NIB Important facts about NIB Important facts about NIB –––– II MPLSII MPLSII MPLSII MPLS
• MPLS acting as an unified IP transport layer for voice, video and data.
• Predominantly for facilitating inter-City flow of trafficUnified Transport
• The general philosophy followed for Connectivity of different access network has been dictated purely from the interface requirement – in the absence of any relevant traffic details.
• It should, henceforth be, dictated purely from traffic.
Review of
integration
philosophy
•MPLS network complements the metro area aggregation
network – Very important.
•Different access network shall aggregate the traffic using aggregation network and only aggregated interface shall connect with the MPLS.
Hierarchical
connectivity
• The interface utilization of existing edge connectivity is only 15-20%
• Realistic assessment of traffic for expansion of existing and deployment of future access networks
Actual traffic far less
than that
anticipated
24 November 2009 Core Network Planning 4

Presentation to Management Committee Analysis of NIB-II MPLS Network
Core Network Planning Page 4 of 37
AgendaAgendaAgendaAgenda• Review of Integration Philosophy
• Hierarchical Connectivity
• Internal Users: Analysis of Traffic from Different Access Network
– Broadband (DSL) + Class V NGN + FTTx
– IP TAX
– Wi-MAX
– GSM
– Other Access Networks
• External Users: Enterprise User
• Summary of Expansion
• Future Line of Action (Through MNGT)
24 November 2009 Core Network Planning 5
Review of Integration Review of Integration Review of Integration Review of Integration
Philosophy of MPLS NetworkPhilosophy of MPLS NetworkPhilosophy of MPLS NetworkPhilosophy of MPLS Network
24 November 2009 Core Network Planning 6

Presentation to Management Committee Analysis of NIB-II MPLS Network
Core Network Planning Page 5 of 37
Broad Components of MPLS NetworkBroad Components of MPLS NetworkBroad Components of MPLS NetworkBroad Components of MPLS Network
• Akin to Local ExchangeAkin to Local ExchangeAkin to Local ExchangeAkin to Local Exchange
• Subscriber termination point
• Different Access network such as broadband, GSM, wi-Max etc gets terminated here.
• Connectivity on Gigabit Ethernet (GE) interface – based on the traffic generating capacity of different network
PE
Router
• Akin to Level 1 TAXAkin to Level 1 TAXAkin to Level 1 TAXAkin to Level 1 TAX
• Carries out transit function.
• High Speed transfer of packet from one city to Other City
• National Highway
P
Router
24 November 2009 Core Network Planning 7
Let’s reLet’s reLet’s reLet’s re----fresh L2 TAX Connectivityfresh L2 TAX Connectivityfresh L2 TAX Connectivityfresh L2 TAX Connectivity
• Why the Small X-ges are
first aggregated at Tandem
and not connected directly
to Level – II TAX?
– This ensures optimal
utilization of aggregated
interface.
– Individual X-ge are not
capable of generating traffic
equivalent to one E1
(minimum connectivity)
– Tandem acts as an
aggregation Layer. Tandem
Complements TAX in
ensuring optimal
connectivity
Level II TAXTandem
E-10 B OCB
RLU RLU RSURSU RSURLU
X-A X-B X-C
X-D
X-E X-F X-G
This is an aggregated
interface
If Small X-ges are connected
directly to TAX, the TAX
Capacity requirement increases
Along with dramatic fall in
Its utilization
24 November 2009 Core Network Planning 8

Presentation to Management Committee Analysis of NIB-II MPLS Network
Core Network Planning Page 6 of 37
MPLS Edge Connectivity is Similar to L2 TAX ConnectivityMPLS Edge Connectivity is Similar to L2 TAX ConnectivityMPLS Edge Connectivity is Similar to L2 TAX ConnectivityMPLS Edge Connectivity is Similar to L2 TAX Connectivity
MPLS PE
MGW – IP
TAX
DSLAM LMG BTS - WiMAX
This is an aggregated
interface
Metro
Aggregation
Network
FTTX
Multiplay
Project
Class V
NGN
Wi-MAX
(Rural and
Urban)
GPON / GEPON
Project
RPR / Ethernet based aggregation
Network deployed in Multiplay
Level II TAXTandem
E-10 B OCB
RLU RLU RSURSU RSURLU
X-A X-B X-C
X-D
X-E X-F X-G
This is an aggregated
interface
24 November 2009 Core Network Planning 9
MPLS Edge Connectivity is Similar to L2 TAX ConnectivityMPLS Edge Connectivity is Similar to L2 TAX ConnectivityMPLS Edge Connectivity is Similar to L2 TAX ConnectivityMPLS Edge Connectivity is Similar to L2 TAX Connectivity
What done for Level 2 TAX?
• Minimum Connectivity is
E1.
• Small X-ges, which are not
capable of generating
traffic equivalent to one E1
are aggregated using
Tandem.
• This ensures optimal
utilization of E1 interface
• Tandem Complements TAX
in ensuring optimal
connectivity
What shall be done for Edge Connectivity?
• Minimum Connectivity is Gigabit Ethernet (GE)
• Small access network, which are not capable of generating traffic equivalent to one GE are aggregated using Metro Area Aggregation Network.
• This ensures optimal utilization of GE interface – it is costly
• Metro Area aggregation network complements MPLS network in ensuring optimal connectivity
24 November 2009 Core Network Planning 10
Presentation to Management Committee Analysis of NIB-II MPLS Network
Core Network Planning Page 7 of 37
Hierarchical Hierarchical Hierarchical Hierarchical
ConnectivityConnectivityConnectivityConnectivity
24 November 2009 Core Network Planning 11
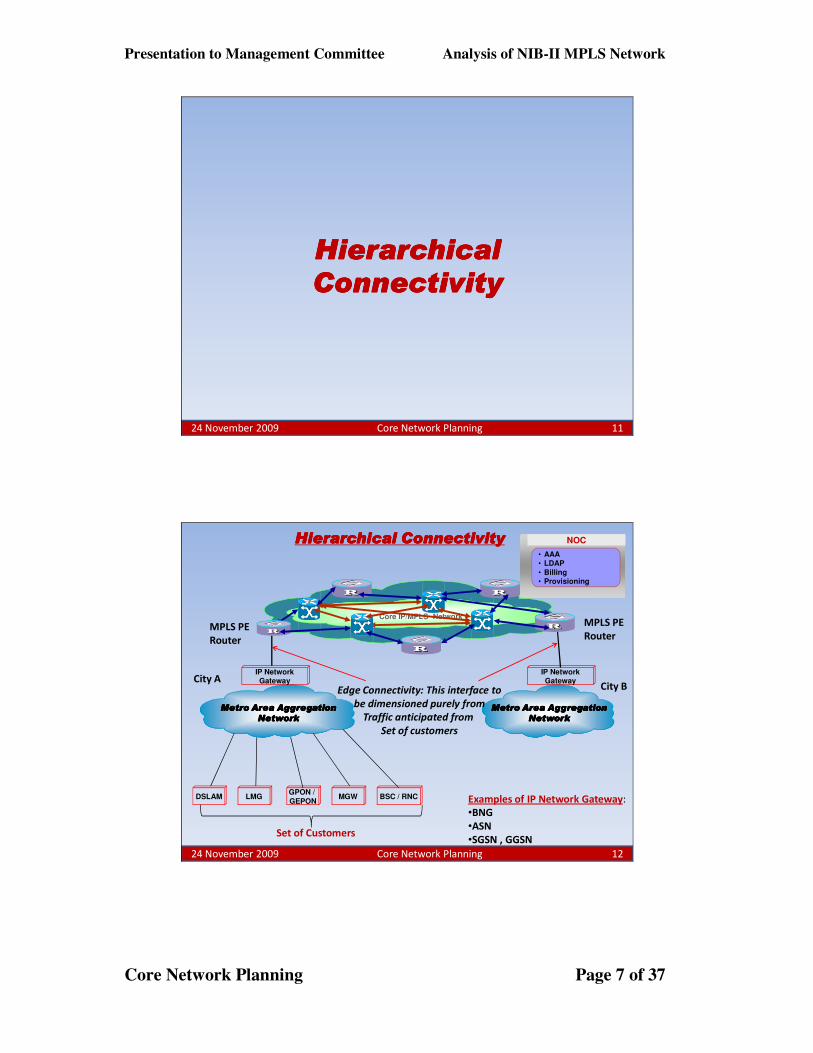
Core IP/MPLS Network
Hierarchical ConnectivityHierarchical ConnectivityHierarchical ConnectivityHierarchical Connectivity
IP NetworkGateway
IP NetworkGatewayCity A
City B
Metro Area AggregationMetro Area AggregationMetro Area AggregationMetro Area Aggregation
NetworkNetworkNetworkNetwork
Metro Area AggregationMetro Area AggregationMetro Area AggregationMetro Area Aggregation
NetworkNetworkNetworkNetwork
MPLS PE
Router
MPLS PE
Router
DSLAM LMGGPON /
GEPONMGW BSC / RNC
Edge Connectivity: This interface to
be dimensioned purely from
Traffic anticipated from
Set of customers
Set of Customers
NOC
• AAA• LDAP
• Billing• Provisioning
Examples of IP Network Gateway:
•BNG
•ASN
•SGSN , GGSN
24 November 2009 Core Network Planning 12
Presentation to Management Committee Analysis of NIB-II MPLS Network
Core Network Planning Page 8 of 37
Analysis of Traffic From Analysis of Traffic From Analysis of Traffic From Analysis of Traffic From
Different Access Different Access Different Access Different Access
NetworksNetworksNetworksNetworks
24 November 2009 Core Network Planning 13
BroadbandBroadbandBroadbandBroadband
24 November 2009 Core Network Planning 14
Presentation to Management Committee Analysis of NIB-II MPLS Network
Core Network Planning Page 9 of 37
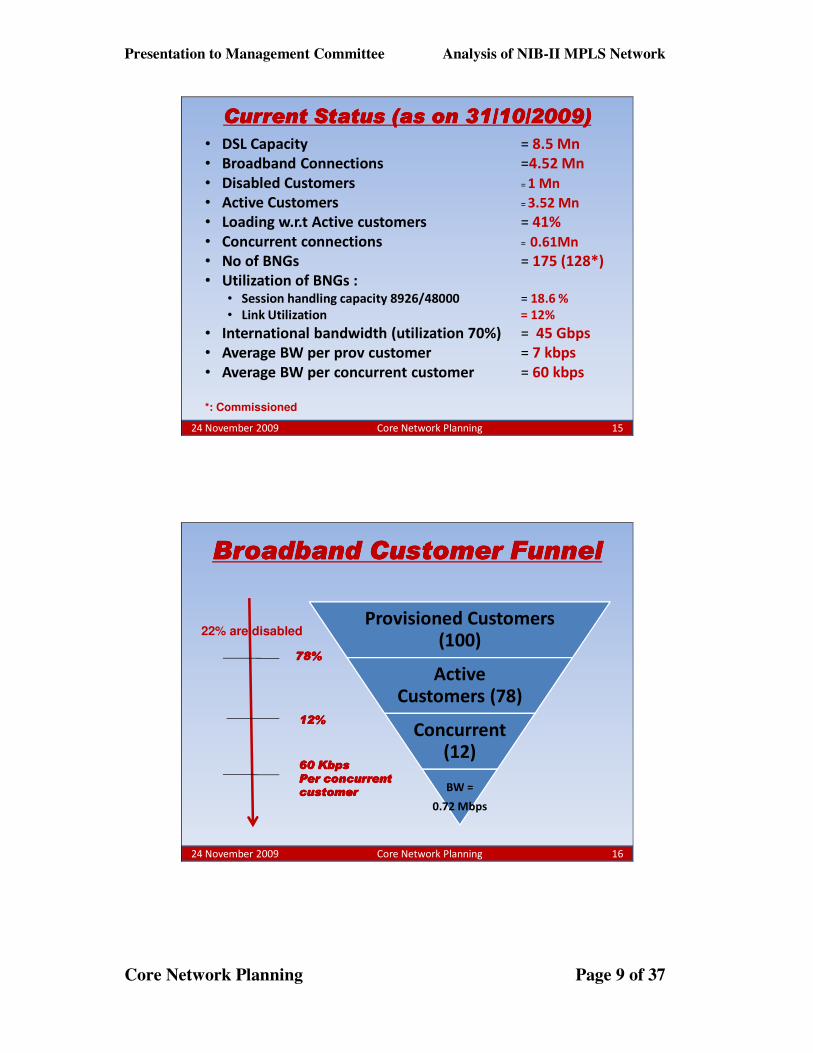
Current Status (as on 31/10/2009)Current Status (as on 31/10/2009)Current Status (as on 31/10/2009)Current Status (as on 31/10/2009)
• DSL Capacity = 8.5 Mn
• Broadband Connections =4.52 Mn
• Disabled Customers = 1 Mn
• Active Customers = 3.52 Mn
• Loading w.r.t Active customers = 41%
• Concurrent connections = 0.61Mn
• No of BNGs = 175 (128*)
• Utilization of BNGs :• Session handling capacity 8926/48000 = 18.6 %
• Link Utilization = 12%
• International bandwidth (utilization 70%) = 45 Gbps
• Average BW per prov customer = 7 kbps
• Average BW per concurrent customer = 60 kbps
*: Commissioned
24 November 2009 Core Network Planning 15
Broadband Customer FunnelBroadband Customer FunnelBroadband Customer FunnelBroadband Customer Funnel
Provisioned Customers (100)
Active Customers (78)
Concurrent (12)
BW =
0.72 Mbps
78%78%78%78%
12%12%12%12%
60 Kbps60 Kbps60 Kbps60 Kbps
Per concurrentPer concurrentPer concurrentPer concurrentcustomercustomercustomercustomer
22% are disabled
24 November 2009 Core Network Planning 16
Presentation to Management Committee Analysis of NIB-II MPLS Network
Core Network Planning Page 10 of 37
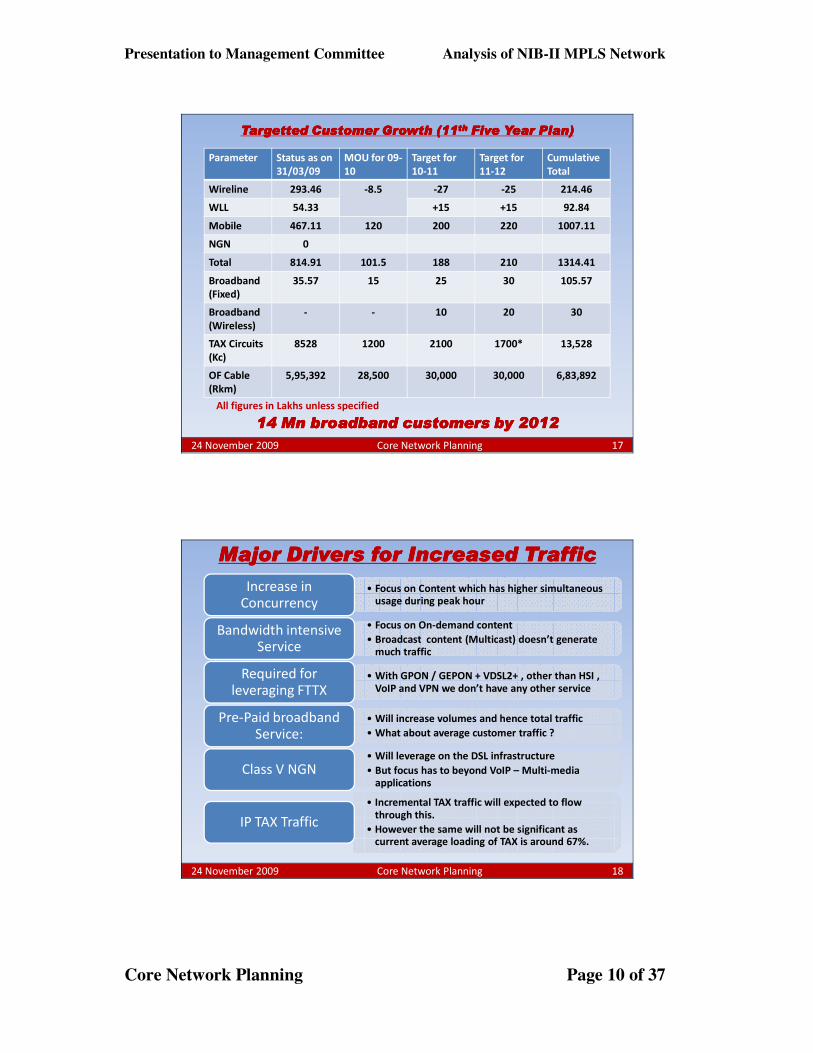
Targetted Customer Growth (11Targetted Customer Growth (11Targetted Customer Growth (11Targetted Customer Growth (11thththth Five Year Plan)Five Year Plan)Five Year Plan)Five Year Plan)
Parameter Status as on
31/03/09
MOU for 09-
10
Target for
10-11
Target for
11-12
Cumulative
Total
Wireline 293.46 -8.5 -27 -25 214.46
WLL 54.33 +15 +15 92.84
Mobile 467.11 120 200 220 1007.11
NGN 0
Total 814.91 101.5 188 210 1314.41
Broadband
(Fixed)
35.57 15 25 30 105.57
Broadband
(Wireless)
- - 10 20 30
TAX Circuits
(Kc)
8528 1200 2100 1700* 13,528
OF Cable
(Rkm)
5,95,392 28,500 30,000 30,000 6,83,892
All figures in Lakhs unless specified
14 Mn broadband customers by 201214 Mn broadband customers by 201214 Mn broadband customers by 201214 Mn broadband customers by 2012
24 November 2009 Core Network Planning 17
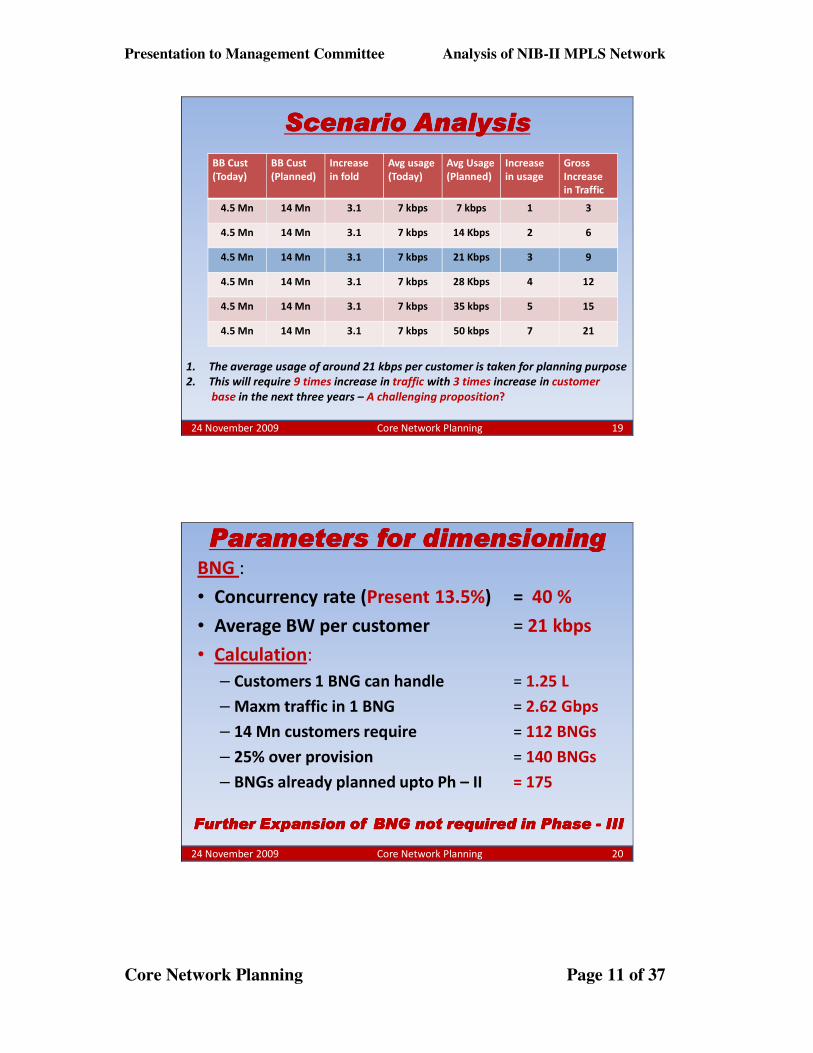
Major Drivers for Increased TrafficMajor Drivers for Increased TrafficMajor Drivers for Increased TrafficMajor Drivers for Increased Traffic
• Focus on Content which has higher simultaneous usage during peak hour
Increase in
Concurrency
• Focus on On-demand content
• Broadcast content (Multicast) doesn’t generate much traffic
Bandwidth intensive
Service
• With GPON / GEPON + VDSL2+ , other than HSI , VoIP and VPN we don’t have any other service
Required for
leveraging FTTX
• Will increase volumes and hence total traffic
• What about average customer traffic ?
Pre-Paid broadband
Service:
• Will leverage on the DSL infrastructure
• But focus has to beyond VoIP – Multi-media applications
Class V NGN
• Incremental TAX traffic will expected to flow through this.
• However the same will not be significant as current average loading of TAX is around 67%.
IP TAX Traffic
24 November 2009 Core Network Planning 18
Presentation to Management Committee Analysis of NIB-II MPLS Network
Core Network Planning Page 11 of 37
Scenario AnalysisScenario AnalysisScenario AnalysisScenario Analysis
BB Cust
(Today)
BB Cust
(Planned)
Increase
in fold
Avg usage
(Today)
Avg Usage
(Planned)
Increase
in usage
Gross
Increase
in Traffic
4.5 Mn 14 Mn 3.1 7 kbps 7 kbps 1 3
4.5 Mn 14 Mn 3.1 7 kbps 14 Kbps 2 6
4.5 Mn 14 Mn 3.1 7 kbps 21 Kbps 3 9
4.5 Mn 14 Mn 3.1 7 kbps 28 Kbps 4 12
4.5 Mn 14 Mn 3.1 7 kbps 35 kbps 5 15
4.5 Mn 14 Mn 3.1 7 kbps 50 kbps 7 21
1. The average usage of around 21 kbps per customer is taken for planning purpose
2. This will require 9 times increase in traffic with 3 times increase in customer
base in the next three years – A challenging proposition?
24 November 2009 Core Network Planning 19
Parameters for dimensioningParameters for dimensioningParameters for dimensioningParameters for dimensioningBNG :
• Concurrency rate (Present 13.5%) = 40 %
• Average BW per customer = 21 kbps
• Calculation:
– Customers 1 BNG can handle = 1.25 L
– Maxm traffic in 1 BNG = 2.62 Gbps
– 14 Mn customers require = 112 BNGs
– 25% over provision = 140 BNGs
– BNGs already planned upto Ph – II = 175
Further Expansion of BNG not required in Phase Further Expansion of BNG not required in Phase Further Expansion of BNG not required in Phase Further Expansion of BNG not required in Phase ---- IIIIIIIIIIII
24 November 2009 Core Network Planning 20

Presentation to Management Committee Analysis of NIB-II MPLS Network
Core Network Planning Page 12 of 37
Broad Dimensioning CriteriaBroad Dimensioning CriteriaBroad Dimensioning CriteriaBroad Dimensioning Criteria
Parameter
Customer base
Concurrency
Avg BW per cust
Edge Connectivity
No of BNGs
Link Utilization (2GE)
Current
4.5 Mn
13.5%
7 kbps
2 GE
128
12%**
Planned
14 Mn (Mar ‘12)
40%
21 kbps
3 GE*
175
???
Note:
*: Planned initially in A type cities. Progressively for B type cities
**: This will fall further to 6-8% with the commissioning of balance 47 BNGs (as part of Phase
II)
24 November 2009 Core Network Planning 21
Executive Summary Executive Summary Executive Summary Executive Summary ---- IIII• The DSL port loading is around 41%.
• With current rate of growth (1.5 lakhs pm), the network will be loaded 90% in another 27 months (more than 2 years)
• The current BNG is sufficient to handle more than 14 Mn broadband customers
Current Loading is
Low
• Each BNG is presently connected on 2 GE interface to MPLS PE
• The average Traffic loading of this link is around 12%
• No new connectivity of BNG is required with MPLS PE Router for the next three – four yrs.
• Provision is made for additional 1 GE connectivity in top 20 cities for further increase in traffic.
Existing Edge
Connectivity
sufficient for the
next 2 - 3 yrs
• The low traffic in broadband is predominantly
due to slow off take of IP TV service.
• Focussed Strategy on IP TV including On demand
content. The services to be strengthened in the
existing 98 cities before venturing into new
cities.
• Optimizing Broadcast content to ensure seamless
experience to user.
Focussed Strategy
on IP TV Service:
24 November 2009 Core Network Planning 22

Presentation to Management Committee Analysis of NIB-II MPLS Network
Core Network Planning Page 13 of 37
Executive Summary Executive Summary Executive Summary Executive Summary ---- IIIIIIII
• Enterprise segment can leverage on that for Ethernet connectivity to customer.
RPR Aggregation
Network in top
98 cities:
• Around 3 Mn ports planned.
• The planned expansion to take care of above points.
• Alignment of the expansion as per the NGN framework approved by the Management Committee.
Phase III
Expansion
• Expansion has to be done in the IGW locations.
• Core connectivity to be augmented to nx10Gbps in the top 10-15 cities.
International
Bandwidth
• Project 3 LDAP Capacity: To be in sync with the access capacity available as part of DSL, FTTX and Wi-MAX.
• (Project 3 – CDR Project) issue to be sorted out.Other Points
24 November 2009 Core Network Planning 23
IP TAXIP TAXIP TAXIP TAX
24 November 2009 Core Network Planning 24
Presentation to Management Committee Analysis of NIB-II MPLS Network
Core Network Planning Page 14 of 37
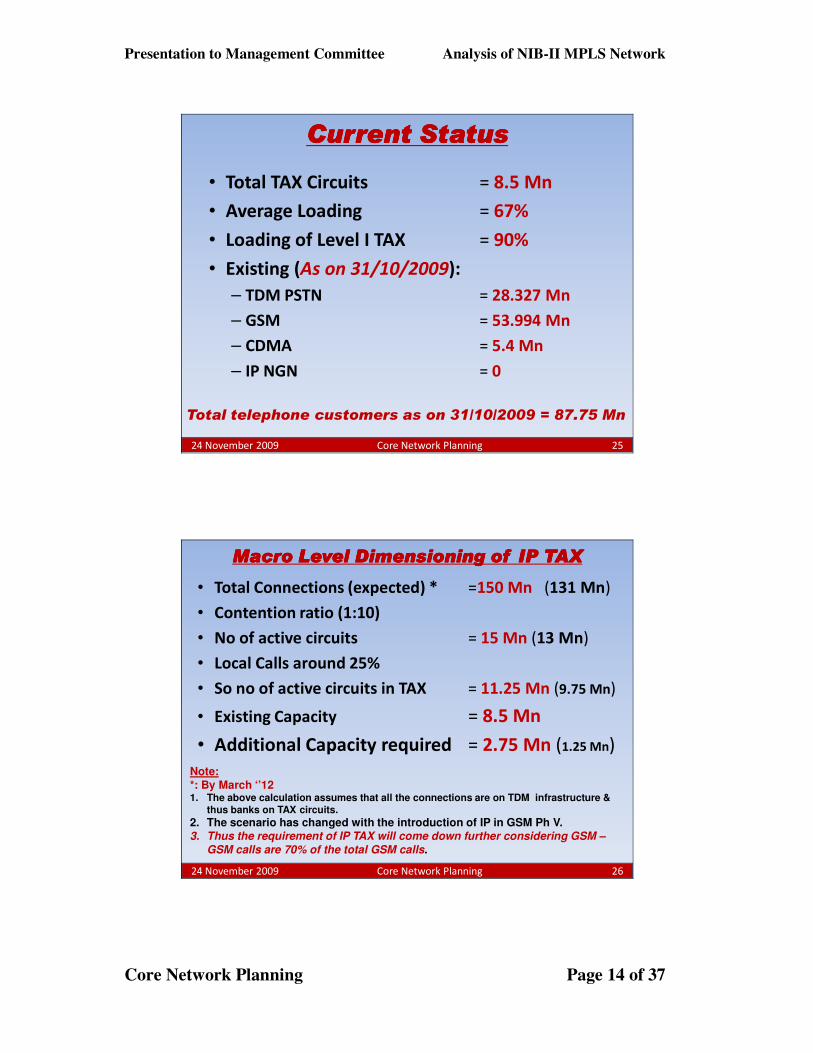
Current StatusCurrent StatusCurrent StatusCurrent Status
• Total TAX Circuits = 8.5 Mn
• Average Loading = 67%
• Loading of Level I TAX = 90%
• Existing (As on 31/10/2009):
– TDM PSTN = 28.327 Mn
– GSM = 53.994 Mn
– CDMA = 5.4 Mn
– IP NGN = 0
Total telephone customers as on 31/10/2009 = 87.75 Mn
24 November 2009 Core Network Planning 25
Macro Level Dimensioning of IP TAXMacro Level Dimensioning of IP TAXMacro Level Dimensioning of IP TAXMacro Level Dimensioning of IP TAX
• Total Connections (expected) * =150 Mn (131 Mn)
• Contention ratio (1:10)
• No of active circuits = 15 Mn (13 Mn)
• Local Calls around 25%
• So no of active circuits in TAX = 11.25 Mn (9.75 Mn)
• Existing Capacity = 8.5 Mn
• Additional Capacity required = 2.75 Mn (1.25 Mn)
Note:*: By March ‘’121. The above calculation assumes that all the connections are on TDM infrastructure &
thus banks on TAX circuits.
2. The scenario has changed with the introduction of IP in GSM Ph V.3. Thus the requirement of IP TAX will come down further considering GSM –
GSM calls are 70% of the total GSM calls.
24 November 2009 Core Network Planning 26

Presentation to Management Committee Analysis of NIB-II MPLS Network
Core Network Planning Page 15 of 37
IP TAX Deployment Plan IP TAX Deployment Plan IP TAX Deployment Plan IP TAX Deployment Plan –––– Phase IPhase IPhase IPhase I
• Total Cities = 265– Cities with 4 KC (0.5 Gbps) = 79
– Cities with 8 KC (1 Gbps) = 67
– Remaining Cities =119
Note:
– A Total of 3 Mn circuits planned to be deployed in the first phase. 2.2 Mn to M/s ZTE and 0.9 Mn to M/s ITI – M/s Huawei
– The above loading is at the maximum utilization with no compression. However, as the compression is implemented the bandwidth requirement is expected to be reduced by 40%.
24 November 2009 Core Network Planning 27
Traffic Flow and TrendsTraffic Flow and TrendsTraffic Flow and TrendsTraffic Flow and Trends
• The intra-Circle traffic shall be catered by the
existing TAX capacity – we are not replacing
but augmenting TAX network??
• Also this traffic will come down as TDM PSTN
is migrated to NGN.
• Because of GSM expansion and Landline
surrender / migration to NGN, the traffic will
further come down.
In the current scenario, the utilization of IP TAX In the current scenario, the utilization of IP TAX In the current scenario, the utilization of IP TAX In the current scenario, the utilization of IP TAX
will be significant only in top 20 citieswill be significant only in top 20 citieswill be significant only in top 20 citieswill be significant only in top 20 cities
24 November 2009 Core Network Planning 28

Presentation to Management Committee Analysis of NIB-II MPLS Network
Core Network Planning Page 16 of 37
IP TAX IP TAX IP TAX IP TAX –––– Traffic Flow ScenarioTraffic Flow ScenarioTraffic Flow ScenarioTraffic Flow Scenario
TDM TAX (L1 + LII)/
TandemIP TAX
LE LE LE LE
Other TDM
networks – GSM
(Upto Phase IV)
CDMA
Existing TDM Local Switch
Phase V GSM
and onwards
This link will carry incremental inter
Circle traffic and traffic where
One end is TDM PSTN and other
End is IP NGN, GSM (Phase V onwards)
Pure TDM to
TDM traffic
Can be carried
Through existing
TAX network except
L1, where Loading
Is 90%.
NGN
(DSL, FTTX, LMG
etc)
24 November 2009 Core Network Planning 29
Core IP/MPLS Network
MGW
MGW
IP TAX Connectivity in A Cities (L1 TAX)IP TAX Connectivity in A Cities (L1 TAX)IP TAX Connectivity in A Cities (L1 TAX)IP TAX Connectivity in A Cities (L1 TAX)
MGW
MGW
MGWMGW
MGW
GEGE
L1 TAX /
Tandem
L1 TAX /
Tandem
E1s
Soft
Switch
Soft
SwitchEthernet
Switch
24 November 2009 Core Network Planning 30
Presentation to Management Committee Analysis of NIB-II MPLS Network
Core Network Planning Page 17 of 37
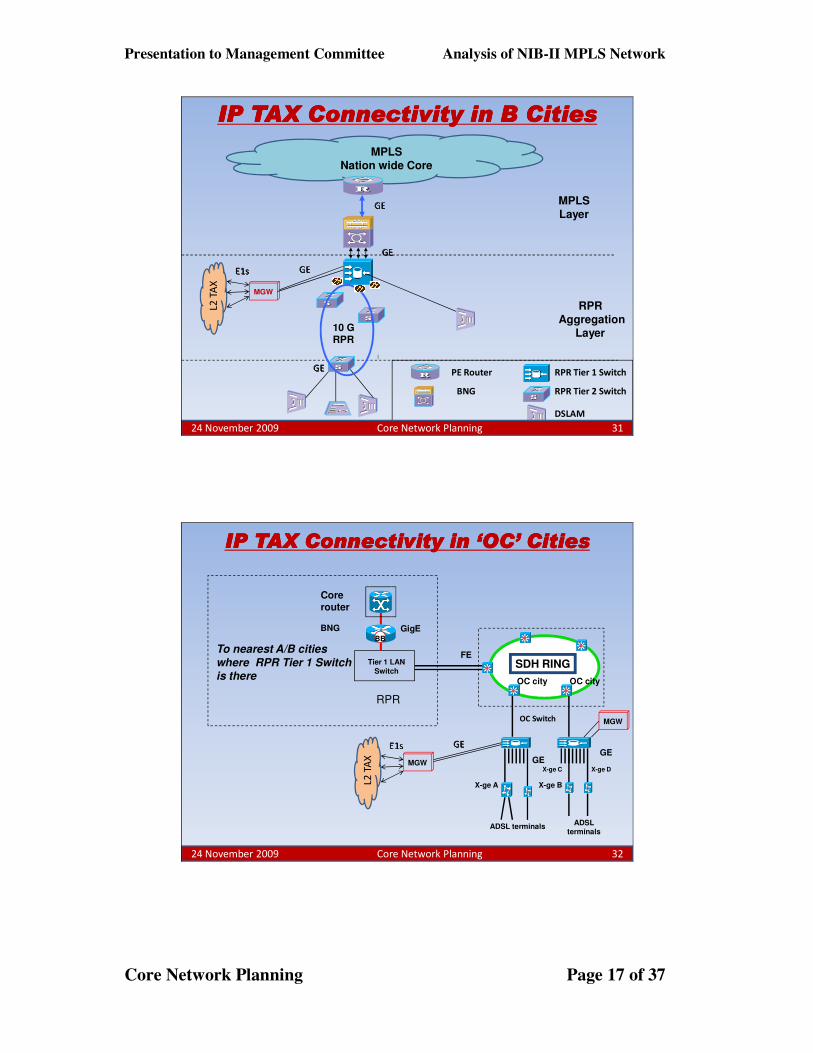
RPR Aggregation
Layer
MPLSLayer
BNG
RPR Tier 1 Switch
10 GRPR
PE RouterGE
GE
GE
MGW
MPLS Nation wide Core
IP TAX Connectivity in B CitiesIP TAX Connectivity in B CitiesIP TAX Connectivity in B CitiesIP TAX Connectivity in B Cities
RPR Tier 2 Switch
DSLAM
GE
L2 T
AX
E1s
24 November 2009 Core Network Planning 31
SDH RING
GE
OC city OC city
X-ge A
X-ge C
ADSL terminalsADSL
terminals
X-ge B
X-ge D
GE
Tier 1 LAN
Switch
BB
BNG GigE
Corerouter
FE
OC Switch
RPR
To nearest A/B cities
where RPR Tier 1 Switch is there
IP TAX Connectivity in ‘OC’ CitiesIP TAX Connectivity in ‘OC’ CitiesIP TAX Connectivity in ‘OC’ CitiesIP TAX Connectivity in ‘OC’ Cities
MGW
GE
L2 T
AX
E1s
MGW
24 November 2009 Core Network Planning 32

Presentation to Management Committee Analysis of NIB-II MPLS Network
Core Network Planning Page 18 of 37
Executive Summary of IP TAXExecutive Summary of IP TAXExecutive Summary of IP TAXExecutive Summary of IP TAX• IP TAX planning was done more than three years back (Aug ‘06).
• During this period, lot of changes have happened particularly in the landline + GSM
• In the current scenario, loading of 3 Mn is not expected on immediate basis except may be in top 15-20 cities.
Utilization in the
Current Scenario will be
low
• The direct connectivity will be done only in top 15-20 cities.
• In other cities, it will leverage on the existing broadband connectivity.
So, Connectivity will be
on shared basis
• As we migrate towards Class V NGN, loading of IP TAX will also come down.
• This will also come down as landline gets surrendered in favour of GSM.
• Can we explore the alternate usage of IP TAX infrastructure
Loading will further
come down…
•Maintenance issues can be solved through replacement of TDM TAX Circuits – What is the Policy on that?
•The Media Gateway used for GSM Phase VI expansion???
•Whole sale service to other TDM operators
How to increase loading
of IP TAX?
• The order of Phase – II may have to be re-looked into from the actual loading of 3 Mn Circuits planned in Phase I
Phase II
24 November 2009 Core Network Planning 33
WiWiWiWi----MAXMAXMAXMAX
24 November 2009 Core Network Planning 34
Presentation to Management Committee Analysis of NIB-II MPLS Network
Core Network Planning Page 19 of 37
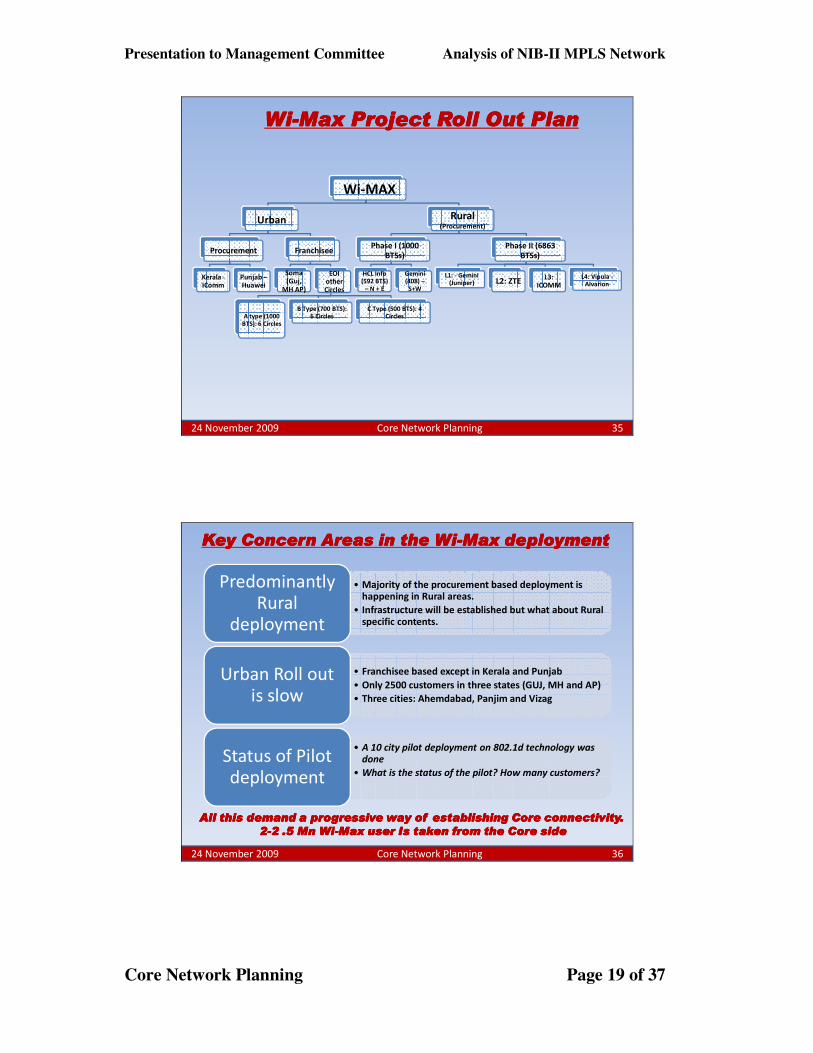
Wi-MAX
Urban
Procurement
Kerala –
ICommPunjab –Huawei
Franchisee
Soma (Guj,
MH AP)
EOI other Circles
A type (1000 BTS): 6 Circles
B Type (700 BTS): 6 Circles
C Type (500 BTS): 4 Circles
Rural (Procurement)
Phase I (1000
BTSs)
HCL Info (592 BTS)
– N + E
Gemini (408) –
S+W
Phase II (6863
BTSs)
L1: - Gemini (Juniper) L2: ZTE
L3: ICOMM
L4: Vipula -Alvarion
WiWiWiWi----Max Project Roll Out PlanMax Project Roll Out PlanMax Project Roll Out PlanMax Project Roll Out Plan
24 November 2009 Core Network Planning 35
Key Concern Areas in the WiKey Concern Areas in the WiKey Concern Areas in the WiKey Concern Areas in the Wi----Max deploymentMax deploymentMax deploymentMax deployment
• Majority of the procurement based deployment is happening in Rural areas.
• Infrastructure will be established but what about Rural specific contents.
Predominantly
Rural
deployment
• Franchisee based except in Kerala and Punjab
• Only 2500 customers in three states (GUJ, MH and AP)
• Three cities: Ahemdabad, Panjim and Vizag
Urban Roll out
is slow
• A 10 city pilot deployment on 802.1d technology was done
• What is the status of the pilot? How many customers?
Status of Pilot
deployment
All this demand a progressive way of establishing Core connectivity. All this demand a progressive way of establishing Core connectivity. All this demand a progressive way of establishing Core connectivity. All this demand a progressive way of establishing Core connectivity.
2222----2 .5 Mn Wi2 .5 Mn Wi2 .5 Mn Wi2 .5 Mn Wi----Max user Is taken from the Core sideMax user Is taken from the Core sideMax user Is taken from the Core sideMax user Is taken from the Core side
24 November 2009 Core Network Planning 36

Presentation to Management Committee Analysis of NIB-II MPLS Network
Core Network Planning Page 20 of 37
Initial Macro Level Planning of WiInitial Macro Level Planning of WiInitial Macro Level Planning of WiInitial Macro Level Planning of Wi----Max NetworkMax NetworkMax NetworkMax Network
• 1 ASN = 100 BTS.
– 1 BTS (Capacity in No of customers) = 100
• No of ASNs across the Network = 100
• BW between ASN and MPLS = 1 Gbps
• Total Pipe = 100 Gbps
• Current Avg utilization = 7 kbps
• No of Users it can take = 14 Mn
Current Status:
– User Base = 2500
– BW = 10 Mbps
The MPLS connectivity is significantly high24 November 2009 Core Network Planning 37
Executive Summary of WiExecutive Summary of WiExecutive Summary of WiExecutive Summary of Wi----MaxMaxMaxMax
• The current plan of 100 ASNs provides 100 Gbpspipe towards MPLS . This will be a huge pipe with severe under loading.
• So, we need to follow a progressive approach
Current connectivity is not in sync with
the traffic.
• Either from the traffic perspective or from inter-operability
• The current 18 ASNs can cater from the traffic perspective for around 2 Mn Wi-Max user
• Thus the current plan of 100 ASNs has to be re-looked into.
• In case, few more ASNs are required from inter-op perspective (for new OEMs not part of initial 18), the number to be worked out purely from the traffic.
• These ASNs be deployed near the international Gateway Location (Mumbai, Chennai, Bangalore, Noidaor Kolkatta) and aggregated with the existing ASNs
Why you require more ASNs?
• Instead of deploying back-end infrastructure (ASN: 100 Nos) at one go, deploy as you grow.
• The current 18 ASNs can take care of 2 Mn users.Progressive Approach
24 November 2009 Core Network Planning 38
Presentation to Management Committee Analysis of NIB-II MPLS Network
Core Network Planning Page 21 of 37
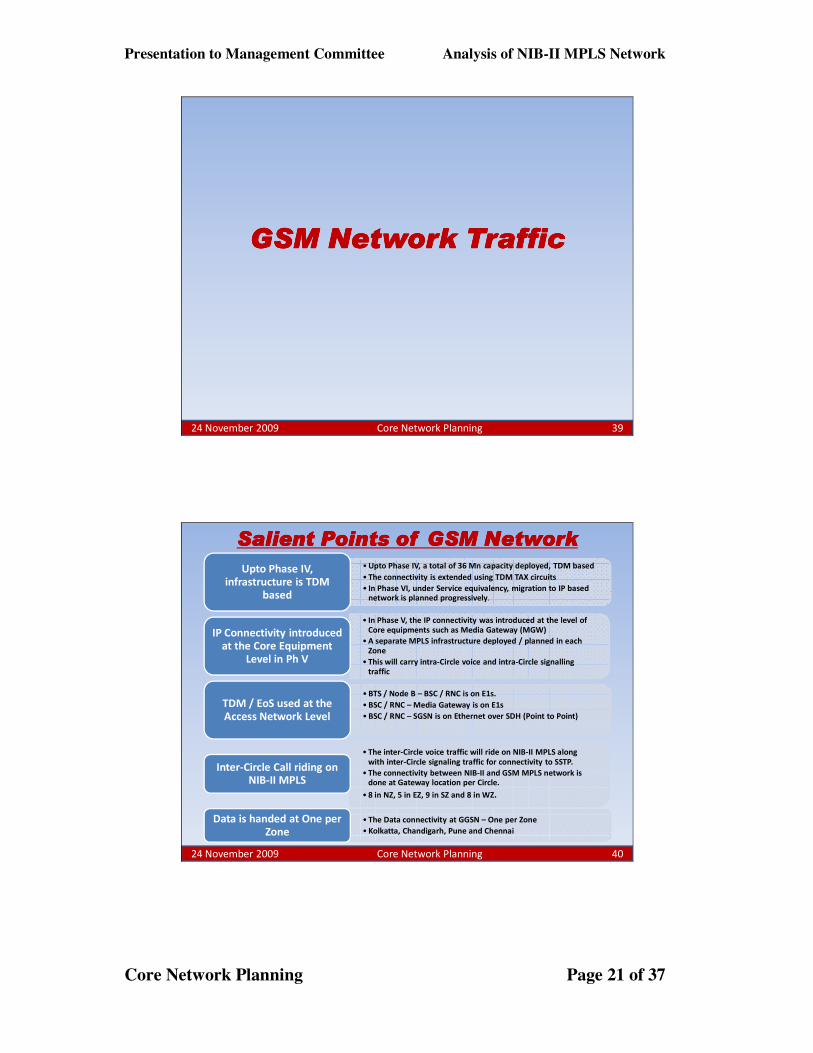
GSM Network TrafficGSM Network TrafficGSM Network TrafficGSM Network Traffic
24 November 2009 Core Network Planning 39
Salient Points of GSM NetworkSalient Points of GSM NetworkSalient Points of GSM NetworkSalient Points of GSM Network• Upto Phase IV, a total of 36 Mn capacity deployed, TDM based
• The connectivity is extended using TDM TAX circuits
• In Phase VI, under Service equivalency, migration to IP based network is planned progressively.
Upto Phase IV, infrastructure is TDM
based
• In Phase V, the IP connectivity was introduced at the level of Core equipments such as Media Gateway (MGW)
• A separate MPLS infrastructure deployed / planned in each Zone
• This will carry intra-Circle voice and intra-Circle signallingtraffic
IP Connectivity introduced at the Core Equipment
Level in Ph V
• BTS / Node B – BSC / RNC is on E1s.
• BSC / RNC – Media Gateway is on E1s
• BSC / RNC – SGSN is on Ethernet over SDH (Point to Point)
TDM / EoS used at the Access Network Level
• The inter-Circle voice traffic will ride on NIB-II MPLS along
with inter-Circle signaling traffic for connectivity to SSTP.
• The connectivity between NIB-II and GSM MPLS network is done at Gateway location per Circle.
• 8 in NZ, 5 in EZ, 9 in SZ and 8 in WZ.
Inter-Circle Call riding on NIB-II MPLS
• The Data connectivity at GGSN – One per Zone
• Kolkatta, Chandigarh, Pune and Chennai
Data is handed at One per Zone
24 November 2009 Core Network Planning 40
Presentation to Management Committee Analysis of NIB-II MPLS Network
Core Network Planning Page 22 of 37
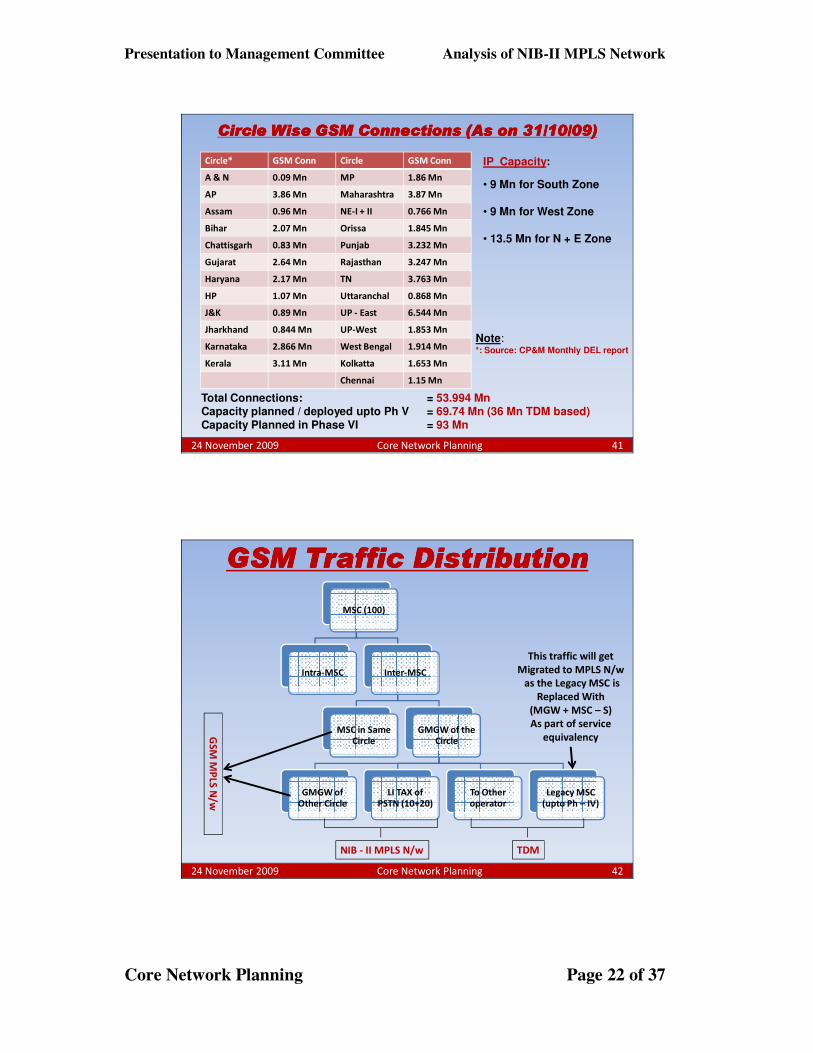
Circle Wise GSM Connections (As on 31/10/09)Circle Wise GSM Connections (As on 31/10/09)Circle Wise GSM Connections (As on 31/10/09)Circle Wise GSM Connections (As on 31/10/09)
Circle* GSM Conn Circle GSM Conn
A & N 0.09 Mn MP 1.86 Mn
AP 3.86 Mn Maharashtra 3.87 Mn
Assam 0.96 Mn NE-I + II 0.766 Mn
Bihar 2.07 Mn Orissa 1.845 Mn
Chattisgarh 0.83 Mn Punjab 3.232 Mn
Gujarat 2.64 Mn Rajasthan 3.247 Mn
Haryana 2.17 Mn TN 3.763 Mn
HP 1.07 Mn Uttaranchal 0.868 Mn
J&K 0.89 Mn UP - East 6.544 Mn
Jharkhand 0.844 Mn UP-West 1.853 Mn
Karnataka 2.866 Mn West Bengal 1.914 Mn
Kerala 3.11 Mn Kolkatta 1.653 Mn
Chennai 1.15 Mn
Total Connections: = 53.994 MnCapacity planned / deployed upto Ph V = 69.74 Mn (36 Mn TDM based)Capacity Planned in Phase VI = 93 Mn
IP Capacity:
• 9 Mn for South Zone
• 9 Mn for West Zone
• 13.5 Mn for N + E Zone
Note:*: Source: CP&M Monthly DEL report
24 November 2009 Core Network Planning 41
GSM Traffic DistributionGSM Traffic DistributionGSM Traffic DistributionGSM Traffic Distribution
MSC (100)
Intra-MSC Inter-MSC
MSC in Same Circle
GMGW of the Circle
GMGW of Other Circle
LI TAX of PSTN (10+20)
To Other operator
Legacy MSC (upto Ph – IV)
NIB - II MPLS N/w
This traffic will get
Migrated to MPLS N/w
as the Legacy MSC is
Replaced With
(MGW + MSC – S)
As part of service
equivalencyGS
M M
PLS
N/w
TDM
24 November 2009 Core Network Planning 42

Presentation to Management Committee Analysis of NIB-II MPLS Network
Core Network Planning Page 23 of 37
Traffic Calculation (Voice) Traffic Calculation (Voice) Traffic Calculation (Voice) Traffic Calculation (Voice) –––– For Ph V and onwardsFor Ph V and onwardsFor Ph V and onwardsFor Ph V and onwards
Assumptions: (From Ph VI Tender)
• Average traffic per customer = 50 mErl
– Incoming = 25 mErl
– Outgoing = 25 mErl
• GSM – GSM = 70%
• GSM – PSTN = 10%
• PSTN – GSM = 20%
Traffic Calculation:1. Traffic from 1 Mn customers = 50,000 Erlg
2. Traffic in IP (@ 70% utilization)
a) 50000X50/(1000000*.7) = 3.5 Gbps simplex
= 1.75 Gbps duplex
3. Traffic distributed among GSM , NIB and TDM
4. Peak expected traffic in NIB Core around = 0.8 Gbps full duplex
24 November 2009 Core Network Planning 43
Zone Circle Nov ‘ 08 Apr ‘ 09 Circle Nov ‘ 08 Apr ‘09
South
AP 0.68 0.92 TN 0.73 1.25
Kerala 1.51 2.76 CHTD 0.81 1.26
Karnataka 1.08 1.58
North
HR 0.88 0.58 UP E 6.31 11.7
PB+HP+JK 21.71 23.24 UPW
+UAL
6.29 10.32
Rajasthan 4.9 2.82
East
AS+NEI+NEII 4.53 3.99 WB+AN 6.04 -
BR + JKND 2.11 2.66 CLTD 2.76 2.03
OR 2.22 6.29
West
MH 3.22 6.16 GJ 3.17 3.4
MP + CHG 3.8 3.14
Avg Throughput(GGSN Avg Throughput(GGSN Avg Throughput(GGSN Avg Throughput(GGSN ---- SGSN) in MbpsSGSN) in MbpsSGSN) in MbpsSGSN) in Mbps
As can be seen, Data Traffic is hardly anything at this instantAs can be seen, Data Traffic is hardly anything at this instantAs can be seen, Data Traffic is hardly anything at this instantAs can be seen, Data Traffic is hardly anything at this instant.The Loading of existing SGSN is low (The Loading of existing SGSN is low (The Loading of existing SGSN is low (The Loading of existing SGSN is low (Capacity = 100 MbpsCapacity = 100 MbpsCapacity = 100 MbpsCapacity = 100 Mbps))))
24 November 2009 Core Network Planning 44
Presentation to Management Committee Analysis of NIB-II MPLS Network
Core Network Planning Page 24 of 37
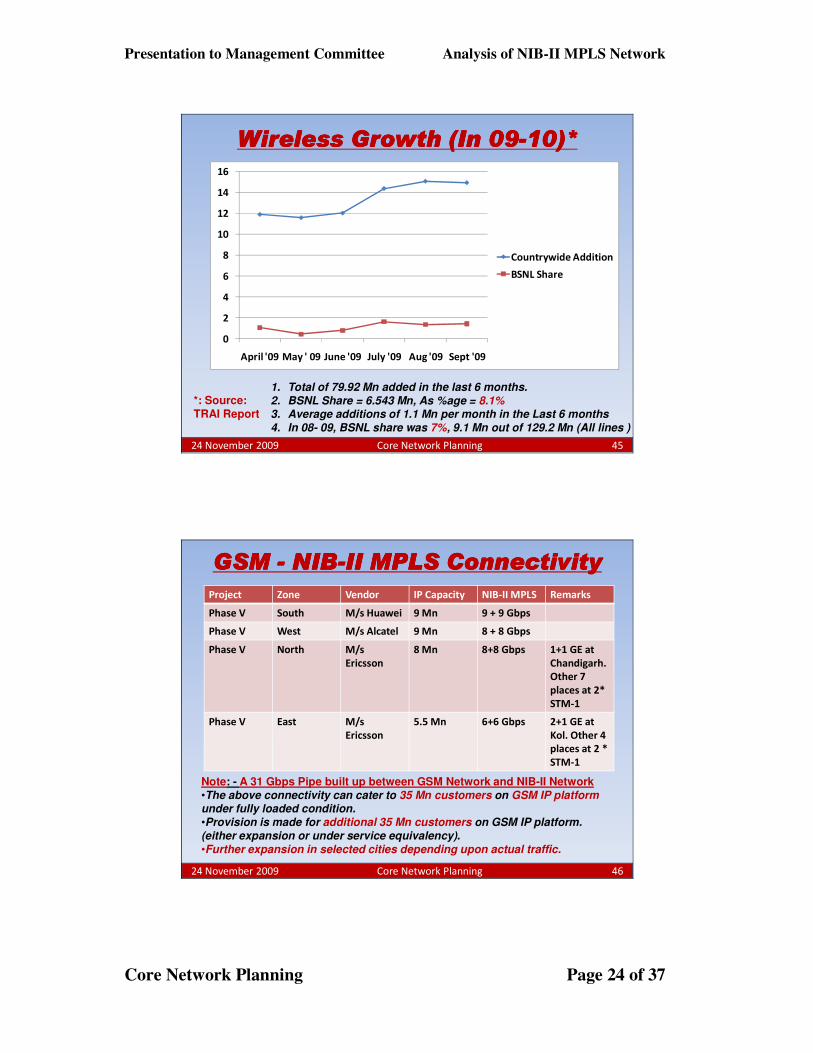
Wireless Growth (In 09Wireless Growth (In 09Wireless Growth (In 09Wireless Growth (In 09----10)*10)*10)*10)*
0
2
4
6
8
10
12
14
16
April '09 May ' 09 June '09 July '09 Aug '09 Sept '09
Countrywide Addition
BSNL Share
1. Total of 79.92 Mn added in the last 6 months.
2. BSNL Share = 6.543 Mn, As %age = 8.1%3. Average additions of 1.1 Mn per month in the Last 6 months
4. In 08- 09, BSNL share was 7%, 9.1 Mn out of 129.2 Mn (All lines )
*: Source: TRAI Report
24 November 2009 Core Network Planning 45
GSM GSM GSM GSM ---- NIBNIBNIBNIB----II MPLS ConnectivityII MPLS ConnectivityII MPLS ConnectivityII MPLS Connectivity
Project Zone Vendor IP Capacity NIB-II MPLS Remarks
Phase V South M/s Huawei 9 Mn 9 + 9 Gbps
Phase V West M/s Alcatel 9 Mn 8 + 8 Gbps
Phase V North M/s
Ericsson
8 Mn 8+8 Gbps 1+1 GE at
Chandigarh.
Other 7
places at 2*
STM-1
Phase V East M/s
Ericsson
5.5 Mn 6+6 Gbps 2+1 GE at
Kol. Other 4
places at 2 *
STM-1
Note: - A 31 Gbps Pipe built up between GSM Network and NIB-II Network•The above connectivity can cater to 35 Mn customers on GSM IP platform under fully loaded condition.
•Provision is made for additional 35 Mn customers on GSM IP platform.
(either expansion or under service equivalency).
•Further expansion in selected cities depending upon actual traffic.
24 November 2009 Core Network Planning 46

Presentation to Management Committee Analysis of NIB-II MPLS Network
Core Network Planning Page 25 of 37
Executive Summary of the Recommendation Executive Summary of the Recommendation Executive Summary of the Recommendation Executive Summary of the Recommendation ---- IIII
• No need for separate MPLS infrastructure as part of Phase VI.
• Leverage on MPLS infrastructure as part of Phase V and NIB-II MPLS.
Optimize MPLS Deployment
• Presently the voice is on TDM and Data is on EoS.
• The current packet connectivity on SDH shall be migrated to Packet based network progressively.
• The same can be implemented using existing Metro Area Aggregation Network, as and when the same is planned.
IP Connectivity of Access Network (BTS / Node B – BSC
/ RNC – MSC / SGSN)
• The current GPRS / EDGE traffic is insignificant.
• The same is expected to increase with launch of 3G
• Focussed approach on 3G – Top few cities .
Data Traffic is negligible
• For connectivity to PSTN for new network, leverage on IP TAX.
• Explore Usage of Media Gateway deployed as part of IP TAX.
Leverage on IP –TAX infrastructure
Leverage on Existing Infrastructure (GSM + IP TAX) for future expansionLeverage on Existing Infrastructure (GSM + IP TAX) for future expansionLeverage on Existing Infrastructure (GSM + IP TAX) for future expansionLeverage on Existing Infrastructure (GSM + IP TAX) for future expansion
24 November 2009 Core Network Planning 47
Executive Summary of the Recommendation Executive Summary of the Recommendation Executive Summary of the Recommendation Executive Summary of the Recommendation ---- IIIIIIII
• GSM MPLS Network of M/s Ericsson
• Connectivity with NIB-II MPLS at Chandigarh, Ambala, Jammu, Lucknow, Noida, Shimla, Jaipur and Jullundhur.
North Zone
• GSM MPLS Network of M/s Ericsson
• Connectivity with NIB-II MPLS at Kolkatta, Patna, Shillong, Guwahati and Sambalpur
East Zone
• GSM MPLS Network of M/s Alcatel – M/s CISCO
• Connectivity with NIB-II MPLS at Pune, Nagpur, Ahemdabad, Surat, Bhopal, Indore, Raipur and Durg(Parented to Raipur)
West Zone
• GSM MPLS Network of M/s Huawei
• Connectivity with NIB-II MPLS at Hyderabad, Vijayawada, BGL, Mysore, Chennai, Coimbatore, Ernakulem, Madurai and TVM
South Zone
The initial connectivity will be on 1+1 GE interface to be augmented The initial connectivity will be on 1+1 GE interface to be augmented The initial connectivity will be on 1+1 GE interface to be augmented The initial connectivity will be on 1+1 GE interface to be augmented
to 2+1 GE depending on the trafficto 2+1 GE depending on the trafficto 2+1 GE depending on the trafficto 2+1 GE depending on the traffic.
24 November 2009 Core Network Planning 48

Presentation to Management Committee Analysis of NIB-II MPLS Network
Core Network Planning Page 26 of 37
Other NetworksOther NetworksOther NetworksOther Networks
24 November 2009 Core Network Planning 49
Connectivity to Other Access NetworksConnectivity to Other Access NetworksConnectivity to Other Access NetworksConnectivity to Other Access Networks• Around 500 Routers are deployed covering all SSA.
• Expected Peak loading around 30%. We can spare some Routers through consolidation.
• These Routers are planned to be connected on STM-1 on dual mode basis
• Project delayed. Still in PoC Stage.
• Focus on early commissioning of the same.
CDR Project
• SSTP Switches deployed in 24 cities
• The present connectivity is on Fast Ethernet Interface
• The same is planned to be connected on Gigabit Ethernet interface – the peak traffic presently is only 20 Mbps.
SSTP
• Connectivity with Ku-band Router at Bangalore
• The physical connectivity is through n*64 / E1 / FE
• One link per VPN customer is used between PE Router and Ku-band Router
Ku band VSAT
• One per Zone
• Connectivity on 1+1 GE interfaceCDMA PDSN
• Routers / Switches at SSA connected on E1s
• Regional NMS connected on STM-1Tax NMS
24 November 2009 Core Network Planning 50
Presentation to Management Committee Analysis of NIB-II MPLS Network
Core Network Planning Page 27 of 37
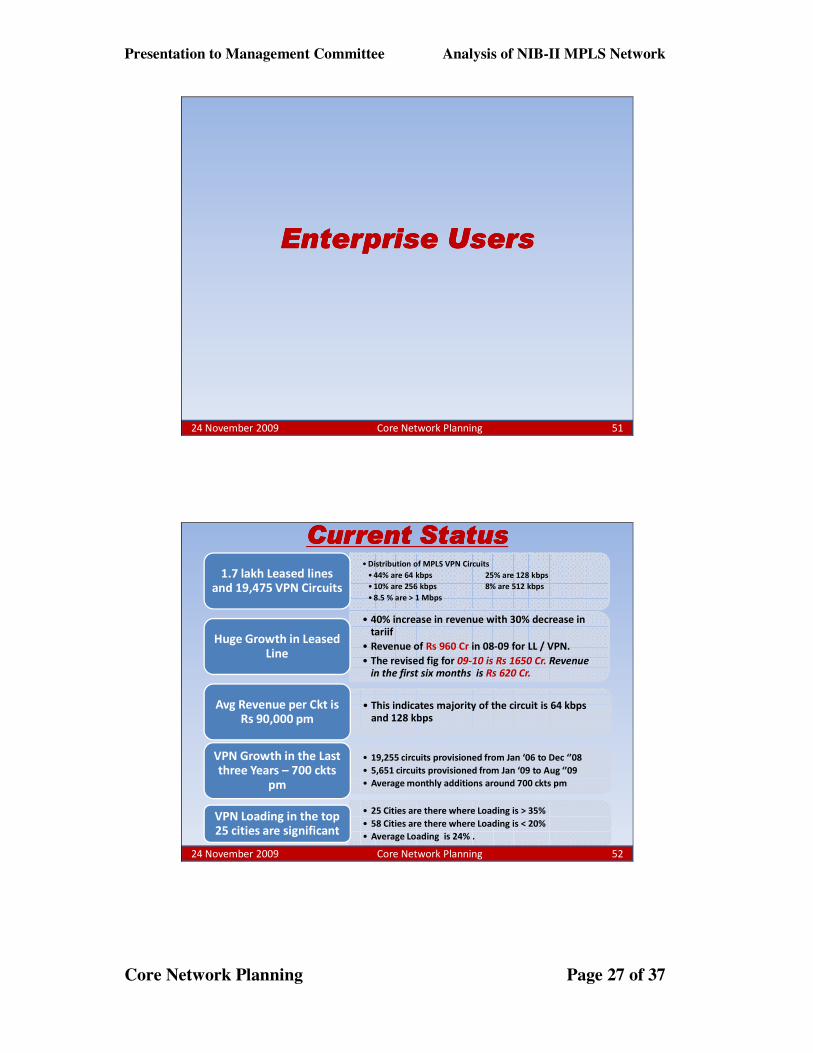
Enterprise UsersEnterprise UsersEnterprise UsersEnterprise Users
24 November 2009 Core Network Planning 51
Current StatusCurrent StatusCurrent StatusCurrent Status• Distribution of MPLS VPN Circuits
• 44% are 64 kbps 25% are 128 kbps
• 10% are 256 kbps 8% are 512 kbps
• 8.5 % are > 1 Mbps
1.7 lakh Leased lines and 19,475 VPN Circuits
• 40% increase in revenue with 30% decrease in tariif
• Revenue of Rs 960 Cr in 08-09 for LL / VPN.
• The revised fig for 09-10 is Rs 1650 Cr. Revenue in the first six months is Rs 620 Cr.
Huge Growth in Leased Line
• This indicates majority of the circuit is 64 kbps and 128 kbps
Avg Revenue per Ckt is Rs 90,000 pm
• 19,255 circuits provisioned from Jan ‘06 to Dec ‘’08
• 5,651 circuits provisioned from Jan ‘09 to Aug ‘’09
• Average monthly additions around 700 ckts pm
VPN Growth in the Last three Years – 700 ckts
pm
• 25 Cities are there where Loading is > 35%
• 58 Cities are there where Loading is < 20%
• Average Loading is 24% .
VPN Loading in the top 25 cities are significant
24 November 2009 Core Network Planning 52
Presentation to Management Committee Analysis of NIB-II MPLS Network
Core Network Planning Page 28 of 37
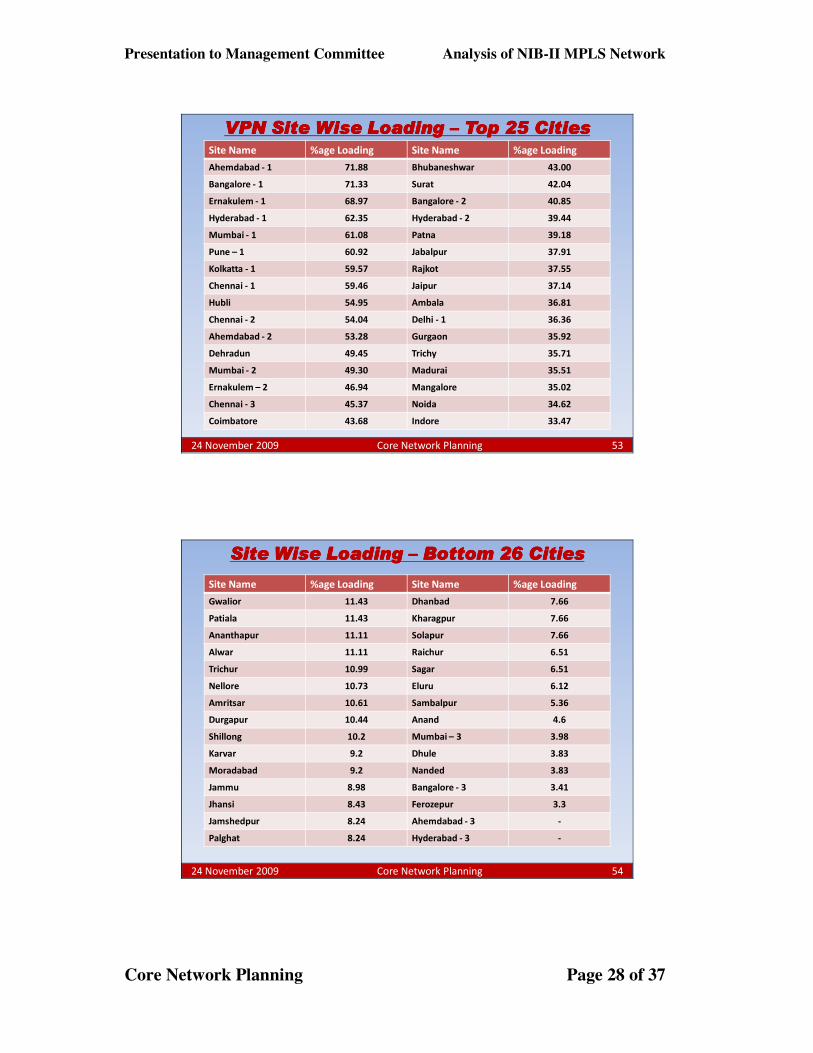
VPN Site Wise Loading VPN Site Wise Loading VPN Site Wise Loading VPN Site Wise Loading –––– Top 25 CitiesTop 25 CitiesTop 25 CitiesTop 25 CitiesSite Name %age Loading Site Name %age Loading
Ahemdabad - 1 71.88 Bhubaneshwar 43.00
Bangalore - 1 71.33 Surat 42.04
Ernakulem - 1 68.97 Bangalore - 2 40.85
Hyderabad - 1 62.35 Hyderabad - 2 39.44
Mumbai - 1 61.08 Patna 39.18
Pune – 1 60.92 Jabalpur 37.91
Kolkatta - 1 59.57 Rajkot 37.55
Chennai - 1 59.46 Jaipur 37.14
Hubli 54.95 Ambala 36.81
Chennai - 2 54.04 Delhi - 1 36.36
Ahemdabad - 2 53.28 Gurgaon 35.92
Dehradun 49.45 Trichy 35.71
Mumbai - 2 49.30 Madurai 35.51
Ernakulem – 2 46.94 Mangalore 35.02
Chennai - 3 45.37 Noida 34.62
Coimbatore 43.68 Indore 33.47
24 November 2009 Core Network Planning 53
Site Wise Loading Site Wise Loading Site Wise Loading Site Wise Loading –––– Bottom 26 CitiesBottom 26 CitiesBottom 26 CitiesBottom 26 Cities
Site Name %age Loading Site Name %age Loading
Gwalior 11.43 Dhanbad 7.66
Patiala 11.43 Kharagpur 7.66
Ananthapur 11.11 Solapur 7.66
Alwar 11.11 Raichur 6.51
Trichur 10.99 Sagar 6.51
Nellore 10.73 Eluru 6.12
Amritsar 10.61 Sambalpur 5.36
Durgapur 10.44 Anand 4.6
Shillong 10.2 Mumbai – 3 3.98
Karvar 9.2 Dhule 3.83
Moradabad 9.2 Nanded 3.83
Jammu 8.98 Bangalore - 3 3.41
Jhansi 8.43 Ferozepur 3.3
Jamshedpur 8.24 Ahemdabad - 3 -
Palghat 8.24 Hyderabad - 3 -
24 November 2009 Core Network Planning 54

Presentation to Management Committee Analysis of NIB-II MPLS Network
Core Network Planning Page 29 of 37
Growth in the data market expected to be driven by MPLSVPN and High Speed Data & Internet (HSDI)
1,689
3,9541,373
2,5873,618
5,782
99
127
0
2,000
4,000
6,000
8,000
10,000
12,000
6,807
CY 2008
12,422
CY 2013
LegacyPacket
LeasedLine
Hi SpeedData andInternet
MPLSVPN
Rs. Cr.
Source: Frost & Sullivan, IDC, Gartner, Ovum, Analyst Reports, BCG analysis
CAGRCAGRShare of
BSNL
Share of BSNL TrendsTrends
~13%
~44%
2%
10%
14%
19%
• Will continue to be used by
select verticals (e.g. BFSI) for running core apps till
such time switching costs
remain high
• ISDN & VSAT used for
data connectivity backup
• DSL primary source of
internet connectivity for
small & SOHO
• Gaining popularity for transport of distributed
data owing to lower TCO
• Expected to take share
from legacy packet as
customers upgrade their
data networks
13%
~95%-5%
• Preferred for high
bandwidth P2P links
Mainstay for international
data connectivity
Enterprise data market break up by product (2008-13)
24 November 2009 Core Network Planning 55
BSNL is currently a strong player in the data marketOwing to dominant share in the NPLC and HSDI markets
BSNL is the joint #3 player in the enterprise data services market
No presence in IPLC today
Negligible presence in MPLS VPN
HSDI dominance due to high fixed line penetration
Predominant share in NPLC
22%
19%
17%
9%
100%
5%
5%
6%
0 20 40 60 80 100
Tulip
Sify
HCL
Others
Total
Share in enterprise data market1 (%)
TCL
Reliance
Bharti
17%BSNL
1. This denotes the share in the entire enterprise data services market – corporate + SMBNote: Market shares for FY 2006-07Source: Frost & Sullivan, Analyst Reports, BCG analysis
24%
24%
100%
5%
12%
0 50 100
36%BSNL
Reliance
Bharti
TCL
MTNL
Total
28%
100%
64%
0 50 100
TCL
Reliance
8%Bharti
Total
26%
100%
6%
11%
14%
0 50 100
44%BSNL
Bharti
Reliance
TCL
Others
Total 100%
4%
2%
5%
6%
12%
21%
22%
28%
0 50 100
Tulip
Sify
Reliance
Bharti
HCL
TCL
BSNL
Others
Total
24 November 2009 Core Network Planning 56

Presentation to Management Committee Analysis of NIB-II MPLS Network
Core Network Planning Page 30 of 37
Key points For the Enterprise Segment for VPNKey points For the Enterprise Segment for VPNKey points For the Enterprise Segment for VPNKey points For the Enterprise Segment for VPN
• More and More customers will demand Ethernet as the preferred interface
• MPLS VPN will be preferred over LL because of lower TCO. Customer need to be educated and convinced on the same.
Future trend towards Ethernet
and VPN
• Presently most of the Circuits are 64 kbps and 128 kbps
• They require lot of intermediate elements such as MUX, MLLN equipment etc – Mtce issues
• Migrating to 2 Mbps will make implementation and maintenance smoother
Focus more on 2Mbps and above
for VPN
• This results in very long last mile
• This even go upto 25-30 Km
• Multiple POPs in Delhi and Mumbai
• End-to-End infrastructure: Local lead, Tx back-haul + Router
No MAN in Delhi and Mumbai
• In Other cities, MAN has been built up as part of Multiplay project.
• Leverage on the same for provisioning of Ethernet connectivity
Leverage on the MAN in Other Cities
24 November 2009 Core Network Planning 57
CPE
V
M
U
X
CPE
D
X
C
V
M
U
X
D
X
C
V
M
U
X
V
M
U
X
CPE
V
M
U
X
CPED
X
C
V
M
U
X
D
X
C
V
M
U
X
V
M
U
X
V
M
U
X
City A City B
City A City B
VIRTUAL
POP
PHYSICAL
POP
OtherCities
OtherCities
MPLS MPLS MPLS MPLS –––– MLLN: Complement Each OtherMLLN: Complement Each OtherMLLN: Complement Each OtherMLLN: Complement Each Other
24 November 2009 Core Network Planning 58

Presentation to Management Committee Analysis of NIB-II MPLS Network
Core Network Planning Page 31 of 37
Virtual POP Vs Physical POPVirtual POP Vs Physical POPVirtual POP Vs Physical POPVirtual POP Vs Physical POP
Parameter
Local Lead
MLLN Cost
Back-haul Cost
Router Cost
Link performance
Commissioning time
OPEX
Virtual POP
Extended to nearest City
(B) - Longer
From City A to City B on
MLLN - higher
Zero
Zero
Same
Similiar
Lesser
Physical POP
Confined to City A itself -
Shorter
MLLN confined to City A
only - Lesser
Minimum 2 STM-1s
Around 26 lacs
Improved due to
redundancy
Similiar
Higher – due to
deployment of Router
Note:
1. In both the models, the issue predominantly comes in the last mile. In case of Virtual POP, every VMUX is already connected with nearest DXC on E1 and practically there is no such maintenance issue once the link is commissioned.
2. The average loading of MLLN Network is 38% spanning 1800 SDCAs
24 November 2009 Core Network Planning 59
Additional POPs where LL is Around 1000 CircuitsAdditional POPs where LL is Around 1000 CircuitsAdditional POPs where LL is Around 1000 CircuitsAdditional POPs where LL is Around 1000 Circuits
Circles POP Present Addtl POP Circles POP Present Addtl POP
AP 8 1 (Guntur) NE – I 1 0
Assam 4 0 NE – II 0 0
Bihar 4 0 Orissa 3 0
Jharkhand 3 0 Punjab 7 0
Gujrat 5 0 Rajasthan 5 0
Haryana 3 1 (Karnal) Tamilnadu 7 -
HP 1 0 UP-East 6 0
J&K 2 0 Up-West 6 0
Karnataka 7 0 Uttaranchal 2 0
Kerala 5 0 West Bengal 3 0
MP 5 0 Chennai TD 4 0
Chattisgarh 2 0 Kolkatta TD 4 0
Maharashtra 9 0
Only two Cities are there where Additional POP may be required. Further Only two Cities are there where Additional POP may be required. Further Only two Cities are there where Additional POP may be required. Further Only two Cities are there where Additional POP may be required. Further ---- Delhi Delhi Delhi Delhi
And Mumbai will require multiple POPs (4 each) for geographical diversityAnd Mumbai will require multiple POPs (4 each) for geographical diversityAnd Mumbai will require multiple POPs (4 each) for geographical diversityAnd Mumbai will require multiple POPs (4 each) for geographical diversity
24 November 2009 Core Network Planning 60

Presentation to Management Committee Analysis of NIB-II MPLS Network
Core Network Planning Page 32 of 37
Additional POPs where LL is Around 400 Additional POPs where LL is Around 400 Additional POPs where LL is Around 400 Additional POPs where LL is Around 400 ---- 500 Circuits500 Circuits500 Circuits500 Circuits
Circles POP Present Addtl POP Circles POP Present Addtl POP
AP 8 2 (Kurnool, NL) NE – I 1 0
Assam 4 0 NE – II 0 0
Bihar 4 0 Orissa 3 0
Jharkhand 3 0 Punjab 7 2 (Bathinda,
Pathankot)
Gujrat 5 0 Rajasthan 5 2 (Bikaner,
Srigangangr)
Haryana 3 2 (Hissar, Rohtak) Tamilnadu 7 -
HP 1 0 UP-East 6 0
J&K 2 0 Up-West 6 1 (Bareilly – 713)
Karnataka 7 2 (Shimoga, Tumkur) Uttaranchal 2 1 (Nainital)
Kerala 5 5 West Bengal 3 1 (Asansol)
MP 5 0 Chennai TD 4 0
Chattisgarh 2 0 Kolkatta TD 4 0
Maharashtra 9 0
Around 20 POPs additionally.. This makes the total no of Routers to 30.Around 20 POPs additionally.. This makes the total no of Routers to 30.Around 20 POPs additionally.. This makes the total no of Routers to 30.Around 20 POPs additionally.. This makes the total no of Routers to 30.
24 November 2009 Core Network Planning 61
Executive Recommendation for Enterprise UserExecutive Recommendation for Enterprise UserExecutive Recommendation for Enterprise UserExecutive Recommendation for Enterprise User
• Expansion may have to be done in the existing 15-20 cities only. This can be done through re-arrangement of cards from smaller cities.
Expansion in Top 20-25 Cities
• 10 POPs will be required predominantly at Mumbai and Delhi
• 20 addtl POPs for Cities where LL is > 500 circuits for offering improved SLA to customer.
10 + 20 New POPs
• MLLN spans 1800 SDCAs with plan to cover remaining 800.
• All MLLN Nodes are Virtual Nodes.
Leverage on MLLN infrastructure
• MAN has to be built up in Delhi and Mumbai
• Technologies such as RPR / FTTX / Carrier Ethernet can be explored.
Deploy MAN in Delhi and Mumbai
• In top 98 cities, leverage on the MAN deployed as part of Multiplay.
• Phase III expansion to provision for Ethernet interface for enterprise user
Leverage on existing MAN in Other 98 Cities
• DSL also can be positioned for providing VPN service in smaller cities and also for providing lower bandwidth.
• Each DSLAM acts as MPLS POP, more than 2000 cities
DSL for Lower bandwidth
24 November 2009 Core Network Planning 62

Presentation to Management Committee Analysis of NIB-II MPLS Network
Core Network Planning Page 33 of 37
Summary of ExpansionSummary of ExpansionSummary of ExpansionSummary of Expansion
24 November 2009 Core Network Planning 63
Details of Interface RequirementDetails of Interface RequirementDetails of Interface RequirementDetails of Interface Requirement–––– A type Cities A type Cities A type Cities A type Cities
Project POI Existing
Interface
per POI
A1 – DLI,
MUM
A1 - 3 A2 - 3 A3 - 6 A4 – 10
Broadband 166 at 106
locations
2 0 10*1 6*1 4*1 2*1
GSM 29
locations
0 0 4 PN -4,
Other - 2
2 RP, NGP,
CBT, VYD,
MYS,
CHD,GWH,
– 2, Other
0
IP TAX 20
locations*
2GE at CHN
and DLI
2 2 2 2 , IND=0 RP,NGP,GW
H,CBT = 2
Wi-Max 22
locations
0 0 2 2 2 RNC, GWH,
CHD = 2,
Other = 0
SSTP 24
locations
2*FE 2 2 2, PN=0 2, IND= 0 NGP,GWH,
CBT = 2
CDR 104 loc 0 8*STM-1 8*STM-1 8*STM-1 8*STM-1
All interfaces in GE unless specified
24 November 2009 Core Network Planning 64

Presentation to Management Committee Analysis of NIB-II MPLS Network
Core Network Planning Page 34 of 37
Details of Interface Requirement Details of Interface Requirement Details of Interface Requirement Details of Interface Requirement –––– B type CitiesB type CitiesB type CitiesB type Cities
Project POI Existing Interface
per POIB1 B2
Broadband 166 at 106
locations
2 0 0
GSM 29 locations 0 SU,TVM,MYS,
MD,BP ,JAM,
NDA,= 2, Other 0
AMB, SMB,SML,
IP TAX 19 locations* 0 BP,Agra,Rajkot =2 Ambala, Cuttack =
2
Wi-Max 0 NDA, BP, TVM,
LDH, AMR = 2,
Other =0
Calicut, Trichur = 2,
Other = 0
SSTP 24 locations 2 * FE BP,Agra,Rajkot ,
JAM,Shillong =2
AMB, SHM, CUT,
Dimapur = 2
CDR 104 locations 0 4*STM-1 4*STM-1
All interface in GE unless specified
24 November 2009 Core Network Planning 65
Summary of Other RequirementsSummary of Other RequirementsSummary of Other RequirementsSummary of Other Requirements
• Expansion in Top 15 – 20 cities through re-arrangement of cards.
• 10 + 20 new POPs
• Deployment of Metro Area Aggregation Network in Mumbai and Delhi to reduce last mile.
• Leveraging on existing RPR Metro Area Aggregation Network in top 98 cities
For Enterprise
User
• Required in Mumbai, Chennai and Bangalore.
• One high end Router already there.
• One more set of IGW – IGW PE Router per City may be required – Total 6 Routers.
International Gateway
router
• New Core Routers to be deployed in top 15-20 Cities with 10GE connectivity and nx10Ge with Bangalore, Mumbai and Chennai. Total routers = 30-40.
• Existing Core Routers to continue the way as it is.
Core Connectivity
24 November 2009 Core Network Planning 66
Presentation to Management Committee Analysis of NIB-II MPLS Network
Core Network Planning Page 35 of 37
Line of ActionLine of ActionLine of ActionLine of Action
24 November 2009 Core Network Planning 67
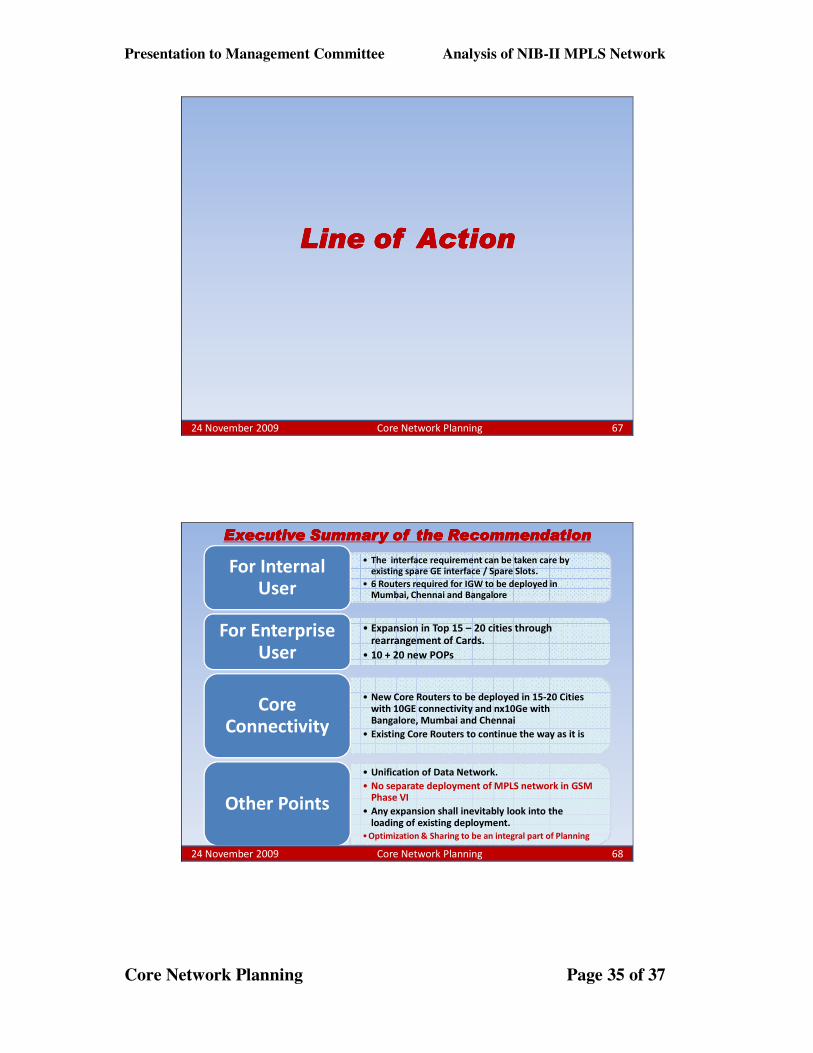
Executive Summary of the RecommendationExecutive Summary of the RecommendationExecutive Summary of the RecommendationExecutive Summary of the Recommendation
• The interface requirement can be taken care by existing spare GE interface / Spare Slots.
• 6 Routers required for IGW to be deployed in Mumbai, Chennai and Bangalore
For Internal User
• Expansion in Top 15 – 20 cities through rearrangement of Cards.
• 10 + 20 new POPs
For Enterprise User
• New Core Routers to be deployed in 15-20 Cities with 10GE connectivity and nx10Ge with Bangalore, Mumbai and Chennai
• Existing Core Routers to continue the way as it is
Core Connectivity
• Unification of Data Network.
• No separate deployment of MPLS network in GSM Phase VI
• Any expansion shall inevitably look into the loading of existing deployment.
•Optimization & Sharing to be an integral part of Planning
Other Points
24 November 2009 Core Network Planning 68
Presentation to Management Committee Analysis of NIB-II MPLS Network
Core Network Planning Page 36 of 37
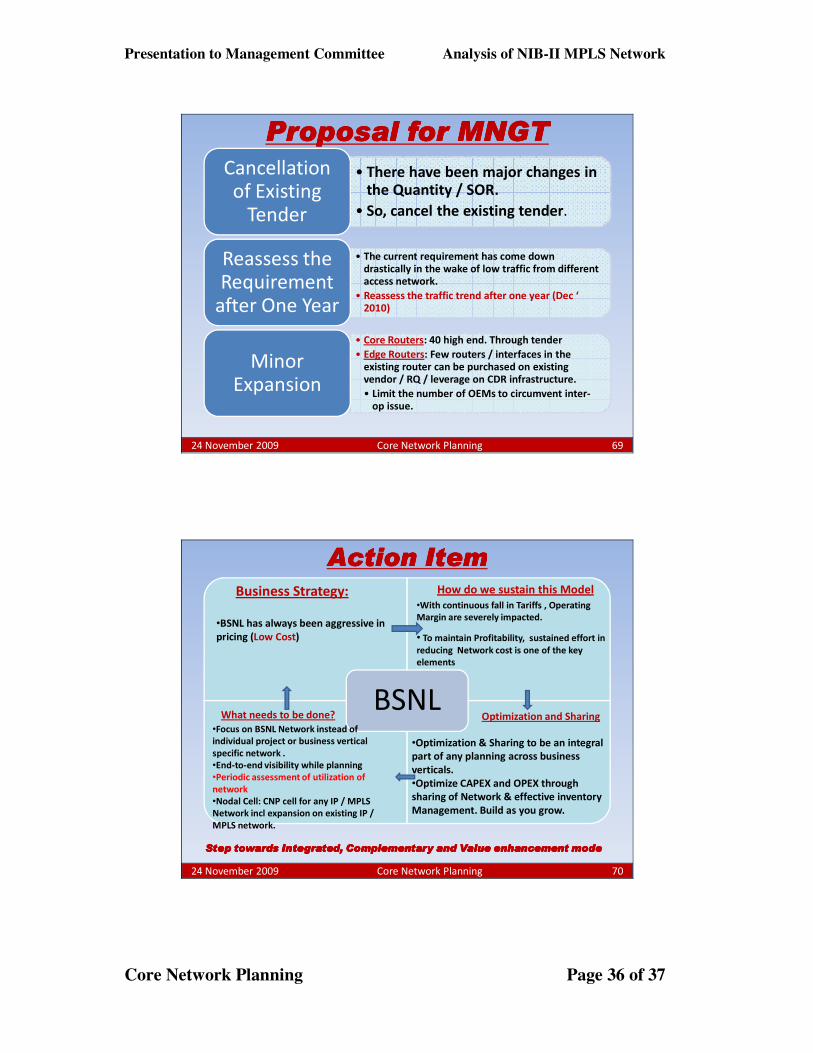
Proposal for MNGTProposal for MNGTProposal for MNGTProposal for MNGT
• There have been major changes in the Quantity / SOR.
• So, cancel the existing tender.
Cancellation
of Existing
Tender
• The current requirement has come down drastically in the wake of low traffic from different access network.
• Reassess the traffic trend after one year (Dec ‘ 2010)
Reassess the
Requirement
after One Year
• Core Routers: 40 high end. Through tender
• Edge Routers: Few routers / interfaces in the existing router can be purchased on existing vendor / RQ / leverage on CDR infrastructure.
• Limit the number of OEMs to circumvent inter-op issue.
Minor
Expansion
24 November 2009 Core Network Planning 69
Action ItemAction ItemAction ItemAction Item
BSNL
Business Strategy: How do we sustain this Model
Optimization and Sharing
•BSNL has always been aggressive in
pricing (Low Cost)
•With continuous fall in Tariffs , Operating
Margin are severely impacted.
• To maintain Profitability, sustained effort in
reducing Network cost is one of the key
elements
•Optimization & Sharing to be an integral
part of any planning across business
verticals.
•Optimize CAPEX and OPEX through
sharing of Network & effective inventory
Management. Build as you grow.
•Focus on BSNL Network instead of
individual project or business vertical
specific network .
•End-to-end visibility while planning
•Periodic assessment of utilization of
network
•Nodal Cell: CNP cell for any IP / MPLS
Network incl expansion on existing IP /
MPLS network.
Step towards Integrated, Complementary and Value enhancement modeStep towards Integrated, Complementary and Value enhancement modeStep towards Integrated, Complementary and Value enhancement modeStep towards Integrated, Complementary and Value enhancement mode
What needs to be done?
24 November 2009 Core Network Planning 70

Presentation to Management Committee Analysis of NIB-II MPLS Network
Core Network Planning Page 37 of 37
THANK YOUTHANK YOUTHANK YOUTHANK YOU
For Any Clarification, Pls Contact:
SANJEEV VERMADGM (CNP – IV)
Mob: [email protected]
24 November 2009 Core Network Planning 71
************************************************************************