Core Funding for Local Health Departments - Conduit Street · PDF fileCore Funding for Local...
24
Core Funding for Local Health Departments An Analysis of the Maryland Funding Formula and its Impact on Local Health Services Christine O’Malley 5/5/2010 A Document Prepared for the Maryland Association of County Health Officers
Transcript of Core Funding for Local Health Departments - Conduit Street · PDF fileCore Funding for Local...

Core Funding for Local
Health Departments An Analysis of the Maryland Funding Formula and
its Impact on Local Health Services
Christine O’Malley
5/5/2010
A Document Prepared for the Maryland Association of County Health Officers

2
Contents
Executive summary ......................................................................................................................... 3
Local health department funding sources ....................................................................................... 3
Core funding ................................................................................................................................... 4
Impact of Core funding cuts on services......................................................................................... 6
History & development of core funding ......................................................................................... 8
History of local health services in Maryland .............................................................................. 8
Case formula ............................................................................................................................... 9
Development of current law ...................................................................................................... 13
Cost of Living Allowances (COLAs) ........................................................................................... 16
Comparison to other states ............................................................................................................ 17
Comparison to Maryland Education Formula ............................................................................... 19
Conclusions ................................................................................................................................... 19

3
Executive summary
Local health departments (LHDs) in Maryland face serious challenges to their capacity to deliver
public health services in light of current funding reductions to LHDs. The budget FY 2011
passed by the General Assembly reduces the base funding level for Core services to $37 million,
the lowest level of funding LHDs have received since 1997 from a high of $71 million in FY
2008 to $41 million in FY 2010. This paper examines the history and development of local
health department funding in Maryland and how decreased funding impacts LHDs‟ abilities to
deliver services and affect health outcomes in their communities. The paper also compares
Maryland health services funding to that of other states and to the Maryland funding formula for
education and evaluates the policy implications of altering the current formula.
Key findings include the following:
1) Strong local health department performance is associated with stable and flexible funding
sources.
2) Developing a more active advocacy role for LHDs and related stakeholders could be a
useful strategy for defending funding sources from future cuts.
3) Cost of Living Adjustment Allowance adjustments should be incorporated into the
statutory language as a legislative mandate to assure that funding for LHDs can keep pace
with growth in actual personnel costs.
4) Altering the Core funding formula to return to Case formula principles could provide
greater transparency and a more equitable distribution of funding across jurisdictions.
5) In the long term, developing performance standards for LHDs may strengthen state‟s
ability to identify most effective and efficient programs and policies. In addition, stronger
data on performance and outcomes could bolster the persuasiveness of advocacy groups
seeking continued support for LHD funding.
Local health department funding sources
Local Health Departments (LHDs) in Maryland receive both core funding and categorical grants
through a mix of federal, state, and local dollars. Categorical funds are issued by Congress for
specific purposes and passed through the state to LHDs. These grant-based funds are dedicated
for specific purposes and generally have many restrictions on how they may be spent. Core
funds, by contrast, fund essential services and infrastructure. State/federal categorical grants
account for about 44.8% of total funds, state Core funds account for 12.6%, and local
funds/fees/other Grants account for approximately 42.6%.1 Together, state Core funds and local
sources account for 39% of local health department funding. All of these funding sources have
decreased and are at the lowest levels since before the base funding level was established in
Fiscal Year 1997 at $41 million. Though Core funds provide a lower proportion of funding in
comparison to other state, federal, and local sources such as categorical grant-based funding,
Core funds are crucial to providing essential services. While funds from categorical grants are
generally dedicated to specific services, Health Officers have more flexibility in the use of Core
Funds, which allows them to fund crucial infrastructure that may not be covered by categorical
grants and to adjust their budgets for changing needs. The chart below illustrates the breakdown
of funding by federal, state, and local sources.

4
Core funding
Core funding is directed to the following Core service areas: 1) communicable disease; 2)
environmental health, 3) family planning, 4) maternal and child health, 5) wellness promotion, 6)
adult health and geriatric health, and 7) administration and communication services associated
with the provision of these essential core services of LHDs. Distribution of Core funds to LHDs
is guided by the Core funding formula, which requires that distribution to each jurisdiction be
based on community need. Community need is determined by each county‟s percent share of 1)
state population and 2) the state average of potential lives lost (the difference in years between
individual‟s age at death and 75) for the past 10 years. The formula also provides for annual
adjustments for certain personnel-related adjustments and for local funding effort.2
In addition, Core funds from the state leverage matching and “overmatching” (discretionary)
funds from local governments.3 Matching funds from county governments are leveraged on an
annual basis as a condition of receipt of state core funds. Overmatching occurs when a county
provides extra funds for the local health department through revenues from the local tax base
above and beyond the matching amount required to receive state funds. As a result, every dollar
cut from Core funds has the potential for provoking a reduction of a dollar or more from a local
government; in other words, a dollar cut from Core funding could have a net effect of two dollars
cut from local health department budgets overall.
Adjustments to core funding levels do not affect all LHDs equally, however. Individual
jurisdictions depend on Core funds to different degrees, so when reductions to Core funding
occur, some jurisdictions may be able to cover much of the shortfall through grants or local
funds while others suffer significant job losses and reduced service hours.4 For example,
Baltimore City has been able to maintain staffing and service delivery levels despite cuts to Core
State/Federal categorical
grants44.8%
Core funds12.6%
Local funds/fees/oth
er grants42.6%
LHD Funding Breakdown
Source: Community
Health
Administration response to Joint
Chairmen's request
for information regarding state
funding of local
health departments.Maryland
Department of
Health and Mental
Hygiene.

5
funding through increased reliance on categorical grants and local funds. As local governments
face increasing budgetary pressures due to the current economic climate, however, there is no
guarantee that they will be able to continue to support LHDs as generously as they have in the
past.
A base level of Core funding has been legislatively mandated since 1995. The base funding level
was set to guarantee LHDs would have some state funding that was less vulnerable to cuts in the
annual budget process after a series of drastic cuts to state funding for LHDs during an economic
recession in the early 1990s. The current economic climate has yet again made LHDs
particularly vulnerable to budget cuts. Funding increased between FY 1996 and FY 2008, but
since then, financial support for LHDs has begun to erode once again. In the 2010 legislative
session, the base level state funding for Core services was reduced to its lowest level since 1997.
Setting base funding at $37 million nominally differs by $4 million from the 1997 base year level
of $41 million, but after adjusting for inflation, comparing those 1997 levels to current funding
levels actually results in a real decrease of about $18 million beyond the nominal cuts made
between FY 2008 and FY 2011.5 The FY 2011 budget passed by the General Assembly reduces
the base funding level for Core services to $37 million, down from a high of $71 million in FY
2008. The law sets $37 million as the new funding floor starting in FY 2012 and continuing
indefinitely. The chart below reflects how funding levels for Core services have changed in the
past few years.6
The Core funding formula provides for annual adjustments through a percentage increase based
on a combination of increases in the Consumer Price Index (CPI) and population growth. These
annual adjustments have traditionally been interpreted as a legislative mandate, but a new,
stricter interpretation of the statutory language no longer considers the adjustments mandatory.
As a result, these adjustments have been eliminated for FY 2010-FY 2012. Starting in FY 2013,
the funding will once again be increased according to the annual adjustments set forth in the
statutory formula for inflation and population growth. However, even though yearly formula
$64,928,704
$65,370,984
$66,351,987
$68,160,951
$71,484,526
$61,852,204
$41,776,484 $37,283,484
$0
$10,000,000
$20,000,000
$30,000,000
$40,000,000
$50,000,000
$60,000,000
$70,000,000
$80,000,000
FY 04 FY 05 FY 06 FY 07 FY 08 FY 09 FY 10 FY 11
Bas
e c
ore
fu
nd
ing
leve
l
Core funding levels
Core funding (General state funds and federal funds)
Source: Personal
communication
from Dr. Barbara Brookmyer.

6
increases for CPI and population adjustments resume in FY 2013, restoring staffing and services
to levels experienced prior to FY 2009 may take years.
Though some cuts may be inevitable due to the current economic climate, permanently resetting
the funding floor to a lower level than was set over twenty years ago would be devastating for
LHDs and their ability to provide services. Though this would save some costs for the state, this
prolonged funding reduction will significantly hamper LHDs‟ ability to provide services in their
jurisdictions.
Impact of Core funding cuts on services
Core funding cuts between FY 2009 and FY 2010 have resulted in the loss of 416 full time
equivalents throughout the state between July 1, 2008 and December 1, 2009, which has placed
significant strain on remaining staff and resources. The service areas of administration and
communication as well as maternal and child health were hardest hit, accounting for 29% and
25% of these losses, respectively. Environmental health cuts account for 12%, communicable
disease control cuts account for 10%, and wellness promotion, adult screening, and family
planning each account for 8% of the cuts.7 Departments have had to reduce service hours and
service locations. These delivery hours result in longer waiting times for the public and less
accessibility to services. Examples of specific cuts include reductions in health education
services, tobacco cessation programs, family planning appointments, clinic times, increased case
management loads for nurses, and decreases in translation services. To put this in some
perspective, 11.7 positions lost in Anne Arundel County led to a decrease of 24,324 service
delivery hours or 1013.5 days of service. Reduction in staffing and funding also mean that LHDs
are often unable to meet deadlines or quotas for service delivery such as conducting food service
facility inspections or enrollment in eligibility programs.
Administration and
Communication 122.23
29%
Community Disease, 41.97
10%Environmental Health, 47.9,
12%
Family Planning, 31.54
8%
Adult Screening, 33.13
8%
Wellness, 34.088%
Maternal Child, 105.34
25%
416 LHD Positions Reduced Due to Core Funding Cuts FY2009-FY2010 by Public Health Area
Reproduced from
IDEHA testimony,
February 17, 2010 toSubcommittee on
Health and Human
Resources, House Appropriations
Commitee, Maryland
General Assembly .

7
The cuts reported between FY 2009 and FY 2010 do not include positions left vacant due to
hiring freezes in some jurisdictions after resignations or retirement, etc. Furthermore, the full
impact of cuts to Core funding on LHDs have been masked to some extent by one-time grant
money from the federal government for activities related to H1N1 response. Dr. Brookmyer, the
Health Officer in Frederick County, indicated in her written testimony for the February 25, 2010
budget hearing that her county lost 13 employees between July 2009 and February 2010, but that
Frederick County was able to delay the lay-offs of 6 additional personnel due to the availability
of CDC Public Health Emergency (PHER) funds.8 This implies that the most recent funding
reductions could have even more drastic consequences to staffing levels and service delivery
hours than anticipated.
Cutting base level funding for Core services demonstrates a short-sighted view of the role of
LHDs and their impacts on community health outcomes and cost savings. A 2009 publication by
the Robert Wood Johnson Foundation indicates that evidence-based disease prevention programs
at the community level can result in improved nutrition, physical activity, and preventing
tobacco use. Such improvements are associated with reduced rates of heart disease, kidney
disease, high blood pressure, stroke, and type 2 diabetes. The report suggests that investing $10
per person in these types of programs would yield a national level return on investment of $5.6 to
1 within 5 years.9 Though these figures are projected at the national level, the implications for
state cost savings are significant. Maryland LHDs provide critical chronic disease prevention
services such as health education activities, tobacco cessation programs, cancer screenings, and
blood pressure checks; these programs have already been severely cut or eliminated by budget
cuts. For example, over the course of the past few years, Prince George‟s County has
discontinued adult health prevention disease efforts including blood pressure screenings, diabetes
control efforts, and education efforts related nutrition and physical activity because of cuts to its
Core budget. The conclusions of this report suggest that maintaining funding sources for these
02468
1012141618
# o
f LH
Ds
Public Health Area
Number of LHDs making cuts to Core services, FY 09-FY 10
Number of LHDs making cuts to Core service areas, FY 09-FY 10
Reproduced from IDEHA
testimony, February 17,
2010 to Subcommittee on Health and Human
Resources, House
Appropriations Commitee, Maryland
General Assembly .
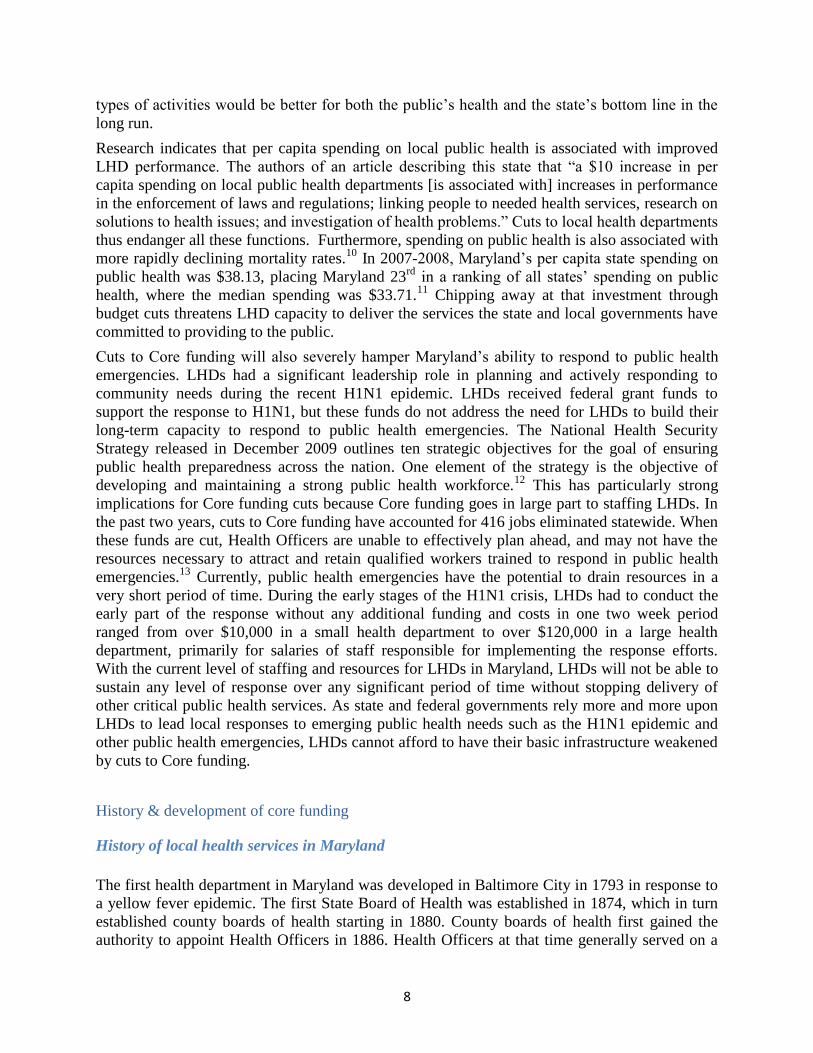
8
types of activities would be better for both the public‟s health and the state‟s bottom line in the
long run.
Research indicates that per capita spending on local public health is associated with improved
LHD performance. The authors of an article describing this state that “a $10 increase in per
capita spending on local public health departments [is associated with] increases in performance
in the enforcement of laws and regulations; linking people to needed health services, research on
solutions to health issues; and investigation of health problems.” Cuts to local health departments
thus endanger all these functions. Furthermore, spending on public health is also associated with
more rapidly declining mortality rates.10
In 2007-2008, Maryland‟s per capita state spending on
public health was $38.13, placing Maryland 23rd
in a ranking of all states‟ spending on public
health, where the median spending was $33.71.11
Chipping away at that investment through
budget cuts threatens LHD capacity to deliver the services the state and local governments have
committed to providing to the public.
Cuts to Core funding will also severely hamper Maryland‟s ability to respond to public health
emergencies. LHDs had a significant leadership role in planning and actively responding to
community needs during the recent H1N1 epidemic. LHDs received federal grant funds to
support the response to H1N1, but these funds do not address the need for LHDs to build their
long-term capacity to respond to public health emergencies. The National Health Security
Strategy released in December 2009 outlines ten strategic objectives for the goal of ensuring
public health preparedness across the nation. One element of the strategy is the objective of
developing and maintaining a strong public health workforce.12
This has particularly strong
implications for Core funding cuts because Core funding goes in large part to staffing LHDs. In
the past two years, cuts to Core funding have accounted for 416 jobs eliminated statewide. When
these funds are cut, Health Officers are unable to effectively plan ahead, and may not have the
resources necessary to attract and retain qualified workers trained to respond in public health
emergencies.13
Currently, public health emergencies have the potential to drain resources in a
very short period of time. During the early stages of the H1N1 crisis, LHDs had to conduct the
early part of the response without any additional funding and costs in one two week period
ranged from over $10,000 in a small health department to over $120,000 in a large health
department, primarily for salaries of staff responsible for implementing the response efforts.
With the current level of staffing and resources for LHDs in Maryland, LHDs will not be able to
sustain any level of response over any significant period of time without stopping delivery of
other critical public health services. As state and federal governments rely more and more upon
LHDs to lead local responses to emerging public health needs such as the H1N1 epidemic and
other public health emergencies, LHDs cannot afford to have their basic infrastructure weakened
by cuts to Core funding.
History & development of core funding
History of local health services in Maryland
The first health department in Maryland was developed in Baltimore City in 1793 in response to
a yellow fever epidemic. The first State Board of Health was established in 1874, which in turn
established county boards of health starting in 1880. County boards of health first gained the
authority to appoint Health Officers in 1886. Health Officers at that time generally served on a
9
part-time basis while maintaining their own medical practices. The first State Board of Health in
Maryland was established in 1874, but the Maryland State Health Department did not come into
existence until 1910.14
Increased interest in public health following World War I led the General
Assembly to give county boards of health the authority to require specific public health training
for Health Officers and to have Health Officers serve on a full time basis. The state then decided
to make an effort to ensure that health departments in every county had full time Health Officers.
The first full time county health department was developed in 1922 in Allegany County, and by
1934, all counties in Maryland had health departments.15
16
To facilitate this transition, however, the state needed local support. The state argued that county
Health Officers created greater efficiency, because the state had full-time Deputy State Health
Officers overlapping service areas with local Health Officers, and if one person filled both
positions, both state and local governments could save money. Combining the positions would
allow the local health officer to simultaneously serve as a Deputy State Health Officer (which
gave him some power to enforce state regulations) and provide health services at the local level.
With this in mind, the state proposed that counties add a small sum to the salary for the local
Health Officers, and the state would also add money for local health officer salaries, and possibly
some funds for additional staff, depending on availability of funds.17
Today, Health Officers still
retain this dual role of serving as a state and local agent, though the term „Deputy State Health
Officer‟ has fallen out of common use. Currently, the term „Deputy Health Officer‟ refers to the
Health Officer‟s second in command within the local health department, and should not be
confused with this historical title that applied to Health Officers themselves. This traditional role
of the Health Officer, now reflected in the overall mission of LHDs in general, represents a more
efficient model of service delivery because the Health Officer is able to deliver services at the
local level and at the same time contribute to a collective goal of improving health for the entire
state. Continuing cuts to state funds for LHDs undermines the benefits that accrue to both state
and local governments as a result of the dual role Health Officers have historically filled.
Case formula
Prior to the 1950s, there was no set formula for determining the relative shares of cost to be
borne by state and local entities, and the state negotiated its share of costs for LHDs with each
county individually. This arrangement provided for the basic needs of LHDs in each locality, but
resulted in significant inequities between counties. As LHDs expanded services and expenditures
grew, the state did not continue its original commitment to share roughly half of the budget of
each county. Larger counties were able to rely on local funds to expand services while smaller
counties depended more on state dollars to finance budget increases for LHDs. As a result,
county health departments were growing at different rates. In addition, county Health Officers
had little discretion in how the funds for their own health departments were spent under this
system.18
The basic idea for a specific funding formula for local health services originated in 1955, when
the state of Maryland realized that the lack of a single state policy for financing local health
services had led to significant inequities in the distribution of state aid to counties. The formula
was developed by the Subcommittee to Review the Financing of Maryland Health Activities,
part of the Maryland State Planning Commission.19

10
The recommendations developed by the committee were based on several key principles. The
committee recognized disparities in state aid to counties were associated with wide variation in
health services across jurisdictions, and sought to develop recommendations that would provide
a more transparent and equitable method of distributing financial responsibility for local health
services. The committee believed matching requirements should be based on a county‟s relative
ability to pay. In addition, the committee aimed to develop a more transparent system of
distribution and to give Health Officers the authority to have greater discretion in the use of
resources available to them.20
The committee recommended that cost sharing between state and local governments for local
health services be based on certain minimum standards derived from fixed ratios of health
department personnel to population. These ratios would be expressed as minimum annual per
capita expenditures which would vary depending on county population. These figures in turn
formed the basis of the Estimated Minimum Budget (EMB) for each county. Once the EMB was
calculated, the counties‟ relative wealth would be used to determine the appropriate state/local
share for each county.
The committee recognized the importance of maintaining a state-local partnership in financing
local health services. It recommended that the state continue to provide approximately 50% of
total health expenditures for all counties put together, with the state share varying from 20% for
counties with the greatest ability to contribute to LHDs to 80% for counties with the least
capacity to raise local funds. This variation was meant to provide for a basic level of services for
each county while accounting for relatively higher per capita costs in smaller counties. The state-
local share was to be determined through the use of a state-wide formula based on the equalized
assessed value of real and personal property subject to local taxation. This measure was thought
to be the best proxy for each county‟s ability to pay for health services. The formula provided
funding for basic infrastructure for each county, but recognized that smaller counties would end
up paying significantly more for health services per capita if the state share of funding were
equal across all counties.21
This formula, which became known as the Case formula, (after Richard Case, the Chair of the
Commission that developed the formula) was adopted in the Code of Maryland Regulations
(COMAR) in FY 1956 and was used for many years as the primary method for determining state
and local shares of financing for local health services, though the state‟s share of funding was
never legislatively mandated.22
The methodology of distributing state funds to LHDs under the
Case formula was outlined in COMAR regulations, but state funds were appropriated through the
annual budget process, rather than being required by statutory law. This process of distribution
remained in effect until the adoption of the Core funding law in 1995. The lack of dedicated
funding made state contributions to LHDs vulnerable to cutbacks in the annual budget process,
particularly during state fiscal crises in times of economic difficulty. The adoption of the Core
funding formula in 1995 included a legislatively mandated base level of funding for LHDs which
would require the Governor‟s Annual Budget for LHDs to be consistent with statute. Over the
years, there have been several attempts to modify the law to provide a clear and comprehensive
legislative mandate for state funding for LHDs, but difficult economic circumstances and lack of
political will have prevented the adoption of a sustainable solution to the challenge of providing

11
adequate and equitable support for LHDs. The table below summarizes the history and
development of funding for LHDs in Maryland:

12
Maryland Funding for Local Health Departments - Timeline
1950 The State Fiscal Research Bureau’s Report on the Maryland State Health Department recommended the
establishment of a Committee to study fiscal relationships of counties with the State Health Department
1953
Sobeloff Commission’s Report on Administrative Organization of the State urged assignment of the State/Local
fiscal issue to the Committee on Medical Care for study and recommendations. The General Assembly set up the
Subcommittee to Review Financing of Maryland Health Activities to be chaired by Richard W. Case.
1955 Report of Subcommittee to Review the Financing of Maryland Health Activities developed and recommended
the adoption of the Case Formula.
1956 Case Formula adopted in Maryland Code of Regulations, but funding not legislatively mandated.
1960
The Kirkman Report on Administering Health Services in Maryland recommended that the community should
be the focal point for coordinated case management; program standards in developing and maintaining quality
preventive and treatment services be established; and the Case Formula should be extended to finance all other
major State health programs. No action was taken on this report which recommended a new single financing formula
for health care.
1970
The Committee on Taxation and Fiscal Matters undertook a study of financing of local health services, prepared
recommendations and legislation, and continued the study in 1971. No action was taken on local health services
funding or various activities to change the Case Formula.
1978
The Financing of Local Health Care Services in Maryland’s 2 year report proposed a detailed „single financing
formula‟ using manpower ratios, incorporation and distribution of funds based on equalized assessed property tax
values and net taxable income and proposed legislation, which failed to pass, primarily due to funding its increased
cost to the State.
1991 State portion of LHD funding cut 50% for second half of FY 1992
1992 In July 1992, state portion of LHD funding cut 25% for FY 1993; in September 1992, remaining state portion of
LHD funding eliminated
1993 HB 1224 passed, provided $34.5 million for LHDs for FY 1994 and mandated funding for FY 1995 & FY 1996.
Local Health Services Funding Review Committee recommended funding formula based on Case formula.
1994 General Assembly passed SB 543, based on Local Health Services Funding Review Committee recommendations;
bill vetoed by Governor Schaefer.
1995 SB 624/HB 314 signed by Governor Glendenning, establishing current law on Core Funding, and specifying $41
million funding for FY 1997, which became the base amount of Core funding for subsequent fiscal years .
1999 HB 1197 introduced. Local Health Services Funding - COLA: Would have added COLA adjustments to Core
funding formula as legislative mandate. Bill did not come out of committee.
2000
HB 1159 & SB 755 introduced. Local Health Services Funding: Would have added language for COLAs, general
salary increases, and special salary adjustments as factors in the Core funding formula. Neither bill came out of
committee.
2001
DHMH developed legislative proposal which would have changed base year from FY 1997 to FY 2001. Included
COLA, general salary increases, special salary adjustments, cash bonuses, and non-salary related adjustments as
factors in Core funding formula. Was not approved for departmental legislation.
2007
Joint Chairmen's Report requested information from DHMH re: funding for state employees in local health
departments. Community Health Administration (CHA) of DHMH and MACHO recommended amending statute to
base portion of annual change in state share of Core funds on the percentage change in state salaries and fringe
benefits and to require COLAs and other compensation-related adjustments to be equitably distributed to all LHDs.
2008 FY 2009 budget cut Core funding from $71 million to $61 million.
2009 FY 2010 budget cut Core funding from $61 million to $41 million.
2010 SB 141 passed, reset base funding to $37 million, does not fund annual Consumer Price Index and population
growth adjustments for FY 2011-2012
2013 Base level funding of $37 million continues, annual adjustments for Consumer Price Index and population growth
resume.

13
Development of current law
Increasing pressures on the state budget during the recession in the early 1990‟s led to significant
reductions of state funding for local health services. Because the Case formula had never been
codified to require the state to fund LHDs, this money was an easy target for budget reductions.
Between 1991 and 1992, the state portion of local health department funding was reduced first
by 10%, then 50%, and finally was eliminated entirely in September of 1992.
This chart from the 1993 Report of the Local Health Services Funding Review Committee
reflects the drastic impact to LHD funds that resulted from this series of cuts.23
In response to
this devastating blow to local health services, local Health Officers rallied together to advocate
for continued state funding for essential local health services, and formed a “Coalition for Local
Public Health.”24
The coalition reaffirmed that while state and local entities have separate but complementary roles
in the provision of local health services, they have a shared responsibility for the development of
14
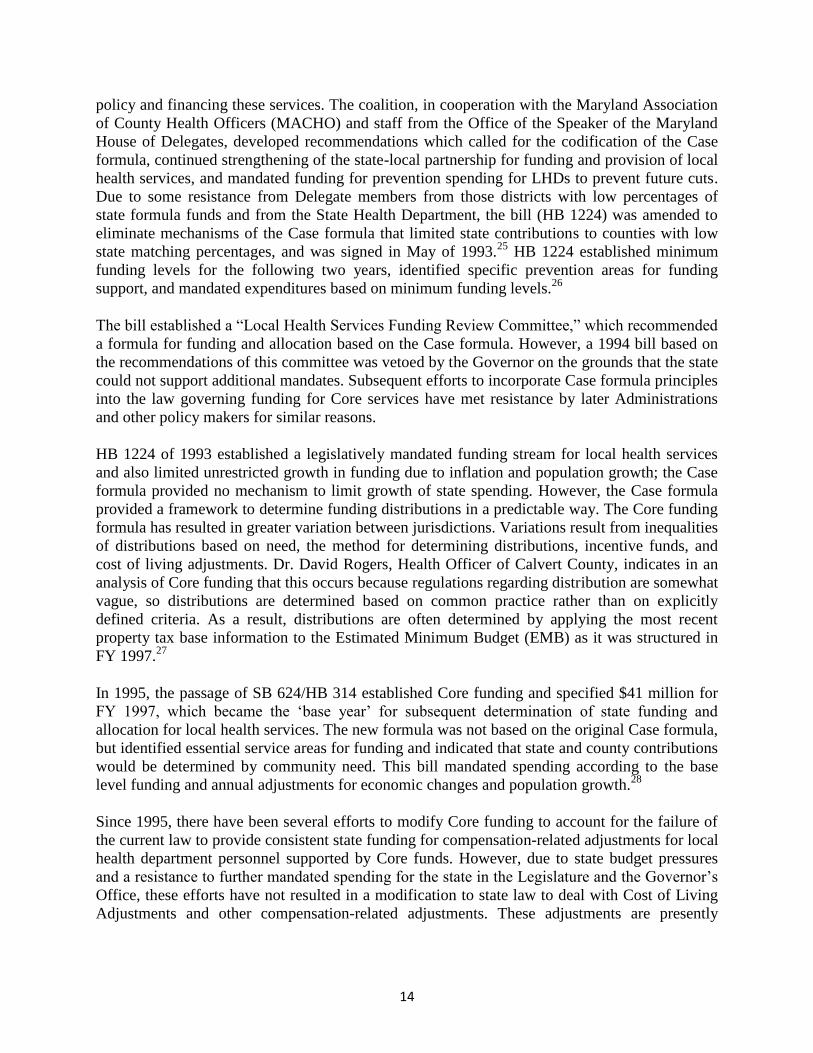
policy and financing these services. The coalition, in cooperation with the Maryland Association
of County Health Officers (MACHO) and staff from the Office of the Speaker of the Maryland
House of Delegates, developed recommendations which called for the codification of the Case
formula, continued strengthening of the state-local partnership for funding and provision of local
health services, and mandated funding for prevention spending for LHDs to prevent future cuts.
Due to some resistance from Delegate members from those districts with low percentages of
state formula funds and from the State Health Department, the bill (HB 1224) was amended to
eliminate mechanisms of the Case formula that limited state contributions to counties with low
state matching percentages, and was signed in May of 1993.25
HB 1224 established minimum
funding levels for the following two years, identified specific prevention areas for funding
support, and mandated expenditures based on minimum funding levels.26
The bill established a “Local Health Services Funding Review Committee,” which recommended
a formula for funding and allocation based on the Case formula. However, a 1994 bill based on
the recommendations of this committee was vetoed by the Governor on the grounds that the state
could not support additional mandates. Subsequent efforts to incorporate Case formula principles
into the law governing funding for Core services have met resistance by later Administrations
and other policy makers for similar reasons.
HB 1224 of 1993 established a legislatively mandated funding stream for local health services
and also limited unrestricted growth in funding due to inflation and population growth; the Case
formula provided no mechanism to limit growth of state spending. However, the Case formula
provided a framework to determine funding distributions in a predictable way. The Core funding
formula has resulted in greater variation between jurisdictions. Variations result from inequalities
of distributions based on need, the method for determining distributions, incentive funds, and
cost of living adjustments. Dr. David Rogers, Health Officer of Calvert County, indicates in an
analysis of Core funding that this occurs because regulations regarding distribution are somewhat
vague, so distributions are determined based on common practice rather than on explicitly
defined criteria. As a result, distributions are often determined by applying the most recent
property tax base information to the Estimated Minimum Budget (EMB) as it was structured in
FY 1997.27
In 1995, the passage of SB 624/HB 314 established Core funding and specified $41 million for
FY 1997, which became the „base year‟ for subsequent determination of state funding and
allocation for local health services. The new formula was not based on the original Case formula,
but identified essential service areas for funding and indicated that state and county contributions
would be determined by community need. This bill mandated spending according to the base
level funding and annual adjustments for economic changes and population growth.28
Since 1995, there have been several efforts to modify Core funding to account for the failure of
the current law to provide consistent state funding for compensation-related adjustments for local
health department personnel supported by Core funds. However, due to state budget pressures
and a resistance to further mandated spending for the state in the Legislature and the Governor‟s
Office, these efforts have not resulted in a modification to state law to deal with Cost of Living
Adjustments and other compensation-related adjustments. These adjustments are presently

15
determined on a year to year basis through negotiations with the State Department of Budget and
Management.29
A side by side comparison of the Case formula and the Core funding formula is presented below:
Comparison of Case Formula To Core Funding Formula
Case Formula30
Core Funding31
,32
Based on principle that personnel needs drive
funding needs.
State provided 50% of funding for counties
overall, all counties together provided 50%,
but state share for specific counties depended
on county wealth.
Funding varied from 80% state/20% local to
20% state/80% local, depending on property
tax base of locality.
Formula based on counties‟ ability to pay,
measured by equalized assessed value of real
personal property subject to local taxation.
Responds to annual inputs reflecting
economic and population changes in
jurisdictions.
Established base level state funding at FY
1997 level of $41 million.
Distribution based on community need,
determined by each county‟s percent share of
1) state population and 2) state average of
potential lives lost (the difference in years
between individual‟s age at death and 75) for
the past 10 years.
Local match may not exceed amount required
in FY 1996.
Requires 2/3 of funding increases beyond
baseline to result from inflation and
population growth, with distribution of
remain/ing 1/3 (incentive funds) to be based
on “local effort,” defined as all local
government spending for core health services
for most recent fiscal year, capped at half of
total expenditures by both state and local
sources for core services for most recent
fiscal year.
Strengths:
Recognized need to adjust for fact that
smaller counties would pay a larger per
capita amount to provide basic infrastructure
if state share were equal for all counties.
Funding levels based on predictable and
consistent formula.
Strengths:
Legislatively mandates minimum state
contribution to LHDs.
Challenges:
State funding not legislatively guaranteed.
Funding growth unrestricted.
Challenges:
Has resulted in greater variations between
jurisdictions.
Does not respond to salary adjustments
automatically.
Does not adequately address rising costs due
to annual increases in personnel costs.
Generally speaking, the Case formula provided a more transparent mechanism for distribution
that produced less variation in funding levels and local health services than does the current law.
In the broader sense, maintaining a stable source of funding for local health services is more
important than the particular means used to ensure consistent funds, but the Case formula may
ultimately be a more equitable and transparent method of distributions to LHDs than the Core
formula. In the long-term, health departments valuing these qualities may benefit from
16
advocating for a return to Case principles in Maryland‟s funding formula for local health
services.
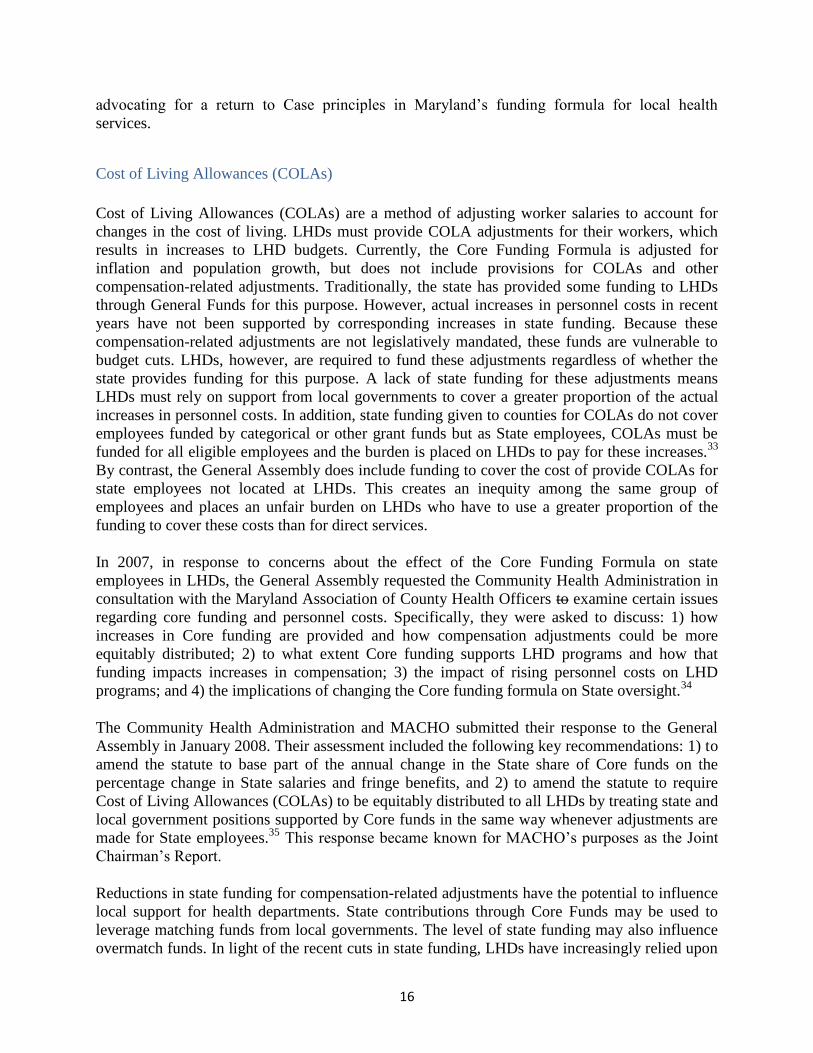
Cost of Living Allowances (COLAs)
Cost of Living Allowances (COLAs) are a method of adjusting worker salaries to account for
changes in the cost of living. LHDs must provide COLA adjustments for their workers, which
results in increases to LHD budgets. Currently, the Core Funding Formula is adjusted for
inflation and population growth, but does not include provisions for COLAs and other
compensation-related adjustments. Traditionally, the state has provided some funding to LHDs
through General Funds for this purpose. However, actual increases in personnel costs in recent
years have not been supported by corresponding increases in state funding. Because these
compensation-related adjustments are not legislatively mandated, these funds are vulnerable to
budget cuts. LHDs, however, are required to fund these adjustments regardless of whether the
state provides funding for this purpose. A lack of state funding for these adjustments means
LHDs must rely on support from local governments to cover a greater proportion of the actual
increases in personnel costs. In addition, state funding given to counties for COLAs do not cover
employees funded by categorical or other grant funds but as State employees, COLAs must be
funded for all eligible employees and the burden is placed on LHDs to pay for these increases.33
By contrast, the General Assembly does include funding to cover the cost of provide COLAs for
state employees not located at LHDs. This creates an inequity among the same group of
employees and places an unfair burden on LHDs who have to use a greater proportion of the
funding to cover these costs than for direct services.
In 2007, in response to concerns about the effect of the Core Funding Formula on state
employees in LHDs, the General Assembly requested the Community Health Administration in
consultation with the Maryland Association of County Health Officers to examine certain issues
regarding core funding and personnel costs. Specifically, they were asked to discuss: 1) how
increases in Core funding are provided and how compensation adjustments could be more
equitably distributed; 2) to what extent Core funding supports LHD programs and how that
funding impacts increases in compensation; 3) the impact of rising personnel costs on LHD
programs; and 4) the implications of changing the Core funding formula on State oversight.34
The Community Health Administration and MACHO submitted their response to the General
Assembly in January 2008. Their assessment included the following key recommendations: 1) to
amend the statute to base part of the annual change in the State share of Core funds on the
percentage change in State salaries and fringe benefits, and 2) to amend the statute to require
Cost of Living Allowances (COLAs) to be equitably distributed to all LHDs by treating state and
local government positions supported by Core funds in the same way whenever adjustments are
made for State employees.35
This response became known for MACHO‟s purposes as the Joint
Chairman‟s Report.
Reductions in state funding for compensation-related adjustments have the potential to influence
local support for health departments. State contributions through Core Funds may be used to
leverage matching funds from local governments. The level of state funding may also influence
overmatch funds. In light of the recent cuts in state funding, LHDs have increasingly relied upon

17
these discretionary overmatch funds to cover necessary compensation adjustments. In addition,
approximately 75-80% of local health department budgets go to personnel costs, with the
remaining 20-25% allocated to general operating costs.36
Consequently, if LHDs fail to identify
funding sources that allow them to keep pace with required compensation-related adjustments,
the departments will be forced to lay off workers and accordingly reduce service delivery hours
to the public as a result.
Comparison to other states
Maryland‟s approach to funding local health services may be better understood in the context of
how other states provide these services. The 2008 NACCHO Profile of LHDs outlined the
percent share of local, state, federal, and other sources that contribute to the budgets of LHDs
across the country. Currently there are approximately 2,800 LHDs in the U.S. The survey
indicated some data came from states with low response rates, and did not include information
for non-participating states or states with no or inadequate data. Local contributions ranged from
a minimum of 2% to a maximum of 61%, with 22% for Maryland, where the median for the 34
states reporting is 19.5%. State direct contributions ranged from 5% to 55%, with 41% for
Maryland, where the median is 21%. Federal pass-through contributions ranged from 5% to
59%, with 18% for Maryland, and the median is 19%. Federal direct contributions ranged from
0% to 13%, with 4% for Maryland, and the median is 2%. Medicare/Medicaid contributions
accounted for 0% to 60% of local health department revenues, with 8% for Maryland and the
median is 11%. Other sources ranged from 0% to 35%, with 10% for Maryland, and the median
is 16.5%.37
These figures demonstrate the significant differences in the proportions of state,
federal, local, and other funding sources that characterize LHDs in different states.
Currently, many LHDs nationwide face serious budget cuts as a result of the economic recession.
A September 2009 NACCHO survey of LHDs in different states assessed how recent budgets
reflect current economic pressures. Eight jurisdictions randomly selected by NACCHO
responded to the survey in Maryland; these jurisdictions experienced an overall decrease in their
budgets of 88% in 2009 and anticipated a continued reduction of 88% in 2010 as well. LHDs in
the rest of the country, by contrast, experienced an average of 45% budget reductions overall in
2009, with a 50% reduction anticipated in 2010.38
These cuts reflect total budget cuts rather than
core funding alone, but are indicative of the overall financial difficulties that LHDs are currently
experiencing. The economic recession has unfortunately resulted in budget cuts in many LHDs
in states across the country, but Maryland has suffered percentages in cuts well beyond the
average.
States have very different legal and administrative organizations of their public health systems,
and approaches to funding these systems vary widely. In thirteen states and the District of
Columbia, states provide local health services directly and accordingly fund these services
mainly with state and federal dollars. In nineteen states, independent LHDs provide these
services, though they may still receive state funding. In Missouri, for example, local
governments have been granted the authority to enact a property tax to provide revenue for
public health, but receive some state funds. The remaining eighteen states have hybrid systems
with mixed administration and authority for state and local agencies for public health. 39
,40

18
Maryland LHDs, with their Health Officers acting both as state and local agents, fall into the
latter category.
A 2007 article outlines the basic structure and organization of public health systems in several
states which may be a useful to compare to Maryland‟s system. The article indicates that states
provide local health services funding through a variety of mechanisms, including but not limited
to combining general per capita funding with specific grants, formulas incorporating various
variables such as health status and the ability of local populations to finance services, and
reimbursement for specific services. The authors comment that local jurisdictions may lack
adequate resources to meet needs without state funds for discretionary programs.41
Maryland‟s
system reflects the Legislature‟s wish to supply a basic level of per capita funding to LHDs, as
well as to account for local jurisdictions‟ ability to pay. The article demonstrates that some states
have included similar elements in their funding formulas, while others have adopted very
different mechanisms to fund LHDs.
Missouri‟s state funds are based on population levels, historical base funding, core activities
funding, local resources, poverty levels, collaboration with other providers, and tax revenue.
Florida has a funding floor for state contributions to public health, as does Maryland, but the
structure of the funding floor for Florida is different than that of Maryland. While Maryland
provides a set amount as base funding for all Core services, Florida separates funding streams for
non-categorical revenue, for primary care, and an additional amount for each of its 67 county
health departments. In addition, LHDs receive some funding from counties, grants, and federal
pass through dollars. New York counties finance their own LHDs, but the state partially
reimburses local governments for this cost. The state provides a minimum contribution for each
county, and then partially reimburses the counties on a per capita basis. The state also reimburses
36% of additional costs and 36% of optional services.42
These examples demonstrate just some
of the different ways states approach the financing and provision of local health services. It is
difficult to draw conclusions about which types of funding formulas may be the most efficient
and effective without standardized performance and outcome data that can be compared across
jurisdictions, but the variation in funding structures underscores the importance of those themes
that do consistently emerge across states with dissimilar funding formulas and administrative
organization. The suggestion that local jurisdictions may lack adequate resources to meet needs
without state funds for discretionary programs again highlights the critical role Core funding in
Maryland plays in ensuring that LHDs have the flexibility necessary to meet their infrastructure
needs.
A 2005 analysis of Washington State‟s public health system financing provides a similar lesson
about the importance of providing stable and flexible funding sources for public health services.
Prior to its repeal in 1976, a provision of Washington state law provided specified funding for
local health services through a portion of local property taxes dedicated to health. In 1996, part
of a motor vehicle excise tax was dedicated to public health, but that too was repealed in 2000.
Currently, state funding for local health services is appropriated from the General Fund every
two years by the Legislature, but there is no dedicated source of funding. The lack of a clear and
consistent funding mechanism has resulted in wide variations in spending between jurisdictions
and a lag between population growth and state spending levels. The authors of this analysis note
that fluctuations in funding pose a challenge to LHDs in meeting service needs and sustaining a

19
properly trained workforce.43
Cuts to Core funding weaken LHDs capacity to meet these goals. If
the state wishes to preserve a consistent level of services and maintain a strong public health
workforce, Maryland should prioritize the protection of stable funding for LHDs instead of
treating local health services as an easy target for budget cuts in times of financial crisis.
Comparison to Maryland Education Formula
Comparing Maryland to other states provides a good framework for thinking about different
ways to finance local health services, but comparing funding for public health in Maryland to
education in Maryland may lend another perspective to circumstances specific to Maryland.
Education is an obvious example of another key service that is funded through a mix of federal,
state, and local dollars and delivered at the local level, and the Maryland education formula is
touted as a strong example for other states.
The Maryland education formula is what is known as a foundation formula, and Maryland is one
of 37 states using a variation of this basic type of formula. This type of formula determines
funding based on the basic amount of funding needed to educate a student in an average wealth
district to state standards. This basic foundation amount is then adjusted to account for the local
jurisdiction‟s ability to pay. The resulting amount is then multiplied by the district‟s weighted
student count and adjusted for further financial considerations such as regional cost or district
size. Categorical funding, funding for capital outlay, food services, and transportation is then
added to that.44
The current Maryland education formula was established in 2001 as a result of recommendations
by the Thornton Commission that were passed as the Bridge to Excellence Act of 2002. The
Thornton commission recommendations include adjustments for at-risk students, kids with
disabilities, and regional cost. The underlying goal of this commission was to not merely develop
a formula to support local governments based on the amount they had been contributing
previously, but rather to ensure that per pupil spending is sufficient to bring each child in
Maryland up to state standards by accounting for disparities that currently exist. Bridge to
Excellence uses student performance data as a measure of its progress in closing proficiency
gaps and assuring the equalization of funding and services across jurisdictions. Given that
disparities persist in Maryland‟s public health system as well as its education system, the
education formula‟s underlying goal of providing equitable access to these services may inform
future efforts to ensure public health services to all Maryland‟s citizens in an equitable way.
However, there have been some concerns that Maryland cannot afford to maintain an education
formula this ambitious in scope, so any effort to adopt similar principles within the Maryland
Core funding formula should be attendant upon responsible fiscal management and planning.45
Conclusions
LHDs play a crucial role in the delivery of health services and Core funding is a critical source of
funding for delivering these critical core services in the communities they serve. Funding for
Core services gives Health Officers the means to strengthen and maintain the infrastructures of
their respective health departments. These funds also provide Health Officers some flexibility in

20
their use, allowing them to adapt their budgets to changing needs. Proposed cuts to the base level
Core funding threaten key prevention activities as well as LHDs‟ ability to respond to public
health emergencies. Making these cuts permanent and rebasing Core funding at FY 1997 levels
weakens the capacity of the LHDs who are responsible for delivering essential health services to
respond to community health needs. In the short term, defending base level funding for Core
services is the most crucial policy objective in order to ensure that LHDs can continue to provide
essential services.
A Robert Wood Johnson report released in December 2009 highlighted the need for sustainable
funding for local health departments through health care reform.46
There has been a perception
that provisions in the recent national health care reform law may solve many of the challenges in
financing services in LHDs. However, the health reform law does not, as the report recommends,
provide any source of sustainable dedicated funding to local health departments, but rather
makes LHDs eligible to apply for certain grants. Specifically, the CDC will provide grants for
the following purposes: 1) pilot programs for community interventions targeted at people
between 55-64 years of age; 2) strengthening public health surveillance systems through the
Epidemiology and Laboratory Capacity Grant Program; 3) fellowship training for specific public
health professions; and 4) community-based diabetes prevention program model sites as part of a
national diabetes prevention program.47
LHDs may apply for these grants under the new law, but
this funding is not guaranteed to all LHDs; they must compete for these grants with states and
Indian tribes in addition to other LHDs across the nation. The grants are also targeted to specific
purposes, and do not address the need for flexible and sustainable funding for the core
infrastructure of LHDs.
In considering future changes to the Core funding formula, Maryland can look to its own history
as well as to current formulas in other states and to funding for education within Maryland to
find different approaches to funding local health services. Revising the Core formula to reflect
Case formula principles would help mitigate disparities in distributions between jurisdictions and
would provide a more transparent and predictable way of determining distributions for LHDs. In
addition, modifying the current formula to provide secure funding for cost of living adjustments
(COLAs) should be viewed as a means to prevent LHDs from being forced to lay off workers
and losing service delivery hours. In the broader context, Maryland may consider whether certain
elements of formulas in other states and other fields could be adapted for use in its public health
system. A stronger advocacy role for public health stakeholders should also be a priority for An
active, organized coalition of advocates has been successful at defending K-12 funding from the
drastic level of cuts faced by LHDs. LHDs have a limited presence in advocacy roles, but taking
a more proactive approach to building community support for local health services could be a
key strategy in defending LHD funding. To do this, local health departments need to develop
clear, consistent messages about the nature of LHD services and the importance of maintaining
funding to protect public health. Establishing a strong, vocal base of support could be an
important step in continuing efforts to defend resources for public health services.
Another lesson learned from the Maryland K-12 education formula is the linking of the funding
formula to performance data. Currently, LHDs do not routinely collect performance and outcome
data that may be easily compared across jurisdictions. Though challenging both financially and
administratively, in the long term, developing performance standards for LHDs could provide a
means to more clearly determine which programs or policies are most effective at ensuring

21
positive public health outcomes. In addition, reliable indicators to measure LHD performance
could be a valuable tool in advocating for stronger levels of financial support for Core services.
Securing adequate levels of stable and flexible funding for Core services is critical to honoring
Maryland‟s commitment to providing equitable services and developing and maintaining a
skilled public health workforce prepared to help the state face emerging public health challenges.
Stronger advocacy in the short term and altering the Core formula to be more transparent and
equitable across jurisdictions in the long term are important steps in protecting adequate funding
levels and assuring that the way in which resources are used reflect the state of Maryland‟s
values of shared state and local responsibility for providing equitable health services at the local
level.
1 Community Health Administration, Maryland Department of Health and Mental Hygiene. (2007). Community
Health Administration response to Joint Chairmen's request for information regarding state funding of local health
departments. Baltimore, MD: Maryland Department of Health and Mental Hygiene.
2 Maryland State Codes. (n.d.). Health- General Article, Sections 2-104, 2-105, 2-301--2-305.
3 Maryland State Codes. (n.d.). Health- General Article, Sections 2-104, 2-105, 2-301--2-305.
4 Rogers, D. L. (2002). Core Funding: The Need for Change.
5 U.S. Department of Labor, Bureau of Labor Statistics. (2010). Databases, Tables & Calculators by Subject:
Inflation and Prices. Retrieved 5 1, 2010, from U.S. Department of Labor: http://www.bls.gov/data/#prices
6 Brookmyer, B. (2010, April 2). Personal Communication.
7 Infectious Disease and Environmental Health Administration, Maryland Department of Health and Mental
Hygiene. (2010, February 17). Testimony by Infectious Disease and Environmental Health Administration
(IDEHA). Subcommittee on Health and Human Resources, House Appropriations Commitee, Maryland General
Assembly . Annapolis, MD.
8 Brookmyer, B. (2010, February 25). Testimony on behalf of Maryland Association of County Health Officers.
IDEHA Budget Hearing in the Senate Budget & Taxation Subcommittee on Health, Education, and Human
Resources . Annapolis, MD.
9 Trust for America's Health. (2009, February). Prevention for a Healthier America. Retrieved March 18, 2010, from
Trust for America's Health: http://healthyamericans.org/reports/prevention08/Prevention08.pdf
10 Meyer, J. a. (2009, December). County and City Health Departments: The Need for Sustainable Funding and the
Potential Effect of Health Care Reform on their Operations. Retrieved April 30, 2010, from Trust for America's
Health: http://healthyamericans.org/assets/files/HMA.pdf
11 Trust for America's Health. (2008, April). Shortchanging America's Health:. Retrieved April 10, 2010, from Trust
for America's Health: http://healthyamericans.org/reports/shortchanging08/Shortchanging08.pdf
12 U.S. Department of Health and Human Services. (2009). National Health Security Strategy of the United States of
America. Washington, DC: U.S. Department of Health and Human Services.
13 PHIP Finance Committee, Berk & Associates. (2005, July). Financing Local Public Health in Washington State:
Challenges and Choices. Retrieved April 3, 2010, from Washington State Department of Health:

22
http://www.doh.wa.gov/phip/documents/finance/reports/public_health_finance_study.pdf
14
Maryland Department of Health and Mental Hygiene. (2010). Department of Health and Mental Hygiene - Origin.
Retrieved April 3, 2010, from Maryland Department of Health and Mental Hygiene:
http://www.msa.md.gov/msa/mdmanual/16dhmh/html/dhmhf.html
15 Maryland State Planning Commission Committee on Medical Care. (1955, February). Report of the
Subcommittee to Review the Financing of Maryland Health Activities.
16 Maryland Department of Health and Mental Hygiene. (2010). Department of Health and Mental Hygiene - Origin.
Retrieved April 3, 2010, from Maryland Department of Health and Mental Hygiene:
http://www.msa.md.gov/msa/mdmanual/16dhmh/html/dhmhf.html
17 Maryland State Planning Commission Committee on Medical Care. (1955, February). Report of the
Subcommittee to Review the Financing of Maryland Health Activities.
18 Maryland State Planning Commission Committee on Medical Care. (1955, February). Report of the
Subcommittee to Review the Financing of Maryland Health Activities.
19 Maryland State Planning Commission Committee on Medical Care. (1955, February). Report of the
Subcommittee to Review the Financing of Maryland Health Activities.
20 Maryland State Planning Commission Committee on Medical Care. (1955, February). Report of the
Subcommittee to Review the Financing of Maryland Health Activities.
21
Maryland State Planning Commission Committee on Medical Care. (1955, February). Report of the
Subcommittee to Review the Financing of Maryland Health Activities.
22 Wasserman, M. P. (1993). Leadership - Working Together to Generate Critical Public Health Legislation.
Cheverly, MD.
23
Local Health Services Funding Review Committee. (1993). Report to the Governor and the General Assembly,
State of Maryland. Annapolis, MD.
24 Wasserman, M. P. (1993). Leadership - Working Together to Generate Critical Public Health Legislation.
Cheverly, MD.
25 Wasserman, M. P. (1993). Leadership - Working Together to Generate Critical Public Health Legislation.
Cheverly, MD.
26 House Bill 1224. (1993). Maryland General Assembly .
27 Rogers, D. L. (2002). Core Funding: The Need for Change.
28 Bailey, G. (2005, July 21). Legislative History of Local Health Funding Initiatives. Maryland, United States.
29 Bailey, G. (2005, July 21). Legislative History of Local Health Funding Initiatives. Maryland, United States.
30 Maryland State Planning Commission Committee on Medical Care. (1955, February). Report of the
Subcommittee to Review the Financing of Maryland Health Activities.

23
31
Department of Health and Mental Hygiene. (n.d.). Funding for Core Local Health Services. Title 10, Subtitle 4,
Chapter 1, Sections 1-6. Maryland Code of Regulations.
32 Maryland State Codes. (n.d.). Health- General Article, Sections 2-104, 2-105, 2-301--2-305.
33 Community Health Administration, Maryland Department of Health and Mental Hygiene. (2007). Community
Health Administration response to Joint Chairmen's request for information regarding state funding of local health
departments. Baltimore, MD: Maryland Department of Health and Mental Hygiene.
34 Chairmen of the Senate Budget and Taxation Committee and House Committee on Appropriations. (2007). Report
on the State Operating Budget (HB 50) and the State Capital Budget (HB 51) and Related Recommendations.
Annapolis, Maryland: Office of Policy Analysis, Department of Legislative Services.
35 Community Health Administration, Maryland Department of Health and Mental Hygiene. (2007). Community
Health Administration response to Joint Chairmen's request for information regarding state funding of local health
departments. Baltimore, MD: Maryland Department of Health and Mental Hygiene.
36 Community Health Administration, Maryland Department of Health and Mental Hygiene. (2007). Community
Health Administration response to Joint Chairmen's request for information regarding state funding of local health
departments. Baltimore, MD: Maryland Department of Health and Mental Hygiene.
37 National Association of County and City Health Officials (NACCHO). (2008). National Profile of Local Public
Health Departments. Washington, DC.
38 National Association of County and City Health Officials (NACCHO). (2009, September). Survey of Local Health
Departments Job Losses and Program Cuts. Retrieved April 1, 2010, from National Association of County and City
Health Officials (NACCHO): http://www.naccho.org/advocacy/lhdbudget.cfm
39 Potter, M. A. (2007). State Funding for Local Public Health: Observations From Six Case Studies. Journal of
Public Health Management Practice , 13(2), 163-168.
40 Association of State and Territorial Health Officials (ASTHO). (2009). Profile of State Public Health, Volume
One. Retrieved April 3, 2010, from Association of State and Territorial Health Officials (ASTHO):
http://www.astho.org/Research/Major-Publications/Profile-of-State-Public-Health-Vol-1/
41
Potter, M. A. (2007). State Funding for Local Public Health: Observations From Six Case Studies. Journal of
Public Health Management Practice , 13(2), 163-168.
42 Potter, M. A. (2007). State Funding for Local Public Health: Observations From Six Case Studies. Journal of
Public Health Management Practice , 13(2), 163-168.
43 PHIP Finance Committee, Berk & Associates. (2005, July). Financing Local Public Health in Washington State:
Challenges and Choices. Retrieved April 3, 2010, from Washington State Department of Health:
http://www.doh.wa.gov/phip/documents/finance/reports/public_health_finance_study.pdf
44 Maryland Budget and Tax Policy Institute. (2004, September). Back to the Basics on Thornton: Why It Was
Needed and What It Does. Retrieved March 29, 2010, from Maryland Budget and Tax Policy Institute:
http://www.marylandpolicy.org/html/research/documents/mpr5-1thornton.pdf
24
45
Maryland Budget and Tax Policy Institute. (2004, September). Back to the Basics on Thornton: Why It Was
Needed and What It Does. Retrieved March 29, 2010, from Maryland Budget and Tax Policy Institute:
http://www.marylandpolicy.org/html/research/documents/mpr5-1thornton.pdf
46 Meyer, J. a. (2009, December). County and City Health Departments: The Need for Sustainable Funding and the
Potential Effect of Health Care Reform on their Operations. Retrieved April 12, 2010, from Robert Wood Johnson
Foundation: http://www.rwjf.org/files/research/52569hmareport.pdf
47 United States Congress. (2010). The Patient Protection and Affordable Care Act of 2010, Public Law 111-148.