Cordis · PDF fileCordis Briefing April 2015 ... Cordis Viewfinder •Been running in its...
22
Cordis Briefing April 2015 Follow live #cordisbright These are extracts from April 2015’s Cordis Briefing. Full versions of the slides are available for subscribers by emailing [email protected]. Please contact Lucy if you would like to receive further information about subscribing.
Transcript of Cordis · PDF fileCordis Briefing April 2015 ... Cordis Viewfinder •Been running in its...

Cordis Briefing
April 2015
Follow live #cordisbright
These are extracts from April 2015’s Cordis Briefing. Full versions of the slides are available for subscribers by
emailing [email protected]. Please contact Lucy if you would like to receive further information about
subscribing.

Today’s Briefing
• Introduction and Election Update
• Health and Social Care: How should we vote?
• Cordis Viewfinder: Part One
• Profiling the Not-for profit sector
BREAK
• Profiling the Registered Care Provider Market
• Cordis Viewfinder: Part Two
• Devolution and Integration
• Cordis Viewfinder: Part Three

Cordis Viewfinder 2015

Cordis Viewfinder
• Been running in its current form since 2008
• Aimed at senior leaders in the sector
• We ask around 120 people to complete it and we get 60%
response rate
• Includes providers working with all client groups, all service types
• Provides a high level view of the sector and its trends
• Not going to try and cover everything – been selective but tried to
make sure it’s a fair picture

Cordis Viewfinder
• This year there have been some noticeable shifts in thinking
• Suspect it is a reflection of coming to terms with a changed and
still changing social care and support environment
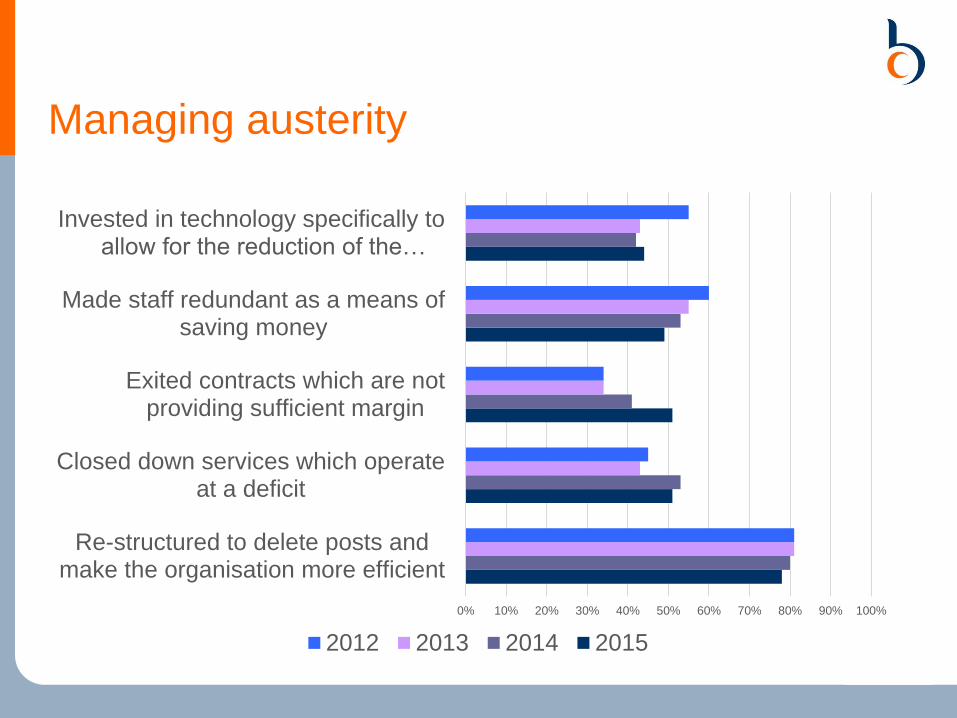
Managing austerity
0% 10% 20% 30% 40% 50% 60% 70% 80% 90% 100%
Re-structured to delete posts andmake the organisation more efficient
Closed down services which operateat a deficit
Exited contracts which are notproviding sufficient margin
Made staff redundant as a means ofsaving money
Invested in technology specifically toallow for the reduction of the…
2012 2013 2014 2015
Managing austerity

Managing austerity
0% 10% 20% 30% 40% 50% 60% 70% 80% 90% 100%
Reduced the value of the terms andconditions of existing staff
Reduced the level of service providedwhilst maintaining the same price
Made a deficit equivalent to at least 5%of income
Reduced the salaries of existing staff
Introduced zero hour contracts for ahigher proportion of the workforce
Spent at least 10% of reserves tosupport under-funded services
2012 2013 2014 2015

Managing austerity
• The growth in planned deficits has to be a worry unless the result
is a marked turnaround
• We currently can not see this pattern in a high level view of the
market.

Profiling the Registered Care Provider
Market
Providers, Brands and Scale

Introduction
• This data is drawn for some analysis we have been undertaking on the
CQC Registered Provider market in England, to support the
development of Care Act guidance on Provider Failure for the DH
• Here, we use CQC data to look in a bit more detail about what the
provider market looks like across England, looking in particular at:
– The scale of providers
– Provider Brands
– Number of providers per Authority
• The data highlight the complexity of the English provider market, with
considerable variation in both the scale and number of providers
across the country
• We consider how far LAs can shape their local markets and what the
implications of the Care Act might be
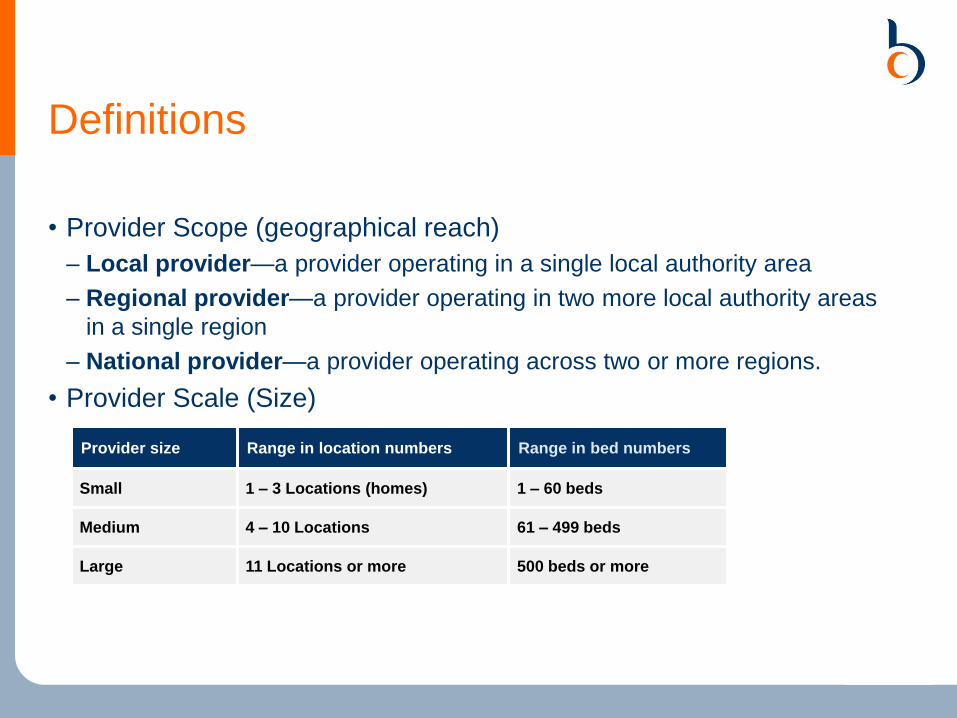
Definitions
• Provider Scope (geographical reach)
– Local provider—a provider operating in a single local authority area
– Regional provider—a provider operating in two more local authority areas
in a single region
– National provider—a provider operating across two or more regions.
• Provider Scale (Size)
Provider size Range in location numbers Range in bed numbers
Small 1 – 3 Locations (homes) 1 – 60 beds
Medium 4 – 10 Locations 61 – 499 beds
Large 11 Locations or more 500 beds or more

Provider Scope
• Provider scope reflects the operating area of providers.
• Most providers are local, and only operate in the local authority they
are based in:
10,678
603 598
0
5,000
10,000
15,000
Local Regional National
Providers by Type

Provider Size
• Most providers are small, with just one location / home:
9409
1952
269 128 46 740
2500
5000
7500
10000
1 2-5 6-10 11-20 21-30 31+
Providers by Number of Locations

Res Care Market – Large Providers

Dom Care Market – Large Providers

Number of Providers - Residential

Number of Providers - Domiciliary

Beds per Residential Provider

Conclusions
• The provider market is complex and is dominated by small providers
• Many providers do not provide commissioned services, so local
authorities do not have intelligence about them
• The Care Act and the implementation of the Care Cap in 2016 is likely
to have considerable implications for providers and LAs:
– The market knowledge of the LAs is likely to increase as users of social care
services ensure that their payments go towards their caps
– The LA may have a greater ability to control markets through setting their
local rates for social care services, particularly residential and nursing care
• Where there is no active market management, the natural state for
social care appears to be many small providers – there is little
evidence of large scale consolidation