Copyright Warning &...
169
Copyright Warning & Restrictions The copyright law of the United States (Title 17, United States Code) governs the making of photocopies or other reproductions of copyrighted material. Under certain conditions specified in the law, libraries and archives are authorized to furnish a photocopy or other reproduction. One of these specified conditions is that the photocopy or reproduction is not to be “used for any purpose other than private study, scholarship, or research.” If a, user makes a request for, or later uses, a photocopy or reproduction for purposes in excess of “fair use” that user may be liable for copyright infringement, This institution reserves the right to refuse to accept a copying order if, in its judgment, fulfillment of the order would involve violation of copyright law. Please Note: The author retains the copyright while the New Jersey Institute of Technology reserves the right to distribute this thesis or dissertation Printing note: If you do not wish to print this page, then select “Pages from: first page # to: last page #” on the print dialog screen
Transcript of Copyright Warning &...

Copyright Warning & Restrictions
The copyright law of the United States (Title 17, United States Code) governs the making of photocopies or other
reproductions of copyrighted material.
Under certain conditions specified in the law, libraries and archives are authorized to furnish a photocopy or other
reproduction. One of these specified conditions is that the photocopy or reproduction is not to be “used for any
purpose other than private study, scholarship, or research.” If a, user makes a request for, or later uses, a photocopy or reproduction for purposes in excess of “fair use” that user
may be liable for copyright infringement,
This institution reserves the right to refuse to accept a copying order if, in its judgment, fulfillment of the order
would involve violation of copyright law.
Please Note: The author retains the copyright while the New Jersey Institute of Technology reserves the right to
distribute this thesis or dissertation
Printing note: If you do not wish to print this page, then select “Pages from: first page # to: last page #” on the print dialog screen

The Van Houten library has removed some ofthe personal information and all signatures fromthe approval page and biographical sketches oftheses and dissertations in order to protect theidentity of NJIT graduates and faculty.

ABSTRACT
3-D NUMERICAL SIMULATION OF REACTIVE EXTRUSIONAND ITS APPLICATION TO POLYMERIZATION OF c-CAPROLACTONE
IN CO-ROTATING TWIN-SCREW EXTRUDERS
byLinjie Zhu
A 3-D numerical simulation model was proposed to predict the polymerization of s-
caprolactone in fully-filled conveying elements and kneading blocks of co-rotating twin-
screw extruders, in which the kinetics equation for polymerization is coupled with
continuity equation, momentum equation, and energy equation. With the 3-D model,
parametric studies have been carried out to investigate the effects of screw
configurations, screw diameter, operational conditions, values of heat from reaction,
initiator concentration, and heat transfer conditions at barrel surface upon the
polymerization progress. Two simulation models for the polymerization in the partially-
filled channels were developed based on the conveying mechanisms of the reaction
system in the screw channels. Finally, a global model for reactive extrusion was
proposed, combining the models for the fully-filled screw elements and the partially-
filled channels.
The predicted conversion ratios at the die based on the 3-D model agree well with
the experimental results from the literature, indicating that the proposed 3-D model for
polymerization in twin-screw extruders is reliable. Three indices, i.e. flux-mixing
coefficient, temperature mixing coefficient, and conversion ratio mixing coefficient, are
defined for the first time to evaluate the axial mixing during reactive extrusion.
Moreover, transverse mixing is characterized with the ratio of pressure flow rate to net
flow rate in axial cross sections.
The simulation results based on the 3-D model indicate that the polymerization of
caprolactone in screw elements depends not only on the mixing mechanism and flow
behavior, but also on the heat generation in the reaction system and the heat transfer at
the barrel surfaces. It is proposed that the optimization of polymerization in twin-screw
extruders can be achieved by matching the flow and mixing mechanisms with the energy
generation and energy loss. The application of 1-D model, a commonly used method in
the simulation of reactive extrusion, in predicting the polymerization progress in reactive
extrusion is acceptable only under certain conditions, such as a small screw diameter, a
short fully-filled length, a low screw rotating speed, and a small heat from reaction.
The investigation in scaling up polymerization in twin-screw extruders with the 3-
D model reveals that the polymerization is completed in shorter screw length (in unit of
screw diameter) with increasing screw diameter, due to the non-uniformity in temperature
in large extruders. The optimizations of screw configurations, operational conditions, and
cooling systems are extremely important to the polymerization in large machines, in
which 3-D model is a valuable tool.
3-D NUMERICAL SIMULATION OF REACTIVE EXTRUSIONAND ITS APPLICATION TO POLYMERIZATION OF c-CAPROLACTONE
IN CO-ROTATING TWIN-SCREW EXTRUDERS
byLinjie Zhu
A DissertationSubmitted to the Faculty of
New Jersey Institute of Technologyin Partial Fulfillment of the Requirements for the Degree of
Doctor of Philosophy in Mechanical Engineering
Department of Mechanical Engineering
May 2004

Copyright © 2004 by Linjie ZhuALL RIGHTS RESERVED
APPROVAL PAGE
3-D NUMERICAL SIMULATION OF REACTIVE EXTRUSIONAND ITS APPLICATION TO POLYMERIZATION OF s-CAPROLACTONE
IN CO-ROTATING TWIN-SCREW EXTRUDERS
Linjie Zhu
Dr. Sabena A.Nark, Dissertation Advisor DateAssociate Professor of Mechanical Engineering, NJIT
Dr. Kun S. Hyun, Dissertation Co-Advisor DatePresident of Polymer Processing Institute, Newark, NJResearch Professor of Otto York Department of Chemical Engineering, NJIT
Dr. Marino Xanthos, Committee Member DateProfessor of Otto York Department of Chemical Engineering, NJITDirector of Polymer Processing Institute, Newark, NJ
Dr. Rong-Yaw Chen, Committee Member DateProfessor of Mechanical Engineering, NJIT
Dr. I. Joga-Rao, Committee Member DateAssistant Professor of Mechanical Engineering, NJIT

BIOGRAPHICAL SKETCH
Author: Linjie Zhu
Degree: Doctor of Philosophy
Date: May, 2004
Undergraduate and Graduate Education:
• Doctor of Philosophy in Mechanical Engineering, 2004New Jersey Institute of Technology, Newark, NJ
• Doctor of Philosophy in Chemical Processing and Machinery, 1999Beijing University of Chemical Technology, Beijing, China
• Master of Science in Polymer Processing, 1996Chengdu University of Science and Technology, Sichuan, China
• Bachelor of Engineering in Plastics Engineering/Processing Machinery, 1993Chengdu University of Science and Technology, Sichuan, China
Major: Mechanical Engineering
Publications and Presentations
L. Zhu, K. A. Narh, K. S. Hyun, "Scale-up Consideration for Polymerization in a Twin-screw Extruder using 3-D Numerical Simulation", Accepted by 62nd SPE ANTEC,2004.
L. Zhu, K. A. Narh, "Investigation of Reinforcement Mechanisms of Carbon Nanotube-polymer Composites with Numerical Simulation", Accepted by 62nd SPE ANTEC,2004.
L. Zhu, K. Narh, "Numerical Simulation of the Effect of Nanotube Orientation on TensileModulus of Carbon Nanotube Reinforced Polymer Composites", Accepted byPolymer International.
iv
L. Zhu, K. Narh, "Modeling of Tensile Modulus of Polymer-clay Nanocomposites",Accepted by Journal of Polymer Science, Part B, Polymer Physics.
L. Zhu, M. Xanthos, "Effects of Process Conditions and Mixing Protocols on Structure ofExtruded Polypropylene Nanocomposites", Accepted by Journal of AppliedPolymer Science.
L. Zhu, X. Geng, "Experimental Investigation of Polymer Pellets Melting Mechanisms inCo-rotating Twin-screw Extrusion", Advances in Polymer Technology, 21, pp.188-200, 2002.
L. Zhu, K. A. Narh, X. Geng, "Modeling of Particle-Dispersed Melting Mechanism andIts Application in Co-rotating Twin-Screw Extrusion", Journal of PolymerScience, Part B, Polymer Physics, 39, pp. 2461-2468, 2001.
L. Zhu, K. A. Narh, K. S. Hyun, "3-D Modeling of Polymerization in Conveying Elementin Twin-screw Extruder", Proceedings of 61" SPE ANTEC, Nashville, TN,Society Plastics Engineers, Brookfield, CT, pp. 147 -151, 2003.
L. Zhu, K. S. Hyun, "Numerical Simulation of Bulk Polymerization of c-Caprolactone inExtrusion", Proceedings of 60th SPE ANTEC, San Francisco, CA, Society PlasticsEngineers, Brookfield, CT, pp. 204-208, 2002.
L. Zhu, K. S. Hyun, K. A. Narh, "Modeling of Bulk Polymerization of c-Caprolactone inShear Flow", Proceedings of 18 th Annual Meeting of Polymer Processing Society(PPS-18), Guimaraes, Portugal, 2002.

This dissertation is dedicated to my beloved wife, Ying Sun, and my parents.
vi
ACKNOWLEDGMENT
I like to express my sincere appreciation to my advisors, Dr. K. A. Narh and Dr. K. S.
Hyun, for their valuable guidance, supervision and friendship through this research.
Special thanks are given to Dr. M. Xanthos, Dr. R. Chen, and Dr. I. J. Rao for serving as
dissertation committee members, and providing helpful suggestions for this study. I also
like to thank Dr. D. Todd from the Polymer Processing Institute, for his inspirational
discussions with me about this research topic.
I am grateful for the financial support from the Department of Mechanical
Engineering, NJIT, and the support from the Polymer Processing Institute (PPI) in the
summer semesters of 2001 and 2002.
I owe a debt of gratitude to my wife, my parents, and my sisters, for their patience
and understanding. Without their support, it would have been impossible for me to
complete my academic pursuits smoothly.
Finally, I would like to extend a special thanks to my friends here at NJIT and
PPI, who made my experience a most enjoyable one.
vii
TABLE OF CONTENTS
Chapter Page
1 INTRODUCTION TO SIMULATIONOF REACTIVE EXTRUSION 1
1.1 Co-rotating Twin-screw Extruder 1
1.2 Reactive Extrusion 5
1.3 Literature Review of Simulation ofReactive Extrusion in Twin-screw Extruders 7
1.3.1 General Procedure for Simulation of Reactive Extrusion 9
1.3.2 Simulation Techniques in Reactive Extrusion 10
1.4 Conclusions 14
2 MOTIVATION AND OBJECTIVES 15
2.1 One-Dimensional Channel Model 15
2.2 Objectives of the Study 20
3 THEORETICAL MODEL ANDCOMPUTATIONAL TECHNIQUES 21
3.1 Model System 21
3.1.1 Kinetics Equation for Polymerization of c-caprolactone 21
3.1.2 Molecular Weight During Polymerization 26
3.1.2 The Viscosity Model 27
3.2 Governing Equation for Reactive Extrusion 30
3.2.1 Equations of Fluid Mechanics 30
3.2.2 Equations for Reaction 30
3.3 Computational Techniques 32
3.4 Conclusions 37
viii

TABLE OF CONTENTS(Continued)
Chapter Page
4 VALIDATION OF NUMERICAL SIMULATION OFPOLYMERIZATION WITH FLUENT 38
4.1 Validation of Simulation with FLUENT 38
4.2 Steady State Simulation Method in Reactive Extrusion 41
4.3 Conclusions 48
5 POLYMERIZATION OF E-CAPROLACTONEIN FULLY-FILLED CONVEYING ELEMENTS:SIMULATION RESULTS AND DISCUSSION 49
5.1 Simulation of Polymerization of Capro1actonein Conveying Elements with 3-D Model 49
5.1.1 Polymerization at [M]/[I]o = 800with T = 420 K, Co = 0 and D = 34 mm 52
5.1.2 Polymerization at [M]/[I] o = 800with T = 410 K, Co = 0 and D = 34 mm 69
5.1.3 Polymerization at [M]/[I] o = 800with T = 420 K, Co = 0.6 and D = 34 mm 71
5.1.4 Polymerization at [M]/[I] o = 400with T = 405 K, Co = 0 and D = 34 mm 75
5.1.5 Scale-up Polymerization at [M]/[I] o = 800with T = 420 K and C o = 0.6 77
5.1.6 Effect of Helical Direction ofConveying Elements on Reaction 80
5.1.7 Effect of Reaction Heat on Polymerizationin Conveying Elements 83
5.2 Comparison of Simulation Results Based on 1-D and 3-D Models 87
5.3 Conclusions 94
ix

TABLE OF CONTENTS(Continued)
Chapter Page
6 PARAMETRIC STUDY OF POLYMERIZATION OFc-CAPROLACTONE IN KNEADING BLOCKS 97
6.1 Simulation Results for Polymerizationin Kneading Blocks with 3-D Model 100
6.1.1 Polymerization at [M]/[I] o = 800,with T = 410 K, C o = 0 and D = 34 mm 100
6.1.2 Polymerization at [Kin = 800,with T = 420 K, Co = 0.6 and D = 34 mm 106
6.1.3 Scale-up Polymerization at [MV[I]o = 800,T = 420 K, Co = 0.6 in Kneading Blocks 109
6.2 Comparison of Polymerization inConveying Elements and Kneading Blocks 110
6.3 Conclusions 114
7 GLOBAL MODELING AND SCALING UPPOLYMERIZATION IN TWIN-SCREW EXTRUSION 116
7.1 Polymerization in Partially-Filled Channels 116
7.2 Global Simulation of Polymerization in Twin-screw Extruders 123
7.3 Validation of Simulation of Polymerization in Twin-screw Extruders 124
7.4 Effect of Fully-Filled Length on Polymerization in Reactive Extrusion 130
7.5 Scale-up Polymerization in Twin Screw Extrusion 132
7.6 Conclusions 135
8 CONCLUSIONS AND RECOMMENDED WORK 136
REFERENCES 139

LIST OF TABLES
Table Page
3.1 The Relationship Between [MV[I],, and Initiator Concentration [Im o 23
4.1 Conditions for Simulation of Polymerization in Pipe Flow 39
5.1 Dimension of Simulation Domain 50
5.2 Description of Conveying Screw Elements 50
5.3 Boundary Conditions 52
6.1 Kneading Block Configurations 99
6.2 Dimension of Kneading Blocks 99
6.3 Boundary Conditions for Simulation 99
6.4 Axial Location of Middle Plane of Kneading Discs with D = 34 mm 101
7.1 Screw Configuration from Study of Vergnes 125
7.2 Length of Fully-Filled and Partially-Filled Zones Along the Screw 125
7.3 Residence Time in Fully-Filled andPartially-Filled Zones Along the Screw 126
7.4 Length of the Fully-Filled Zone in the Conveying Elements 129
7.5 Conditions for Scaling up Polymerization 132
xi

LIST OF FIGURES
Figure Page
1.1 Schematic diagram for co-rotating twin-screw extruders. 2
1.2 Cross sectional curves of screw elements 3
1.3 Geometry of screw elements (a) conveying element, (b) kneading disc 4
1.4 Factors in reactive extrusion 8
2.1 Schematic diagram for 1-D model (a) side viewand (b) cross sectional view 16
2.2 Non-uniformities in energy and shear at an axial cross section ofa twin-screw extruder 16
2.3 Energy relationships in reactive extrusion 18
3.1 Coordination-insertion mechanisms in polymerization of c-caprolactone 22
3.2 Increase of conversion ratio at different temperatures 25
3.3 Evolution of complex viscosity versus time at (a) 140°C and (b) 100°Cfrom studies of Vergnes 26
3.4 Mesh design for a quarter rotating cycle of a kneading block 34
3.5 Procedure of FLUENT in reactive extrusion 36
4.1 Channel model for polymerization 39
4.2 Comparison of conversion ratio based on FLUENT and 1-D modelat isothermal conditions 40
4.3 Comparison of conversion ratio based on FLUENT and 1-D modelat adiabatic conditions 40
4.4 Geometry of conveying screw element 42
4.5 Dynamic rotation of screws 43
4.6 Geometries of screw channel for the steady state simulationwith (a) 0 = O°, (b) 0 = 30°, (c) 0 = 60°, and (d) 0 = 90° 44
xii
LIST OF FIGURES(Continued)
Figure Page
4.7 Top view of conversion ratio profile at screw surfaces.(a) 0= O°, (b) = 30°, (c) 0= 60° 45
4.8 Distribution of conversion ratio at cross sections with Z = O.06 mat different initial angles 46
4.9 Averaged parameters along the axial length. (a) conversion ratio,(b) temperature, (c) viscosity, (d) pressure and (e) shear rate 47
5.1 Geometry of conveying elements (a) SE20F, (b) SE40F, (c) SE60F 51
5.2 Mesh of conveying screw element SE60F at (a) screw surface,and (b) barrel surface 51
5.3 Conversion ratio profiles at [AM. = 800 and N = 287 rpm at topsurfaces of elements (a) SE2OF, (b) SE4OF, and (c) SE60F 53
5.4 Conversion profile at axial cross sections of Z = O.06 m at [Mm/[Im. = 800and N = 287 rpm in elements (a) SE2OF and (b) SE60F 54
5.5 Conversion distribution at different axial cross sections at [AMA. = 800and N = 287 rpm in elements (a) SE20F and (b) SE60F 55
5.6 Axial velocity profiles at axial cross section of Z = O.06 m at [MV[Im = 800and N = 287 rpm in elements (a) SE20F and (b) SE6OF 55
5.7 Axial velocity distribution at cross section with Z = O.06 min SE2OF and SE60F 56
5.8 Streamlines of an element initially located at (O.029, 0, O.06) (marked byP1 in Figure 5.6). (a) isometric view of the streamline in SE6OF,(b) top view of the stream line in SE60F and (c) top view of thestreamline in SE20F. 57
5.9 Area weighted average parameters along the axial length duringpolymerization at [Mm/[Im. = 800, N = 48 rpm or 287 rpm,T = 420 K and C. = O. (a) conversion ratio, (b) temperature,(c) viscosity, (d) pressure, and (e) shear rate 59
LIST OF FIGURES(Continued)
Figure Page
5.10 (a) Velocity magnitude and (b) velocity component at Y directionat mid-line of channel at Z = O.06 m and Y = 0 m in SE6OF 62
5.11 Flux-mixing coefficients in conveying elementsat [MV[Imo = 800, N = 48 rpm or 687 rpm and C o = 0 63
5.16 Calculated (a) conversion mixing coefficients, and (b) temperaturemixing coefficients in conveying elements 65
5.13 Schematic illustrations of the mixing mechanisms betweenforward flow and back flow in screw elements 66
5.14 Velocity vector in (a) cross section with Z = O.06 m in SE60F,and (b) blowing up of the rectangular region in plot a 67
5.15 Transverse mixing coefficients at cross section of Z = O.06 min SE60F and SE6OF 68
5.16 Area weighted average parameters along the axial length duringpolymerization at [MV[Imo = 800, N = 48 rpm or 687 rpm, T = 410 Kand Co = O. (a) conversion ratio, (b) temperature, (c) viscosity,(d) pressure and (e) shear rate 70
5.17 Area weighted average parameters along the axial length duringpolymerization at [MV[Imo = 800, N = 48 rpm or 687 rpm, T = 460 Kand Co = O.6. (a) conversion ratio, (b) temperature, (c) viscosity,(d) pressure and (e) shear rate 76
5.18 Effects of heat transfer conditions at wall on average conversion ratiosat [MV[Imo = 800, T = 460 K and C o = O.6 74
5.19 Conversion ratios in SE2OF and SE6OF with adiabatic conditionand constant temperature at barrels at 48 rpm. 75
5.60 Area weighted average parameters along the axial length duringpolymerization at [MV[Imo = 400, N = 48 rpm or 687 rpm, T = 405 Kand Co = O. (a) conversion ratio, (b) temperature, (c) viscosity,(d) pressure and (e) shear rate 76
5.61 (a) Flux-mixing coefficient and (b) normal velocity at linefrom (O.068, O, 0.06) to (O.036, O, 0.06) in SE20F 78
xiv

LIST OF FIGURES(Continued)
Figure Page
5.22 Averaged conversion ratios along the axial lengthat a screw diameter of 68 mm 79
5.23 Comparison of conversion ratios between D = 34 mm and D = 68 mm 79
5.24 Plots of conversion ratios along the axial length as a function ofscrew diameter under various thermal conditions at screw speed of(a) 287 rpm and (b) 48 rpm. 81
5.25 Conversion ratio along the axial length in reversed conveying elementSE20R at [AMA. = 800, and T = 420 K 82
5.26 Comparison of conversion ratios along the axial length in SE2OFand SE2OR at [MV[Im. = 800 and T = 420 K. (a) C o = O.6 and (b) Co = O 83
5.27 Effect of reaction heat on conversion ratio at [M]/[Im. = 800, T = 420 Kand Co = 0 in SE2OF 84
5.28 Effect of reaction heat on conversion ratio at [MV[Im. = 400, T = 405 Kand C,, = 0 in SE2OR 85
5.29 Effect of reaction heat on conversion ratio at [MV[Im. = 400, T = 410 Kand C. = 0 in SE2OF and SE6OF 86
5.30 Effect of reaction heat on conversion ratio at [MV[Im. = 800, T = 420 Kand Co = O.6 in SE2OF 86
5.31 Average conversion ratio at [MV[Im. = 400, T = 405 K, and C.= 0based on 1-D and 3-D models 88
5.32 Average conversion ratio at [MV[Im. = 800, T = 420 K, and C o = 0based on 1-D and 3-D models 89
5.33 Average conversion ratio at [AM. = 800, T = 410 K, and C o = 0based on 1-D and 3-D models 90
5.34 Average conversion ratio at [MV[Im. = 800, T = 420 K, and C o = O.6based on 1-D and 3-D models with (a) D = 34 mm, (b) D = 68 mm 91
5.35 Effect of simulation method on average conversion ratioat [MV[Im. = 400, T = 405 K and C.= 0, with H = 100 kJ/kg 93
Dv

LIST OF FIGURES(Continued)
Figure Page
5.36 Effect of simulation method on average conversion ratioat MVMo = 800, T = 420 K and C o = 0 with H = 100 kJ/kg 63
5.37 Effect of simulation method on average conversion ratioat [MV[1m. = 800, T = 420 K and Co = O.6 with H = 100 kJ/kg 64
6.1 Kneading block configurations of (a) KB3O, (b) KB60 and (c) KB9O 68
6.2 Mesh for (a) kneading block surfaces and (b) axial cross sections 66
6.3 Top view of conversion ratio profiles at kneading block surfaces of(a) KB30F and (b) KB90 at [MV[1mo = 800 and N = 287 rpm 100
6.4 Conversion profiles at middle plane of kneading disc No.10 (Z = 0.07125m)at [MVM0 = 800 and N = 287 rpm in (a) KB30F and (b) KB90 101
6.5 Area weighted distribution of conversion ratio at middle planes ofkneading disc No.7, No.10 and No. 14 at [MV[1m = 800 andN = 287 rpm in (a) KB30F and (b) KB60 102
6.6 Axial velocity profiles in middle plane of kneading disc No.10at [MVMo = 800 and N = 287 rpm in (a) KB3OF and (b) KB90 102
6.7 Average conversion ratios along the axial length in kneading blocksat 287 rpm and 48 rpm 104
6.8 Flux-mixing coefficients in kneading blocks at 287 rpm and 48 rpm 104
6.6 (a) Tangential velocity and (b) temperature profiles in KB30F and KB9Oat line with Y = 0 m in the axial cross section with Z = 0.04875 m 105
6.10 Comparison of conversion ratio profiles in forward and reversedkneading blocks at (a) 287 rpm and (b) 48 rpm 107
6.11 Conversion ratios along axial length in kneading blocksat [Mm/[Im o = 800, T = 420 K and C o = 0.6 108
6.12 Effect of helical direction of kneading blocks on conversion ratio profilesalong the axial length at (a) 287 rpm and (b) 48 rpm 106
Devi

LIST OF FIGURES(Continued)
Figure Page
6.13 Distributions of (a) axial velocity and (b) conversion ratio at themiddle plane of disc No.9 in forward and reversed kneading blocks 109
6.14 Average conversion ratio profiles at 287 rpm withscrew diameters of 34 mm and 68 mm 110
6.15 Comparison between conversion ratio profiles in kneading blocksand screw elements at T = 410 K and D = 34 mmwith (a) 287 rpm and (b) 48 rpm 112
6.16 Comparison between conversion ratio profiles in kneading blocksand screw elements at T = 420 K and D = 34 mmwith (a) 287 rpm and (b) 48 rpm 113
6.17 Comparison between shear rates in kneading blocksand screw elements at T = 420 K and D = 34 mmwith (a) 287 rpm and (b) 48 rpm 113
6.18 Comparison of conversion ratios in kneading blocksand conveying elements at T = 420 K and D = 68 mm 114
7.1 Models for partially filled channels with materials located atpushing flight 120
7.2 Models for partially filled channels with materials located atlocated the bottom of barrel. (a) cross section view,(b) longitudinal view and (c) chamber model 122
7.3 Screw geometry for the fully filled zones of (a) KB45/6/30°(R)and its upstream, (b) KB37.515/30° and its upstream, and(c) KB22.5/3/30° and its upstream 128
7.4 Comparison of conversion ratios along the axial lengthfrom simulation and experiments 129
7.5 Conversion ratios in conveying elements with different axial lengths 131
7.6 Predicted (a) conversion ratio profile and (b) temperature increasealong the axial length during scaling up 133
Dvii

LIST OF SYMBOLS
A Area (m2)
C, Co Conversion ratio and initial conversion ratio
Cps Specific heat (J/kg K)
CL Centerline distance (mm)
D Diameter (mm)
Ea Activation energy (kJ/mol)
Eb, Es Activation energy for the bulk, and solution systems (kJ/mol)
Emonomer Activation energy for monomer (kJ/mol)
Fr Froude number
Gf Flux mixing coefficient in axial direction
Gi Temperature mixing coefficient in axial direction
Go Conversion ratio mixing coefficient in axial direction
Giv Transverse mixing coefficient
hb, Bs Heat transfer coefficients at barrel, and screw surface (W/m 2 K)
H Reaction heat (kJ/kg)
Huh Channel Depth (mm)
g Gravitational constant
Jr Jeffrey's number
k Thermal conductivity (W/m K)
L, Az Channel Length (mm)
Mob Monomer molecular weight (g)
xviii

LIST OF SYMBOLS(Continued)
mw Weight averaged molecular weight (g)
[Mm, [Mm o Monomer concentration and initial monomer concentration
N Screw rotating speed (rpm)
Nb, Nf Numbers of the cells with forward, and reversed axial velocity
n Number of thread start of screw
AP Pressure difference (Pa)
P Pressure (Pa)
Q, Qd,Qp Net flow rate, drag flow rate and Pressure flow rate (m 3/s)
QL Leaking flow rate (m3/s)
Qdmax Maximum drag flow capacity (m 3/s)
Qv, Qr Viscous dissipation and reaction heat (W)
Q13, QF Back flow rate, and forward flow rate (m 3/s)
Bch
Volume of the screw channel (m 3)
Bpr Volumetric flow rate per revolution (m 3/s)
q Heat flux (W/m2)
Rb, Rs Screw tip radius, and screw root radius (mm)
Re Reynolds number
R Universal gas constant (8.314 kJ/kg mol K)
Br Degree of reaction
Sb Barrel surface area (m 2)
xix

LIST OF SYMBOLS(Continued)
T Temperature (K)
Tf Average temperature of melt (K)
Tb, Ts Barrel, and screw temperatures (K)
Tfl Fluid temperature in the layer next to the barrel surface (K)
t Reaction time (s)
to It Residence time in partially-, and fully-filled channels (s)
V Velocity (m/s) or volume (m 3)
VL Leaking flow rate (m 3/s)
V Volume of the flight (m 3)
X, Y, Z x-, y- and z-coordinates
AZ Axial length of the partially filled area (mm)
a Tip angle or the partial order related to the initiator
X, E, Constants
Viscosity (Pa - s)
c Degree of fill
p Density (kg/ m3) or radius (m)
cps Helical angle of the flight or constant
8 Clearance (m)
A Layer thickness (m)

CHAPTER 1
INTRODUCTION TO SIMULATION OF REACTIVE EXTRUSION
Reactive extrusion refers to the application of screw extruders as chemical reactors to
deliberately perform chemical reactions, such as polymerization and chemical
modification of polymers (1-3). This chapter gives a brief introduction to the structures of
intermeshing co-rotating twin-screw extruders, features of reactive extrusion, and
literature review of numerical simulation in reactive extrusion.
1.1 Co-rotating Twin-screw Extruder
As an important part of processing technology, the twin-screw extruder has a variety of
geometries. The main geometrical features that distinguish various twin-screw extruders
are the sense of rotation and the degree of intermeshing between two screws (4-9). There
are three basic categories of twin-screw extruders nowadays, i.e. intermeshing co-rotating
twin-screw extruder, intermeshing counter-rotating twin-screw extruder, and non-
intermeshing counter-rotating twin-screw extruder.
Co-rotating intermeshing twin-screw extruders (CRTSEs) are the most important
twin-screw machines. They are typically offered in modular screw and barrel designs
(Figure 1.1), which allow for economical manufacturing as well as versatile mechanical
configurations and operating conditions, dictated by the processing needs. Such design
characteristics make CRTSEs a valuable part of manufacturing processes in the polymer,
chemical, and food industries. However, the flexibilities in modular designs and
operating condition selections can lead the inexperienced process engineer down the
1

2
wrong path. Therefore, to complete a complicated processing task successfully, a well-
defined and focused approach to the problem must be pursued (10). This is the reason
why lots of research efforts have been carried out to understand the conveying, melting
and mixing mechanisms in CRTSEs in the last decades.
Figure 1.1 Schematic diagram for co-rotating twin-screw extruders.
There are two basic types of screw elements in co-rotating twin screw extruders:
conveying elements and kneading blocks. The cross section of a conveying element is
exactly the same as a kneading block. Figure 1.2 shows the typical cross section curves
for a co-rotating twin screw extruder, in which the radius p(0) is given as (11-12):

3
where CL is the centerline distance; R I, is the screw tip radius, and Rs the screw root
radius. a is the tip angle, defined as:
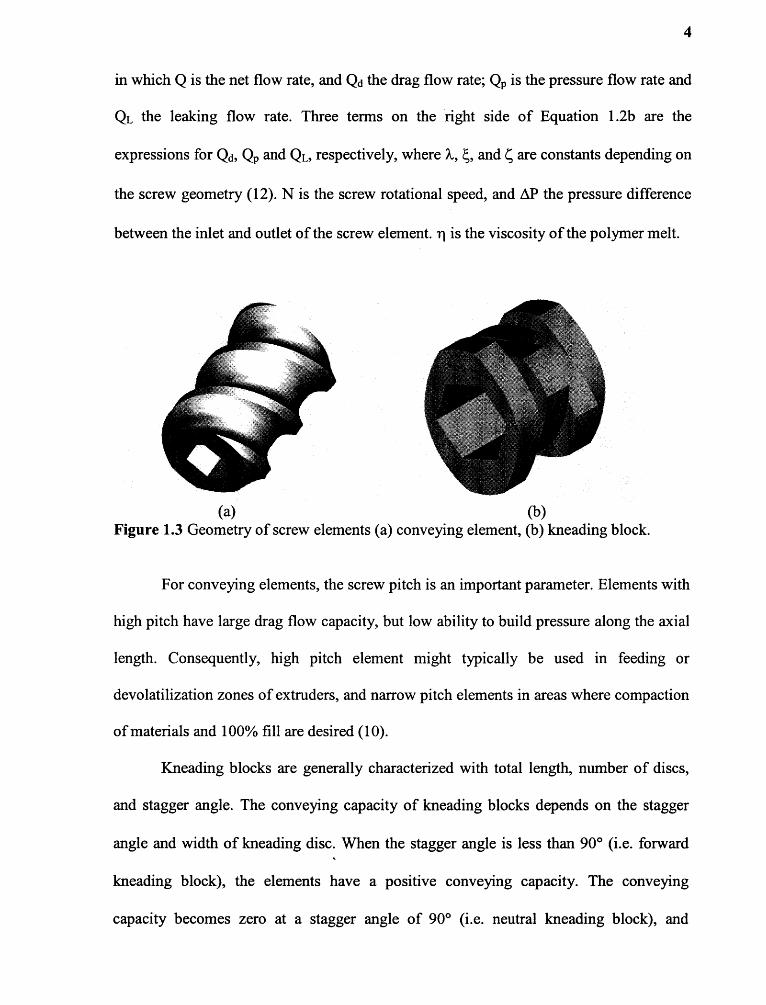
The difference in geometries between conveying elements and kneading blocks is
as follows: the conveying element is constructed by propagating the cross sectional curve
(described in Equation 1.1) continuously along a helix, as shown in Figure 1.3a; the
kneading blocks are built with a certain number of kneading discs at a constant stagger
angle, in which the kneading disc is extruded from the cross sectional curve (with a zero
helical angle) at a certain thickness. For instance, Figure 1.3b exhibits the configuration
of a kneading block built by 4 pieces of kneading discs at a stagger angle of 60°.
The flow of polymer melt in screw channels can be described by a simplified
equation:
4
in which B is the net flow rate, and Bd the drag flow rate; Bp is the pressure flow rate and
BL the leaking flow rate. Three terms on the right side of Equation 1.2b are the
expressions for Bd, Bp and BL, respectively, where X, and are constants depending on
the screw geometry (12). N is the screw rotational speed, and AP the pressure difference
between the inlet and outlet of the screw element. i is the viscosity of the polymer melt.
For conveying elements, the screw pitch is an important parameter. Elements with
high pitch have large drag flow capacity, but low ability to build pressure along the axial
length. Consequently, high pitch element might typically be used in feeding or
devolatilization zones of extruders, and narrow pitch elements in areas where compaction
of materials and 100% fill are desired (10).
Kneading blocks are generally characterized with total length, number of discs,
and stagger angle. The conveying capacity of kneading blocks depends on the stagger
angle and width of kneading disc. When the stagger angle is less than 90° (i.e. forward
kneading block), the elements have a positive conveying capacity. The conveying
capacity becomes zero at a stagger angle of 90° (i.e. neutral kneading block), and

5
becomes negative when the stagger angle is larger than 90° (i.e. reversed kneading
block). Due to the discontinuity of the geometry, kneading blocks have larger leaking
flow than conveying elements. Accordingly, the conveying capacity in kneading blocks is
usually lower than conveying elements. However, the mixing capacity of kneading
blocks is enhanced due to the leaking flow.
The modular design of screws is achieved by mounting the screw elements, say,
conveying elements and kneading blocks, on a shaft (Figure 1.1). Because various screw
elements have different conveying and mixing capacities, the change of the sequence of
elements along the axial length might result in a totally different flow behavior of
polymers in the extruder. Consequently, in twin-screw extrusion, a specific process
should use a unique screw configuration, in order to enhance the quality and reduce the
cost of the product.
1.2 Reactive Extrusion
In a reactive extrusion, the synthesis or modification of a polymeric material takes place
simultaneously with the processing and shaping of a final product. This is an efficient
method for continuous polymerization of monomers and chemical modification of
existing polymers, and is viewed as a complex reaction engineering process that
combines the traditionally separated operations, i.e., polymer chemistry (polymerization
or chemical modification) and extrusion (blending, compounding, structuring,
devolatilization, and eventually shaping), into a single process in a screw extruder (1-3,
15). Chemical reactions, such as bulk polymerization, graft reaction, inter-chain
copolymer formation, coupling/crosslinking reactions, controlled degradation,

6
functionalization, and reactive blending, have been performed successfully with reactive
extrusion (1-3, 13-14).
Extruders have been found very attractive for many reactive processing
applications because of several inherent features. Compared with other chemical reactors,
say, a continuous stirred tank reactor (CSTR), a twin-screw extruder reactor has the
following advantages (2, 7, 9, 15-16):
• Bulk reactions involving both low and high viscous reactants.
• Staging of sequential unit operations.
• Removal of unreacted monomers and by-product.
• Modular screw and barrel design and self-wiping structure.
• Control over residence time distribution.
• Excellent dispersive and distributive mixing.
• Continuous processing.
• A flexible process for low-tonnage trial or production.
• Reaction under pressure and temperature control.
However, the inherent feature of extruders also brings limitations to reaction
processing, such as difficulty in handling large heat from reaction, and high cost for long
reaction time. Furthermore, in reactive extrusion, a unique screw and barrel configuration
(or design) is required for a specific reaction. In contrast, the same continuous stirred tank
reactor can be used for a wide range of chemical reactions in solution. This suggests that
it is of great value to investigate the effect of screw configurations, operating conditions
and machine size on reactive processing.
7
1.3 Literature Review of Simulation of Reactive Extrusionin Twin-screw Extruders
Computer-aided simulation of polymer flow in extruders not only constitutes a key aid in
improving the quality of products by optimizing the processing conditions, but also offers
an effective way to reduce the cost. Furthermore, it gives access to data and information
relevant to the process which is difficult to get, or indeed not available at all, by
experiments.
So far, there are very limited literatures on the simulation of reactive extrusion
due to the complex nature of the twin-screw extruder and reaction process, although the
modeling of reactive extrusion has been investigated since the 197Os. However, the
papers published in the 197Os (17-22) generally focused on the flow in a "flooding fed"
single screw extruder with constant screw design along the axial length. This is different
from the case of co-rotating twin-screw extruders, in which the screw channel is not
necessarily fully filled, and the screw is built with elements in different geometries.
The mechanisms of reactive extrusion can be generally combined into three main
groups, such as flow and mixing behavior, heat generation and transfer, and reaction (23).
These factors interact with each other, as shown in Figure 1.4. The flow behavior of
polymer melt in the extruder determines the degree of fill in screw channels, mixing
intensity in melt, and residence time (or residence time distribution), thus affecting the
heat transfer behavior and reaction rate. On the other hand, reaction and heat transfer
influence the flow of melt in the screw channel, because the thermal and chemical
conditions of the melt determine the rheological properties and flow characteristics.
Furthermore, heat transfer and reaction interact with each other; the reaction rate and
reaction equilibrium depend on temperature, whereas the dissipation heat, and reaction

8
heat, change the thermal state of the reaction system. As a whole, these factors determine
the performance of the extruder and the quality of the products.
Figure 1.4 Factors in reactive extrusion (23).
Basically, the numerical simulation of reactive extrusion should at least include
the following three parts:
• Solver for Continuity equation and Momentum equation;
• Solver for Energy equation;
• Solver for Kinetic equations of reaction;
Another important step in the numerical simulation is how to cope with the
complex geometry of twin-screw extruders. Currently, a variety of modeling methods
have been developed, in which different techniques are employed to solve the differential
equations, and to describe the screw geometries.

9
1.3.1 General Procedure for Simulation of Reactive Extrusion
It is known that twin-screw extruders are operated with starve feeding. That is, the screw
channel in twin-screw extruders is not essentially fully filled. Accordingly, the degree of
fill is introduced to evaluate the distribution of materials along the screw channels in
twin-screw extruders:
in which c represents the degree of fill. B is the volumetric flow rate (m 3/s), and Qdmax the
maximum drag flow capacity of the screw element. When the channel is fully filled, E
equals 1.
Generally, a reversed procedure, i.e. from the die to the feeding port (see Figure
1.1), is used to predict the flow characteristics of polymer melt inside the extruder,
because the degree of fill along the screw length is unknown a priori. In the simulation,
the die and the reversed screw elements are always assumed to be fully filled. Thus, the
pressure gradient at the upstream of these elements can be determined. The general
procedures for the simulation of reaction in twin-screw extruders are summarized as
follows:
1. The pressure at the die entrance is first calculated after assuming a melt temperature
at the die exit, because it is always fully filled.
2. Next, an isothermal approximation is used to determine the location of fill and
starvation along the screw axis, from the die to the feeding port. The mean residence
time is calculated based on the degree of fill.
3. A non-isothermal calculation is carried out to obtain the temperature rise forwardly
along the screw length (from the feeding port to the die).

1 0
4. The reaction in each screw element is calculated forwardly, based on the
temperature rise and residence time. The viscosity of melt might be adjusted due to
the variations in the degree of reaction, temperature, and shear rate.
5. At the die exit, a new melt temperature is calculated. If this new temperature is
different from the presumed one, an iterative procedure is applied, i.e. repeating the
previous three steps. The iteration stops when convergence is achieved.
1.3.2 Simulation Techniques in Reactive Extrusion
In the literatures, various techniques have been introduced to get the velocity and
pressure profiles, to calculate the temperature rise, and to solve the kinetics equation,
which are described as follows.
1.3.2.1 Calculation of Velocity and Pressure Profiles. Currently, three techniques
are employed in the calculation of velocity and pressure profiles along the screw:
I. Unwrapped screw channel model, in work of Michaeli, et ad (23-24)
The model developed for the conventional single screw extruder is used for describing
the flow in co-rotating twin-screw extruders.
2. 1-D channel model, in work of Vergnes, et al. (25-28)
A cylindrical coordinate is used in the analysis of the flow in screw channels, in which
the channel section is perpendicular to the screw flights. The screw channel is considered
as a succession of C-shaped chambers and the intermeshing area.
3. 2-D FAN method, in work of Fukuoka (29-30) and White (31-35)
The FAN method has been employed to analyze a two-dimensional flow field in
conveying elements and kneading blocks of co-rotating twin-screw extruders, after

11
unwinding the screw channels into a flat plane. Accordingly, the pressure and velocity
profiles are determined.
1.3.2.2 Modeling of Temperature Profile. In the literature, one-dimensional method
(i.e. 1-D model) has been used in calculating the temperature rise along the screw channel
(23-35). The temperature is assumed to have a uniform distribution at the axial cross
section, and varies along the axial length only. The average shear rate is applied in the
calculation of viscous dissipation. The heat transfer between polymer melt and walls
(barrel and screw surfaces) is given as:
in which hb and Bs are heat transfer coefficients at barrel and screw surfaces. I f is the
mean temperature of polymer melt; Tb and Ts are barrel and screw temperatures,
respectively. Considering the fact that the reaction is very sensitive to temperature,
modeling of temperature based on the 1-D model might not give correct results in the
simulation of reaction extrusion. This is discussed in detail in Chapter 2.
1.3.2.3 Solution of Kinetics Equations of Reaction. Chemical reaction is usually
characterized with kinetics equation, which describes the relationship between reaction
rate, temperature and time. In the extruder, the degree of reaction differs from location to
location along the screw channel, and can be given as:
in which rr stands for the degree of reaction, X, Y and Z are x-, y- and z-coordinates of
the location in the screw channel. In the literature, the kinetics equation of reaction in
twin-screw extruders is usually solved by four methods:

12
1. Ideal mixing model (23-33, 35)
It is assumed that ideal mixing (complete mixing) is achieved in the cross sections
(perpendicular to the flow direction). That is, the degree of reaction is identical at any
locations in the cross section. Consequently, the degree of reaction changes only along
the flow direction, and Equation 1.5 is simplified to be:
Equation 1.6 indicates that 1-D model could be introduced when ideal mixing is achieved
at the cross sections. Obviously, 1-D model would largely simplify the calculation
procedure in the simulation. This method is the most commonly used approach in the
simulation of reactive extrusion, such as in the studies of Michaeli (23-24), Vergnes (25-
28), Fukuoka (29-30) and White (31-33, 35).
2. Residence time distribution model (23, 36-37)
The calculation of the degree of reaction is based on the residence time distribution in the
extruder. In this model, the residence time distribution during extrusion is first obtained
by experiments or simulation. Then, reactions in the extruder are modeled as a series of
reactors, for example, a series of continuous stirred tank reactors (CSTRs). In the work of
Michaeli et al. (23), polymerizations of nylon 6 and polystyrene in twin-screw extruders
were simulated with the model of cascade of CSTRs and the pipe model (i.e. 1-D model),
respectively. It was found that the pipe model gave much higher conversion than those
from experiments, whereas the conversion based on the model of cascade of CSTRs
could be close to the experimental data. However, the simulation results depend on the
number of tank reactors in the model of cascade of CSTRs.

13
3. Composite reactor model (35)
In the studies of White et al. (35), different reactor models were used to describe the
transesterification of ethylene vinyl acetate copolymer in various screw elements of a co-
rotating twin-screw extruder. That is, the conveying section was regarded as drag flow
reactors (DFRs), the kneading blocks as continuous stirred tank reactors (CSTRs), and
the die as plug flow reactors (i.e. 1-D model). Furthermore, the starved flow and fully-
filled flow were distinguished in the modeling. In our previous studies (38-39), the
polymerization of E-caprolactone in a screw channel was simulated with a 2-D channel
model, and the effects of radial mixing on reaction were considered. It was found that the
simulation method, 1-D model or 2-D model, has a significant effect on the simulation
results. With increasing radial mixing in the channel, the results from 2-D model
approach those from the 1-D model.
4. 3-D model for degradation of polypropylene (40-41)
Recently, Tzoganakis et al. (40-41) used a commercial fluid dynamic analysis package
(FIDAP) to investigate the degradation of polypropylene in conveying elements of a co-
rotating twin-screw extruder, and in channels of a single screw extruder. It was found that
effects of both screw speed and peroxide distribution on reaction are negligible, but the
pressure-to-drag flow ratio has a significant influence on degradation. Their work also
suggests that it is feasible to carry out the simulation of reaction in extruders with a 3-D
model.

14
1.4 Conclusions
Reactive extrusion is an efficient method for continuous polymerization of monomers
and chemical modification of existing polymers. Co-rotating twin-screw extruders have
been found suitable for reactive extrusions due to their inherent advantages. The flow of
polymer melt in twin-screw extruders is very complex, due to the complex geometries of
the extruder, variable properties of polymer melt and complex reaction kinetics.
Computer-aided simulation is an important method in optimizing the reaction progression
in extruders. Because the reaction is sensitive to temperature and residence time (or
residence time distribution), simulation techniques in modeling of reactive extrusion
affect the simulation results. Currently, 1-D model is commonly used in predicting the
temperature rise and degree of reaction along the screw length in the simulation of
reactive extrusion. However, 1-D model is a simplified method, which does not represent
the realistic situation in extruders. Some work should be carried out to improve these
techniques. This was the motivation and starting point of the current study.

CHAPTER 2
MOTIVATION AND OBJECTIVES
As discussed in Chapter 1, 1-D model is currently the main method used in predicting the
temperature profile and reaction progression in the simulation of reactive extrusion. The
main advantage of 1-D model is that it makes the simulation simple and easy. However,
the phenomena described by 1-D model are different from the realistic conditions in
reactive extrusion. In this chapter, the motivation and objectives of the current study are
presented following the discussion on the characteristics of 1-D model and its
disadvantages.
2.1 One-Dimensional Channel Model
The most important feature of a 1-D channel model is that the temperature and the degree
of reaction in extruders change only along the screw length. At any locations in the axial
cross section (Plane X-Y in Figure 2.1), temperature of polymeric liquid is uniform, so is
the degree of reaction. Consequently, the temperature and degree of reaction in extruders
is given as:
where T and C stand for temperature and degree of reaction, respectively. Z is the axial
distance along the screw length, as shown in Figure 2.1.
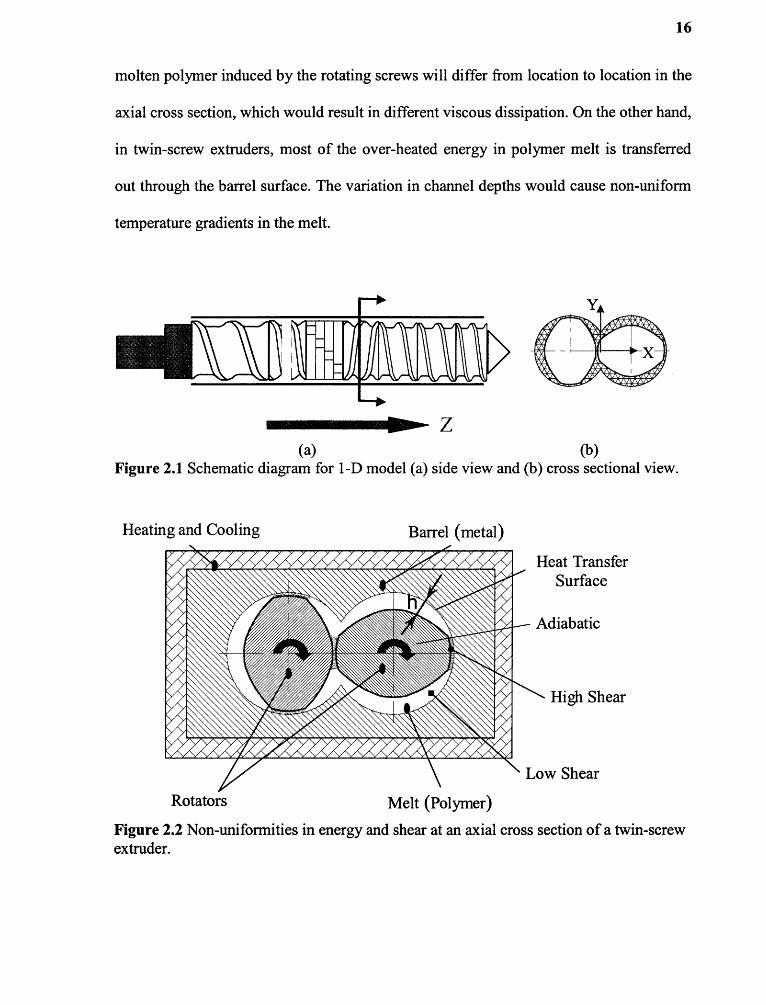
It is known that the channel depth is not uniform along the inner periphery of the
barrel surface, as shown with symbol h in Figure 2.2. Accordingly, the shear rate in
15
16
molten polymer induced by the rotating screws will differ from location to location in the
axial cross section, which would result in different viscous dissipation. On the other hand,
in twin-screw extruders, most of the over-heated energy in polymer melt is transferred
out through the barrel surface. The variation in channel depths would cause non-uniform
temperature gradients in the melt.
Figure 2.2 Non-uniformities in energy and shear at an axial cross section of a twin-screwextruder.

17
When the dimension of the machine is considered, the non-uniformity of
temperature in the axial cross section would become much pronounced in the large
machines. The reasons are two-fold. Firstly, the depth of screw channel rises with
increasing machine size, and as discussed in the preceding paragraph, the non-
uniformities in shear rates and temperature gradients would increase. Secondly, the ratio
of the surface area of barrel to the channel volume decreases when the dimension of the
screw is increased, which makes it difficult to release the dissipated energy (due to
viscous heating) through the barrel surface.
In order to discuss the effect of temperature distribution on reaction, the energy
balance during polymerization in extruders is summarized in Figure 2.3. It shows that an
increase in temperature would lead to three possible scenarios (shown as 1 through 3):
1. A rise in temperature raises the degree of polymerization, which releases large
exothermal heat from reaction, causing an increase in temperature;
2. The enhancement in the degree of polymerization means the increase in molecular
weight and viscosity, which could reduce the heat loss through the wall surface (by
convection); consequently, the temperature of the reaction system rises;
3. The increase in system viscosity raises the viscous dissipation, which, in turn,
increases the temperature.
The above scenarios suggest that, in a fluid element, a small initial increase in
temperature might lead to a large temperature increase, because of the increase in
exothermal heat from reaction and viscous dissipation, and the decrease in heat loss
through the wall. This implies that the degree of reaction cannot be homogeneous at the
axial cross sections of the extruder because the temperature is not uniform there.

18
Furthermore, the non-uniformity in the degree of reaction could be more significant than
that in temperature (As described in the next chapter, the degree of reaction is an
exponential function of temperature). This suggests that 1-D model does not represent the
realistic conditions in reactive extrusion, and the simulation results based on the latter
would be different from the real situations, especially when the reaction heat is large, or
the viscosity of the reaction system is high, or the machine size is large.
Moreover, in 1-D model, the temperature rise along the axial length (i.e. Z
direction in Figure 2.1) can be given as:
when the screw surface is assumed to have an adiabatic heat transfer condition. hb is the
heat transfer coefficient at the barrel surface. Tb and 1f are barrel temperature and
averaged fluid temperature. Sb is the barrel surface area, and Q the volumetric flow rate.
19
p and Cps are density and specific heat of the reaction system. A vis and Qr are viscous
dissipation and reaction heat, respectively. Obviously, the value of the heat transfer
coefficient at barrel surfaces, hb, has a significant effect on temperature rise, and, thus, on
the degree of reaction in the simulation.
It is known that the heat transfer in twin-screw extruders is a very complex
problem. Although a comprehensive study of this problem was carried out by Todd more
than ten years ago (42), there are very few recent studies done in this area (43-45). For a
non-reaction system, most of the reported studies used Todd's empirical equation to
calculate the temperature rise along the screw length. For reactive extrusion, there are no
good criteria for the selection of the heat transfer coefficient, and no numerical simulation
has been carried out yet in this area. Michaeli's investigation (23) shows that the melt
temperatures calculated based on the heat transfer coefficient from Todd's empirical
equation are lower for the synthesis of nylon and higher for the synthesizing of
polystyrene than the measured values. This is interpreted by the authors (23) in terms of
the heat supplied to the system. More specifically, the heat supply for the thermally
initiated caprolactam polymerization and the heat removal for the highly exothermic
styrene polymerization are not exactly described by Todd's equation. This suggests that
heat transfer in the reactive system is different from that in the non-reaction system. For
this reason, it is necessary to carry out some studies to investigate the heat transfer
mechanisms in a reactive extrusion process.
20
2.2 Objectives of the Study
In light of the above discussed issues related to 1-D and 2-D models for simulation of
reactive extrusion, the following objectives have been set out:
1. To develop a 3-D model for the simulation of polymerization in fully-filled screw
elements of co-rotating twin-screw extruders, in which the kinetics equation of
polymerization is coupled with continuity equation, momentum equation and energy
equation.
2. To investigate the effects of geometries of screw elements, operation conditions,
screw diameters, and initiator concentrations of the reactive system upon polymerization
parametrically, based on the 3-D model, in order to find out the dominant factors in
reactive extrusion;
3. To study the effect of scale-up on reaction with the 3-D model;
4. To explore the heat transfer mechanisms in reactive extrusion;
5. To propose a method to predict the reaction in partially-filled screw channels, on the
basis of the simulation results from 3-D model in the fully-filled zones;
6. To predict the global progression of polymerization in a co-rotating twin-screw
extruder; and to compare the numerical simulation results with experimental data from
literatures.

CHAPTER 3
THEORETICAL MODEL AND COMPUTATIONAL TECHNIQUES
This chapter focuses on the theories and computational techniques used in the current
study, which includes three sections. The first two sections describe the model system
and the governing equations employed in the simulation; the last section presents the
computational techniques in the numerical simulation.
3.1 Model System
Poly-caprolactone is a biodegradable thermoplastic polymer, which has good water, oil,
solvent and chlorine resistance, low melting point and low viscosity. It is widely used in
adhesives, building and construction, films, automotive industry, and medical
applications. In this study, polymerization of c-caprolactone was selected as a model
system. The information required in the numerical simulation of polymerization of
E-caprolactone, such as kinetic equation of polymerization, rheological model, and heat
generation from reaction, as presented in this section, was obtained from the experimental
studies of Gimenez (46) and Vergnes (25).
3.1.1 Kinetics Equation for Polymerization of c-caprolactone (46)
Several studies have been carried out focusing on the polymerization of s-caprolactone in
bulk or in solution. A living mechanism is observed when the polymerization is initiated
and catalyzed by titanium tetrapropoxide, a family member of organo-metallic
compounds (25, 46-51). The polymerization is described as a two-step "coordination-
21
22
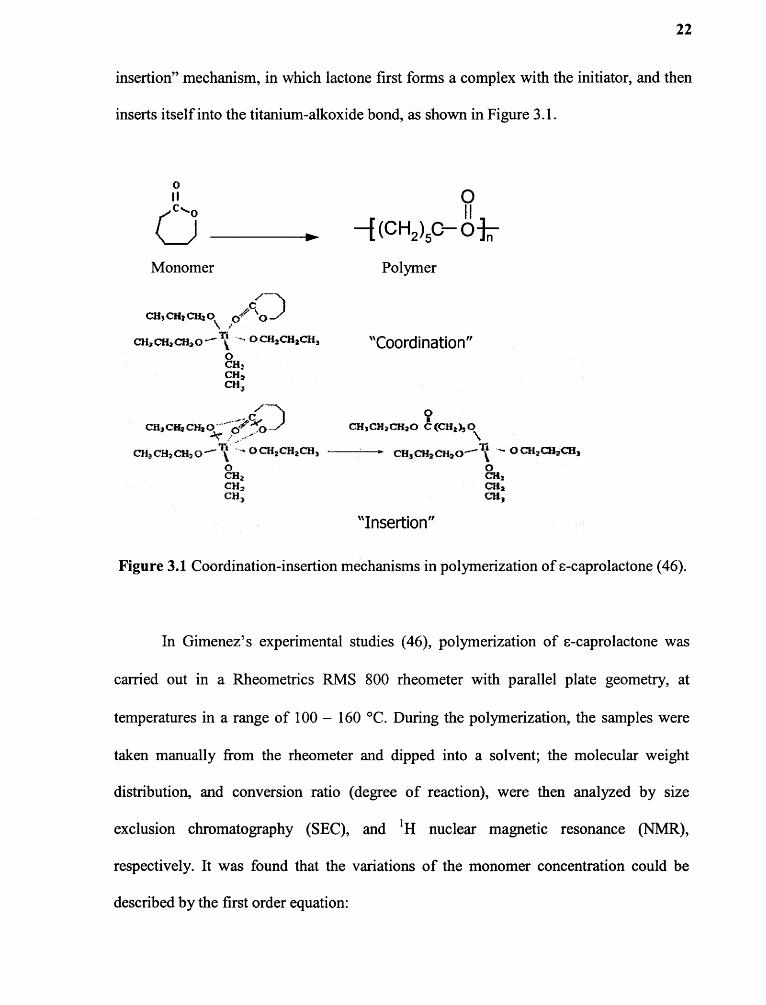
insertion" mechanism, in which lactone first forms a complex with the initiator, and then
inserts itself into the titanium-alkoxide bond, as shown in Figure 3.1.
Figure 3.1 Coordination-insertion mechanisms in polymerization of s-caprolactone (46).
In Gimenez's experimental studies (46), polymerization of s-caprolactone was
carried out in a Rheometrics RMS 800 rheometer with parallel plate geometry, at
temperatures in a range of 100 — 160 °C. During the polymerization, the samples were
taken manually from the rheometer and dipped into a solvent; the molecular weight
distribution, and conversion ratio (degree of reaction), were then analyzed by size
exclusion chromatography (SEC), and 1 H nuclear magnetic resonance (NMR),
respectively. It was found that the variations of the monomer concentration could be
described by the first order equation:

where, a, the partial order related to the initiator, is 3.25; E a, the activation energy, is
9.26 kJ/mol. [Mm and [Ir mo are monomer and initiator concentration, respectively. R is the
universal gas constant, and t the reaction time. Vergnes's work (25) showed that the
partial order, a, would depend on the reaction temperature. Typically, a is 2.74 at 100°C,
and 3.25 at 140 °C.
The value of [MV[Im quantifies the concentration of the initiator, [Ir mo, because the
polymerization is carried out without solvent. The initiator concentration [Ir mo(mol/1) can
be calculated from:
where mm and pm are the molecular weight and density of caprolactone; mid and p i are
the molecular weight and density of the initiator; r is the ratio of monomer to initiator
concentration ([MV[Im.). Table 3.1 lists the relationship between initiator concentration
[Im„ and the value of [Min, according to Equation 3.2.
The progression of polymerization is usually characterized with the conversion
ratio, C, which is defined as:
where [Mm and [MSc, are the monomer concentration (during polymerization) and the
initial monomer concentration, respectively.
Based on Equations 3.3 and 3.1, the conversion ratio during polymerization can
be given by:
Figure 3.2 shows the relationship between conversion ratio, reaction temperature
and time, based on Equation 3.6, when a = 3.25 (as in Equation 3.1b). The solid curves
represent the increase in conversion ratio versus reaction time at constant temperatures
during reaction (isothermal curves). It shows that with increasing temperature, conversion
ratio has a fast increase; the time to complete polymerization drops significantly at high
temperature. The dashed curve demonstrates the conversion ratio profile, assuming that
the temperature has a linear increase with time from 80 to 130°C during polymerization.
It is seen that the trend of conversion ratio vs. time under a non-isothermal condition
differs significantly from that under isothermal conditions. Considering the fact that large
exothermic reaction heat is released during the polymerization of s-caprolactone, the

25
increase in conversion ratio in a processing device, say, a twin-screw extruder, can not be
described by an isothermal equation.
Figure 3.2 Increase of conversion ratio at different temperatures.
Another important factor for the polymerization is the shearing and premixing
conditions of the reaction mixtures before they are fed into the extruder, which was also
studied by Vergnes et. al (25). In their experiments, two samples of the reaction mixture
were collected: one from the bottle containing the reactive mixture, the other from the
injection pipe (connected to extruder) after the pump. Rheological characteristics of these
two samples during polymerization were investigated at 100°C and 140°C, respectively,
as shown in Figure 3.3. These data indicate that the effect of premixing on
polymerization is small, although it becomes more significant at 100°C than at 140°C.
This suggests that it is acceptable to assume an ideal mixing between monomer and
initiator in the numerical simulation.

3.1.2 Molecular Weight During Polymerization
Experimental data (46) show that the length of polymer chain depends directly upon the
ratio MAW High ratio would result in large weight averaged molecular weight. When
[MV[I]o is in a range of 100-1500, a global linear equation can be used to describe the
relationship between weight averaged molecular weight and conversion ratio:
where Mob is the molecular weight of E-caprolactone; K[miimo depends only on [MV[I]o
when the temperature is in a range from 100°C to 160 °C, and may be expressed in the
from:

27
3.1.3 The Viscosity Model
The numerical simulation of reactive extrusion requires a rheological model, which
predicts the evolution of the rheological behavior of the reaction system at any reaction
time and processing conditions, such as temperature, initiator concentration, and shear
rate. In the polymerization of c-caprolactone, the viscosity model should include two
parts: a rheological model for bulk poly-s-caprolactone with different conversion ratios,
and a dilution effect of monomer upon the viscosity of the reaction system. The latter
should be considered because the monomer remains in the reactive system until the
polymerization is complete. Such a monomer dilution effect strongly modifies the
viscoelastic behavior of the reaction system.
1. Viscosity model for bulk poly--caprolactone
Based on the experimental results (46), the viscosity of bulk poly-c-caprolactone at
different temperatures, shear rates and conversion ratios can be modeled with the
generalized Yasuda-Carreau equation (52-53):
where n = 0.52, and a = 1.05 characterizes the shear-stress level at which is in the
transition between Newtonian and shear thinning behavior, given by:
where Eb is the flow activation energy (40.O kJ/mol), T. is the reference temperature
(140°C). -14, is the weight averaged molecular weight, expressed by Equation 3.7.

28
The zero shear viscosity Rio of poly-s-caprolactone samples in the power law zone
where the critical molecular weight, me , is about 6000g/mol.
2. Dilution effect
Considering the presence of monomer in the reaction system, the critical molecular
weight, Mc, and the entanglement molecular weight, me, would depend on the
concentration of polymer in solution, cp (54-55):
The viscoelastic parameters of the reaction system are modified with respect to the
parameters of the bulk polymer (56). For instance, the intrinsic viscosity of the reaction
system, ios, is changed to be:
In Rouse regime,
In entangled regime:
According to Bistrup and Macosko (57), the monomer friction factor, i.e. the free
volume, changes with the degree of polymerization due to the evolution of the glass

29
transition temperature. This should be taken into account in the polymerization of
s-caprolactone. Thus, the viscosity of the reaction system after considering the free volume
correction takes the following form:
in which rhos refers to Equations 3.14 and 3.15. The free volume correction during
polymerization of s-caprolactone would be:
where Eb and Es are the flow activation energy for the bulk and solution systems,
respectively. If assuming an additive law of the free volume (46), E s can be related to Eb
as:
in which the flow activation energy of the monomer, monomer, is about 29 kJ/mol. In this
study, the concentration of polymer, cps, is assumed to be equal to the conversion ratio, C,
with the assumption that the density of the reaction system does not have a significant
change during the polymerization. Furthermore, heat capacity, heat conductivity, and heat
of reaction were also assumed to remain constant during polymerization. Thus, the zero
viscosity rh o of poly-c-caprolactone during polymerization is expressed as:
In the power law zone (Mw > M c ):
3.2 Governing Equation for Reactive Extrusion
3.2.1 Equations of Fluid Mechanics
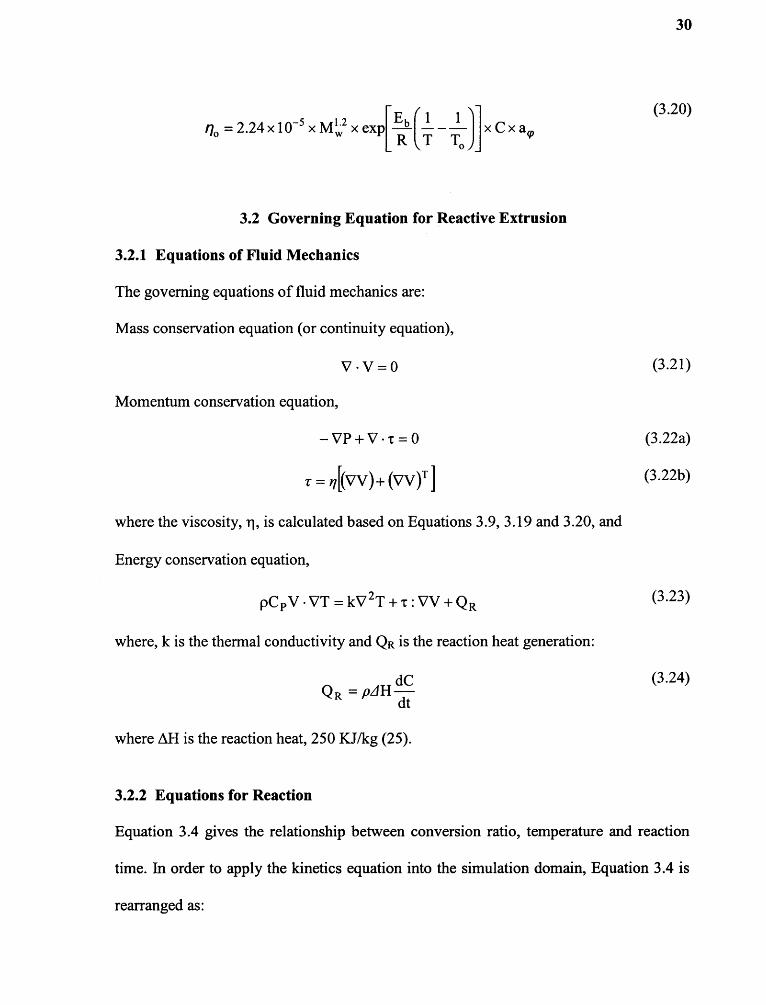
The governing equations of fluid mechanics are:
Mass conservation equation (or continuity equation),
Momentum conservation equation,
where the viscosity, is calculated based on Equations 3.9, 3.19 and 3.20, and
Energy conservation equation,
where, k is the thermal conductivity and QR is the reaction heat generation:
3.2.2 Equations for Reaction
Equation 3.4 gives the relationship between conversion ratio, temperature and reaction
time. In order to apply the kinetics equation into the simulation domain, Equation 3.4 is
rearranged as:
30
31
and z-components of velocity in a three dimensional Cartesian system.
In Equation 3.25, C stands for the conversion ratio of c-caprolactone. K is
calculated based on Equation 3.1b, which was obtained from the experimental data in the
polymerization of c-caprolactone with a parallel rheometer. It is known that the flow in
the parallel rheometer is a shear flow. However, in co-rotating twin-screw extruders, the
flow field is not a simple shear flow, but a combination of shear flow and elongational
flow. Furthermore, the fluid elements in the extruders could be re-oriented, stretched and
folded. This suggests that the kinetics equation of reaction from the experiments in
parallel rheometer may diverge from that in the extruder, due to the different flow
behaviors in these two devices. Some studies have been done to investigate the effects of
flow on reaction (58) and the influence of mixing mechanisms on multi-component
reactions in counter-rotating twin-screw extruders (59).
Numerical simulation of mixing in kneading blocks (60-61) show that the shear
flow occupies a large portion of flow in twin-screw extruders. Furthermore, as shown in
Figure 3.3, the initial mixing between monomer and initiator does not have significant
effects on polymerization, and the effect of flow behavior on reaction is insignificant
when the reaction is completed in a relatively short time (58). This suggests that the
kinetics equation for the polymerization of c-caprolactone based on the parallel
rheometer can be an approximation of that in the co-rotating twin-screw extruder. Thus,
in the present investigation, two assumptions were made in the simulation:

32
1. The monomer and initiator are uniformly mixed (ideal mixing) and
2. The kinetic equation from the parallel rheometer can be used in the twin-screw
extruders.
3.3 Computational Techniques
Generally, Finite Element Method (FEM) is employed in the simulation of flow behavior
of polymer melt in twin-screw extrusions (40-41, 60-76). Two commercial Finite
Element Analysis software, i.e. FIDAP and POLYFLOW, have been used in some
studies (40-41, 60-64). Recently, Hrymak et al. (77) used FLUENT, a commercial
Computational Fluid Dynamics (CFD) software based on Finite Volume Method, to
predict the flow patterns in kneading blocks of an intermeshing co-rotating twin screw
extruder. The velocity contours from the simulation agree well with the experimental data
from Particle Image Velocimetry (PIV). This indicates that it is feasible to employ
FLUENT in the simulation of processes involving twin-screw extruders. Because
FLUENT is based on Finite Volume Method, it requires lower computation cost, if
compared with Finite Element Method. In this study, FLUENT 6.O was employed to
solve the governing equations of reactive extrusion.
However, like most of the current numerical simulation packages, FLUENT can
not deal with partially-filled channel flow. This means that it is not possible to employ
FLUENT directly in the simulation of reactive extrusion in twin-screw extruders, because
the screw channel in twin-screw extruders is either fully-filled or partially-filled (as
described in Chapter 1). Consequently, in this investigation, the simulation of the
polymerization of oft-caprolactone in twin-screw extruders was divided into four steps:

33
• Use FLUENT to carry out 3-D simulation of polymerization of c-caprolactone infully-filled screw elements under various temperatures, screw rotational speeds, andinitiator concentrations;
• Compare the simulation results based on 3-D model and those from 1-D channelmodel, and to find out the dominant factors for the polymerization;
• Propose a model to predict the reaction in the partially-filled channels, based on thesimulation results in the fully-filled channels from the 3-D model, and features of flow inthe partially-filled channels (discussed in Chapter 7);
• Calculate the polymerization progressing globally in the extruder, based on themodels for the partially-filled and fully-filled channel model;
It is known that FLUENT is a general program for fluid mechanics. When it is
applied to a specific case, such as the simulation of reactive extrusion, three additional
steps should be followed:
1. Generate 3-D mesh for different screw elements of twin-screw extruders.
2. Define a User Defined Scalar (ADS) to solve the reaction equation, as in Equation3.25.
3. Define User Defined Functions (UDFs) for the viscosity model duringpolymerization, the heat from reaction, and the source term for the UDS.
Each of these steps will now be described in detail.
I. Generate 3-D mesh for different screw elements of twin-screw extruders.
Generation of 3-D mesh is a tedious task because of the complex geometry of screw
elements in twin-screw extruders. In the current study, a C++ program was used to
generate the 3-D mesh for FLUENT.
In twin-screw extrusion, the flow domain changes with screw rotation. Currently,
in the simulation of flow in twin-screw extruders, the dynamic motion of screw is treated
as a number of quasi-steady state analyses of the sequence geometries. For instance,
Figure 3.4 shows that a quarter of a complete cycle of a kneading block can be described
with 8 quasi-steady states (70).
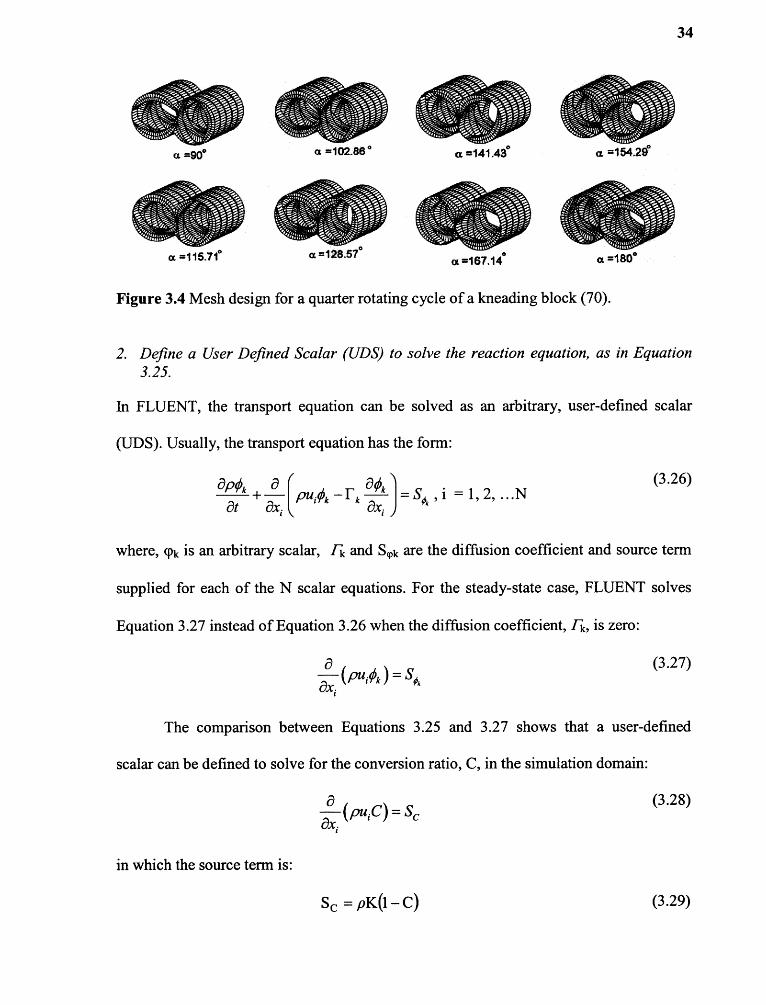
2. Define a User Defined Scalar (UDS) to solve the reaction equation, as in Equation3.25.
In FLUENT, the transport equation can be solved as an arbitrary, user-defined scalar
(UDS). Usually, the transport equation has the form:
where, (Lk is an arbitrary scalar, Tic and S q,k are the diffusion coefficient and source term
supplied for each of the N scalar equations. For the steady-state case, FLUENT solves
Equation 3.27 instead of Equation 3.26 when the diffusion coefficient, Tic, is zero:
The comparison between Equations 3.25 and 3.27 shows that a user-defined
scalar can be defined to solve for the conversion ratio, C, in the simulation domain:
in which the source term is:

35
3. Define User Defined Functions (UDFs) for the viscosity model duringpolymerization, the heat from reaction, the source term for the User-Defined Scalar.
A user-defined function (UDF) is a function programmed by users that can be
dynamically linked with the FLUENT solver to enhance the standard features of the code.
UDFs can be used for a variety of applications, such as customization of boundary
conditions, material property definitions, surface and volume reaction rates, diffusivity
functions, source terms in FLUENT transport equations or in user-defined scalar (UDS)
transport equations. As discussed in the preceding sections, the viscosity of the reaction
system (Equation 3.9), heat from reaction (Equation 3.24) and the source term for ADS
(Equation 3.29) are not constant during polymerization; they could be functions of
conversion ratio, temperature and/or shear rate. Accordingly, three User Defined
Functions should be defined.
The procedure followed in the application of FLUENT in reactive extrusion is
summarized in Figure 3.5. It consists of three steps, preprocessing, solver, and post-
processing. In the preprocessing, the 3-D mesh for the simulation domain is generated;
the boundary conditions for temperature, velocity, pressure, and User-Defined Scalar are
applied; the parameters for the reactive system, such as density, heat capacity and heat
conductivity, are initialized; the solution method for equations is selected. In this study,
the equations are solved with a segregated procedure. In the solver, all of the equations
are solved with the segregated approach, in which the energy source term from reaction
heat and the viscosity of the system are calculated by User Defined Functions. The
solution is completed once it reaches convergence. In the preprocessing, FLUENT not
only gives the contour plots of parameters (including temperature, velocity, pressure,
viscosity, and so on), but also offers some functions for the calculation of the parameters,
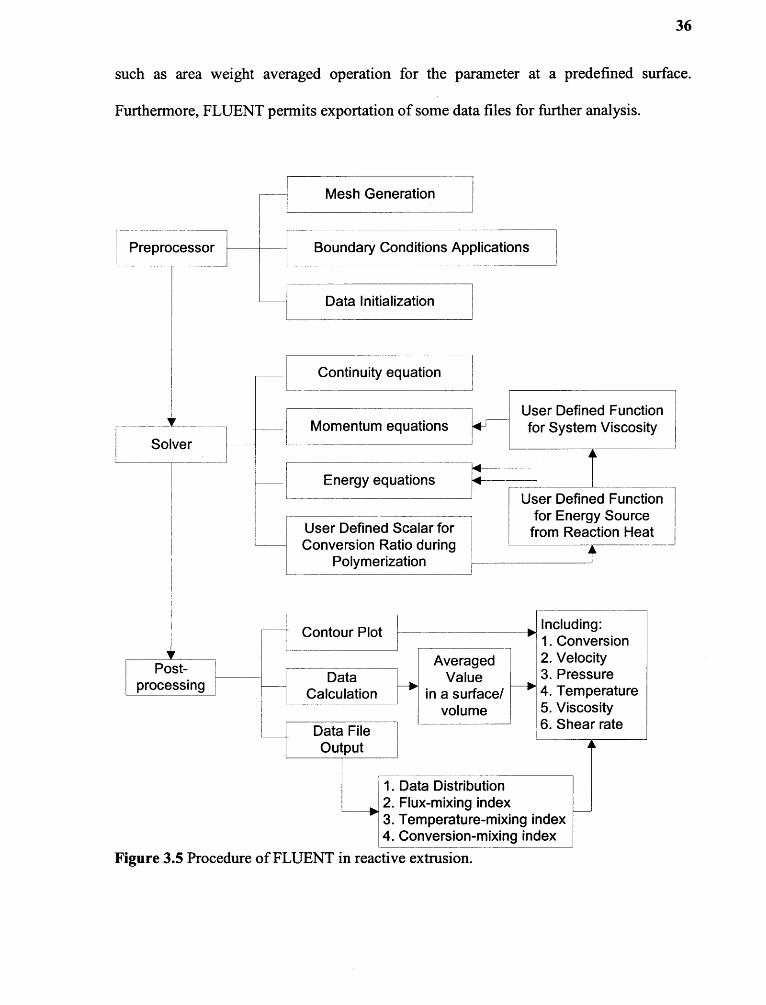
36
such as area weight averaged operation for the parameter at a predefined surface.
Furthermore, FLUENT permits exportation of some data files for further analysis.

37
3.4 Conclusions
In the numerical simulation of reactive extrusion, continuous equation, energy equation
and kinetics equations for reactions were solved, coupled with the non-Newtonian
characteristic of the reaction system. In this study, polymerization of c-caprolactone was
selected as a model system. The information required in the numerical simulation of
polymerization was obtained from studies of Gimenez and Vergnes.
The polymerization of c-caprolactone in co-rotating twin-screw extruders was
modeled with Finite Volume Method, using a commercial CFD package FLUENT. A
C++ code was used to develop data files to generate 3-D mesh of the simulation domain.
The kinetics equation for polymerization was reformatted so that it can be incorporated
into FLUENT with a User Defined Scalar. The rheological model of reaction system, the
source term for reaction heat and the source term for the kinetics equation were
incorporated into FLUENT with User Defined Functions.
In the simulation with FLUENT, some calculation results can be exported as data
files. This makes it possible to carry out further analysis about the polymerization
kinetics in twin-screw extruders, as discussed in Chapters 5 and 6.

CHAPTER 4
VALIDATION OF NUMERICAL SIMULATIONOF POLYMERIZATION WITH FLUENT
As presented in the previous chapter, in FLUENT, User Defined Scalar was introduced to
solve the kinetics equation for the polymerization of c-caprolactone, and User Defined
Functions were used to include the viscous model, source term for the reaction heat in the
energy equation and source term for the kinetics equation. On the other hand, FLUENT
cannot deal with the continuous rotating of screws in the twin-screw extruders, and thus a
quasi-steady state simulation was carried out. This chapter is comprised of two sections.
The first one validated the simulation method for the polymerization of s-caprolactone
based on FLUENT, and the second section investigated the effect of channel geometries
with different initial angles upon the simulation results in the steady state analysis.
4.1 Validation of Simulation with FLUENT
In this section, the simulation method for the reaction based on FLUENT was validated
with the polymerization of s-caprolactone in a pipe flow (Figure 4.1). The polymerization
progression in a pipe is predicted with FLUENT, and the simulation results are then
compared with the data based on the kinetics equation (see Equation 3.6). The reason for
selecting pipe flow as a validation model is that the flow in the pipe channel is so simple
that the kinetics equation can be easily applied.
As shown in Figure 4.1, the pipe channel has a length of 80 mm and a width of 4
mm. Two cases have been studied, isothermal and adiabatic, as shown in Table 4.1. In the
isothermal case, the temperature of the reaction system is assumed to remain constant
38

39
during the polymerization. In the adiabatic case, there is no heat loss through the walls.
All of the heat from reaction is kept in the reaction system, which raises the system
temperature rapidly. The ratio of monomer to initiator concentration is 400.
In order to simplify the simulation, it was assumed that the reaction system is a
Newtonian fluid. The velocity at the inlet was fully developed and had a parabolic
distribution. The viscous dissipation in the system was neglected. It is known that the
streamlines in the pipe flow are straight lines (from inlet to outlet), which suggests that
there is no mass exchanged transversely. In order to exclude the energy exchange in the
transverse direction, the heat conductivity of the material was set to be zero (1 x10 -12 in
the simulation). Thus, the conversion ratio increase along a streamline can be easily
calculated based on the kinetics equation (Equation 3.6), with either isothermal or
adiabatic conditions.
In order to validate the simulation results from FLUENT, the profiles of
conversion ratio along the streamlines with Y = O.2 mm, 0.4 mm, O.6 mm and 2 mm in

40
the channel (see Figure 4.1) were compared with the data from the kinetics equation, as
shown in Figures 4.2 and 4.3.
Figure 4.3 Comparison of conversion ratio based on FLUENT and kinetics equation atadiabatic conditions.

41
Figures 4.2 and 4.3 show that the trends of conversion ratio along the streamlines
at isothermal conditions are entirely different from those based on the adiabatic
conditions. On the other hand, the profiles of conversion ratio along the axial length
based on FLUENT agree very well with those calculated directly from the kinetics
equation. This suggests that the simulation method for the polymerization based
FLUENT is reliable, and the program for the User Defined Scalar (UDS) and User
Defined Functions (UDFs) are correct.
4.2 Steady State Simulation Method in Reactive Extrusion
As discussed in the preceding chapter, in the modeling of flow in twin-screw extruders,
the dynamic motion of screws is treated as a number of quasi-steady state analyses with
series of geometries. The geometries of screw channels in the steady state analyses are
determined by the surfaces of screws and barrels. Because the barrel is fixed and the
screws may have an angle in a range of 0360° (see Figure 4.5), a sequence of channel
geometries is obtained. This section investigated the effects of channel geometries upon
the polymerization progression of c-caprolactone in conveying screw elements.
4.2.1 Boundary Conditions for Simulation
The conveying screw element investigated in this section is shown in Figure 4.4. The
geometry specifications of the elements are as follows: barrel diameter = 34 mm; screw
tip diameter = 33.4 mm; centerline distance = 3O mm; screw root diameter = 26 mm;
screw tip number = 2; screw pitch = 60 mm. This is a right hand conveying element,
having an axial length of 120 mm. A pair of kneading discs with a length of 20 mm,

42
which has identical axial cross section as the conveying element, is attached at the end of
the conveying element, to ensure good convergences in the simulation.
Figure 4.4 Geometry of conveying screw element.
It is assumed that temperatures at the inlet and barrel surface are 420 K, and the
screw surface has an adiabatic condition. The conversion ratio at the inlet is O.6 and the
flow rate is 3.15 kg/hr. The ratio of monomer to initiator concentration is 800, and the
screw rotates at 287 rpm. The flow is fully developed at the exit of the simulation
domain. The gradient of the conversion ratio is assumed to be zero at barrel and screw
surfaces.
As shown in Figure 4.5, the rotation of screws can be described with angle 0.
Here, 0 is the initial angle of lobes at the inlet. In a quarter of a rotation cycle, 0 increases
from O° to 90°. In this study, the moving of screws in a quarter of a complete cycle was
treated with ten quasi-steady state analyses, in which the step for the angle increase is

43
10°. Accordingly, ten 3-D meshes were generated in the analyses. As an example, Figure
4.6 shows the geometry of the channel and the mesh at the inlet of the simulation domain
in the steady state simulation, with 0 at 0°, 30°, 60° and 90°, respectively.
Figure 4.5 Dynamic rotation of screws.
The velocity distribution at the inlet of the simulation domain is an important
boundary condition in the numerical simulation. In this study, the axial velocity profile at
the inlet was calculated as follows. First, a simulation of Newtonian and isothermal flow
in the screw element was carried out, in which the fluid viscosity was calculated based on
the temperature and conversion ratio at the inlet, and the axial velocity at the inlet was
assumed to have a uniform distribution (calculated according to the flow rate). After the
simulation, the velocity distribution in the simulation domain was obtained. Because the
screw tip number of the element is 2 and the pitch is 60 mm, the cross section at Z = 30
mm has the same geometry as the inlet (as shown in Fig. 4.4). Hence, the calculated axial
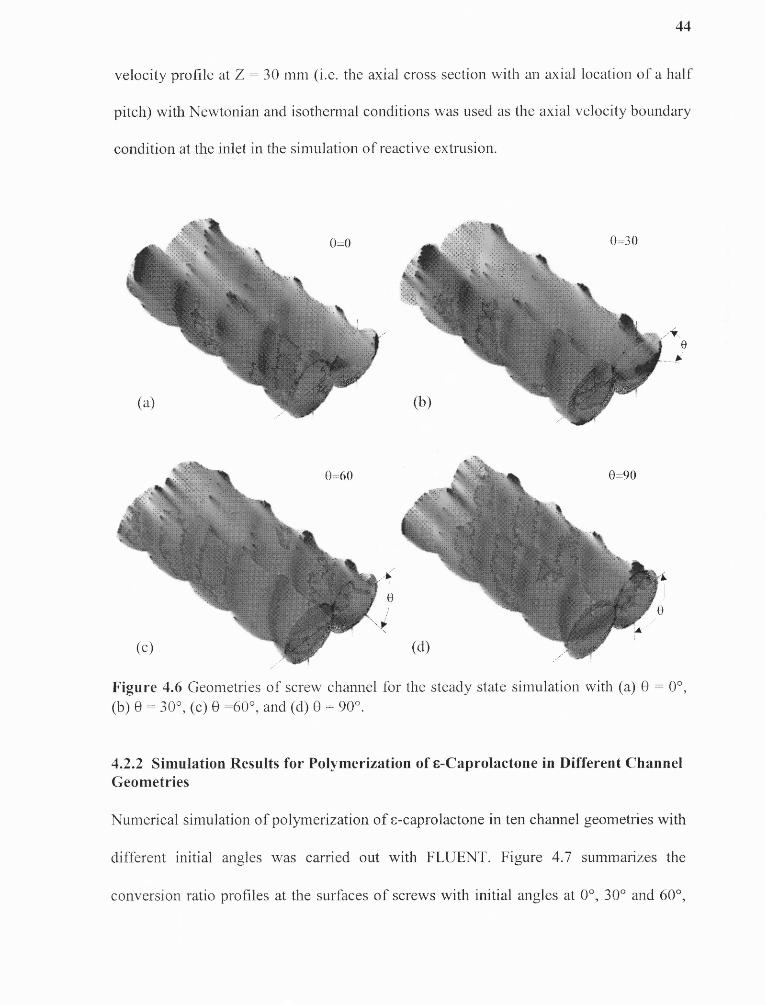
44
velocity profile at Z = 30 mm (i.e. the axial cross section with an axial location of a half
pitch) with Newtonian and isothermal conditions was used as the axial velocity boundary
condition at the inlet in the simulation of reactive extrusion.
4.2.2 Simulation Results for Polymerization of Caprolactone in Different ChannelGeometries
Numerical simulation of polymerization of c-caprolactone in ten channel geometries with
different initial angles was carried out with FLUENT. Figure 4.7 summarizes the
conversion ratio profiles at the surfaces of screws with initial angles at O°, 30° and 60°,

45
respectively. These pictures show that the magnitudes of the conversion ratios at an
identical axial position are similar in different screw geometries. This suggests that the
effect of initial angle of screws on polymerization progression is very small. Figure 4.8
illustrates the calculated results of the distributions of conversion ratio at the axial cross
section with Z = O.06 m in screw elements with different initial angles. It is seen that the
shape of the distribution curves depends on the initial angle, but not large.
In order to evaluate the polymerization in different geometries, the area weighted
average conversion ratio, temperature, viscosity, pressure and shear rate along the axial
length were calculated (see Equation 5.2), and shown in Figure 4.9. These plots show that
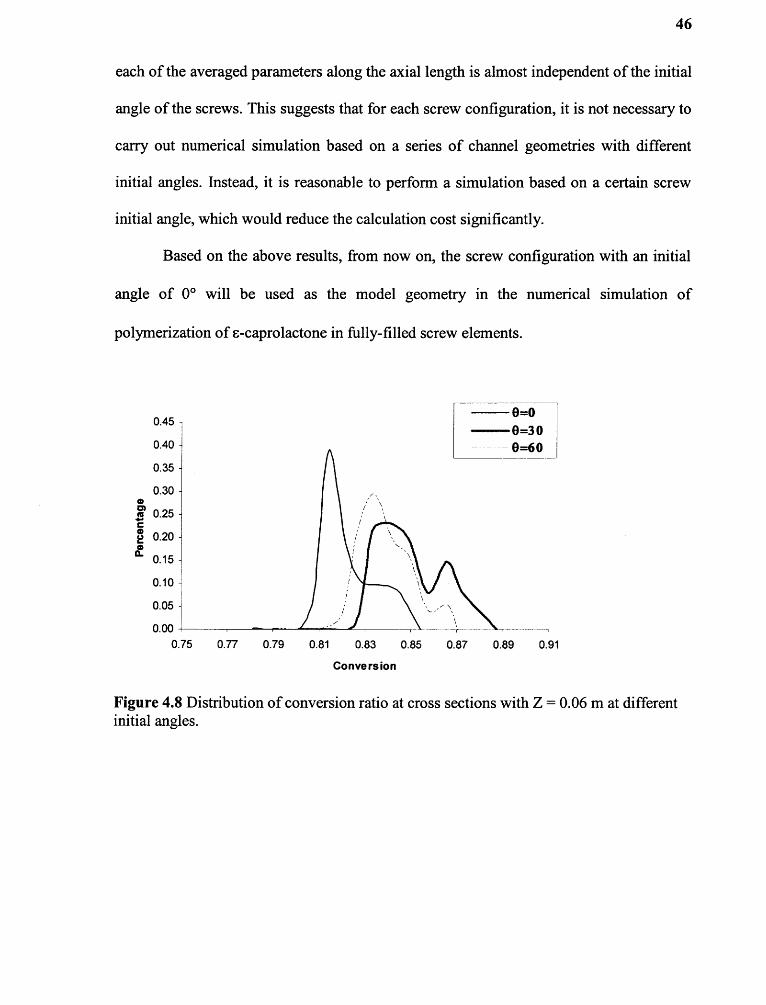
46
each of the averaged parameters along the axial length is almost independent of the initial
angle of the screws. This suggests that for each screw configuration, it is not necessary to
carry out numerical simulation based on a series of channel geometries with different
initial angles. Instead, it is reasonable to perform a simulation based on a certain screw
initial angle, which would reduce the calculation cost significantly.
Based on the above results, from now on, the screw configuration with an initial
angle of 0° will be used as the model geometry in the numerical simulation of
polymerization of c-caprolactone in fully-filled screw elements.
Figure 4.8 Distribution of conversion ratio at cross sections with Z = 0.06 m at differentinitial angles.

47

48
4.3 Conclusions
In this chapter, the simulation method for polymerization based on FLUENT was
validated with a pipe flow. It is seen that the simulation results predicted with FLUENT
agree well with those calculated directly from the kinetics equation, indicating that the
application of FLUENT in predicting polymerization progress is reliable.
The polymerization progressions of caprolactone in conveying screw elements
with different initial angles were calculated with quasi-steady state simulation method.
The simulation results show that the effect of the initial angle of conveying elements
upon polymerization progression is small. This suggests that in the reactive extrusion, it
is reasonable to carry out the steady-state numerical simulation based on the screw
channel with a certain initial angle, instead of series of channel geometries with different
initial angles. This would reduce the calculation cost significantly.

CHAPTER 5
POLYMERIZATION OF E-CAPROLACTONE IN FULLY-FILLEDCONVEYING ELEMENTS: SIMULATION RESULTS AND DISCUSSION
As mentioned in Chapter 1, conveying elements and kneading blocks are two
commercially available screw elements in co-rotating twin-screw extruders. During
processing, conveying elements could be either fully-filled, or partially-filled. In this
chapter, the conveying elements are assumed to be fully-filled and modeled by a 3-D
simulation method. The simulation of reaction in the partially-filled screw elements is
discussed in Chapter 7. This chapter consists of two sections. The first one investigated
the effects of screw geometry, operational condition, initiator concentration of reactive
system and screw dimension on reaction, based on the 3-D simulation method. The
second section compared the simulation results between 3-D model and 1-D model.
5.1 Simulation of Polymerization of E-Caprolactonein Conveying Elements with 3-D Model
In conveying elements, screw pitch and helical direction (forward or reversed) are two
important parameters, because they determine the conveying and mixing mechanism of
polymer melt in the elements. In this section, two systems were studied, in which system
No. 1 has a screw diameter of 34 mm and system No. 2 has a diameter of 68 mm, as
listed in Table 5.1. For system No. 1, four elements were investigated, and for system No.
2, two elements were studied (Table 5.2).
In order to ensure that the iteration reaches convergence easily in the simulation,
an extensional disc, which has identical end view as the screw element, was added at the
49

50
end of the screw element. The dimensions of the screw element and the extensional disc
are listed in Table 5.1 and shown in Figure 5.1.
Three-dimensional mesh of the simulation domain was generated with 8-node,
brick elements, as shown in Figure 5.N. As discussed in the preceding chapter, the screw
with an initial angle of 0° was used as the model geometry in the simulation, instead of a
sequence of screw geometries. The number of elements for the conveying screw element
is 179,200, and it is 22,400 for the extensional disc domain. The length of the reversed
element SENOR is 20 mm, which is composed of 67,200 brick elements; its extensional
disc is 7.5 mm long, and has 22,400 brick elements.

Disc, L =20 mm Cross Sectionwith Z = 0.06 m
Conveying elementL = 120mm
Z = Omm
(a)
(b)
(c)
51
Figure 5.1 Geometry of conveying elements (a) SE2O, (b) SE4O, (c) SE6O. (The arrow in(a) shows the flow direction of melt in screw elements).
(a)
(b)Figure 5.2 Mesh of conveying screw element SE6O at (a) screw surface, and (b) barrelsurface.

52
Table 5.3 shows the boundary conditions for the simulation, in which the effects
of screw rotational speed, inlet and barrel temperatures, and concentration of initiator on
reaction are considered. It is assumed that the screw surface has adiabatic heat transfer
conditions, and the barrel maintains constant temperature during the reaction. The
gradient of the conversion ratio at barrel surface, screw surface, and outlet of simulation
domain is assumed to be zero. The effect of flow rate on reaction is obvious, since
decreasing in flow rate means increase in residence time. As shown in Figure 3.2, the
degree of reaction rises with increase in reaction time (i.e. decrease in flow rate). The
simulation results of the effects of flow rate on polymerization are not covered in this
thesis; these have been reported elsewhere (78).
elements, SE20F, SE4OF and SE60F, were studied. Figure 5.3 summarizes the conversion
ratio profiles at the top surfaces of these conveying elements, in which the reaction
system is conveyed from left to right. These pictures show that the patterns of the

53
conversion at screw surfaces depend on screw geometries: with increasing screw pitch,
the conversion ratio has a faster increase.
Figure 5.4 shows the conversion distribution at the axial cross section with Z =
0.06 m in SE2OF and SE60F (see Figure 5.1a), respectively. It is seen that the conversion
ratio at the axial cross section is not uniform. The distribution of conversion ratio changes
when the screw pitch is increased. In SE20F, the region with high conversion ratio is
located near the barrel surface, whereas in SE60F, the maximum conversion appears in
the area close to the center of the screw channel. However, in both SE20F and SE6OF, the
conversion ratio near the screw surfaces is lower than that in other regions. Figure 5.4
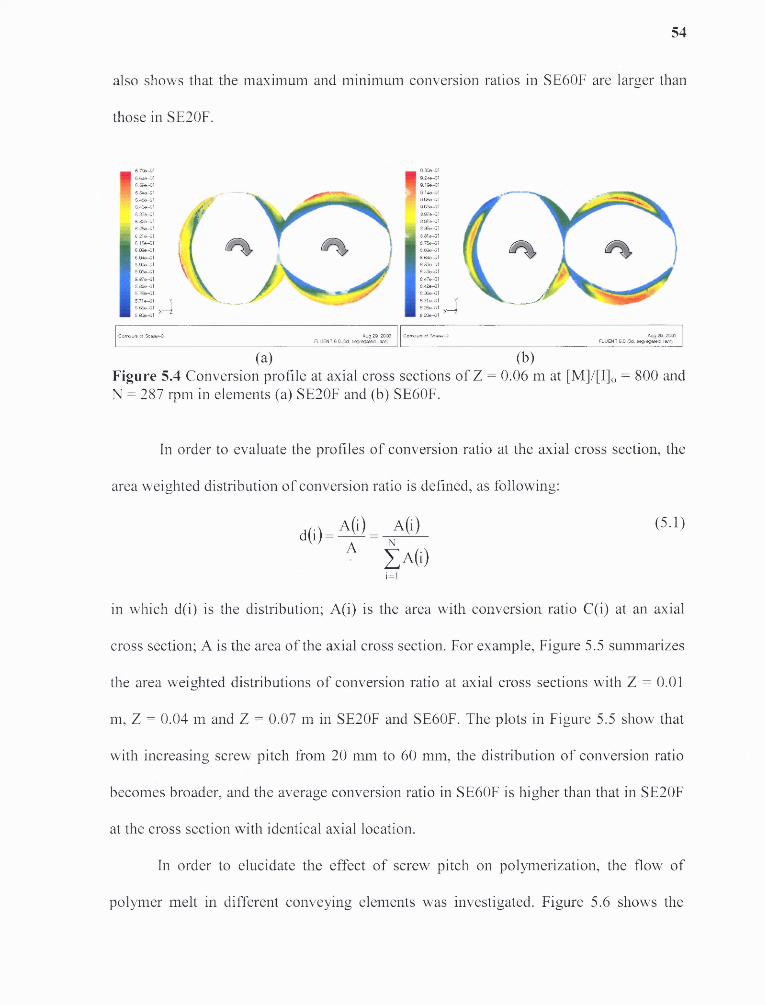
54
also shows that the maximum and minimum conversion ratios in SE20F are larger than
those in SE20F.
In order to evaluate the profiles of conversion ratio at the axial cross section, the
area weighted distribution of conversion ratio is defined, as following:
in which d(i) is the distribution; A(i) is the area with conversion ratio C(i) at an axial
cross section; A is the area of the axial cross section. For example, Figure 5.5 summarizes
the area weighted distributions of conversion ratio at axial cross sections with Z = O.01
m, Z = 0.04 m and Z = O.07 m in SE2OF and SE60F. The plots in Figure 5.5 show that
with increasing screw pitch from 20 mm to 20 mm, the distribution of conversion ratio
becomes broader, and the average conversion ratio in SE20F is higher than that in SE2OF
at the cross section with identical axial location.
In order to elucidate the effect of screw pitch on polymerization, the flow of
polymer melt in different conveying elements was investigated. Figure 5.2 shows the

55
patterns of the positive axial velocity (i.e. velocity along the downstream direction) in the
cross section with Z = 0.02 m in SE2OF, and SE6OF, respectively. In order to make the
contour clearer, the region with negative axial velocity is hatched with the grid only, and
the patterns of the negative axial velocities are not displayed. Figure 5.2 reveals that in
the cross section, a large fraction of fluid elements have negative axial velocity. These
fluid elements move upstream, not downstream. Furthermore, the maximum positive
axial velocity in SE6OF is larger than that in SE2OF.

56
Analogous to the definition of the area weighted distribution of conversion ratio
(Equation 5.1), the area weighted axial velocity distribution was calculated. Figure 5.7
shows the distributions of the axial velocity at the axial cross section with Z = O.06 m in
SENOR and SENOF. It is seen that the axial velocity has a much broader distribution in
SENOF than in SENOR.
The effects of velocity profiles on polymerization can be further interpreted by
tracing the movement of fluid elements (i.e. streamlines) in the conveying elements.
Figure 5.6 has already revealed that some fluid elements have negative axial velocities,
and move toward the upstream. Figures 5.8a and b show the streamline of a fluid element
initially located at (O.029, 0, 0.06), as marked by P1 in Figure 5.6. It is found that the
element follows a very complex streamline in the screw channel. Globally, the element
moves upstream. However, it could move downstream for a certain distance, and then
move upstream. This is the mechanisms for the axial and transverse mixing. Figures 5.8b

57
and c show that the displacement of the fluid element along the axial length is smaller in
SE2OF than that in SE6OF, although the lengths of the streamlines in these two cases are
the same. This indicates that the axial mixing in SENOF is weaker than that in SE6OF.
Furthermore, the time required to move the element at a certain length along the
streamline in SE2OR is longer than that in SE6OR (as indicated by the legend in Figure
5.8). This is because the axial velocity distribution in SENOR is narrower than in SE60F
(Figure 5.7). The longer moving time of the fluid element in SENOR also suggests that the
axial mixing in SE2OF is weaker than in SE6OF.

58
In this thesis, the fluid elements with downstream velocities are denoted as
forward-flow and those with upstream velocities as back-flow. The forward-flow pushes
the reaction system downstream, as the conversion ratio increases along the flow
direction. The back-flow carries the fluid upstream. Because the conversion ratio in the
downstream is higher than in the upstream, the back-flow helps to increase the
conversion ratio at the upstream. Hence, the increase in conversion ratio in the conveying
elements is a competing consequence between the forward-flow and back-flow. This
implies that the conversion ratio profile depends not only on the ratio of back-flow rate to
forward-flow rate, but also on the local distribution of conversion ratio.
Figure 5.9 demonstrates the calculation results of the area weighted average
conversion ratio, temperature, viscosity, pressure and shear rate along the axial length in
different conveying elements. Here, the area weighted average operation at an axial cross
section is defined as:
where A(i) and are the area and the calculated parameter at cell i at an axial cross
section. N is the total number of cells at the cross section.
Figure 5.9a shows that, globally, the conversion ratio has a fast increase with
increasing screw pitch, from 20 mm to 40 mm, and 60 mm. As discussed previously, this
is due to the fact that the axial mixing is enhanced when the screw pitch is raised. It is
seen that with decreasing screw rotational speed, the reaction becomes faster. This can be

59
attributed to the weak heat transfer at the barrel surface at low screw speed (see Figure
5 . 1 0).

60
Figure 5.9b reveals that the temperature profile along the axial length depends on
the screw rotational speed. The temperature increases monotonously along the axial
length, when the screw speed is 287 rpm. At 48 rpm, the temperature rises first, reaching
a maximum value at a certain position close to the channel entrance, and then drops
gradually. Moreover, the maximum temperature at 287 rpm is lower than that at 48 rpm.
This is due to the fact that the heat from reaction, which depends on the increase in
conversion ratio, is the dominant energy source. As shown in Figure 5.9a, at 48 rpm, the
conversion ratio has a fast increase and jumps to about 1 in a very short axial distance
along the channel, causing the appearance of the temperature peak there. The lower
increase in temperature at 287 rpm near the channel inlet is due to the smaller increase in
conversion ratio but the larger heat loss at the barrel surface.
The decrease in temperature at the downstream of Z = O.03 m at 48 rpm means
that the heat transfer between the reaction system and barrel surfaces plays an important
role there. Because the temperature at barrel surfaces remains constant during
polymerization and the screw surface has an adiabatic condition, the reaction system with
high temperature would release its energy through the barrel surface. Considering the fact
that the reaction is complete at an axial location about 0.03 m, the temperature profile at
the downstream of Z = O.03 m relies on the competition between viscous dissipation and
heat loss at the barrel surface. Although the viscosity of the system is quite high at 48
rpm (in a range from 300 to 800 Pa-s, as shown Figure 5.6c), the shear rate is very low
(about 40 s -1 , Figure 5.9e). However, the melt temperature is much higher than the barrel
temperature, which is 400 K. This indicates that the heat loss at the barrel surface is
larger than the viscous dissipation, causing the decrease in temperature along the axial

61
length beyond Z = 0.03 m, at N8 rpm. The monotonous increase of temperature along the
channel at 287 rpm is due to the fact that the polymerization is not complete even at the
channel exit, and the heat from polymerization is larger than the heat loss at the barrel.
In the simulation, the inlet pressure was set to zero. Thus, a positive pressure at
the channel exit means that the element builds pressure, while a negative pressure means
that the pressure is consumed in the element, i.e. the inlet has a higher pressure than the
outlet. Figure 5.9d shows that the pressure rises along the axial length. For SENOR and
SE6OF, the pressure at the channel exit rises with increasing screw speed. However, the
pressure in SE2OF is lower at 287 rpm than that at N8 rpm. This is because the pressure
gradient in conveying elements depends on screw speed, system viscosity, and screw
geometry. In SE20F, the variation in viscosity is a more important role than the increase
in screw speed. Figure 5.9e shows that the shear rate drops with decreasing screw speed.
The effect of screw geometry on shear rate is very small at N8 rpm, but is significant at
287 rpm.
In order to explain the effect of screw rotational speed on the heat transfer at the
walls, the velocity profile at the mid-line of the channel at Z = O.06 m (marked line L 1 in
Figure 5.6b) is calculated and demonstrated in Figure 5.10. It is seen that with decreasing
screw speed, the velocity gradient near the barrel surface drops. It is known that the heat
loss through the barrel surface depends on the convection near the wall, which relies on
the velocity gradient. The small gradient of velocity means low convection near the wall,
which leads to the decrease in the heat loss through the barrel. Consequently, more heat
from reaction is retained in the reaction system at a low screw speed, resulting in a faster
polymerization.

62
5.1.1.2 Axial Mixing Mechanisms in Screw Elements. As discussed previously, the
progression of polymerization in conveying elements not only depends on the back-
mixing capacity, but also relies on the local variation in conversion ratio. The flow of
polymer melt in a screw channel is usually evaluated by the pressure-to-drag flow ratio,
which is defined as the ratio of pressure flow rate to drag flow rate.
As shown in Figure 5.6, in the axial cross sections of conveying elements, some
fluid elements move downstream (with positive axial velocity), and others moves
upstream. This indicates that the fluid elements in a cross section can be divided into two
groups: the fluid with positive (downstream) velocity, and that with negative (upstream)
velocity. In this study, the axial mixing in screw elements is evaluated with the flux
mixing coefficient, GF, following the definition proposed by White (6):
where QB is the back flow rate; QF is the forward flow rate and QN the net flow rate.

63
Figure 5.11 shows the plots of the flux-mixing coefficient in SE20R and SE6OR at
N8 rpm and 287 rpm, respectively, as a function of axial length. It is seen that the flux-
mixing coefficient is higher in SE60F than SE2OF, especially at 287 rpm. As discussed
previously, the conversion ratio in SE60F has a faster increase than that in SE20F, which
can be correlated to the fraction of the back-flow rate, i.e. the flux-mixing coefficient.
Figure 5.11 also indicates that the flux-mixing coefficient drops with decreasing screw
rotational speed. However, the polymerization is faster at N8 rpm than at 287 rpm. This
suggests that the flux-mixing coefficient is not sufficient in evaluating the reaction
process. This is due to the fact that, in reactive process, there is not only mass exchange,
but also temperature and species exchanges as well.

64
Following the definition of the flux-mixing coefficient, in the present study, two
more parameters are defined to characterize the axial mixing in conveying elements
during reactive extrusion:
1. Temperature mixing index, AT
In Equations 5.N and 5.5, F and B stand for the forward and back flux, respectively; Q is
the flow rate. C and T are conversion ratio and temperature. Nb and Nf are the number of
the cells with forward and reversed axial velocity, respectively. A and V are the area and
axial velocity of a cell at an axial cross section.
The values of temperature-mixing coefficient, and conversion-mixing coefficient,
represent the exchange in temperatures, and conversion ratios, respectively, among fluid
elements at an axial cross section. Figure 5.12 shows the conversion ratio mixing
coefficient and temperature mixing coefficient in conveying elements SE20F and SE6OF
at 287 rpm and N8 rpm. Globally, both the conversion mixing coefficients and
temperature mixing coefficients are higher in SE6OR than SE2OF, and drop with
decreasing screw rotational speed. This indicates that the exchange in conversion ratio
and temperature between the forward flux and back flux is more intensive in SE6OR than
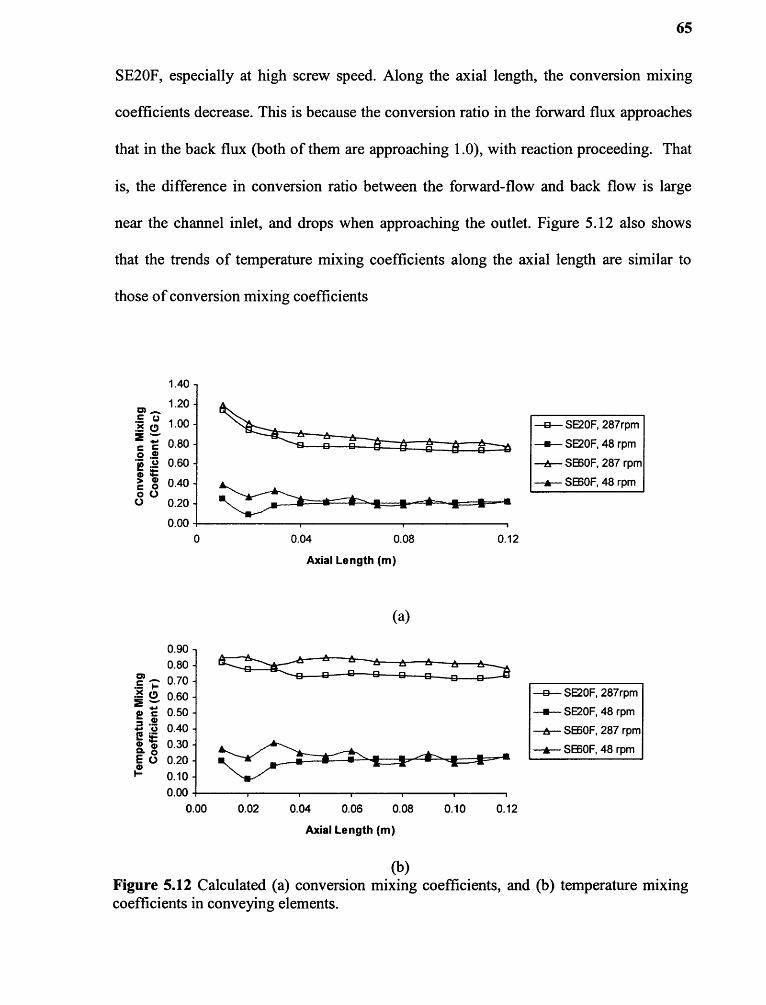
65
SE2OF, especially at high screw speed. Along the axial length, the conversion mixing
coefficients decrease. This is because the conversion ratio in the forward flux approaches
that in the back flux (both of them are approaching 1.O), with reaction proceeding. That
is, the difference in conversion ratio between the forward-flow and back flow is large
near the channel inlet, and drops when approaching the outlet. Figure 5.12 also shows
that the trends of temperature mixing coefficients along the axial length are similar to
those of conversion mixing coefficients

66
5.1.1.3 Transverse Mixing in Screw Elements. It is known that in extruders, there is
not only axial mixing between the fluids in the upstream and downstream, but also the
transverse mixing among fluid elements in the axial cross sections. As discussed in the
preceding section, the back flow could bring the fluid with high conversion ratio
upstream, in which some fluid elements would join in the forward flow due to the
transverse mixing. That is, the fluid elements in the forward flow and back flow are not
independent; they would exchange with each other due to the transverse mixing, as
illustrated in Figure 5.13. On the other hand, the transverse mixing has a large effect on
the heat transfer ability between polymer melt and the barrel surface, and heat
homogenization of the polymer melt. Due to the non-isothermal nature of the
polymerization, the heat transfer at walls and heat homogenization in polymer melt are
very important. However, transverse mixing is not easily evaluated, due to the
complicated characteristics of polymer flow.
1. Axial Mixing; 2. Transverse Mixing
Figure 5.13 Schematic illustrations of the mixing mechanisms between forward flow andback flow in screw elements.

67
Transverse mixing of polymeric fluid in conveying elements is produced because
some materials are dragged forward by the rotating screw, whereas others would be
conveyed in the direction opposite to the screw rotating direction, due to the pressure
gradient. Figure 5.14 shows the velocity vector of fluid elements in the cross section with
Z = O.06 m in SE60F. It is seen that near the screw surface, the materials have the
velocity in the screw rotating direction. However, in the regions near the barrel surface,
the fluid elements move in the direction opposite to those near the screw surface.
In the current study, the fluid elements moving in the screw rotating direction are
denoted as drag flow, and the others are donated as pressure flow. Consequently, the
transverse mixing is characterized as:
in which Gary is the transverse mixing coefficient. Bp and QD are pressure flow rate and
drag flow rate in the transverse section, respectively.
Figure 5.15 summarizes the transverse mixing coefficients at the cross section of
Z = 0.06 m in SE2OF and SE6OF, at 287 rpm and N8 rpm, respectively. This Figure shows
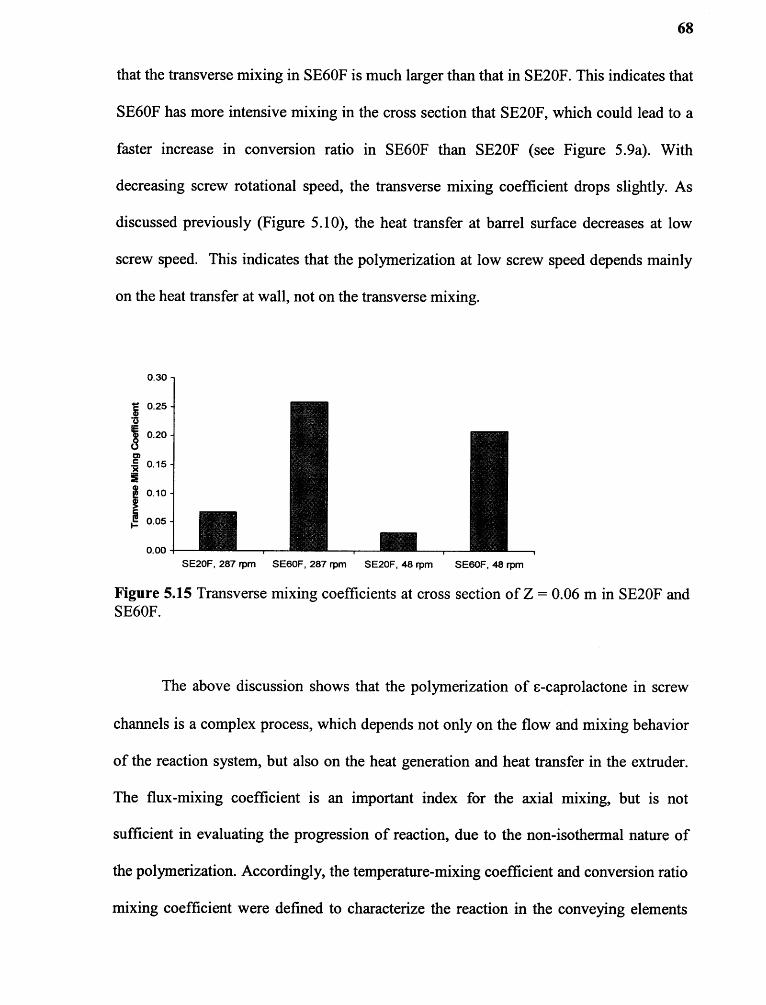
68
that the transverse mixing in SE6OF is much larger than that in SE20F. This indicates that
SE60F has more intensive mixing in the cross section that SE20F, which could lead to a
faster increase in conversion ratio in SE60F than SENOR (see Figure 5.9a). With
decreasing screw rotational speed, the transverse mixing coefficient drops slightly. As
discussed previously (Figure 5.10), the heat transfer at barrel surface decreases at low
screw speed. This indicates that the polymerization at low screw speed depends mainly
on the heat transfer at wall, not on the transverse mixing.
The above discussion shows that the polymerization of 6-caprolactone in screw
channels is a complex process, which depends not only on the flow and mixing behavior
of the reaction system, but also on the heat generation and heat transfer in the extruder.
The flux-mixing coefficient is an important index for the axial mixing, but is not
sufficient in evaluating the progression of reaction, due to the non-isothermal nature of
the polymerization. Accordingly, the temperature-mixing coefficient and conversion ratio
mixing coefficient were defined to characterize the reaction in the conveying elements

69
during the reactive extrusion. On the other hand, the transverse mixing is evaluated with
the ratio of pressure flow to net flow rate in the cross section. The simulation results
imply that the reaction progression is determined by the competition between the
intensity of mixing and the heat transfer mechanisms at the barrel surface.
In this section, the temperatures at the inlet and the barrel surface were set at N10 K,
instead of NN0 K in the preceding section. Figure 5.16 shows the simulation results of the
polymerization in conveying elements at N10 K.
Compared with the polymerization at NN0 K (Figure 5.9), the conversion ratios at
the channel exits at temperatures of N10 K are much lower. The increases in temperature,
viscosity, and pressure are much smaller in the cases with temperatures of N10 K than
those with NN0 K. This is easily understood, because the reaction slows down with
decreasing temperature (see Figure 3.N).
The effects of screw rotational speed on polymerization are significant. Similar to
the trends in the case of the reaction with NN0 K, the polymerization is accelerated at low
screw speed. As shown in Figure 5.16a, the conversion ratio is about O.N at the element
exits when the screw speed is 287 rpm, whereas it is very close to 1.O at N8 rpm.
Furthermore, the effect of screw pitch on reaction at 287 rpm is less significant than the
cases at NNOK (see Figure 5.9a). This is because, in the current case, the increase in
conversion ratio along the axial length is small, which leads to a low system viscosity
(Figure 5.16c), and a small increase in temperature (Figure 5.16b). That is, the non-
uniformity in temperature is small, and the effect of screw pitch on reaction becomes
negligible at 287 rpm and N10 K.

70
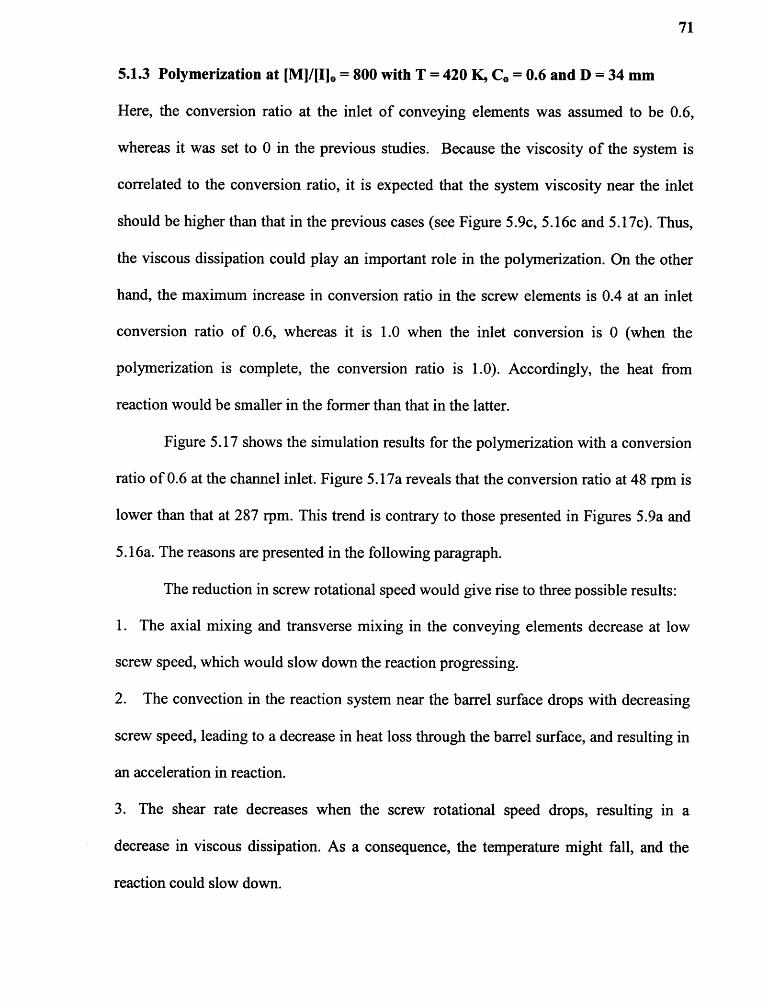
71
5.1.3 Polymerization at [M]/[I]. = 800 with T = 420 K, C o = 0.6 and D = 34 mm
Here, the conversion ratio at the inlet of conveying elements was assumed to be 0.6,
whereas it was set to 0 in the previous studies. Because the viscosity of the system is
correlated to the conversion ratio, it is expected that the system viscosity near the inlet
should be higher than that in the previous cases (see Figure 5.9c, 5.16c and 5.17c). Thus,
the viscous dissipation could play an important role in the polymerization. On the other
hand, the maximum increase in conversion ratio in the screw elements is O.N at an inlet
conversion ratio of 0.6, whereas it is 1.0 when the inlet conversion is 0 (when the
polymerization is complete, the conversion ratio is 1.O). Accordingly, the heat from
reaction would be smaller in the former than that in the latter.
Figure 5.17 shows the simulation results for the polymerization with a conversion
ratio of O.6 at the channel inlet. Figure 5.17a reveals that the conversion ratio at N8 rpm is
lower than that at 287 rpm. This trend is contrary to those presented in Figures 5.9a and
5.16a. The reasons are presented in the following paragraph.
The reduction in screw rotational speed would give rise to three possible results:
1. The axial mixing and transverse mixing in the conveying elements decrease at low
screw speed, which would slow down the reaction progressing.
2. The convection in the reaction system near the barrel surface drops with decreasing
screw speed, leading to a decrease in heat loss through the barrel surface, and resulting in
an acceleration in reaction.
3. The shear rate decreases when the screw rotational speed drops, resulting in a
decrease in viscous dissipation. As a consequence, the temperature might fall, and the
reaction could slow down.

72

73
In order to elucidate the effects of viscous dissipation and heat transfer at walls on
the reaction, three cases with different thermal conditions have been studied:
1. Adiabatic reaction, i.e. the system has no energy loss during reaction.
2. Constant temperature at barrel surface, but neglecting viscous dissipation of thereaction system, i.e. the viscous dissipation term is not included in the energy equation.
3. Constant temperature at barrel surface, and considering viscous dissipation of thereaction system, as studied in the previous cases.
Figure 5.18 demonstrates the increases in average conversion ratio along the axial
length with various thermal conditions during reaction. Figure 5.18 shows that the
reaction is the fastest with the adiabatic conditions and slowest in the cases when the
viscous dissipation was excluded. At the adiabatic condition, the reaction is faster at 287
rpm than that at N8 rpm. This confirms that the increase in back-mixing at high screw
speed favors the polymerization progression. In the case without viscous dissipation, the
polymerization at 287 rpm is slower than that at 48 rpm. This can be explained by the fact
that the heat loss at barrel surface is weak at low screw rotational speed. Accordingly, in
the case when the viscous dissipation is included and the barrel surface maintains
constant temperature during the polymerization, which is the situation investigated in the
present study (Table 5.3), the reaction progression depends on the competition between
the heat loss at barrel, viscous dissipation and heat from reaction. This explains why the
increase of conversion ratio in the conveying elements slows down with decreasing screw
speed, as shown in Figure 5.17. In this case, the viscous dissipation plays an important
role to the polymerization, because the conversion ratio at the channel inlet is 0.6. With
decreasing screw speed, both viscous dissipation and mixing intensity drop, leading to the
decrease in temperature and conversion ratio.

74
Similarly, the effects of mixing intensities in different screw elements on
polymerization could be studied with the assumption of different thermal conditions
during reactions. Figure 5.19 shows the trends of average conversion ratios along the
axial length with adiabatic condition and constant temperature at the barrel (considering
viscous dissipation), in SE2OF and SE6OF at N8 rpm. It is seen that at the adiabatic
conditions, the reaction is slightly faster in SE6OF than that in SE20F. This is attributable
to more intensive axial and transverse mixing in SE6OF (see Figures 5.11 and 5.15). On
the other hand, the difference in conversion ratio between SE2OF and SE6OF is much
larger in the cases with constant temperature at barrel surface than that at adiabatic
conditions. In the former, some of the heat from reaction is released through the heat
transfer at the barrel surface, whereas in the latter, there is no heat loss through the barrel.
This implies that the heat transfer intensity at the barrel surface of SE20F is weaker than
that of SE60F, which has a significant effect upon polymerization progression.

75
The simulation results of the polymerization of c-caprolactone with [Min = NO0 are
shown in Figure 5.20. The results in Figure 5.2Oa reveal that with increasing pitch of
conveying elements, the reaction becomes fast. Globally, the conversion ratio has a fast
increase with decreasing screw speed. However, the effect of screw speed on conversion
ratio is insignificant in the current case when compared with that with [MV[I]o = 800 (see
previous three sections). This is because the flow rates are very high in the current case
(Table 5.3), and thus the flux-mixing coefficients are very low (see Figure 5.21). The
change of screw speed has small effect on the back-mixing in the elements due to the
large flow rate. On the other hand, the heat from reaction is so large that the heat transfer
at the barrel is not a dominant role for the reaction.

76

77
Figure 5.2Oc shows that the viscosity is much lower than that in the previous
cases (Figures 5.9c, 5.16c and 5.17c), because the initiator concentration, [MV[I]o is NOO
in the present case . With a screw speed of N8 rpm, the inlet pressure is much larger than
the outlet pressure (Figure 5.2Od). This is because the flow rate is larger than the drag
flow capacity of the forward conveying elements at N8 rpm. Such a large flux cannot be
conveyed downstream without the aid of pressure flow. In other words, the pressure at
the inlet has to be larger than that at the exit. This also indicates that the flow is very
close to the pressure flow, and the back-mixing is very weak.
Figure 5.21a shows that the flux-mixing coefficient at the axial cross sections of
SE20F is very small: it is about 0.1 at 287 rpm and 0.0N at N8 rpm. However, in the cases
presented in Figure 5.11, the flux-mixing coefficient in SE20F at 287 rpm is about 3.
Furthermore, the flux-mixing coefficient fluctuates significantly along the axial length
(see the peaks or valleys in Figure 5.21a), due to the large variation in viscosity with the
reaction proceeding. Figure 21b shows the velocity profiles along the line from point
(O.028, O, 0.06) to point (O.032, 0, O.06), the mid-line of the channel (marked L 1 in Figure
5.6a). It is seen that the tangential velocity components are positive at both 287 rpm and
N8 rpm. This again confirms that the back-flux is negligible.
5.1.5 Scale-up Polymerization at [M]/[I]. = 800 with T = 420 K and Co = 0.6
The above discussion suggests that the reaction in conveying elements not only depends
on the velocity profiles of the fluid, but also relies on the heat transfer and heat
generation mechanism, and species exchanges. In this section, the effect of scale-up
screw diameter on reaction is discussed.
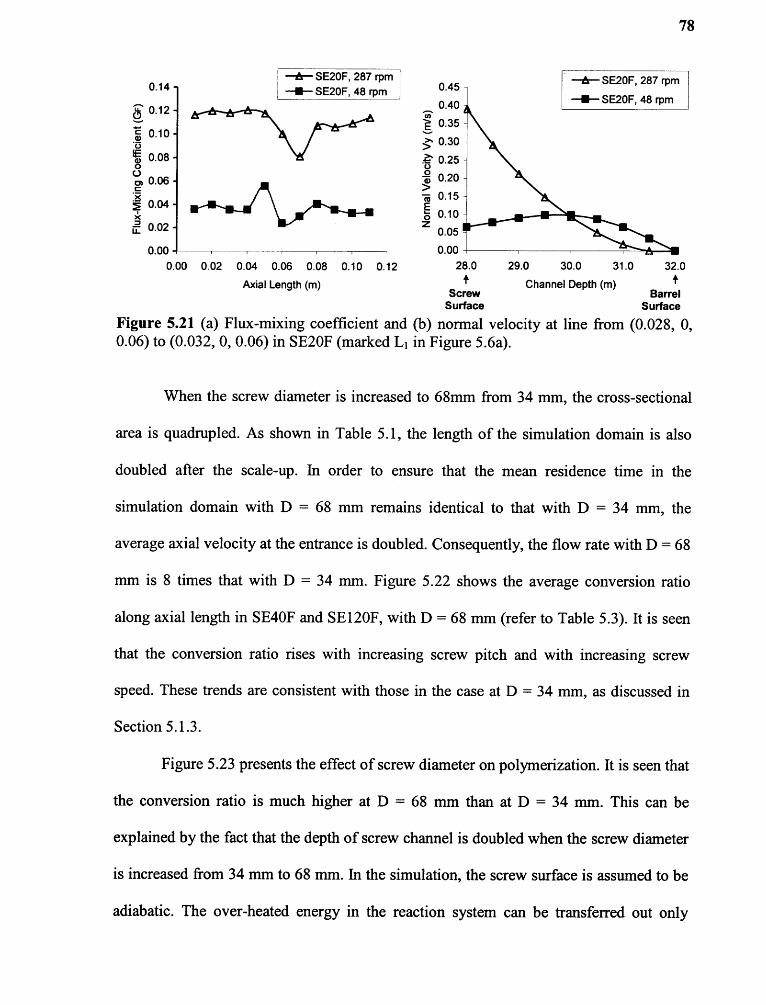
78
When the screw diameter is increased to 68mm from 3N mm, the cross-sectional
area is quadrupled. As shown in Table 5.1, the length of the simulation domain is also
doubled after the scale-up. In order to ensure that the mean residence time in the
simulation domain with D = 68 mm remains identical to that with D = 3N mm, the
average axial velocity at the entrance is doubled. Consequently, the flow rate with D = 68
mm is 8 times that with D = 3N mm. Figure 5.22 shows the average conversion ratio
along axial length in SENOR and SE120F, with D = 68 mm (refer to Table 5.3). It is seen
that the conversion ratio rises with increasing screw pitch and with increasing screw
speed. These trends are consistent with those in the case at D = 3N mm, as discussed in
Section 5.1.3.
Figure 5.23 presents the effect of screw diameter on polymerization. It is seen that
the conversion ratio is much higher at D = 68 mm than at D = 3N mm. This can be
explained by the fact that the depth of screw channel is doubled when the screw diameter
is increased from 34 mm to 68 mm. In the simulation, the screw surface is assumed to be
adiabatic. The over-heated energy in the reaction system can be transferred out only

79
through the barrel surface. Consequently, the increase in channel depth would make the
release of heat from the reaction system through barrels difficult to occur. Furthermore,
the ratio of the barrel surface area to the volume of the screw channel decreases with
increasing screw diameter. As a result, the non-uniformity of temperature in the screw
channel becomes more pronounced in large size twin-screw extruders. There are some
regions with high temperature, which accelerate the polymerization.
Figure 5.23 Comparison of conversion ratios between D = 3N mm and D = 68 mm.

80
In order to confirm the critical role of reaction heat and viscous dissipation in the
scale-up of polymerization, the conversion ratios along the axial length were calculated
for different thermal conditions. The results are shown in Figure 5.2N. Here, two cases
were studied: one considered the viscous dissipation, the other neglected it (denoted as
No-Diss. in Figure 5.2N). In both cases, the temperature at barrel surface remains
constant, NNO K, during polymerization. The results in Figure 5.2N show that even if the
viscous dissipation is neglected, the polymerization with D = 68 mm is faster than that
with D = 3N mm at both N8 rpm and 287 rpm. This is due to the poorer heat transfer
through the barrel surface at a larger screw diameter. Furthermore, the difference in
conversion ratio with or without considering viscous dissipation is much larger in D = 68
mm than in D = 3N mm at 287 rpm, but it is not significant at N8 rpm. This suggests that
the viscous dissipation plays a more important role at larger screw diameter, and at higher
screw rotational speed.
5.1.6 Effect of Helical Direction of Conveying Elements on Reaction
In co-rotating twin-screw extruders, the reversed conveying elements are usually used to
generate the resistance to polymer conveying along the screw length. They are always
assumed to be filly-filled with the reaction system during processing. This type of
conveying element generally has a short axial length and a small screw pitch. In this
section, the polymerization of c-caprolactone in the reversed conveying elements with
both axial length and screw pitch of 20 mm was studied, at [MV[I]o = 800, and T = NN0
K. The difference in polymerization progression between the forward and reversed
conveying elements was discussed.

81
Figure 5.25 summarizes the increase in conversion ratio along the axial length in
the reversed conveying element SE20R (see Table 5.1), with an inlet conversion ratio of
0 or O.6, at a screw speed of N8 rpm or 287 rpm. It is seen that the conversion ratio has a
fast increase at low screw speed, and the effect of screw speed upon the increase in

82
conversion ratio is more significant at an inlet conversion ratio of 0 than at an inlet
conversion of O.6.
Figure 5.26 displays the trends of conversion ratios along the axial length in the
forward and reversed conveying elements. The curves in Figure 5.26 show that the
conversion ratio at the exit (Z = 0.02 m) of the reversed elements (SE2OR) is lower than
that in the forward elements (SE2OF), at an identical simulation condition. The difference
in conversion ratio in the forward and reversed elements is small at an inlet conversion
ratio of O.6, but it is large when the inlet conversion ratio is zero, especially at N8 rpm. It
is known that the conveying mechanisms of the reaction system in the forward elements
are entirely different from those in the reversed elements. In the former, the materials are
conveyed downstream by the drag flow (produced by the rotating screws), whereas the
pressure flow brings the materials upstream (Usually, the forward element builds
pressure, i.e. the outlet has a higher pressure than the inlet). In the latter, the reaction

83
system is carried downstream by the pressure flow, and is brought to the upstream by the
drag flow. The variations in conveying mechanisms cause different mixing and heat
transfer behavior in the forward and reversed elements, leading to different trends of
conversion ratio along the axial length.
5.1.7 Effect of Reaction Heat on Polymerization in Conveying Elements
As discussed in the previous sections, the heat from reaction plays a critical role in the
polymerization progression. In the polymerization of c-caprolactone, one important
characteristic is that the heat from reaction is quite high, about 250 kJ/kg. For example,
the reaction heat for the polymerization of polyamide 6 is about 110 kJ/kg. This section
focuses on the results of the effect of reaction heat on polymerization progression in
conveying elements; the values of reaction heat of the model system were assumed to be

84
250 kJ/kg, and 100 kJ/kg, respectively. The increase of conversion ratio along the axial
length with different values of reaction heat, and various operational conditions, are
summarized in Figures 5.27 — 5.30.
Figure 5.27 demonstrates the trends of conversion ratio along the axial length in
SE20F with different values of reaction heat at [MV[I]o = 800, T = NN0 K, and C o = 0, in
which symbol "Aso" denotes isothermal conditions of reaction, i.e. the system remains at
a constant temperature NN0 K during the polymerization. This is very close to the case in
which the heat from reaction is zero, considering that viscous dissipation in this system is
small. At is seen from Figure 5.27 that the effect of the values of reaction heat on the
polymerization is significant: the reaction is accelerated with increasing reaction heat.
Furthermore, the variation in conversion ratio at different screw rotational speeds
becomes small when the reaction heat drops.

85
Figure 5.28 shows that the effect of screw rotational speed on the increase in
conversion ratio in SE20F is negligible when the reaction heat is 100 kJ/kg, at [Win =
NOO, T = NO5 K and C o = O, and the conversion ratio at channel exit (Z = O.12 m) is about
one third of that with a reaction heat of 250 kJ/kg.
Figure 5.29 reveals that the polymerization with a reaction heat, H = 250 kJ/kg, is
much faster than that with H = 100 kJ/kg, especially at low screw speed. However, both
geometry of conveying elements (i.e. screw pitch) and screw rotational speed have
insignificant effects on the polymerization at H = 100 kJ/kg.
Figure 5.3O indicates that the variation in conversion ratio with different values of
reaction heat is small when the inlet conversion ratio is O.6, which is less pronounced
than that with a zero inlet conversion (Figure 5.27). This can be attributed to the fact that
the reaction heat is the dominant energy source in the case with a zero inlet conversion
ratio, whereas viscous dissipation plays an important role when the inlet conversion is
0.6.

86
The above discussion indicates that the value of reaction heat is an important
factor in the polymerization. As the value of reaction heat decreases, the effect of screw
pitch and screw rotational speed on the polymerization progression in conveying
elements becomes less significant, particularly, at an inlet conversion ratio of zero. This
implies that it is important to introduce a 3-D model in the simulation of the
polymerization with a large heat from reaction, such as polymerization of oft-caprolactone.

87
5.2 Comparison of Simulation Results Based on 1-D and 3-D Models
In this section, the simulation results from 3-D model are compared with those based on
1-D model. As discussed in Chapter N, the simulation results from 1-D model depend
largely on the heat transfer coefficient at the wall. Hence, the effect of heat transfer
coefficient on reaction progression predicted with 1-D model is also discussed.
Figure 5.31 displays the effect of simulation methods, i.e. 1-D model or 3-D
model, on the increase in conversion ratio along the axial length, at [MV[A]o = NOO, and T
= NO5 K. At is seen that the conversion ratios based on 3-D model are larger than those
obtained from 1-D model, even with a heat transfer coefficient of zero at the barrel
surface. That is, the reaction progression obtained from 3-D model is faster than that
predicted from 1-D model with adiabatic conditions at the barrel surface. This is due to
the fact that the reaction is a very fast one at [MV[I]o = NOO. The large reaction heat is
hardly transferred out through the barrel surface at a short time, leading to a non-uniform
temperature distribution at the axial cross section. This indicates that temperature is very
high in some regions, where the reaction is further accelerated. As a consequence, the
polymerization based on 3-D model is faster than that from 1-D model with an adiabatic
condition at walls. In the latter, the temperature at the axial cross section is assumed to be
uniform.
Figure 5.31 also shows that in simulation with the 1-D model, the values of heat
transfer coefficient at the barrel surface have an insignificant effect on the increase of
conversion along the axial length. This is attributable to the fact that the heat from
reaction is so large that the heat transfer at the wall is not an important factor in the
polymerization progression.

88
Figure 5.32 shows that at N8 rpm, the conversion ratios from 3-D model are
higher than those from 1-D model with adiabatic conditions at the barrel surface, at
[MV[A]0 = 800, T = NNO K, and Co = 0. However, at 287 rpm, the conversion ratios based
on 3-D simulation are much lower than those from 1-D model, even when a heat transfer
coefficient of NO0 W/m2 K is used. This is because, at low screw speed, the transverse
mixing is weak, which results in a poor heat transfer at the barrel surface. At high screw
speed, the heat loss at the barrel surface based on the 3-D model would be larger than that
in the 1-D model, as explained in the following.
As presented in Chapter N, the heat transfer at the barrel surface in 1-D model is
given by:
where q is the heat flux; Tb is the barrel temperature, and T. f the average temperature of
fluid. h is the heat transfer coefficient at barrel surface, which depends on convection of

89
the fluid near the wall, and the heat conductivity of the fluid. However, in 1-D modeling,
h is usually given as a constant, independent of the polymerization progression.
When 3-D model is applied, the heat flux at the barrel surface takes the form:
where k is the heat conductivity of the fluid; the temperature gradient is evaluated based
on the fluid temperature near the barrel surface:
where Tel is the fluid temperature in the layer next to the barrel surface, and A is the layer
thickness. Due to the large reaction heat, the fluid temperature in the layer next to the
barrel surface can be high. Consequently, the heat loss at the barrel surface during
polymerization based on 3-D model would be larger than that in 1-D model.
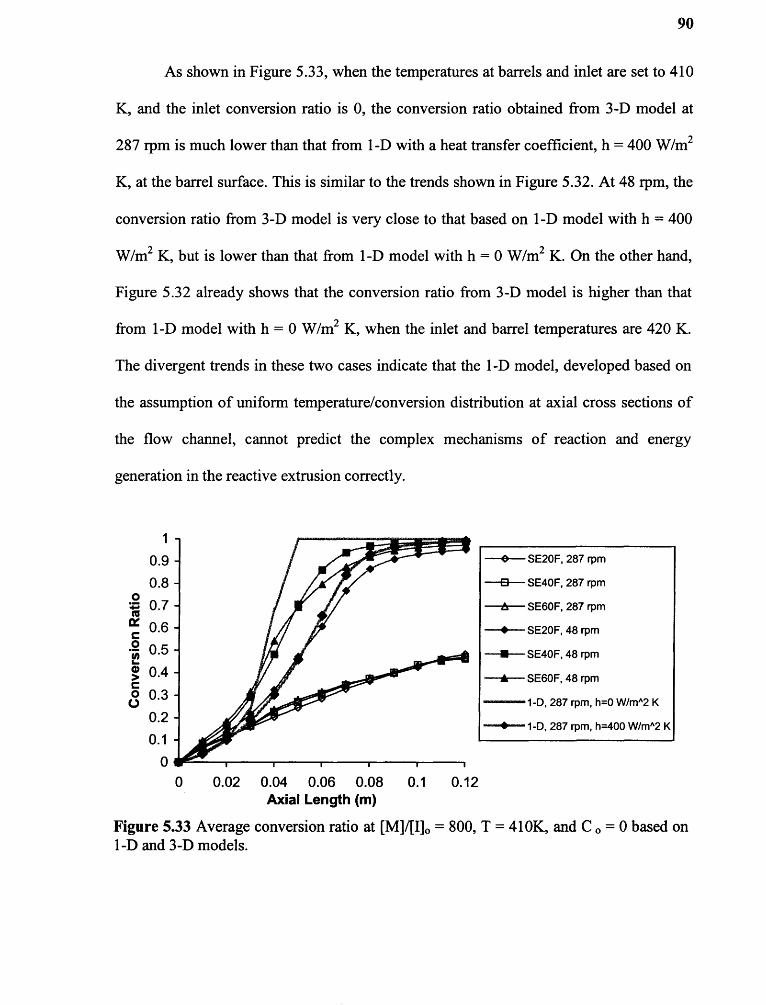
90
As shown in Figure 5.33, when the temperatures at barrels and inlet are set to N10
K, and the inlet conversion ratio is O, the conversion ratio obtained from 3-D model at
287 rpm is much lower than that from 1-D with a heat transfer coefficient, h = NO0 W/m 2
K, at the barrel surface. This is similar to the trends shown in Figure 5.32. At N8 rpm, the
conversion ratio from 3-D model is very close to that based on 1-D model with h = NO0
W/m2 K, but is lower than that from 1-D model with h = 0 W/m2 K. On the other hand,
Figure 5.32 already shows that the conversion ratio from 3-D model is higher than that
from 1-D model with h = 0 W/m 2 K, when the inlet and barrel temperatures are NN0 K.
The divergent trends in these two cases indicate that the 1-D model, developed based on
the assumption of uniform temperature/conversion distribution at axial cross sections of
the flow channel, cannot predict the complex mechanisms of reaction and energy
generation in the reactive extrusion correctly.
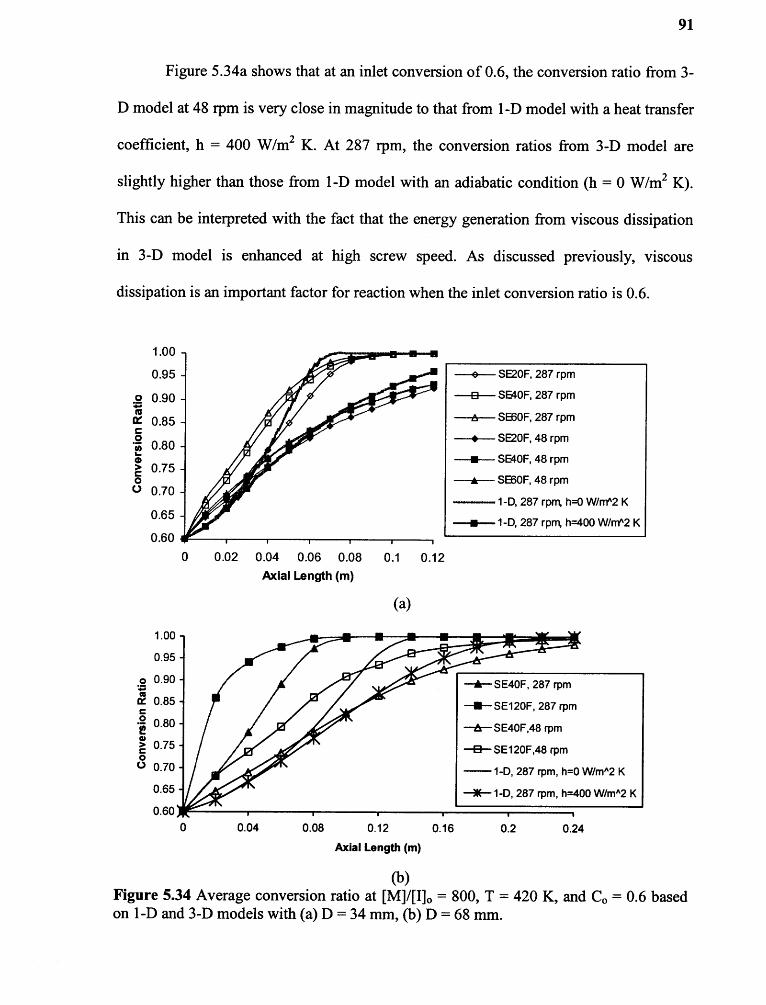
91
Figure 5.3Na shows that at an inlet conversion of 0.6, the conversion ratio from 3-
D model at N8 rpm is very close in magnitude to that from 1-D model with a heat transfer
coefficient, h = NOO W/m2 K. At 287 rpm, the conversion ratios from 3-D model are
slightly higher than those from 1-D model with an adiabatic condition (h = 0 W/m 2 K).
This can be interpreted with the fact that the energy generation from viscous dissipation
in 3-D model is enhanced at high screw speed. As discussed previously, viscous
dissipation is an important factor for reaction when the inlet conversion ratio is O.6.

92
When the screw diameter is increased to 68 mm from 3N mm, the difference in
conversion ratio at N8 rpm based on 3-D model and 1-D model with a heat transfer
coefficient of NO0 W/m 2 K at walls, is small. However, the difference between 3-D and 1-
D results at 287 rpm is very significant. Furthermore, the variation in conversion ratio
between 1-D and 3-D models at 287 rpm with D = 68 mm is much larger than that with D
= 3N mm. This implies that the application of a 1-D model in the simulation of
polymerization in large machines is not reliable.
The comparison of conversion ratio profiles between 1-D and 3-D models along
the axial length at [MV[I]o = NO0 with a reaction heat, H, of 100 kJ/kg is presented in
Figure 5.35. It is seen that that the difference in conversion ratios based on 3-D model
and 1-D model at H = 100 kJ/kg is negligible, and is smaller than that with H = 250 kJ/kg
(see Figure 5.31). Similarly, the variation in conversion ratios between 1-D and 3-D
models at MV[I]o = 800, T = NN0 K and C o = 0 with H = 100 kJ/kg (Figure 5.36) is
smaller than that with H = 250 kJ/kg (Figure 5.32). This can be explained by the fact that
the decrease in heat from reaction slows down the increase in temperature along the axial
length. As a sequence, the temperature in the axial cross section becomes much uniform
with decreasing heat from reaction. Accordingly, the characteristics of the non-isothermal
process in the conveying elements predicted by the 3-D model approach those obtained
from the 1-D model. This suggests that it could be feasible to apply the 1-D model in
predicting polymerization when the heat from reaction is low.
Figure 5.37 shows the effect of simulation methods, 1-D and 3-D models, on the
average conversion ratio at [MVMo = 800, T = NN0 K, and C o = 0.6, along the axial
direction, with a reaction heat, H, of 100 kJ/kg, and 250 kJ/kg, respectively. At a screw
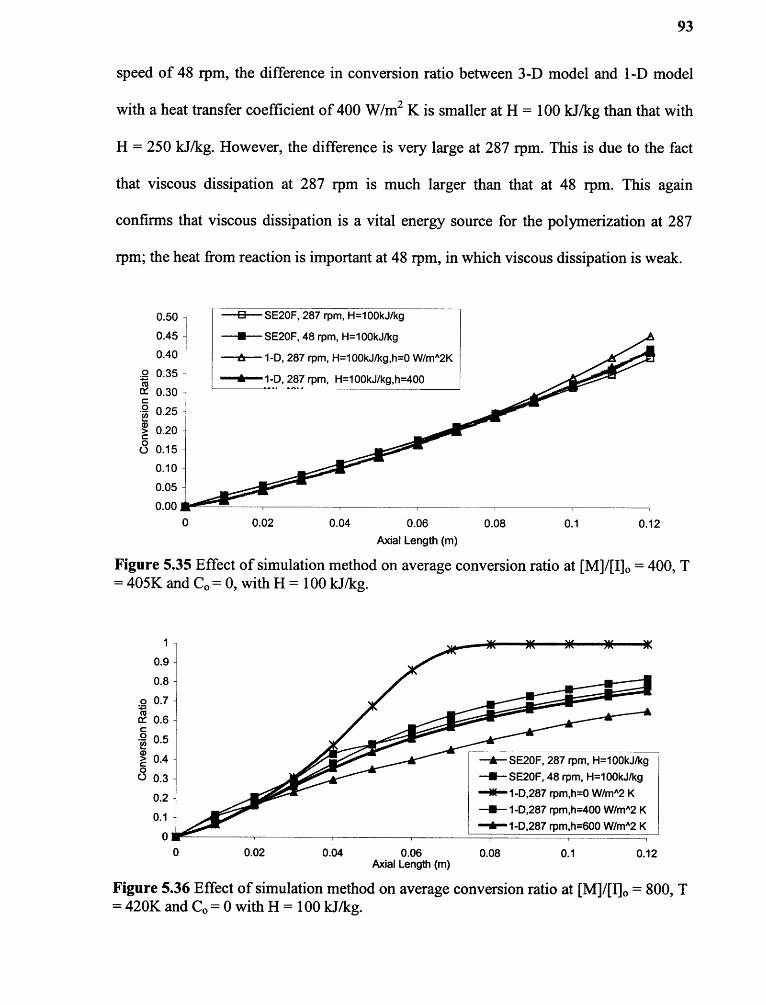
93
speed of N8 rpm, the difference in conversion ratio between 3-D model and 1-D model
with a heat transfer coefficient of NO0 W/m 2 K is smaller at H = 100 kJ/kg than that with
H = 250 kJ/kg. However, the difference is very large at 287 rpm. This is due to the fact
that viscous dissipation at 287 rpm is much larger than that at N8 rpm. This again
confirms that viscous dissipation is a vital energy source for the polymerization at 287
rpm; the heat from reaction is important at N8 rpm, in which viscous dissipation is weak.

94
5.3 Conclusions
In this chapter, the results of numerical simulation with a 3-D model of the
polymerization of c-caprolactone in fully-filled conveying elements were presented. The
effects of screw geometries, screw rotational speed, and initiator concentration on
polymerization kinetics were discussed. The results show that the polymerization kinetics
in the conveying elements is very complex. The extent of polymerization is the result of
competition among such factors as residence time, heat transfer at the barrel surface,
viscous dissipation, and heat from reaction. Consequently, the flux-mixing coefficient,
which represents the axial mixing of mass in the conveying element, is not sufficient to
evaluate the reaction progress; the heat generation, and heat transfer mechanisms, should
be incorporated into the evaluation of mixing intensity. Accordingly, two indices,
temperature mixing coefficient, and conversion ratio mixing coefficient, have been
introduced for the first time to describe the extent of axial mixing during reactive
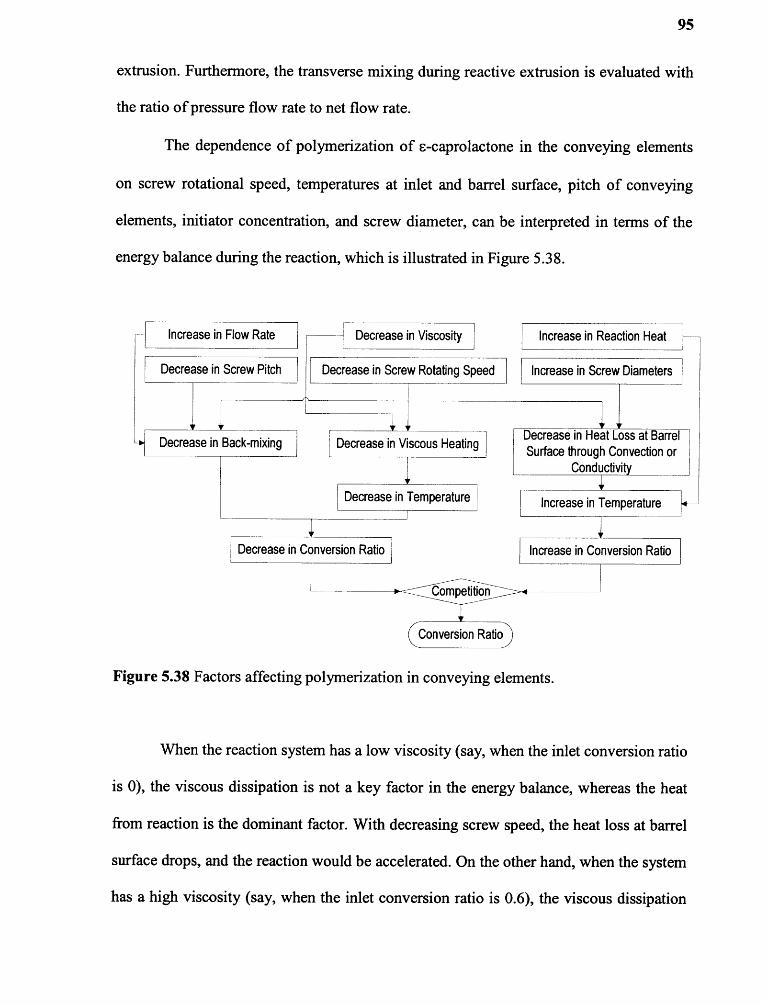
95
extrusion. Furthermore, the transverse mixing during reactive extrusion is evaluated with
the ratio of pressure flow rate to net flow rate.
The dependence of polymerization of c-caprolactone in the conveying elements
on screw rotational speed, temperatures at inlet and barrel surface, pitch of conveying
elements, initiator concentration, and screw diameter, can be interpreted in terms of the
energy balance during the reaction, which is illustrated in Figure 5.38.
Figure 5.38 Factors affecting polymerization in conveying elements.
When the reaction system has a low viscosity (say, when the inlet conversion ratio
is O), the viscous dissipation is not a key factor in the energy balance, whereas the heat
from reaction is the dominant factor. With decreasing screw speed, the heat loss at barrel
surface drops, and the reaction would be accelerated. On the other hand, when the system
has a high viscosity (say, when the inlet conversion ratio is O.6), the viscous dissipation

96
plays an important role in the energy generation, which drops at low screw speed.
Accordingly, the reaction is slow at low screw speed. When the reaction heat is low, the
effect of screw speed on polymerization becomes small, especially for the system with
low viscosity.
The comparisons of simulation results, based on 1-D model, and those based 3-D
model, show that the reaction progress based on 3-D model at low screw speed (i.e. N8
rpm) is similar to that based on the 1-D model, however, the difference is quite
significant at high screw speed (say, 287 rpm). This can be attributed to the fact that at
high screw speed, the back-mixing and heat transfer at the barrel surface are very
complex, factors not considered in the 1-D model. On the other hand, it is found that the
value of heat from reaction is an important factor to the polymerization. The difference in
simulation results between 1-D model and 3-D model becomes small when the value of
heat from reaction decreases.
The polymerization would be fast when the size of the extruder is enlarged. This
can be explained by that the heat transfer through the barrel surface is poor in large
machines; temperature is very high in some regions, where the polymerization is
accelerated. The 1-D model fails to predict the polymerization in the large machine
because, unlike the 3-D model, it assumes that the temperature is uniform at the axial
cross sections. The 3-D model is a valuable tool in optimizing the reactive extrusion in
large extruders.

CHAPTER 6
PARAMETRIC STUDY OF POLYMERIZATION OFc-CAPROLACTONE IN KNEADING BLOCKS
The kneading block is a mixing element in co-rotating twin-screw extruders, which offers
not only excellent distributive mixing, but also good dispersive mixing, as described in
Chapter 1. Unlike the conveying elements having a continuous flight, kneading blocks
are configured with individual profile discs to form a geometrically discontinuous unit.
The intensities of distributive mixing and dispersive mixing in kneading blocks depend
on not only the individual disc width and stagger angle, but the feeding rate and screw
rotational speed as well.
An this chapter, numerical simulation results based on a 3-D model of
polymerization of s-caprolactone in different kneading blocks are presented, and are
compared with those in the conveying elements. The kneading blocks can be forward,
reversed, or neutral, as shown in Figure 6.1, and Table 6.1. They are built with 16 pieces
of kneading discs. The dimension of kneading blocks used in the simulation is listed in
Table 6.2. When the diameter of kneading blocks is scaled up, i.e. from 3N mm to 68 mm,
the disc width is doubled, but the stagger angle remains constant.
Similar to the treatment of the conveying elements, and described in Chapter 5, an
extensional disc with a length of 20 mm is added at the end of the kneading block, in
order to ensure that the iteration easily reaches convergence during the simulation. The
boundary conditions for the simulation are listed in Table 6.3, in which the effects of
screw rotational speed, initial conversion ratio at the inlet, and temperature on
polymerization in kneading blocks are studied. The barrel surface is assumed to maintain
97

98
constant temperature during the reaction. The conversion ratios at the wall surfaces and
the exit of the simulation domain are assumed to have a zero gradient, and the flow is
fully developed at the exit. The 3-D mesh of the kneading blocks used in FLUENT is
generated with NO3,200 8-node, brick elements. For instance, Figure 6.2 shows the mesh
of KB3O. In the simulation, the reversed kneading blocks have the same mesh as the
forward ones, but they rotate in a direction opposite to that of the forward elements.
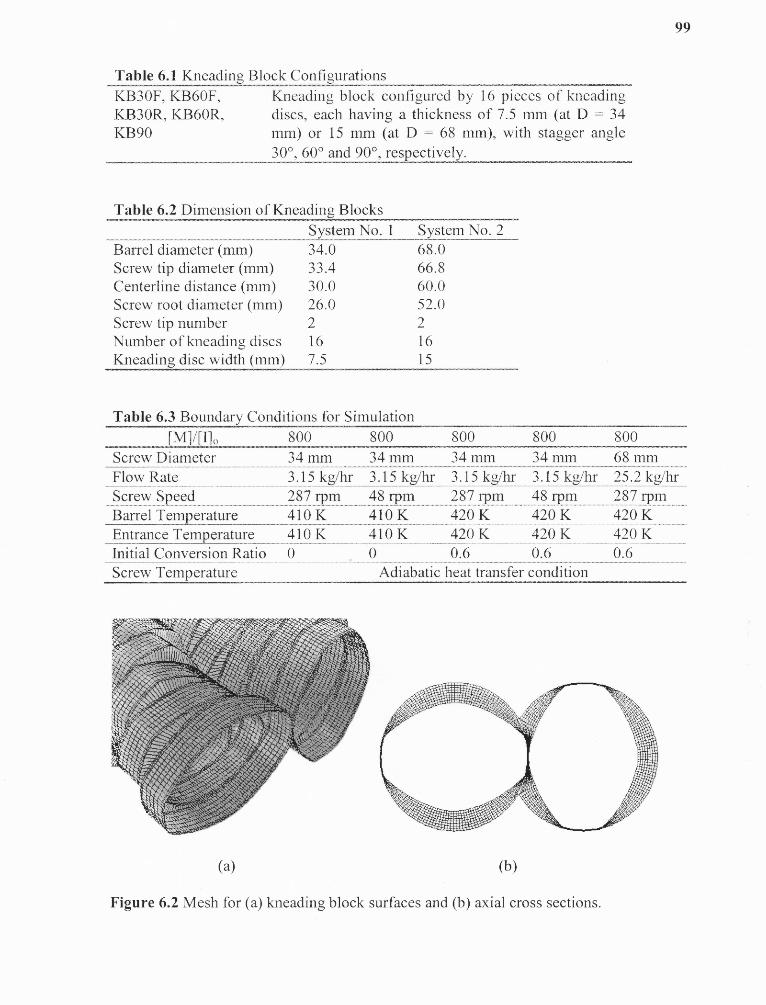
99

100
6.1 Simulation Results for Polymerization in Kneading Blocks with 3-D Model
Figure 6.3 shows the top view of conversion ratio distributions at kneading block
surfaces, in which the reaction system is conveyed from left to right. At is seen that the
transition trend of conversion ratio from low to high value (from blue to red, in color)
varies in different kneading blocks. An the regions near the inlet, KB9O has a slow
increase in conversion ratio than KB3OF. However, in the region close to the outlet, the
conversion ratio is higher in KB90 than in KB30F.
The conversion ratio profiles at the middle plane of kneading disc No.10 in
KB30F (see Figure 6.1a) and KB90 at 287 rpm are shown in Figure 6.N. The axial
coordinate of the middle planes of kneading disks are listed in Table 6.4. Figure 6.N
shows that the distribution of conversion ratio is not uniform at the axial cross sections.
An KB30F, the conversion ratio is higher in the middle of the channel than other regions,
whereas in KB9O, the high conversion is located near the barrel surface.

As discussed in Chapter 5, the distribution of conversion ratio at the axial cross
section of screw elements can be characterized with the area weighted function of
conversion ratio (Equation 5.1). Figure 6.5 shows the calculated area-weighted
distributions of conversion ratio at the middle plane of kneading discs No.7, No.10 and
No.14 in both KB3OF and KB9O. It is found that the distribution of conversion ratio is
broader in KB3OF than in KB90. Furthermore, in the axial cross sections with Z =
0.04875 m and Z = 0.07125 m, the averaged conversion ratio in KB3OF is higher than
that in KB9O.
The broader distribution of conversion ratio in KB3OF can be interpreted with the
flow mechanism of the reaction system in kneading blocks. Figure 6.6 shows the positive
axial velocity profiles at the middle plane of kneading disc No.10 in KB3OF and KB9O,
in which the negative (upstream) velocity contour is not displayed in order to increase the
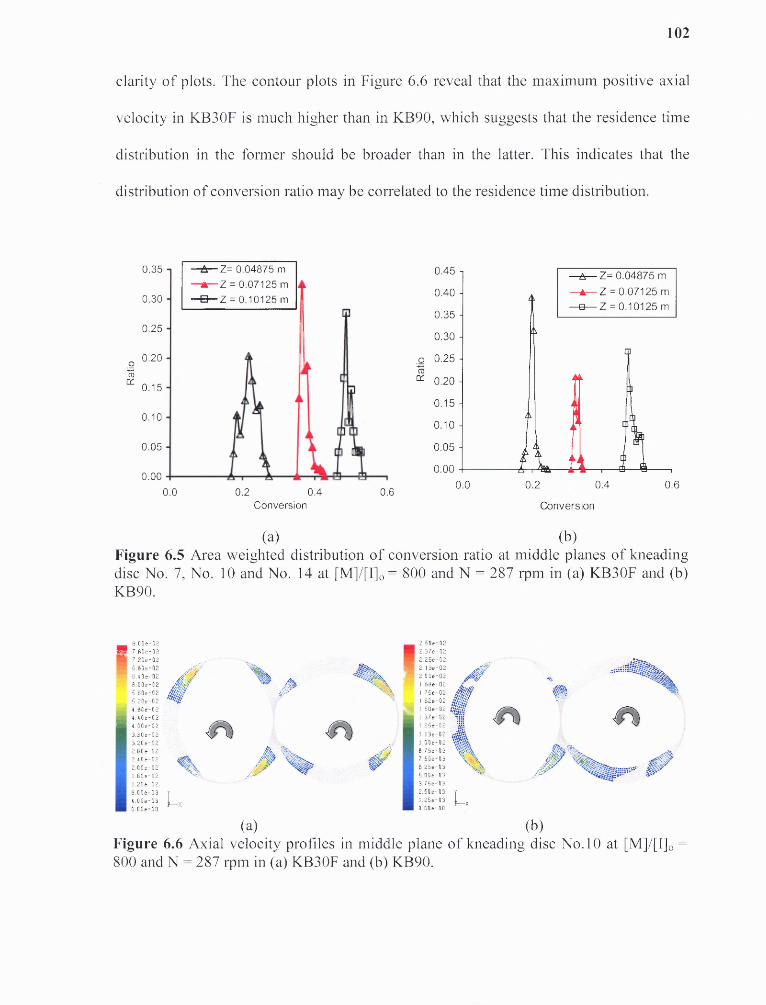
102
clarity of plots. The contour plots in Figure 6.6 reveal that the maximum positive axial
velocity in KB3OF is much higher than in KB9O, which suggests that the residence time
distribution in the former should be broader than in the latter. This indicates that the
distribution of conversion ratio may be correlated to the residence time distribution.
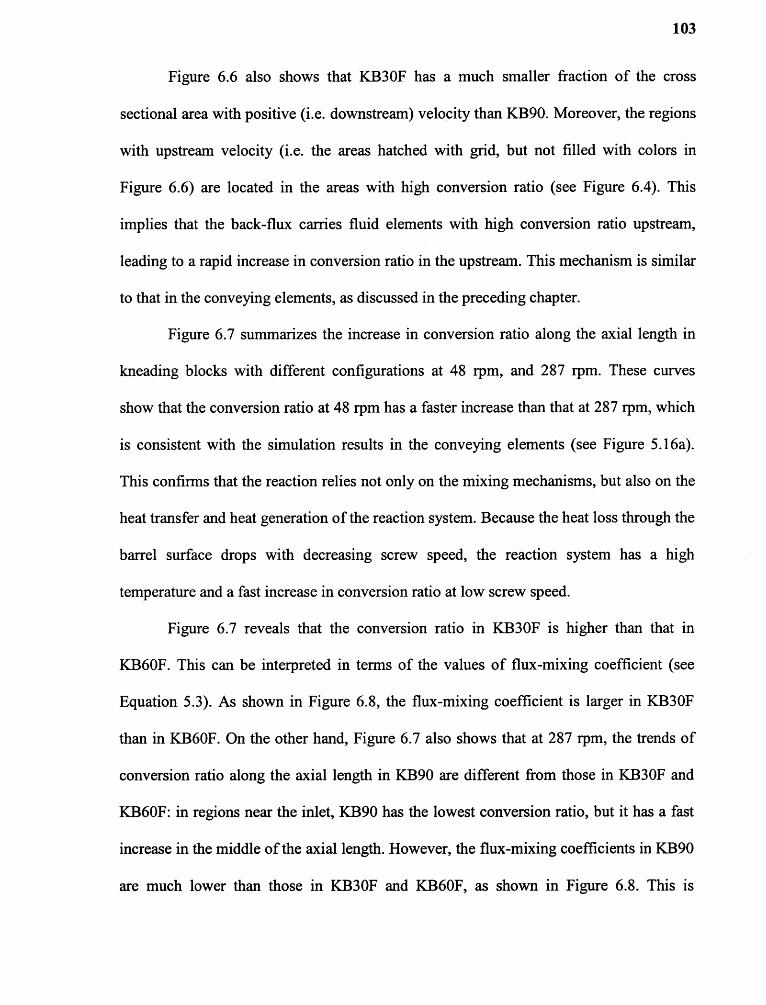
103
Figure 6.6 also shows that KB3OF has a much smaller fraction of the cross
sectional area with positive (i.e. downstream) velocity than KB60F. Moreover, the regions
with upstream velocity (i.e. the areas hatched with grid, but not filled with colors in
Figure 6.6) are located in the areas with high conversion ratio (see Figure 6.N). This
implies that the back-flux carries fluid elements with high conversion ratio upstream,
leading to a rapid increase in conversion ratio in the upstream. This mechanism is similar
to that in the conveying elements, as discussed in the preceding chapter.
Figure 6.7 summarizes the increase in conversion ratio along the axial length in
kneading blocks with different configurations at N8 rpm, and 287 rpm. These curves
show that the conversion ratio at N8 rpm has a faster increase than that at 287 rpm, which
is consistent with the simulation results in the conveying elements (see Figure 5.16a).
This confirms that the reaction relies not only on the mixing mechanisms, but also on the
heat transfer and heat generation of the reaction system. Because the heat loss through the
barrel surface drops with decreasing screw speed, the reaction system has a high
temperature and a fast increase in conversion ratio at low screw speed.
Figure 6.7 reveals that the conversion ratio in KB3OF is higher than that in
KB6OF. This can be interpreted in terms of the values of flux-mixing coefficient (see
Equation 5.3). As shown in Figure 6.8, the flux-mixing coefficient is larger in KB3OF
than in KB6OF. On the other hand, Figure 6.7 also shows that at 287 rpm, the trends of
conversion ratio along the axial length in KB9O are different from those in KB30F and
KB60F: in regions near the inlet, KB60F has the lowest conversion ratio, but it has a fast
increase in the middle of the axial length. However, the flux-mixing coefficients in KB90
are much lower than those in KB30F and KB60F, as shown in Figure 6.8. This is
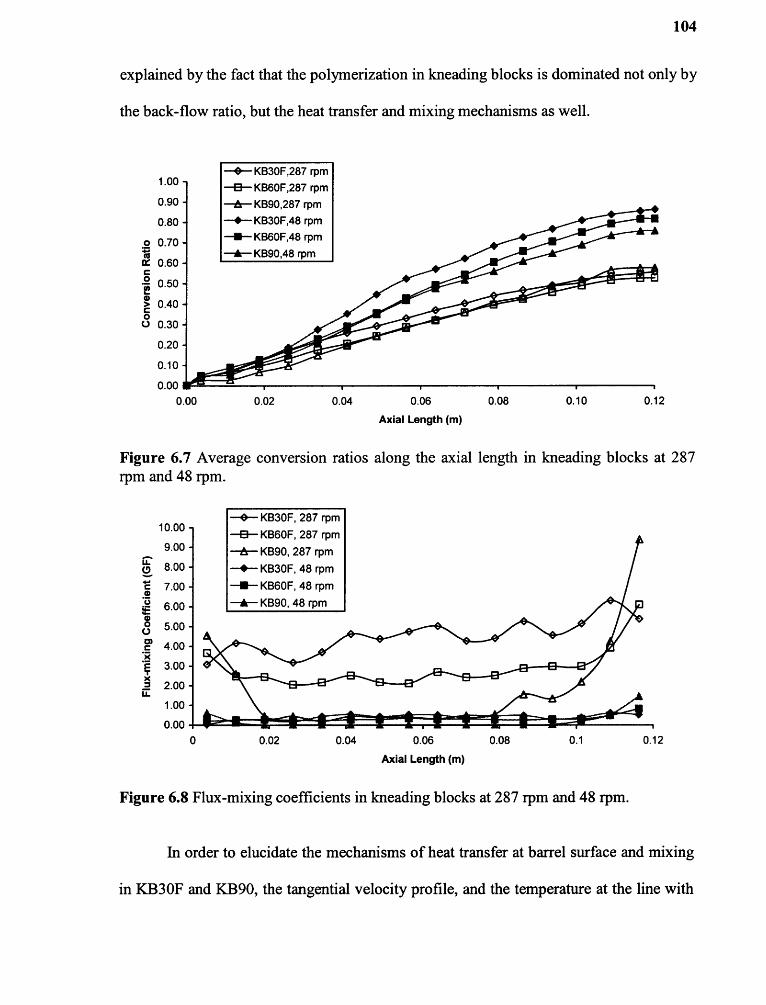
104
explained by the fact that the polymerization in kneading blocks is dominated not only by
the back-flow ratio, but the heat transfer and mixing mechanisms as well.

105
Y = 0 m in the middle plane of Z = 0.0N875 m (denoted as mid-line in disc No.7 in
Figure 6.1a) at 287 rpm are plotted in Figure 6.9. As shown in Figure 6.9a, the tangential
velocity could be positive or negative in KB3OF. This indicates that in the axial cross
section, some fluid elements move in the same direction as the screw rotation; the others
move in the opposite direction to the screw rotation. However, in the cross section of
KB9O, all of the fluid elements travel in the same direction as the screw rotation.
Consequently, more intensive transverse mixing occurs in KB3OF than KB9O. Moreover,
Figure 6.9a shows that the velocity gradient near the barrel surface is larger in KB3OF
than KB9O. This implies that the convection of fluid elements near the barrel surface is
more intensive in the former than the latter, which would result in a larger heat loss
through the barrel in KB3OF.
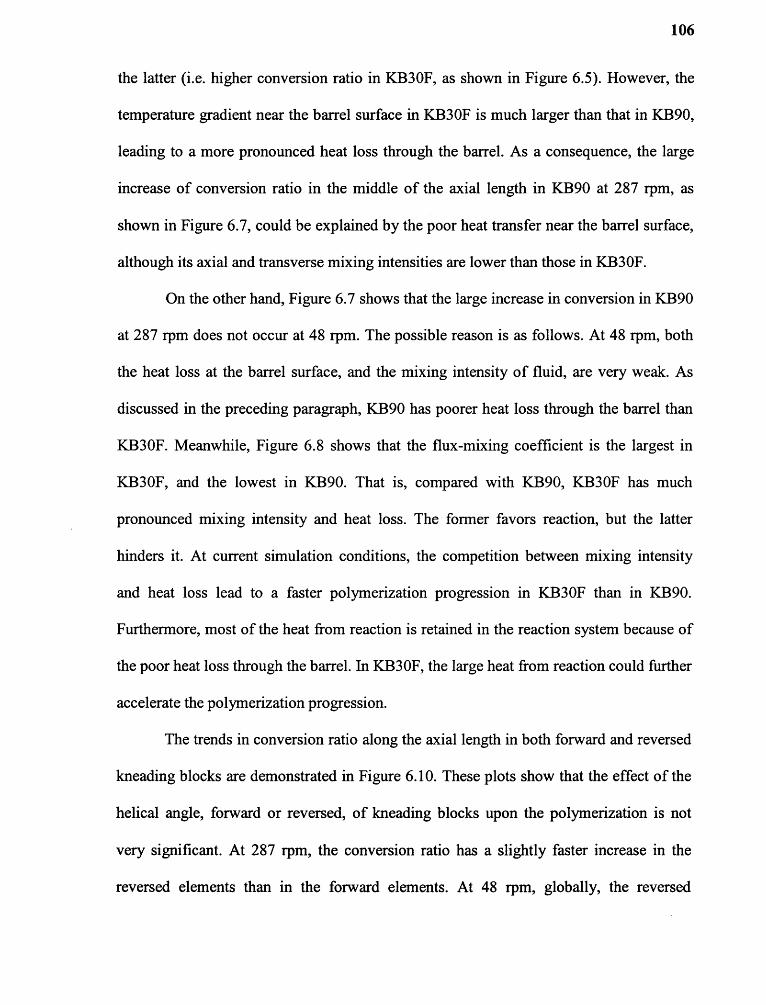
106
the latter (i.e. higher conversion ratio in KB3OF, as shown in Figure 6.5). However, the
temperature gradient near the barrel surface in KB30F is much larger than that in KB9O,
leading to a more pronounced heat loss through the barrel. As a consequence, the large
increase of conversion ratio in the middle of the axial length in KB90 at 287 rpm, as
shown in Figure 6.7, could be explained by the poor heat transfer near the barrel surface,
although its axial and transverse mixing intensities are lower than those in KB30F.
On the other hand, Figure 6.7 shows that the large increase in conversion in KB9O
at 287 rpm does not occur at N8 rpm. The possible reason is as follows. At N8 rpm, both
the heat loss at the barrel surface, and the mixing intensity of fluid, are very weak. As
discussed in the preceding paragraph, KB9O has poorer heat loss through the barrel than
KB30F. Meanwhile, Figure 6.8 shows that the flux-mixing coefficient is the largest in
KB3OF, and the lowest in KB9O. That is, compared with KB9O, KB30F has much
pronounced mixing intensity and heat loss. The former favors reaction, but the latter
hinders it. At current simulation conditions, the competition between mixing intensity
and heat loss lead to a faster polymerization progression in KB30F than in KB9O.
Furthermore, most of the heat from reaction is retained in the reaction system because of
the poor heat loss through the barrel. An KB3OF, the large heat from reaction could further
accelerate the polymerization progression.
The trends in conversion ratio along the axial length in both forward and reversed
kneading blocks are demonstrated in Figure 6.10. These plots show that the effect of the
helical angle, forward or reversed, of kneading blocks upon the polymerization is not
very significant. At 287 rpm, the conversion ratio has a slightly faster increase in the
reversed elements than in the forward elements. At N8 rpm, globally, the reversed

107
elements have slightly slower increase in conversion ratio than the forward ones. The
possible explanations for these trends are discussed in the next section (see Figure 6.13a).
Figure 6.11 shows the increase of conversion ratio along the axial length in different
kneading blocks at an inlet conversion ratio of O.6, and T = N20 K. It is seen that the
conversion ratio drops with decreasing screw rotational speed, which is similar to that in
conveying elements (see Figure 5.17a). Furthermore, Figure 6.11 shows that at 287 rpm,
the conversion ratio in KB90 has a rapid rise in the middle of the axial length; however,
such a rapid rise does not occur in KB90 at N8 rpm. These phenomena are similar to those
presented in Figure 6.7. Here, the rapid increase in conversion ratio in KB9O at 287 rpm
is attributable to the large viscous dissipation at high screw speed.
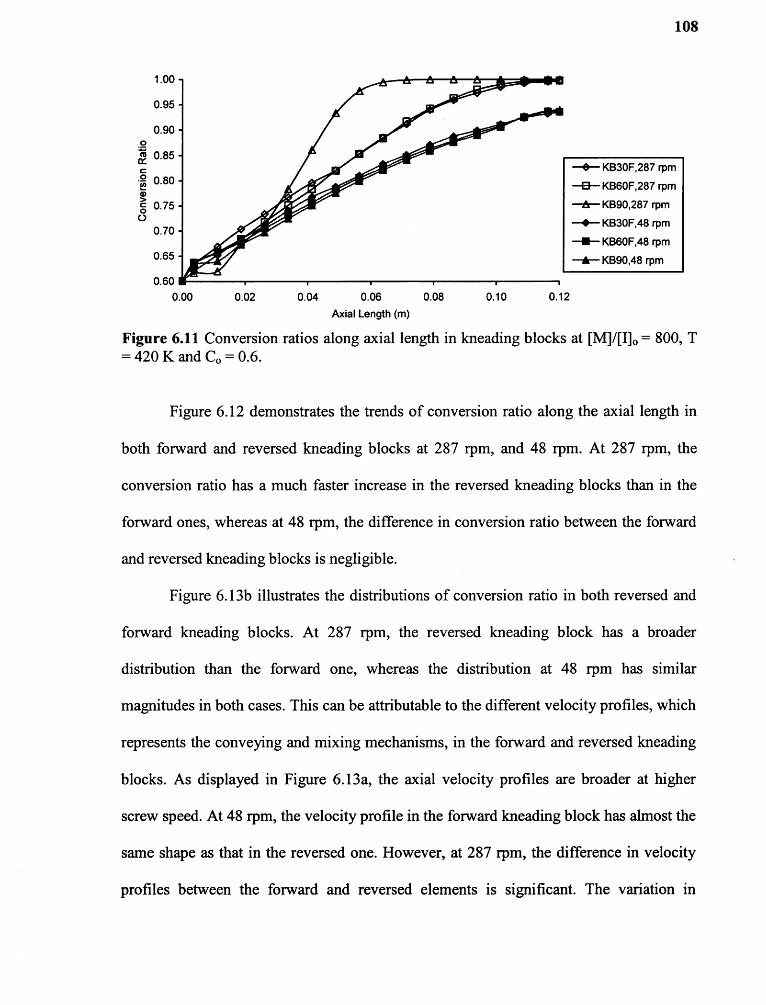
108
Figure 6.12 demonstrates the trends of conversion ratio along the axial length in
both forward and reversed kneading blocks at 287 rpm, and N8 rpm. At 287 rpm, the
conversion ratio has a much faster increase in the reversed kneading blocks than in the
forward ones, whereas at N8 rpm, the difference in conversion ratio between the forward
and reversed kneading blocks is negligible.
Figure 6.13b illustrates the distributions of conversion ratio in both reversed and
forward kneading blocks. At 287 rpm, the reversed kneading block has a broader
distribution than the forward one, whereas the distribution at N8 rpm has similar
magnitudes in both cases. This can be attributable to the different velocity profiles, which
represents the conveying and mixing mechanisms, in the forward and reversed kneading
blocks. As displayed in Figure 6.13a, the axial velocity profiles are broader at higher
screw speed. At N8 rpm, the velocity profile in the forward kneading block has almost the
same shape as that in the reversed one. However, at 287 rpm, the difference in velocity
profiles between the forward and reversed elements is significant. The variation in
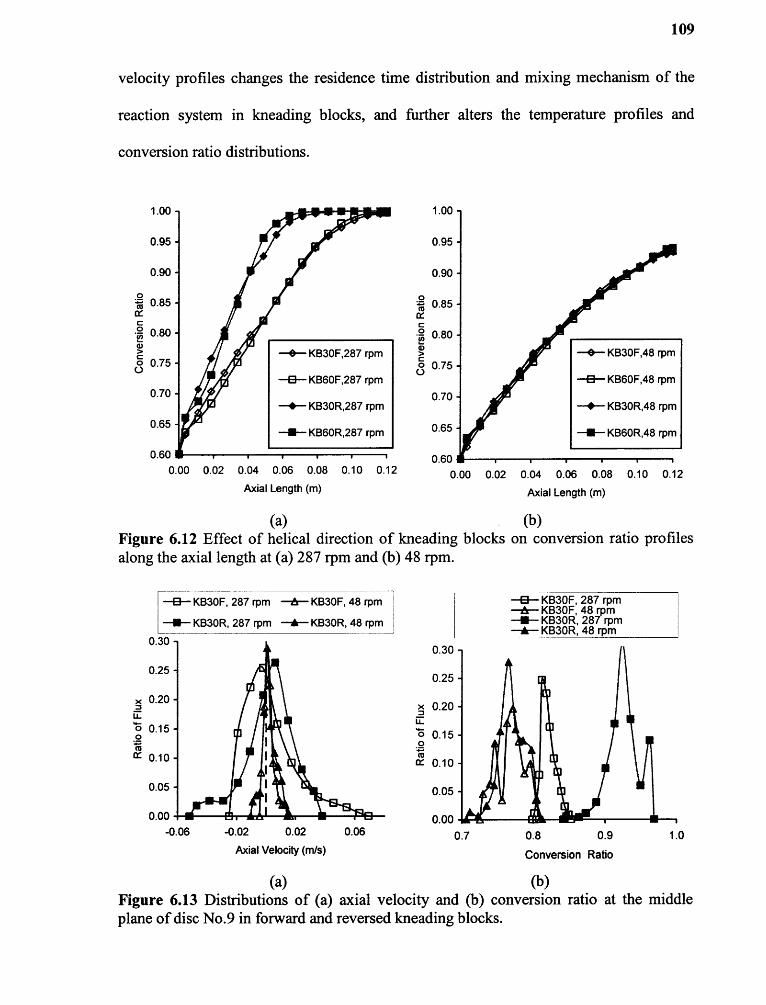
109
velocity profiles changes the residence time distribution and mixing mechanism of the
reaction system in kneading blocks, and further alters the temperature profiles and
conversion ratio distributions.

110
6.1.3 Scale-up Polymerization at [M]/[I]. = 800, T = 420 K, C o = 0.6 in KneadingBlocks
Figure 6.14 summarizes the increase of conversion ratio along the axial length with screw
diameter of 3N mm and 68 mm, respectively. Figure 6.1N shows that the conversion ratio
increases faster with increasing screw diameter. This is due to the fact that the heat loss at
barrel surface is weaker and the non-uniformity of temperature in the screw channel
becomes more pronounced at D = 68 mm than D = 3N mm, as discussed in the preceding
chapter (see section 5.1.5). Furthermore, at D = 68 mm, the effect of kneading block
configurations on polymerization progression is smaller than that at D = 3N mm. This
suggests that at D = 68 mm, the heat loss at barrel surface and the temperature non-
uniformity play more important roles than the kneading block configurations.

111
6.2 Comparison of Polymerization in Conveying Elements and Kneading Blocks
Figure 6.15 demonstrates the comparison of conversion ratio profiles in kneading blocks
and conveying elements at T = N10 K and D = 3N mm. At 287 rpm, the conversion ratio
is higher in the kneading blocks than the conveying elements, but this trend is reversed at
N8 rpm. The possible explanation is as follows. As discussed in the preceding chapters,
the reaction progression depends on the competing result among the heat from reaction,
viscous heating and heat loss through the barrel. Because the conversion at the channel
inlet is zero, viscous heating is not an important energy source to reaction. Meanwhile,
both the heat loss through the barrel and the heat from reaction enhance with increasing
mixing intensity of fluid in screw elements, which further relies on the geometry of the
screw element and operational conditions. Accordingly, the competition between the
heat generation and heat loss in kneading blocks could lead to different results, compared
with that in conveying elements, even at an identical screw rotational speed. Thus, the
effect of screw geometry, i.e. conveying elements or kneading blocks, on the trends of
conversion ratio along axial length could diverge at different screw rotational speeds.
On the other hand, when the inlet conversion ratio is 0.6, as shown in Figure 6.16,
the screw element geometry has a very little effect on the conversion ratio profiles at N8
rpm. At 287 rpm, the conversion ratio increase in conveying elements is faster than that
in the forward kneading blocks, but are lower than that in the neutral kneading block (i.e.,
with a stagger angle of 90°). There are two possible reasons for this phenomenon. First,
the velocity gradient in fluid near the barrel surface is smaller in the conveying elements
than the kneading blocks, as displayed in Figures 5.1Ob and 6.9a, which causes a larger
heat loss in the latter. Secondly, as shown in Figure 6.17, the shear rates in conveying

112
elements are higher than those in kneading blocks at identical screw speed. This indicates
that viscous dissipation in kneading blocks could be lower than that in conveying
elements, although the former have more intensive mixing capacity. In the current case,
viscous dissipation is a critical energy source in reaction. Consequently, the competition
between viscous dissipation and heat loss at the barrel surface makes the reaction in the
forward kneading blocks slightly slower than that in the conveying elements at 287 rpm.
The large increase in conversion ratio in the neutral kneading block (KB9O) at 287 rpm is
due to the small heat loss at the barrel surface, as presented in Figure 6.9a.

113

114
Figure 6.18 shows the effect of geometry of screw elements on polymerization
with a screw diameter of 68 mm, at 287 rpm, when the inlet conversion is O.6. This plot
indicates that SE12OF has a much higher conversion ratio than KB3OF and KB9O,
whereas the conversion in SENOF is larger than that in KB30F, but lower than that in
KB9O. Compared with a screw diameter of 3N mm (as shown in Figure 6.16a), the effect
of element geometry on polymerization is less significant at large screw diameters,
because the heat loss at the barrel surface is so low that the non-uniformity of
temperature in the screw elements might be more important than the back-mixing.

115
6.3 Conclusions
In this chapter, the polymerization of E-caprolactone in various kneading blocks was
simulated with a 3-D model, and compared with those in conveying elements. Similar to
the conclusions on the studies of reactions in the conveying elements, discussed in the
preceding chapter, it has been found that the polymerization progression in kneading
blocks not only depends on the mixing mechanisms, but also on both the heat generation
in the reaction system and the heat loss at barrel surface.
The trends of conversion ratio in the neutral kneading blocks (KB9O) would be
different from those of forward and reversed kneading blocks, due to the low heat loss at
barrel surfaces. Generally, the conversion ratio in KB9O has a faster increase than those
in the forward kneading blocks, especially at high screw speed. The conversion ratio in
the reversed kneading blocks may either have a faster, or a slower increase than those in
the forward kneading blocks, depending on the conditions of reaction. The effect of
screw element geometry, i.e. kneading blocks and conveying elements, on polymerization
progression could be significant, relying on the conversion ratio at the let or screw
rotational speed.
After scaling up diameter of the kneading blocks, the polymerization becomes
faster. Furthermore, the difference in conversion ratio in kneading blocks and conveying
elements is less pronounced with increasing diameter. This is attributable to the low heat
loss at the barrel surface and the pronounced non-uniformity of temperature in the screw
channel.

CHAPTER 7
GLOBAL MODELING AND SCALING UP POLYMERIZATIONIN TWIN-SCREW EXTRUSION
When an extruder is used as a polymerization reactor, generally, liquid monomers are fed
into the feeding zone, instead of resins in granules or pellets. As mentioned in Chapter 3,
the screw channel in a twin-screw extruder is either partially-filled or fully-filled. In the
previous two chapters, polymerization of E-caprolactone in fully-filled conveying
elements and kneading blocks was simulated with a 3-D model. An the present chapter,
the simulation method for a partially-filled channel is first discussed, followed by the
global simulation of polymerization in a twin-screw extruder. The simulated results are
then compared with experimental data. Finally, the scaled up polymerization in twin
screw extruders is discussed.
7.1 Polymerization in Partially-Filled Channels
According to Janssen (79), twin-screw extruders can be divided into two types: (1) those
with positive conveying as the main transportation mechanism, such as in counter-
rotating intermeshing twin-screw extruders, and (N) those with drag flow as the main
transportation mechanism, such as in co-rotating twin-screw extruders. When the screw
channel is partially-filled, the degree of fill, E, is defined as:
116

117
where Q is the volumetric flow rate, and Q. is the maximum conveying capacity of the
screw element. Accordingly, the residence time for materials in the partially-filled region
is given as:
where t and tj represent the residence time when the channel is partially- and fully-
filled, respectively. Bat is the volume of the screw channel, and B pr the volumetric flow
rate per revolution.
The distribution of fluid in the partially-filled screw channel has two possibilities:
materials either remain at the bottom of channels or are dragged up by the pushing flight,
depending on the relationship between gravitational force and viscous force. The
gravitational force can be evaluated by the Froude number, F r, and the viscous effect by
Revnnlric number Re•
in which V is the average velocity of material in the screw channel; Hch is the depth of
the channel, and g the gravitational constant; i1 and p are the viscosity and density of the
fluid, respectively. The ratio between these two dimensionless numbers is known as
Jeffrey's number (80):
When Jr is larger than a certain value, the viscous force dominates the gravitational force.
However, this is only true when the centrifugal force is neglected. When the extruder
runs at high speed and the screw diameter is large, the centrifugal force could become a
dominant force, which pushes the materials to leave the screw flight.
When the reaction system has low viscosity and is located at the bottom of
barrels, the fluid elements are conveyed downstream by the positive displacement
mechanism. Consequently, the maximum conveying capacity of the screw channel, Qmax
in Eq. 7.1, is given as:
where N is the screw rotational speed in revolution per second.
When the reaction system has sufficiently high viscosity, it will stay at the push
side of the flight. Accordingly, the maximum conveying capacity of the screw elements is
achieved with drag flow mechanism,
where n is the screw tip number, and A is the cross sectional area of a screw channel. Az
is the velocity along the screw channel, and y the helical angle of the flight. Because the
conveying capacity based on the positive displacement (Eq. 7.7) is much larger than that
based on the drag flow mechanism (Eq. 7.8), the residence time of materials would be
shorter when located at the bottom of barrels than those occupying the push side of the
flight.

119
The simulation results in the previous two chapters indicate that in the fully-filled
forward screw elements, both the back-flux and the heat transfer at barrel surfaces play
important roles in determining the polymerization progress. It is known that in the
partially-filled channel, the pressure gradient along the axial length is zero. This suggests
that there is no axial mixing. However, transverse mixing still exists because of the
pushing effect of the screw flights, although it is much weaker than that in the fully-filled
case. In the current study, a drag flow model and a chamber model are proposed,
respectively, to predict the polymerization progression in the partially-filled channel with
materials attached to the flight (Figure 7.1), and with materials occupying the bottom of
the barrel (Figure 7.N).
When the polymeric materials occupy part of the screw channel, some free
surfaces are formed, as shown in Figures 7.1. The shape of the free surface is so complex
that it is not easily predicted. In this study, the free surfaces are assumed to be straight
planes, either vertically (Figure 7.1) or horizontally (Figure 7.Na).
The 3-D model for the partially-filled channel with materials attached to the screw
flight is shown in Figure 7.1. Here, the curved screw channel is unwrapped into a plane.
The barrel is fixed, and the screw channel is moving at a velocity of V z , given by Eq. 7.9.
The free surface is assumed to be parallel to the YZ plane. As a consequence, the cross
sectional area filled with materials can be determined by the geometry of the conveying
element, and the degree of fill. The length of the simulation domain, AL, is given by:

120
where AZ is the axial length of the partially-filled zone. Similar to what has been
assumed in the simulation of the fully-filled screw elements, the barrel has a constant
temperature and the screw has adiabatic conditions. The free surface is assumed to have
symmetric conditions for velocity and adiabatic conditions for energy.
Figure 7.1 Models for partially-filled channels with materials located at pushing flight.
Considering the fact that materials in the screw channel are conveyed with the
drag flow mechanism, the 3-D drag flow model presented in Figure 7.1 can be further
simplified into a N-D model. The application of a 2-D model in simulation of reactive
extrusion is exposed in detail elsewhere (38-39). At should be noted here that in the N-D
modeling, the width of the channel and the velocity of the moving screw surface should
be calculated based on the degree of fill, screw rotational speed, flow rate and geometry
of the screw channel.
An the above discussions, the leaking flow in the gaps between the screws and
barrels is not included. When leaking flow is taken into consideration, the degree of fill in

121
the screw channel and the residence time should rise. The leaking flow rate over the
screw flight is given as (23):
where 6 is the gap between the screw and the barrel. Hence, in calculating the degree of
fill based on Eq.7.1, Q should be replaced by (Q + VLF),
The average residence time is also corrected to be:
where V. is the volume of the flight. In the 3-D modeling, the correction of the residence
time is achieved by adjusting the length of the simulation domain,
Figure 7.2 presents the 3-D chamber model when the materials stay at the bottom
of the barrel. The reaction system in a chamber is conveyed forwardly with the positive
displacement mechanism. For example, the reaction system initially located at chamber
No.1 is conveyed to the location of chamber No.3 due to the screw rotation, as shown in
Figure 7.Nb. However, there is no exchange of materials between chambers if the leaking
flow is neglected. Consequently, when the reaction system occupies the bottom of the
barrel, the polymerization can be predicted with tracing the reaction progression in a
chamber, i.e. the chamber model.
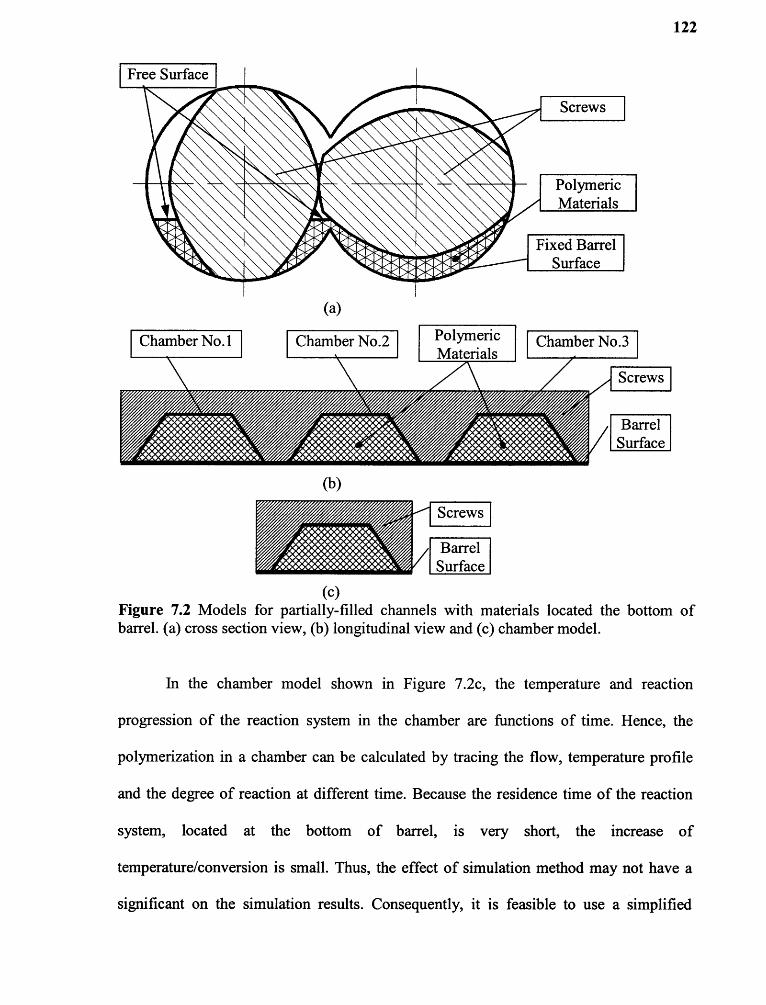
In the chamber model shown in Figure 7.Nc, the temperature and reaction
progression of the reaction system in the chamber are functions of time. Hence, the
polymerization in a chamber can be calculated by tracing the flow, temperature profile
and the degree of reaction at different time. Because the residence time of the reaction
system, located at the bottom of barrel, is very short, the increase of
temperature/conversion is small. Thus, the effect of simulation method may not have a
significant on the simulation results. Consequently, it is feasible to use a simplified

123
model, such as 1-D model or N-D model, to predict the reaction progression instead of the
chamber model.
7.2 Global Simulation of Polymerization in Twin-screw Extruders
As discussed in Chapter 3, a reversed calculation procedure is used in the simulation of
reaction in twin-screw extruders: the calculation starts from the die, and then goes to the
upstream elements. Studies in the reactive extrusion with twin-screw extruders (25-32)
show that the average residence time in the extruder does not change significantly due to
the reaction. This indicates that the distribution of materials along the screw relies on
operational conditions, such as feeding rate, screw speed and screw configuration, almost
independent of viscosity of the system. This can be explained with the simulation results
in the present study. As shown in the previous chapters, the pressure gradient in the fully-
filled screw elements depends on the advancement of the reaction, because the viscosity
of the system increases with reaction progression. Accordingly, the progress of reaction
has a significant effect on pressure and pressure gradient, but not on the length of the
fully-filled zones. This implies that the distribution of materials along the screw during
reaction can be predicted with a non-reaction system, with a reasonable accuracy.
In the current study, the simulation of polymerization of e-caprolactone in a co-
rotating twin-screw extruder was carried out as follows:
1. Use a 3-D Newtonian, isothermal model to calculate the pressure gradient in the
reversed elements and die, and their upstream screw elements under a certain
operational condition;

124
2. Assuming that the die and the reversed elements are fully-filled, calculate the length
of fully-filled zone in the elements at the upstream of die and/or reversed elements,
based on the equilibrium of pressure;
3. Calculate the degree of fill in the partially-filled zone, and the average residence
time in both partially-filled and fully-filled zones; then
N. Starting the numerical simulation from the feeding point of the mixture of monomer
and initiator, calculate the temperature and conversion ratio forwardly, with the 3-D
simulation model for the fully-filled zones and 1-D or N-D model for the partially
filled channels.
7.3 Validation of Simulation of Polymerization in Twin-screw Extruders
In this section, the simulation results based on the method proposed in the previous
section are compared with Vergnes' experimental data (25). An their study,
polymerization of E-caprolactone was carried in a Leistritz LSM 30-3N co-rotating twin-
screw extruder. A slit die having a width of 50 mm, NN mm long and a gap of 2 mm, was
fixed at the end of the extruder. The screw profile is given in Table 7.1. The ratio of
monomer to initiator, [MVMo was 1000. The barrel temperatures were 105°C. The flow
rate was 1.5 kg/hr or 3 kg/br, and screw-rotating speed was 100 rpm.
As discussed previously, the first two steps in modeling of reactive extrusion are
the calculation of the pressure profile, and the degree of fill along the screw, assuming
that die and reversed elements are fully-filled. Table 7.2 summarizes the calculated length
of the fully-filled and partially-filled zones along the screw profile at 100 rpm, based on a
3-D model with an isothermal and Newtonian flow conditions. In the element

125
SE20/307.5, the lengths of both fully-filled and partially-filled zones are zero (i.e. there is
no material in this element), because the mixture of monomer and initiator is fed at the
downstream of this element. As shown in Table 7.N, the total fully-filled length in the
forward screw elements is small. Most of the lengths of the forward elements are
partially-filled. This is attributable to the low resistance of the reversed kneading blocks.

126
Table 7.3 shows the predicted residence time in the fully-filled and partially-filled
zones along the screw. Because the length of the partially-filled region does not change
significantly at different feeding rates (see Table 7.N), the residence time in the partially-
filled zones almost remains constant with a flow rate either at 1.5 kg/br, or at 3.0 kg/hr.
Thus, Table 7.3 only gives the residence time at the partially-filled zones with Q = 1.5
kg/hr. As shown in Table 7.3, the total residence time in the fully-filled zones decreases
significantly with increasing feeding rate, and it is much higher than that in the partially-
filled zones. Moreover, when the materials are located at the bottom of the barrel, the
residence time is much shorter than that with materials attached to the screw flight. This
is because the materials are conveyed with the positive displacement mechanism when
located at the bottom of the barrel, but drag flow when attached to the screw flight.
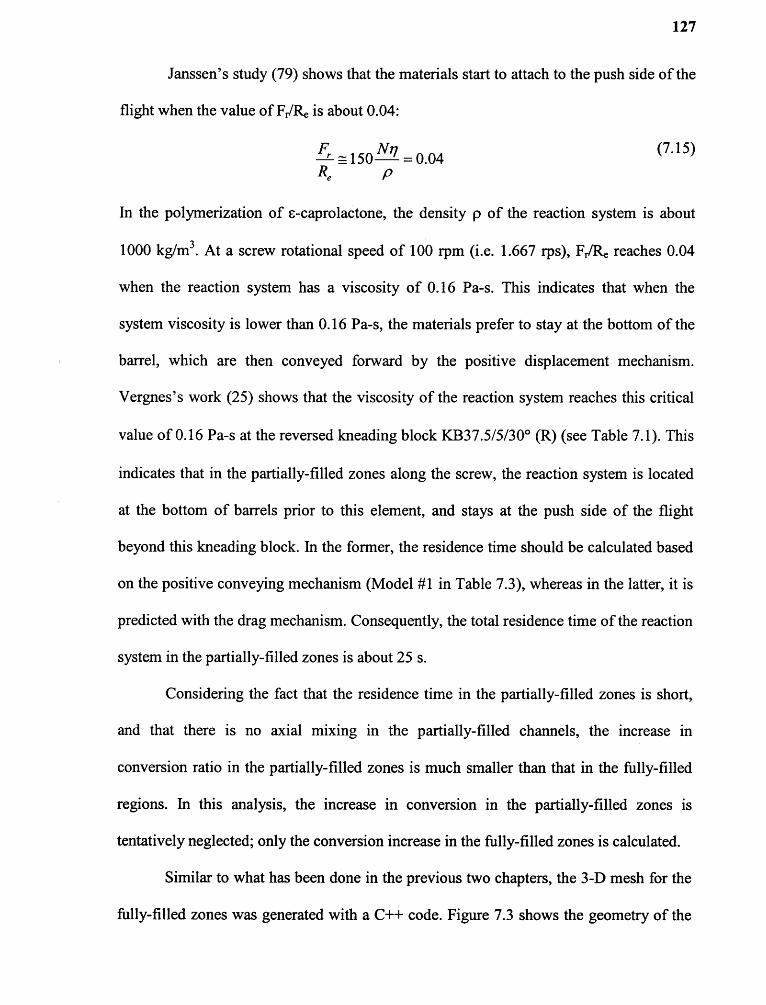
127
Janssen's study (79) shows that the materials start to attach to the push side of the
flight when the value of Fr/Re is about O.0N:
An the polymerization of c-caprolactone, the density p of the reaction system is about
1000 kg/m3 . At a screw rotational speed of 100 rpm (i.e. 1.667 rps), F r/Re reaches O.0N
when the reaction system has a viscosity of 0.16 Pa-s. This indicates that when the
system viscosity is lower than O.16 Pa-s, the materials prefer to stay at the bottom of the
barrel, which are then conveyed forward by the positive displacement mechanism.
Vergnes's work (25) shows that the viscosity of the reaction system reaches this critical
value of O.16 Pa-s at the reversed kneading block KB37.5/5/30° (R) (see Table 7.1). This
indicates that in the partially-filled zones along the screw, the reaction system is located
at the bottom of barrels prior to this element, and stays at the push side of the flight
beyond this kneading block. An the former, the residence time should be calculated based
on the positive conveying mechanism (Model #1 in Table 7.3), whereas in the latter, it is
predicted with the drag mechanism. Consequently, the total residence time of the reaction
system in the partially-filled zones is about 25 s.
Considering the fact that the residence time in the partially-filled zones is short,
and that there is no axial mixing in the partially-filled channels, the increase in
conversion ratio in the partially-filled zones is much smaller than that in the fully-filled
regions. An this analysis, the increase in conversion in the partially-filled zones is
tentatively neglected; only the conversion increase in the fully-filled zones is calculated.
Similar to what has been done in the previous two chapters, the 3-D mesh for the
fully-filled zones was generated with a C++ code. Figure 7.3 shows the geometry of the

128
reversed kneading blocks and their upstream conveying elements, which are fully-filled
in the processing. The mesh for these three sections was generated by 206,080, 147,840,
and 103,0NO brick elements, respectively.
The length of the conveying elements at the upstream of the reversed kneading
blocks in Figure 7.3 was determined based on the calculation results presented in Table
7.2. However, in order to make the mesh generation simple, the length of the fully-filled
zone in the conveying elements was slightly increased, as shown in Table 7.4. It should
be noted here that the small increase in the fully-filled length would raise the residence
time, and thus, partly, make up for the neglected residence time in the partially-filled
zones in the analysis.

129
Figure 7.N shows the profiles of conversion ratio along the axial length based on
the 3-D model proposed in the present study, and experimental results from Vergnes (25),
at 100 rpm and at a feed rate of 1.5 kg/br, and 3.0 kg/br, respectively. Globally, the
conversion ratios of s-caprolactone at the die from the 3-D numerical simulation fit well
with the experimental results. This indicates that the numerical simulation method, i.e. 3-
D model, proposed in this study is reliable. Moreover, Figure 7.N shows that the
conversion ratios from the simulation are slightly lower than the experimental results,
which can be interpreted by the fact that the reactions in the partially-filled zones were
neglected in the current analysis.
Figure 7.4 Comparison of conversion ratios along the axial length from simulation andexperiments.

130
7.4 Effect of Fully-Filled Length on Polymerization in Reactive Extrusion
An the study of Vergnes (25), the polymerization of c-caprolactone in a twin-screw
extruder was modeled with the 1-D channel model and compared with the experimental
results. The simulation results agree well with the experimental data. Accordingly, the
authors concluded that the application of 1-D model in predicting polymerization in twin-
screw extruders is feasible. However, the simulation results presented in Chapter 5
already showed that the difference in calculated polymerization progression based on 1-D
model and 3-D model can be large, depending on the operational conditions. This implies
that the 1-D model may not predict the polymerization in twin-screw extruders correctly.
Consequently, the question that arises here is: which type of reaction condition is 1-D
model applicable?
The conditions for the polymerization used in Vergnes' work (25) are as follows:
1. The diameter of the screw was 3N mm, in which the channel depth was N.0 mm.
2. The length of fully-filled zone was short. The maximum length of the fully-filled
zone was 65 mm.
3. The variation in temperature along the axial length was small.
An the simulation carried out in Chapter 5, the length of the fully-filled elements
was 120 mm. Thus, the question here is whether the length of the fully-filled zone is a
critical factor, which leads to the deviations in polymerization progression based on 1-D
model and 3-D model.
Figure 7.5 shows the predicted conversion ratios of c-caprolactone along the axial
length in conveying elements with a pitch of N5 mm, and at a length of 20 mm, 60 mm
and 120 mm, respectively. The simulation conditions are as follows. The inlet and barrel
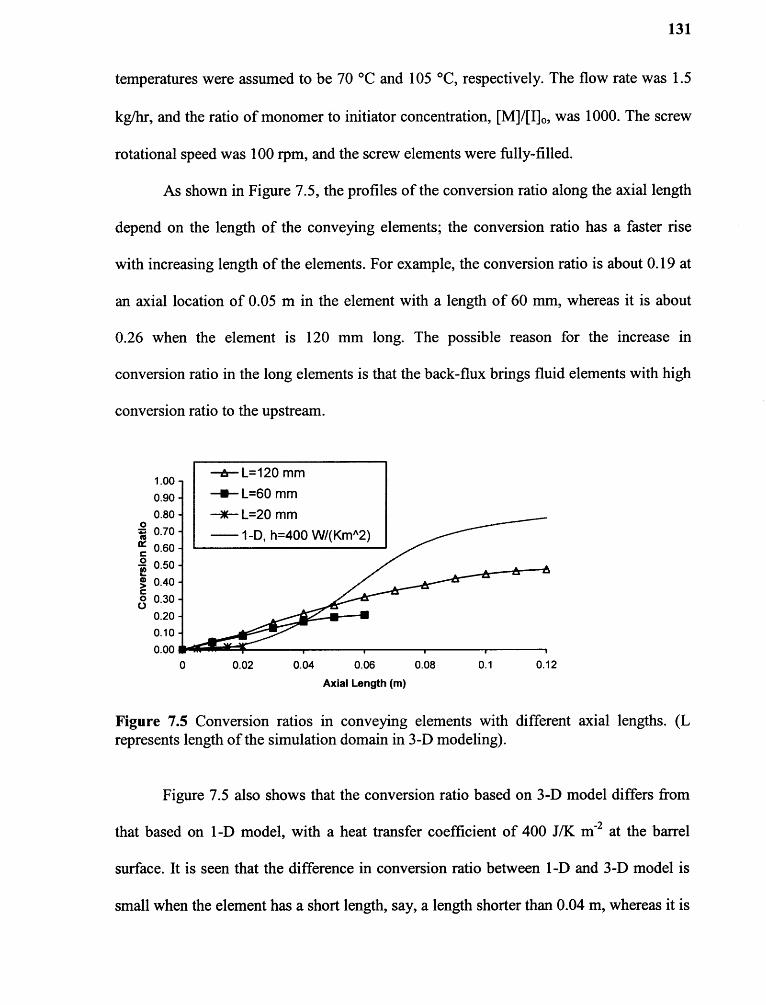
131
temperatures were assumed to be 70 °C and 105 °C, respectively. The flow rate was 1.5
kg/hr, and the ratio of monomer to initiator concentration, [M]/[I],„ was 1000. The screw
rotational speed was 100 rpm, and the screw elements were fully-filled.
As shown in Figure 7.5, the profiles of the conversion ratio along the axial length
depend on the length of the conveying elements; the conversion ratio has a faster rise
with increasing length of the elements. For example, the conversion ratio is about O.19 at
an axial location of 0.05 m in the element with a length of 60 mm, whereas it is about
0.26 when the element is 120 mm long. The possible reason for the increase in
conversion ratio in the long elements is that the back-flux brings fluid elements with high
conversion ratio to the upstream.
Figure 7.5 Conversion ratios in conveying elements with different axial lengths. (Lrepresents length of the simulation domain in 3-D modeling).
Figure 7.5 also shows that the conversion ratio based on 3-D model differs from
that based on 1-D model, with a heat transfer coefficient of NOO JLK 111-2 at the barrel
surface. At is seen that the difference in conversion ratio between 1-D and 3-D model is
small when the element has a short length, say, a length shorter than 0.0N m, whereas it is

132
very significant when the element is longer than O.08 m. This is because the large heat
released from the polymerization changes the heat transfer mechanism at the barrel
surface. This indicates that the 1-D channel works well only under certain conditions,
namely, a simulation domain with short axial length.
7.5 Scale-up Polymerization in Twin-Screw Extrusion
In order to elucidate the mechanisms in the scaled-up polymerization in twin screw
extrusion, a numerical simulation was carried out to trace the polymerization of
s-caprolactone in an extruder with a screw diameter of 68 mm, which is twice that studied
in Section 7.3. The condition for the scale up is given in Table 7.5, in which the average
residence time of materials in the extruder remains identical after the scaling up.
Figure 7.6 summarizes the increase in conversion ratio and temperature along the
axial length of the extruder in the polymerization of c-caprolactone at a screw speed of
100 rpm, at a screw diameter, D, of 68 mm and 3N mm, respectively.

133
As shown in Figure 7.6a, the conversion ratio has a very fast increase and the
reaction is completed at an axial location of about 2ND at D = 68 mm. However, the
conversion ratio is only about O.6 at the die of the extruder with D = 3N mm. This
indicates that the axial length of the extruder (in unit of D), required to complete the
polymerization, is much shorter with increasing screw diameter. This is due to the poor
heat loss at the barrel surface at large screw diameter. As a consequence, the temperature
has a significant rise with increasing screw diameter. As shown in Figure 7.6b, with D =
3N mm, the temperature of the reaction system is very close to the barrel temperature,
134
because the heat from reaction is not large so that most of it can be transfer out through
the barrel. On the other hand, at D = 68 mm, the conversion ratio has a large increase at a
short axial distance (in the fully-filled zone), and the heat from reaction is too large to be
released through the barrel surface, resulting in a large increase in temperature.
The large increase in temperature at a short screw length would cause some
drawbacks for the polymerization, such as degradation of polymeric macromolecules, and
side chain reaction (i.e. branching). This indicates that a good control on temperature
increase is very important in carrying out polymerizations in large extruders. Based on
the simulation results in this study, it is possible to avoid the large increase in temperature
in the large extruders, by the optimization of the screw configuration, operational
conditions, and the cooling system.
At is known that the fully-filled zone in twin-screw extruders is formed due to the
presence of the reversed screw elements, and the length of the fully-filled zone depends
on the configuration of screw element, screw rotational speed and feeding rate. As
discussed in Sections 7.3 and 7.N, the residence time is much longer in the fully-filled
zones than the partially-filled ones, and the reaction becomes fast with increasing length
of the fully-filled zones (see Figure 7.5). This indicates that it is important to reduce the
length of the fully-filled zone, especially when the temperature at its inlet is sufficiently
high, in order to avoid the rapid increase in conversion ratio and temperature.
On the other hand, the enhancement of heat transfer through the barrel or screw
surfaces is also critical to polymerization. This can be achieved by optimizing the design
of cooling systems in the screw or the barrel, or even by designing some specific screw
elements to enhance the mixing andLor the heat transfer at walls.

135
7.6 Conclusions
An this chapter, the conveying mechanism in the partially-filled channels was discussed,
and the global modeling of polymerization in a co-rotating twin-screw extruder was
presented. The comparison between the simulation results and experimental data shows
that the conversion ratios of 6-caprolactone based on the numerical simulation agree well
with those from the experiments. This indicates that the 3-D simulation method proposed
in the current study is reliable.
Scaling up polymerization in twin-screw extruders was also investigated with the
3-D model. The simulation results reveal that polymerization is completed in shorter
screw length (in unit of screw diameter, D) with increasing screw diameter. It is also
found that the temperature increase is more significant along the screw length when the
screw diameter is raised, which would lead to some drawbacks for the polymerization. To
solve this problem, an optimization of screw configurations and geometries of screw
elements, operational conditions, and the cooling systems in screws and barrels should be
carried out, in which the 3-D modeling would be a key tool.
The length of the fully-filled zone has a significant effect on the polymerization
progress because of the back-flux. With increasing fully-filled length, the polymerization
is accelerated, and the difference in polymerization progress between 3-D and 1-D
models becomes pronounced. This implies that the 1-D model can only be used under
certain limitations, such as short fully-filled length, small screw diameter, and low heat
from reaction. The 3-D model is a powerful method, which can be applied at various
reaction conditions.
CHAPTER 8
CONCLUSIONS AND RECOMMENDED WORK
Reactive extrusion is an efficient and environmentally-friendly technique for both
polymerization and chemical modification of polymers. However, it is a complex
reaction engineering process that combines the traditionally separated operations of
polymer chemistry (polymerization or chemical modification) and extrusion, into a single
process in a screw extruder. Numerical simulation is a valuable tool in optimizing
reactive extrusions, in improving quality and reducing cost of the products. The
contributions of the current work are:
1. A 3-D model was developed to simulate the polymerization of s-caprolactone infully filled conveying elements and kneading blocks, in which the kinetics equationfor polymerization was coupled with continuity equation, momentum equation, andenergy equation. Furthermore, the effects of reaction progression, temperature andshear rate upon the system viscosity were incorporated into the modeling.
2. Parametric studies have been carried out to investigate the effects of screwconfigurations, screw diameter, operational conditions, values of heat from reaction,initiator concentration, and heat transfer conditions at barrel surface, upon thepolymerization in fully-filled screw elements of co-rotating twin-screw extruders.
3. Two simulation models were proposed based on the distribution of materials in thepartially-filled channels.
4. A global model for reactive extrusion was proposed, combining the models for thefully-filled elements and the partially-filled channels. The predicted conversionratios at the die agree well with the experimental results from the literature,indicating that the proposed 3-D model for polymerization in twin-screw extruders isreliable.
5. Three indexes, i.e. flux-mixing coefficient, temperature mixing coefficient, andconversion ratio mixing coefficient, were defined for the first time, to evaluate theaxial mixing during reactive extrusion; transverse mixing was characterized by theratio of pressure flow rate to net flow rate in the axial cross section;
6. Scaling up polymerization in twin-screw extruders was studied with the 3-D model,and it was found that 1-D model cannot represent the reaction progress well in the
136
137
large machines. 3-D model should be used in scaled up polymerization in reactiveextrusion.
The simulation results based on the 3-D model indicate that the polymerization of
6-caprolactone in screw elements depends not only on the mixing mechanism and flow
behavior, but also on the heat generation in the reaction system and the heat transfer at
the barrel surfaces. Furthermore, the flow and mixing mechanisms affect the heat
generation and heat transfer behavior, and vice versa. The increase in mixing intensity
generally accelerates the reaction progress, whereas the rise in heat loss through the
barrel surface slows down the reaction (Usually the reaction system has a higher
temperature than the barrel surface). Consequently, the optimization of polymerization
progress in the fully-filled section of twin-screw extruders can be achieved by matching
the flow and mixing mechanisms with the energy generation and energy loss.
The method commonly used in the simulation of reactive extrusion, i.e. 1-D
channel model, was developed based on the assumption that the reaction system has an
ideal mixing in the axial cross section of the flow channel. However, the numerical
simulation results based on the 3-D model show that neither the temperature, nor the
degree of reaction, is uniform at the axial cross sections in the extruder. The application
of 1-D model in predicting the polymerization in reactive extrusion is acceptable only
under certain conditions, such as in the cases where the screw diameter is small, or the
length of the fully-filled zone is short, or the screw rotational speed and the heat from
reaction are low.
The non-uniformity of temperature in the extruder becomes pronounced when the
dimension of the machine is scaled up, in which the 1-D model might fail in predicting
the reaction progression. This implies that the optimizations of screw configurations,
138
operational condition, and cooling system design are extremely important to the
polymerization carried out in large machines, in which 3-D model is a valuable tool.
The modeling of polymerization in co-rotating twin-screw extruders is very
complex, due to the complex flow and mixing behavior, and heat generation and transfer.
An the current studies, it was assumed that the polymerization of e-caprolactone is not
sensitive to distributive mixing, and changes in interfacial areas and shear rate; and the
model based on the quasi-steady state was used to simulate the dynamic motion of fluid
in the twin-screw extrusion. These assumptions could affect the precision of the
numerical simulation results.
The following are the recommended future studies, to address some of the issues
discussed in this thesis:
1. Effect of flow mechanism on reactions in reactive extrusion. The flow in twin-screwextruders is a combination of shear flow and elongational flow. It is important topropose a model to include the presence of elongational flow on reaction.
2. Heat transfer mechanism in large extruders during reactive extrusion. Because thenon-uniformity in temperature becomes pronounced in large machines, it is necessaryto study how to increase the heat transfer through barrel and screw surface, and howto increase the distributive and dispersive mixing in the reaction system.
3. Modeling of reactive extrusion with the dynamic motion of screws. In the currentstudy, the dynamic motion of screws was approximated with steady state simulationmethod. Recently, some technologies, such as Mesh Superposition Technique, havebeen developed to mimic the dynamic motion of screws in the extruders. However,no work has been carried out to check the feasibility of these techniques in thereactive extrusion yet. At will be a great work if some new mesh generationtechnologies can be incorporated into the simulation of reactive extrusion, toinvestigate the effect of the dynamic motion of screws on reactions in the extruders.
REFERENCES
1. S. B. Brown, "Reactive extrusion, a survey of chemical reactions of monomers andpolymers during extrusion processing," Chapter N in Reactive Extrusion,Principles and Practice, M. Xanthos (ed.), Hanser Publishers, Munich, 1992.
2. G.-H. Hu, "Reactive polymer processing: fundamentals of REX", in Encyclopediaof Materials: Science and Technology, K. H. J. Buschow et al. (eds.), ElsevierScience, pp. 80N9-8057, 2001.
3. C. Tzoganakis, "Reactive extrusion of polymers: a review," Adv. Polym. Tech., 9,pp. 321-330, 1989.
4. F. G. Martelli, Twin Screw Extruders: A Basic Understanding, Van NostrandReinhold Co., New York, 1983.
5. C. Rauwendaal, Polymer Mixing, A Self-Study Guide, Hanser Publishers, Munich,1998.
6. J. L. White, Twin Screw Extrusion, Technology and Principles, Hanser Publishers,Munich, 1990.
7. D. B. Todd, "Features of extruder reactors," Chapter 5 in Reactive Extrusion,Principles and Practice, M. Xanthos (ed.), Hanser Publishers, Munich, 1992.
8. D. B. Todd, "Antroduction to compounding," Chapter 1 in Plastic Compounding,Equipment and Processing, D. B. Todd (ed.), Hanser Publishers, Munich, 1998.
9. T. Sakai, "Extrusion equipment for reactive blending," Chapter 7 in ReactivePolymer Blending, W. Baker, C. Scott C., G. H. Hu (eds.), Hanser Publishers,Munich, 2001.
10. P. G. Andersen, "The Werner & Pfleiderer twin-screw co-rotating extruderSystem," Chapter N in Plastic Compounding, Equipment and Processing, D. B.Todd (ed.), Hanser Publishers, Munich, 1998.
11. M. L. Booy, "Geometry of fully wiped twin screw equipment," Polym. Eng. Sci, 18,pp. 937-98N, 1978.
12. M. L. Booy, "Asothermal flow of viscous liquid in corotating twin screw devices,"Polym. Eng. Sci, 20, pp. 1220-1228, 1980.
13. G. H. Hu, "Reactive blending in screw extruders," Chapter 6 in Reactive PolymerBlending, W. Baker, C. Scott C., G. H. Hu (eds.), Hanser Publishers, Munich,2001.
139

140
14. M. Xanthos, "Process analysis from reaction fundamentals: Examples ofpolymerization and controlled degradation in extruders," Chapter 2 in ReactiveExtrusion, Principles and Practice, M. Xanthos (ed.), Hanser Publishers, Munich,1992.
15. J. A. Biesenberger, "Principles of reaction engineering," Chapter 6 in ReactiveExtrusion, Principles and Practice, M. Xanthos (ed.), Hanser Publishers, Munich,1992.
16. R. C. Kowalski, "Fit the reactor to the chemistry, case histories of industrial studiesof extruder reactions," Chapter 1 in Reactive Extrusion, Principles and Practice,M. Xanthos (ed.), Hanser Publishers, Munich, 1992.
17. G. S. Meyhaus, A. Moses, Y. Reibenbach and Z. Tadmor, "Continuouspolymeization in extruder reactor," J. Polym. Sci., Polym. Lett. Ed., 11, pp. 103-111, 1973.
18. B. Siadet, M. Malone and S. Middleman, "Some performance aspects of theextruder as a reactor," Polym. Eng. Sci, 19, pp. 787-79N, 1979.
19. J. Biesenberger and C. Gogos, "Reactive polymer processing," Polym. Eng. Sci, 20,pp. 838-8N6, 1980.
20. J. T. Lindt, "Circular Couette flow of a polymerizing fluid," Polym. Eng. Sci, 21,pp. NNN-N32, 1981.
21. C. Tzoganakis, J. Vlachopoulos and A. E. Hamielec, "Production of controlledrheology polypropylene resins by peroxide promoted degradation duringextrusion," Polym. Eng. Sci, 28, pp. 170-180, 1988.
22. C. Tzoganakis, J. Vlachopoulos and A. E. Hamielec, "Modeling of the peroxidedegradation of polypropylene in a single screw plasticating extruder," Intern.Polym. Proc., 3, pp. 1N1-15N, 1988.
23. W. Michaeli and A. Grefenstein, "Twin-screw extruders for reactive extrusion,"Polym. Eng. Sci., 35, pp. 1N85-150N, 1995.
24. W. Michaeli and A. Grefenstein, "Engineering analysis and design of twin-screwextruders for reactive extrusion," Adv. Polym. Tech., 1N, pp. 263-276, 1995.
25. A. Poulesquen, B. Vergnes, Ph. Cassagnau, J. Gimenez and A. Michel,"Polymerization of s-caprolactone in a twin screw extruder, experimental studyand modeling," Intern. Polym. Proc., XVA, pp. 31-38, 2001.
26. B. Vergnes, G. D. Valle and L. Delamare, "A global computer software for polymerflows in co-rotating twin-screw extruders," Polym. Eng. Sci., 38, pp. 1781-1792,1998.

141
27. F. Berzin, B. Vergnes, P. Dufosse and L. Delamare, "Modeling of peroxide initiatedcontrolled degradation of polypropylene in a twin screw extruder," Polym. Eng.
Ski,NO, pp. 33N-356, 2000.
28. F. Berzin and B. Vergnes, "Transesterification of ethylene acetate copolymer in atwin screw extruder," Intern. Polym. Proc., XIIA, pp. 13-22, 1998.
29. T. Fukuoka, "Numerical simulation of a reactive extrusion processing. Part I.Kinetics study on grafting of vinysilane to polyethylene," Polym. Eng. Sci. N0, pp.2511-2523, 2000.
30. T. Fukuoka, "Numerical simulation of a reactive extrusion processing. Part AI.Simulation and verification for the twin screw extrusion," Polym. Eng. Sci. NO, pp.252N-2538, 2000.
31. H. Kye and J. L. White, "Simulation of continuous polymerization in a modularintermeshing co-rotating twin screw extruder, application to caprolactomconversion to polyamide 6," Intern. Polym. Proc., XI, pp. 129-138, 1996.
32. B. Kim and J. L. White, "Simulation of thermal degradation, peroxide induceddegradation, and maleation of polypropylene in a modular co-rotating twin screwextruder," Polym. Eng. Sci., 37, pp. 576-589, 1997.
33. H. Kye and J. L. White, "Simulation of reactive extrusion: polymerization ofcarprolactam in a modular co-rotating twin screw extruder," Proceedings of 54 th
SPE ANTEC, pp. 309-313, 1996.
34. Z. Chen and J. L. White, "Simulation of non-isothermal flow in modular co-rotatingtwin screw extrusion," Polym. Eng. Sci., 3N, pp. 229-237, 199N.
35. P. Kim and J. L. White, "Transesterification of ethylene vinyl acetate copolymer ina modular intermeshing corotating twin screw extruder with different screwconfigurations," J. Appal. Polym. Sci., 5N, pp. 33-N5, 199N.
36. J. P. Puaux and Ph. Cassagnau, "Modeling a reactive extrusion in a twin-screwextruder," Proceedings of 17th Annual Meeting of Polymer Processing Society(CD-ROM), Montreal, Canada, May, 2001.
37. J. P. Puaux, G. Bozga and A. Ainser, "Residence time distribution in a corotatingtwin-screw extruder," Chem. Eng. Sci., 55, pp. 16N1-1651, 2000.
38. L. Zhu and K. S. Hyun, "Numerical simulation of bulk polymerization ofs-caprolactone in extrusion," Proceedings of 60th SPE ANTEC, pp. 20N-208, 2002.
39. L. Zhu, K. S. Hyun and K. A. Narh, "Modeling of Bulk Polymerization ofcaprolactom in Shear Flow," Proceedings of 18 th Annual Meeting of Polymer
Processing Society (CD-ROM), Guimaraes, Portugal, June, 2002.

142
40. D. Strutt, C. Tzoganakis and T. A. Duever, "Mixing analysis of reactive polymerflow in conveying elements of a co-rotating twin screw extruder," Adv. Polym.Tech., 19, pp. 22-33, 2000.
41. D. Strutt, C. Tzoganakis and T. A. Duever, "Mixing analysis of reactive polymerflow in a single-screw extruder channel," Polym. Eng. Sci., NO, pp. 992-1003,2000.
42. D. B. Todd, "Heat transfer in twin screw extruders," Proceedings of 34 th SPEANTEC, pp. 5N-59, 1988.
43. J. L. White, E. Kim, J. Keum and H. Jung, "Modeling heat transfer in screwextrusion with special application to modular self-wiping co-rotating twin screwextrusion," Polym. Eng. Sci., N1, pp. 1NN8-1N55, 2001.
44. T. Domschke and C. Justus, "Heat transfer in single and twin screw extruders,"Intern. Poly. Proc., VIII, pp. 29N-307, 1993.
45. W. M. Davis, "Heat transfer in extruder reactors," Chapter 7 in Reactive Extrusion,Principles and Practice, M. Xanthos (ed.), Hanser Publishers, Munich, 1992
46. J. Gimenez, Ph. Cassagnau and R., Michel, "Bulk polymerization of caprolactone:Rheological predictive law", J. Rheol., NN, pp. 527-5N7, 2000.
47. J. Gimenez, M. Boudris, Ph. Cassagnau and A. Michel, "Control of bulkE-caprolactone polymerization in a twin screw extruder," Polymer Reaction
Engineering, 8, pp. 35-157, 2000.
48. R. Kricheldorf, M. Berl and N. Scharnagl, "Poly(lactones). 9. Polymerizationmechanism of metal alcoxide, initiated polymerization of lactides and variouslactones," Macromolecules, 21, pp. 286-293, 1988.
49. Ph. Dubois, N. Ropson, R. Jerome and Ph. Teyssie, "Macromolecular engineeringof polylactones and polylactides. 19. Kinetics of ring opening polymerization of E—caprolactone initiated with functional aluminum alkoxides," Macromolecules,29, pp. 1965-1975, 1996.
50. G. Rafler and J. Dahlmarm, "Biodegradable polymers. Polymerization ofe-caprolactone," Acta Polym., N3, pp. 91-95, 1992.
51. N. Ropson, Ph. Dubois, R. Jerome and Ph. Teyssie, "Macromolecular engineeringof polylactones and polylactides. 17. Cryometric and viscosimetric analysis of thespecies active in the ring-opening polymerization of lactones, lactides, and cyclicanhydrides as initiated by aluminum triisoporpoxide," Macromolecules, 27, pp.5950-5956, 199N.
143
52. K. Y. Yasuda, R. C. Armstrong and R. E. Cohen, "Shear flow properties ofconcentrated solution of linear and star branched polyesters," Rheol. Acta, 20, pp.163-178, 1981.
53. C. A. Hieber and H. H. Chiang, "Shear rate dependence modeling of polymer meltviscosity," Polym. Eng. Sci., 32, pp. 831-838, 1992.
54. G. Margin, W. W. Graessley, J. P. Montfort and Ph. Monge, "Linear viscoelasticproperties of polybutadiene solutions," Plastics in Medical Surgery (InternationalConference), 2, pp. 285-289, 1980.
55. V. R. Raju, E. V. Menezes, G. Margin, W. W. Graessley and L. J. Fetters,"Concentration and molecular weight dependence of viscoelastic properties inlinear and star polymer," Macromolecules, 1N, pp. 1668-1676, 1981.
56. M. Daoud, J. P. Cotton, B. Farnoux, G. Jarmink, G. Sarma, H. Benoit, R. Duplessix,C. Picot and P. G. de Germes, "Solutions of flexible polymers. Neutronexperiments and interpolation," Macromolecules, 8, pp. 80N-810, 1975.
57. S. Bidstrup and C. W. Macosko, "Chemorheology relations for epoxy-aminecrosslinking," J. Poly. Sci., Part B: Polym. Phy., 28, pp. 691-709, 1990.
58. 1.-K. Yang and J. D. Lin, "Effects of flow on polymeric reactions," Polym. Eng.Sci., NN, pp. 753-759, 2002.
59. K. J. Ganzeveld and L.P. B. M. Janssen, "A mixing model for multi componentreactions in twin screw extruders applied to the polymerization of urethanes,"Polym. Eng. Sci., 32, pp. N57-N66, 1992.
60. H. Yang and 1. Manas-Zloczower, "Flow field analysis of the kneading disc regionin a corotating twin screw extruder," Polym. Eng. Sci., 32, pp. 1N11-1N17, 1992.
61. H. Cheng and 1. Manas-Zloczower, "Distributive mixing in conveying elements ofa ZSK-53 co-rotating twin screw extruder," Polym. Eng. Sci., 38, pp. 926-935,1998.
62. T. Li and 1. Manas-Zloczower, "Flow field analysis of an intermeshingcounterrotating twin screw extruder," Polym. Eng. Sci., 3N, pp. 551-558, 199N.
63. H. Cheng and 1. Manas-Zloczower, "Study of mixing efficiency in kneading discsof co-rotating twin screw extruders," Polym. Eng. Sci., 37, pp. 1082-1090, 1997.
64. Th. Avalosse, Y. Rubin and L. Fondin, "Non-isothermal modeling of co-rotatingand contra-rotating twin screw extruders," Proceedings of 58th SPE ANTEC, pp.19-2N, 2000.
65. D. M. Kalyon, A. D. Gotsis, U. Yilmazer, C. G. Gogos, H. Sangani, B. Aral and C.Tsenoglou, "Development of experimental techniques and simulation methods to

144
analyze mixing in co-rotating twin screw extrusion," Adv. Polym. Tech., 8, pp.337-353, 1988.
66. Y, Wang and J. L. White, "Non-newtonian flow modeling in the screw regions ofan intermeshing corotating twin screw extruder," J. Non-Newtonian FluidMechanics, 32, pp. 19-38, 1989.
67. H. Potente and J. Flecke, "Analysis and modeling of the residence time distributionin intermeshing co-rotating twin screw extruders based on finite elementsimulations," Proceedings of 55th SPE ANTEC, pp. 110-11N, 1997.
68. D.J. Wal, D. Goffart, E.M. Kiomp, H.W. Hoogstraten and L.P.B.M. Janssen,"Three-dimensional flow modeling of a self-wiping corotating twin-screwextruder. Part II: The kneading section," Polym. Eng. Sci., 36, pp. 912-92N, 1996.
69. D. Goffart, D.J. Wal, E.M. Kiomp, H.W. Hoogstraten, L.P.B.M. Janssen, L.Breysse and Y. Trolez, "Three-dimensional flow modeling of a self-wipingcorotating twin-screw extruder. Part I: The transporting section," Polym. Eng. Sci.36, pp. 901-911, 1996.
70. V. L. Bravo, A. N. Hrymak, A.N. and J.D. Wright, "Numerical simulation ofpressure and velocity profiles in kneading elements of a co-rotating twin screwextruder," Polym. Eng. Sci., NO, pp. 525-5N1, 2000.
71. T. Ashikawa, T. Amano, S.-I. Kihara and K. Funatsu, "Flow patterns and mixingmechanisms in the screw mixing element of a co-rotating twin-screw extruder,"Polym. Eng. Sci., NN, pp. 925-939, 2002.
72. T. Ashikawa, S-I. Kihara and K. Funatsu, "3-D non-isothermal flow field analysisand mixing performance evaluation of kneading blocks in a co-rotating twinscrew extruder," Polym. Eng. Sci., N1, pp. 8NO-8N9, 2001.
73. T. Ashikawa, S-I. Kihara and K. Funatsu, "3-D numerical simulations ofnonisothermal flow in co-rotating twin screw extruders," Polym. Eng. Sci., NO, pp.357-36N, 2000.
74. M. Yoshinaga, S. Katsuki, M. Miyazaki, L. Liu, S-I Kihara and K. Funatsu,"Mixing mechanism of three-tip kneading block in twin screw extruders," Polym.Eng. Sci., NO, pp. 168-178, 2000.
75. K. Funatsu, 5.-I. Kihara, M. Miyazaki, S. Katsuki and T. Kajiwara, "3-D numericalanalysis on the mixing performance for assemblies with filled zone of right-handed and left-handed double-flighted screws and kneading blocks in twin-screwextruders," Polym. Eng. Sci., 42, pp. 707-723, 2002.
76. T. Ashikawa, S.-I. Kihara, K. Funatsu, T. Amaiwa and K. Yano, "Numericalsimulation and experimental verification of nonisothermal flow in counter-

145
rotating nonintermeshing continuous mixers," Polym. Eng. Sci., NO, pp. 365-375,2000.
77. R. Ma, A. N. Hrymak and P. E. Wood, "Numerical simulation and experimentalverification of flow field in a twin screw extruder," Proceedings of 17th AnnualMeeting of Polymer Processing Society (CD-ROM), Montreal, Canada, May,2001.
78. L. Zhu, K. A. Narh and K. S. Hyun, "3-D modeling of polymerization in conveyingelement in twin-screw extruder," Proceedings of 61" SPE ANTEC, pp. 1N7-151,2003.
79. R. A. D. Graaf, D. J. Woldringh and L. P. B. M. Janssen, "Material distribution inthe partially filled zone of a twin screw extruder," Adv. Polym. Tech., 18, pp. 295-302, 1999.
80. J. A. O'Keefe, "Water on the moon and a new nondimensional number," Science,173, pp. 669-670, 1969.