Copyright © Joe McCarthy & Valerie Jennings 2007August 2007 1 Poolbeg Incinerator EIS Climate...
52
1 Copyright © Joe McCarthy & Valerie Jennings 2007 August 2007 Poolbeg Incinerator EIS Climate Chapter A Critique Presented by Joe McCarthy & Valerie Jennings August 2007
-
Upload
gyles-small -
Category
Documents
-
view
215 -
download
0
Transcript of Copyright © Joe McCarthy & Valerie Jennings 2007August 2007 1 Poolbeg Incinerator EIS Climate...
1
Copyright © Joe McCarthy & Valerie Jennings 2007 August 2007
Poolbeg IncineratorEIS Climate Chapter
A Critique
Presented by Joe McCarthy & Valerie Jennings
August 2007

2
Copyright © Joe McCarthy & Valerie Jennings 2007 August 2007
An Analysis of the EIS Climate Chapter
Submission to the
Environmental Protection Agency
Waste Licence Application
W0232-01 Applicant: Dublin City Council
Development: Dublin Waste to Energy Facility
Pigeon House Road
Poolbeg Peninsula
Dublin 4
Submission by: Joe McCarthy & Valerie Jennings

3
Copyright © Joe McCarthy & Valerie Jennings 2007 August 2007
Agenda
▪ Three Poolbeg Models• Our Analysis
» of the first two models
» The Poolbeg 3 Model is not before the EPA as yet
• Findings• Corrected Results
▪ Comparison of All Models
▪ Recent Climate Policy Changes
▪ Conclusion
4
Copyright © Joe McCarthy & Valerie Jennings 2007 August 2007
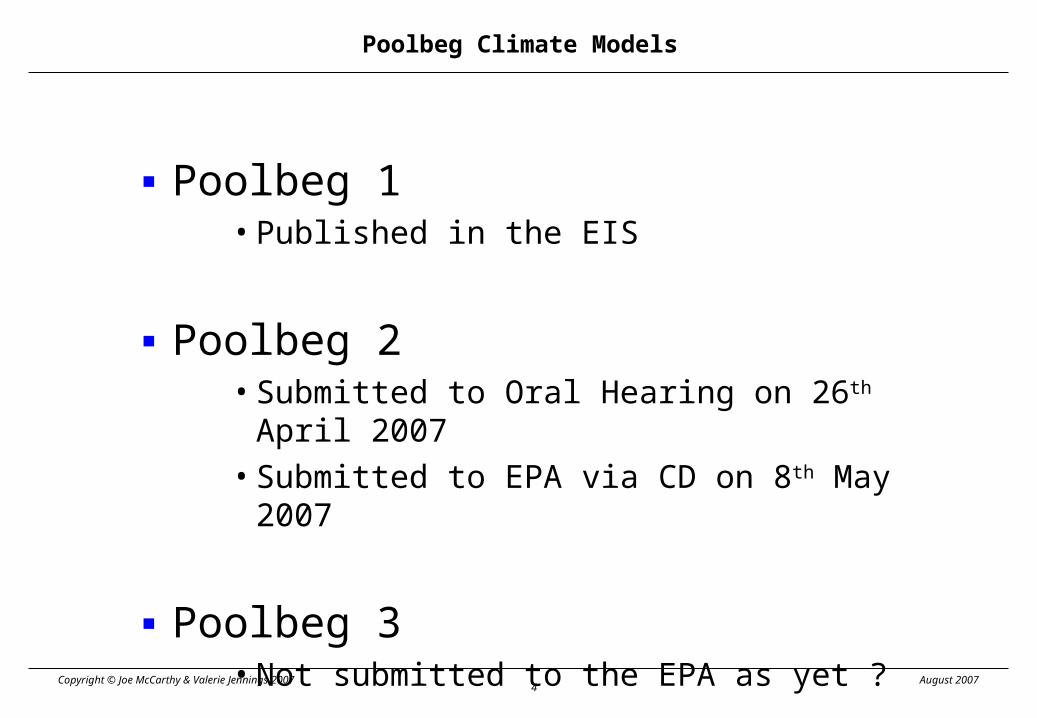
Poolbeg Climate Models
▪ Poolbeg 1 • Published in the EIS
▪ Poolbeg 2• Submitted to Oral Hearing on 26th April 2007• Submitted to EPA via CD on 8th May 2007
▪ Poolbeg 3 • Not submitted to the EPA as yet ?
5
Copyright © Joe McCarthy & Valerie Jennings 2007 August 2007
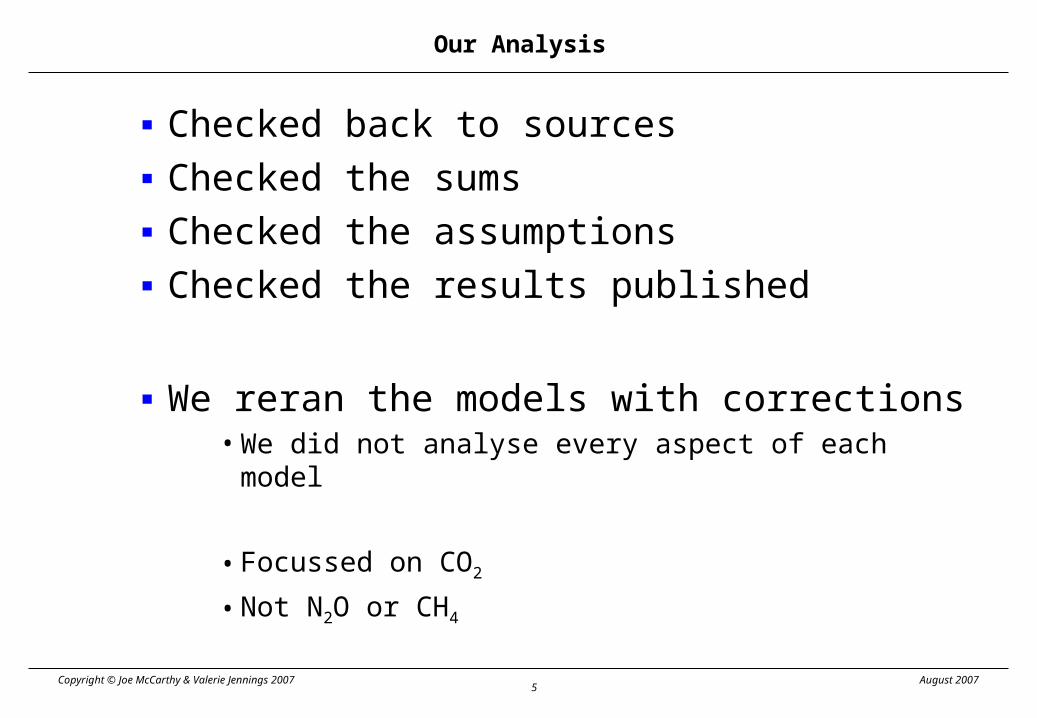
Our Analysis
▪ Checked back to sources
▪ Checked the sums
▪ Checked the assumptions
▪ Checked the results published
▪ We reran the models with corrections• We did not analyse every aspect of each model
• Focussed on CO2
• Not N2O or CH4

6
Copyright © Joe McCarthy & Valerie Jennings 2007 August 2007
Climate Model Methodology
▪ Poolbeg Models • IPCC• EC 2001• ERM DEFRA
▪ Alternatives studied• Landfill• Anaerobic Digestion• Carbon Sequestration
▪ Changes in Mix & Factors
▪ Biogenic CO2• 100% release of entire fraction• Not calculated or reported

7
Copyright © Joe McCarthy & Valerie Jennings 2007 August 2007
Assessment
▪ Waste Mix• Sources - EPA, EC 2001• CCW and FCF• “Other” fraction
▪ Electricity produced• Incorrect MW hours used• CCGT Factor• CO2 avoided
▪ Mistakes in the sums
▪ Corrected Result
Poolbeg 1

8
Copyright © Joe McCarthy & Valerie Jennings 2007 August 2007
Waste Mix – Error in Percentage Sums
Per Table A8.2 CCW FCF Should be Composition %carbon weighted % fossil weighted a b a * b c a * c a * b * cPaper 24.5% 33% 8.1% 0% 0.0% 0.0%Organics 36.7% 19% 7.0% 0% 0.0% 0.0%Plastic 13.2% 61% 8.0% 100% 13.2% 8.0%Glass 3.0% 0% 0.0% 0% 0.0% 0.0%Metals 3.1% 0% 0.0% 0% 0.0% 0.0%Textiles 8.1% 39% 3.2% 50% 4.0% 1.6%Others 11.4% 24% 2.7% 29% 3.3% 0.8% 29.0% 20.5% 10.4%
5.95%
CO2 emissions (tonnes/yr) = Σi( IWi x CCWi x FCFi x EFi x 44/12)
Per Dr Porter Waste CCW FCF EF Conv to CO2 Result
1,000 29% 20.6% 0.95 3.67 208600,000 29% 20.6% 0.95 3.67 124,857
Average F C%5.97% a * b * a * c
Note: CCW and FCF factors taken directly from EC 2001 Waste Management Options and Climate Change
Poolbeg 1

9
Copyright © Joe McCarthy & Valerie Jennings 2007 August 2007
Correction 1 – Waste Mix Percentage Sums
CO2 emissions (tonnes/yr) = Σi( IWi x CCWi x FCFi x EFi x 44/12)
Per JPMcC Waste CCW & FCF EF Conv to CO2 Result
1,000 10.4% 0.95 3.67 363
600,000 10.4% 0.95 3.67 217,700
Average F C%
10.4% a * b * c
CO2 emissions (tonnes/yr) = Σi( IWi x CCWi x FCFi x EFi x 44/12)
Per Dr Porter Waste CCW FCF EF Conv to CO2 Result
1,000 29% 20.6% 0.95 3.67 208
600,000 29% 20.6% 0.95 3.67 124,857
Average F C%
Error 5.97% a * b * a * c
Poolbeg 1

10
Copyright © Joe McCarthy & Valerie Jennings 2007 August 2007
Error in CCW & FCF for “Other” Fraction
Per Table A8.2 CCW FCF Composition %carbon weighted % fossil weighted a b a * b c a * cPaper 24.5% 33% 8.1% 0% 0.0%Organics 36.7% 19% 7.0% 0% 0.0%Plastic 13.2% 61% 8.0% 100% 13.2%Glass 3.0% 0% 0.0% 0% 0.0%Metals 3.1% 0% 0.0% 0% 0.0%Textiles 8.1% 39% 3.2% 50% 4.0%Others 11.4% 24% 2.7% 29% 3.3% 29.0% 20.5%
Poolbeg 1

11
Copyright © Joe McCarthy & Valerie Jennings 2007 August 2007
Correction 2 – CCW & FCF for “Other” Fraction
with adjusted CCW andFCF for "Other"Wasteinput
1000
Composition Tonnes %carbon Carbon % fossil Fossil EF Conv Result
IW CCW FCF Carbon
Paper 24.5% 245 33% 81 0% 0 0.95 3.67 0
Organics 36.7% 367 19% 70 0% 0 0.95 3.67 0
Plastic 13.2% 132 61% 80 100% 80 0.95 3.67 280
Glass 3.0% 30 0% 0 0% 0 0.95 3.67 0
Metals 3.1% 31 0% 0 0% 0 0.95 3.67 0
Textiles 8.1% 81 39% 32 50% 16 0.95 3.67 55
Others 11.4% 114 50% 57 75% 43 0.95 3.67 148
1,000 319 139 484
Waste 600,000 191,684 83,302 290,168
Real F C%
13.9% Entire Carbon Emitted 667,700
Per JPMcC
Note: “Others” mainly refers to composites, fine elements such as ash, unclassified incombustibles and unclassified combustibles including wood wastes. [Dr Porter footnote to Table 8.3 in Appendix 8.2] [EPA 1998]
Others: Includes cooking oil, mineral oil, batteries, composite packaging, tyres and 70,139 tonnes of residues from mechanical treatment of mixed municipal waste shipped to Germany and Northern Ireland for recovery and recycling respectively. [EPA 2004]
Poolbeg 1

12
Copyright © Joe McCarthy & Valerie Jennings 2007 August 2007
Corrected calculation of CO2 emission
Per IPCC 1996 Waste CCW FCF EF Conv to CO2 Result1,000 40% 40.0% 0.95 3.67 557
600,000 40% 40.0% 0.95 3.67 334,400Average F C%
16.0%
Corrected Model
290,168
Take mid point of IPCC and JPMcC estimates 310,000
EIS amount 124,857
Dr Porter is out by a factor of 2.5
Poolbeg 1
13
Copyright © Joe McCarthy & Valerie Jennings 2007 August 2007
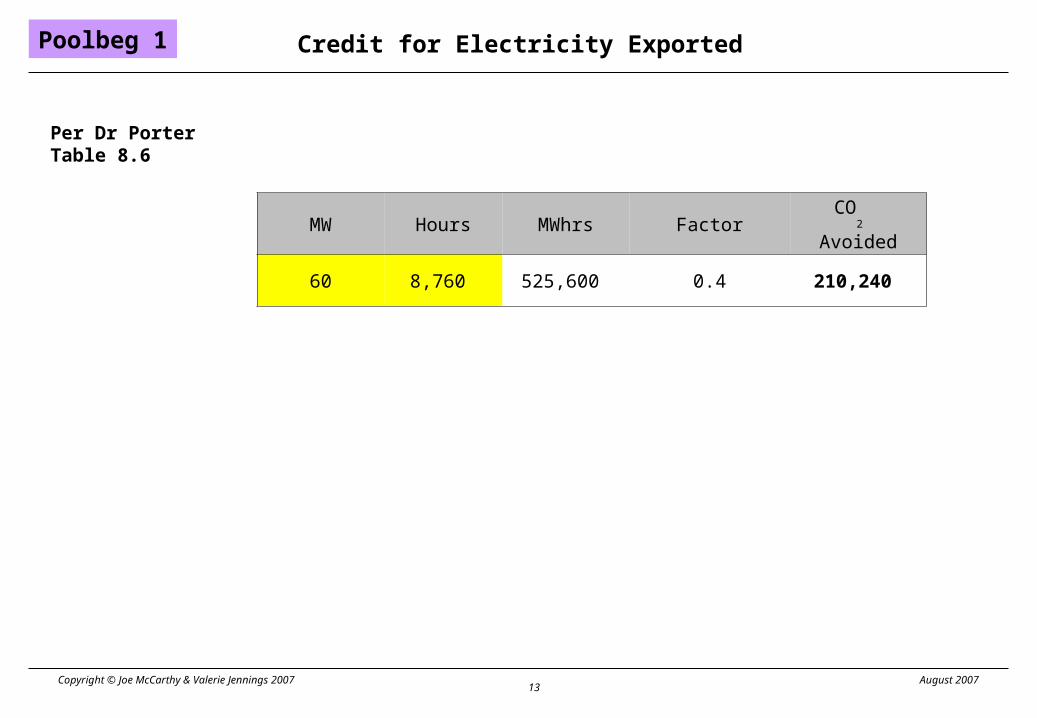
Credit for Electricity Exported
MW Hours MWhrs Factor CO2
Avoided
60 8,760 525,600 0.4 210,240
Poolbeg 1
Per Dr PorterTable 8.6
14
Copyright © Joe McCarthy & Valerie Jennings 2007 August 2007
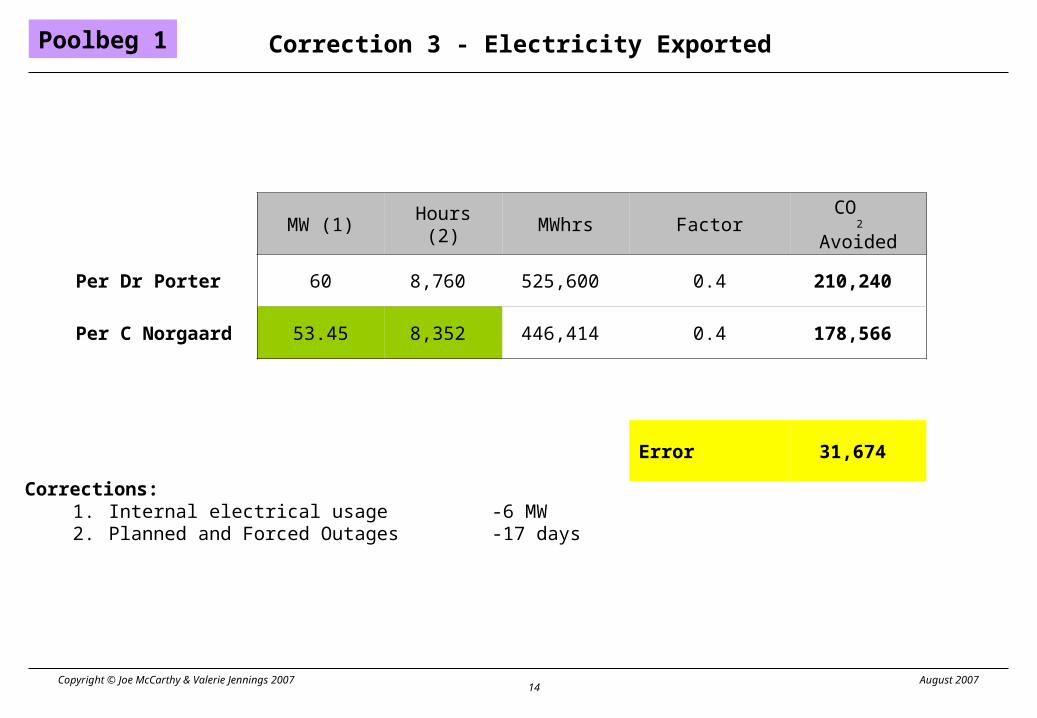
Correction 3 - Electricity Exported
MW (1) Hours (2) MWhrs Factor CO2
Avoided
Per Dr Porter 60 8,760 525,600 0.4 210,240
Per C Norgaard 53.45 8,352 446,414 0.4 178,566
Error 31,674
Poolbeg 1
Corrections:1. Internal electrical usage -6 MW2. Planned and Forced Outages -17 days

15
Copyright © Joe McCarthy & Valerie Jennings 2007 August 2007
Net Position of Incineration after 3 Corrections
Corrections:1. Waste mix % calculation error2. Waste mix “Other” fraction3. Internal electricity usage of 6 MW and Planned and Forced Outages of 17 days
Incineration CO2ElectricityMW Hours
CO2 Avoided Net
Per Dr Porter 600,000 124,857 525,600 210,240 -85,383
As corrected 600,000 310,000 446,414 178,566 131,434
Error 216,817
Poolbeg 1

16
Copyright © Joe McCarthy & Valerie Jennings 2007 August 2007
Scenarios
▪ Incineration
• Landfill+ Carbon sequestration
• Landfill with AD+ Carbon sequestration
Poolbeg 1
17
Copyright © Joe McCarthy & Valerie Jennings 2007 August 2007
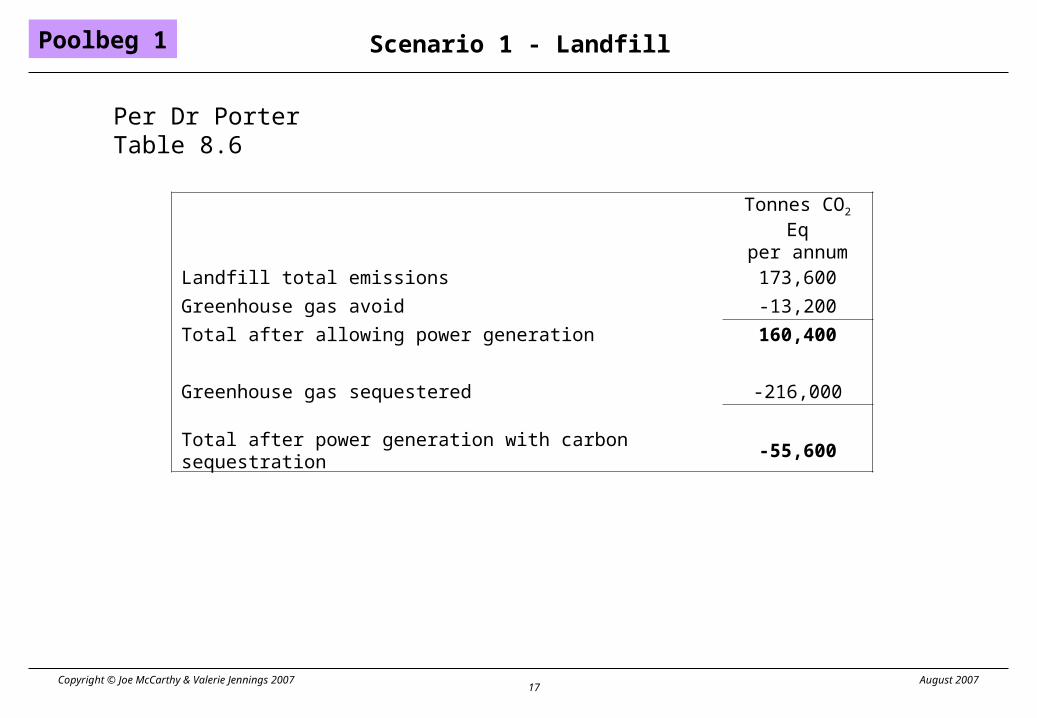
Scenario 1 - Landfill
Per Dr PorterTable 8.6
Tonnes CO2 Eqper annum
Landfill total emissions 173,600
Greenhouse gas avoid -13,200
Total after allowing power generation 160,400
Greenhouse gas sequestered -216,000
Total after power generation with carbon sequestration -55,600
Poolbeg 1
18
Copyright © Joe McCarthy & Valerie Jennings 2007 August 2007
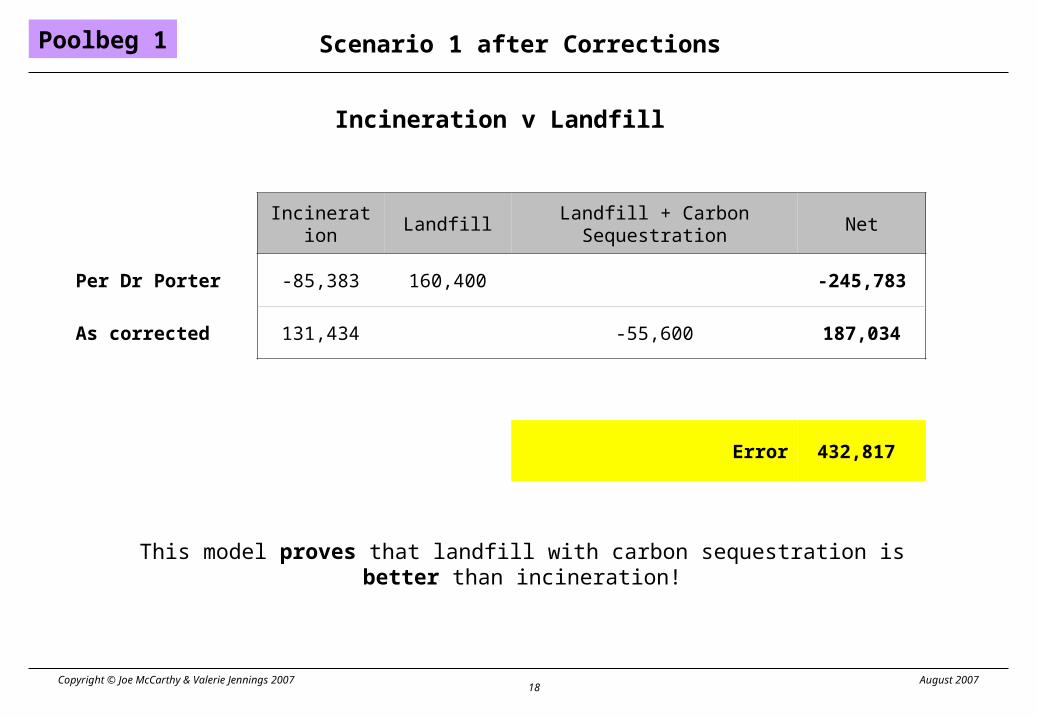
Scenario 1 after Corrections
Incineration Landfill Landfill + Carbon Sequestration Net
Per Dr Porter -85,383 160,400 -245,783
As corrected 131,434 -55,600 187,034
Error 432,817
Incineration v Landfill
This model proves that landfill with carbon sequestration is better than incineration!
Poolbeg 1
19
Copyright © Joe McCarthy & Valerie Jennings 2007 August 2007
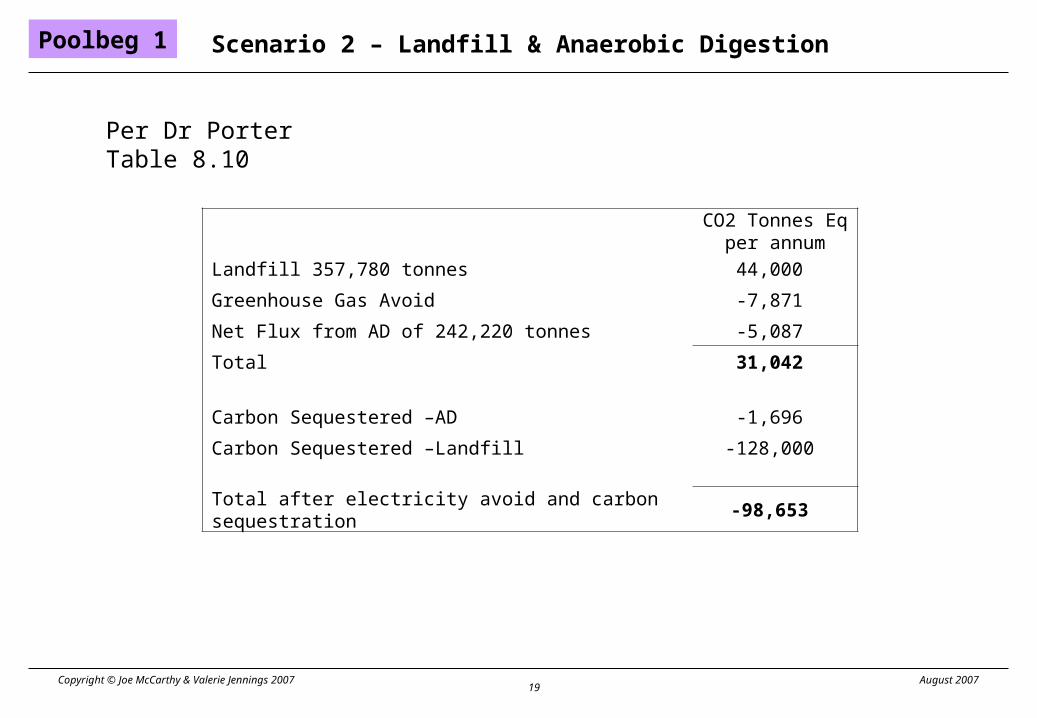
Scenario 2 – Landfill & Anaerobic Digestion
Per Dr PorterTable 8.10
CO2 Tonnes Eqper annum
Landfill 357,780 tonnes 44,000
Greenhouse Gas Avoid -7,871
Net Flux from AD of 242,220 tonnes -5,087
Total 31,042
Carbon Sequestered –AD -1,696
Carbon Sequestered –Landfill -128,000
Total after electricity avoid and carbon sequestration -98,653
Poolbeg 1
20
Copyright © Joe McCarthy & Valerie Jennings 2007 August 2007
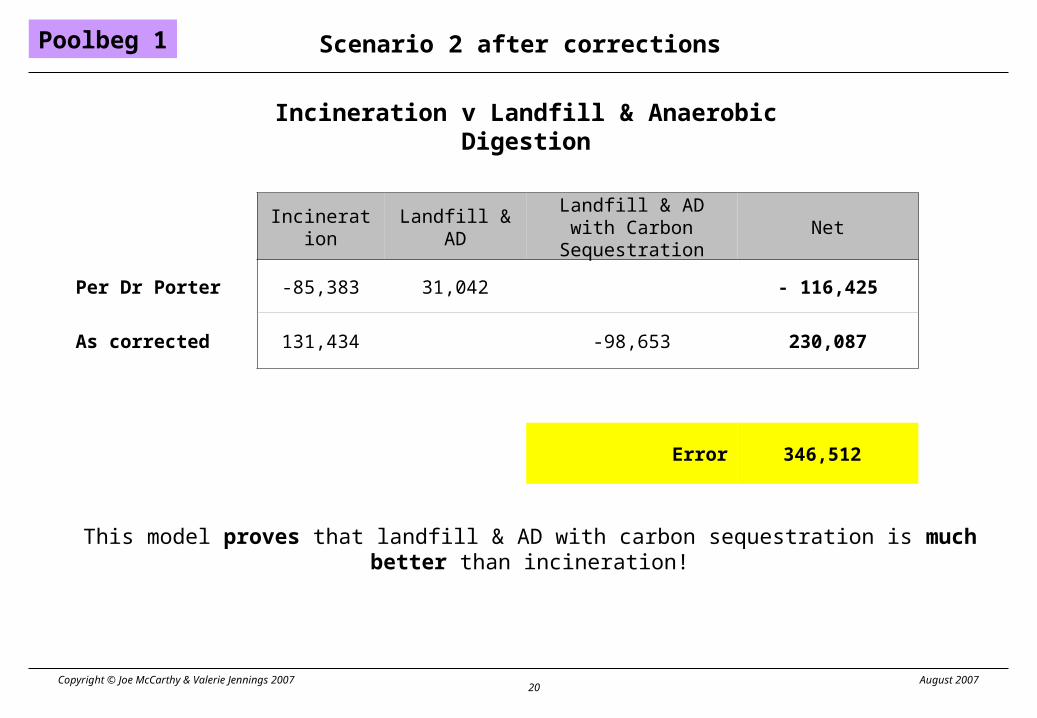
Scenario 2 after corrections
Incineration Landfill & ADLandfill & AD with
Carbon SequestrationNet
Per Dr Porter -85,383 31,042 - 116,425
As corrected 131,434 -98,653 230,087
Error 346,512
Incineration v Landfill & Anaerobic Digestion
This model proves that landfill & AD with carbon sequestration is much better than incineration!
Poolbeg 1

21
Copyright © Joe McCarthy & Valerie Jennings 2007 August 2007
Poolbeg 1 - GHG Emissions
-300
-200
-100
0
100
200
300
400
To
nn
es C
O2
eq /
an
nu
m (
000s
)
Fossil
Displaced
Sequestered
Net Effect
Fossil 320,308 173,600 135,165 44,000
Displaced -154,786 -13,200 -211,666 -12,958
Sequestered -216,000 -129,696
Net Effect 165,522 -55,600 -76,501 -98,653
Corrected Incineration Landfill Incineration Landfill and AD
J P McCarthyChartered EngineerBSc FICS DLS CEng MIEI
Climate Impact Analysis20th March 2007Ver 1.0
Poolbeg 1

22
Copyright © Joe McCarthy & Valerie Jennings 2007 August 2007
Assessment
▪ Waste Mix• Sources - EPA, EC 2001• CCW and FCF• “Other” fraction
▪ Electricity produced• Incorrect MW hours used• CCGT Factor
• CO2 avoided
▪ Corrected Result
Poolbeg 2
23
Copyright © Joe McCarthy & Valerie Jennings 2007 August 2007
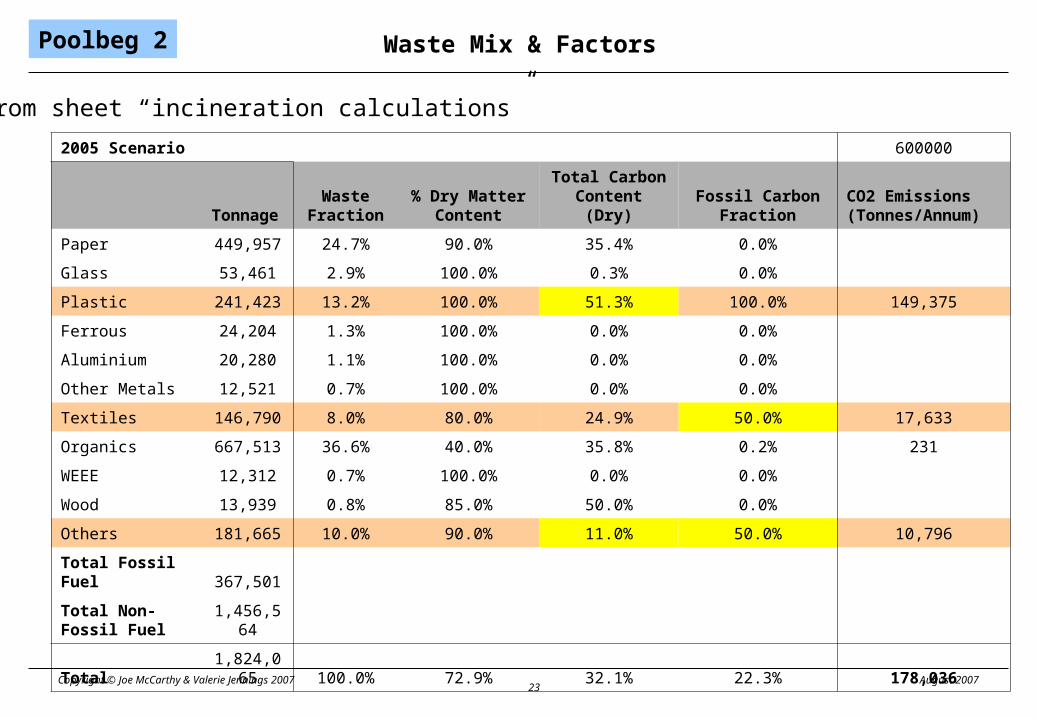
Waste Mix & Factors
2005 Scenario 600000
TonnageWaste
Fraction% Dry Matter
ContentTotal Carbon Content (Dry)
Fossil Carbon Fraction
CO2 Emissions (Tonnes/Annum)
Paper 449,957 24.7% 90.0% 35.4% 0.0%
Glass 53,461 2.9% 100.0% 0.3% 0.0%
Plastic 241,423 13.2% 100.0% 51.3% 100.0% 149,375
Ferrous 24,204 1.3% 100.0% 0.0% 0.0%
Aluminium 20,280 1.1% 100.0% 0.0% 0.0%
Other Metals 12,521 0.7% 100.0% 0.0% 0.0%
Textiles 146,790 8.0% 80.0% 24.9% 50.0% 17,633
Organics 667,513 36.6% 40.0% 35.8% 0.2% 231
WEEE 12,312 0.7% 100.0% 0.0% 0.0%
Wood 13,939 0.8% 85.0% 50.0% 0.0%
Others 181,665 10.0% 90.0% 11.0% 50.0% 10,796
Total Fossil Fuel 367,501
Total Non-Fossil Fuel 1,456,564
Total 1,824,065 100.0% 72.9% 32.1% 22.3% 178,036
From sheet “incineration calculations”
Poolbeg 2

24
Copyright © Joe McCarthy & Valerie Jennings 2007 August 2007
Correction 1 - Waste Mix & Factors
2005 Scenario 600000
TonnageWaste
Fraction% Dry Matter
ContentTotal Carbon Content (Dry)
Fossil Carbon Fraction
CO2 Emissions (Tonnes/Annum)
Paper 449,957 24.7% 90.0% 35.4% 0.0%
Glass 53,461 2.9% 100.0% 0.3% 0.0%
Plastic 241,423 13.2% 100.0% 61% 100.0% 177,620
Ferrous 24,204 1.3% 100.0% 0.0% 0.0%
Aluminium 20,280 1.1% 100.0% 0.0% 0.0%
Other Metals 12,521 0.7% 100.0% 0.0% 0.0%
Textiles 146,790 8.0% 80.0% 24.9% 100.0% 35,267
Organics 667,513 36.6% 40.0% 35.8% 0.2% 231
WEEE 12,312 0.7% 100.0% 0.0% 0.0%
Wood 13,939 0.8% 85.0% 50.0% 0.0%
Others 181,665 10.0% 90.0% 50.0% 100.0% 98,598
Total Fossil Fuel 367,501
Total Non-Fossil Fuel 1,456,564
Total 1,824,065 100.0% 72.9% 32.1% 22.3% 311,715
From sheet “incineration calculations”
Poolbeg 2
25
Copyright © Joe McCarthy & Valerie Jennings 2007 August 2007
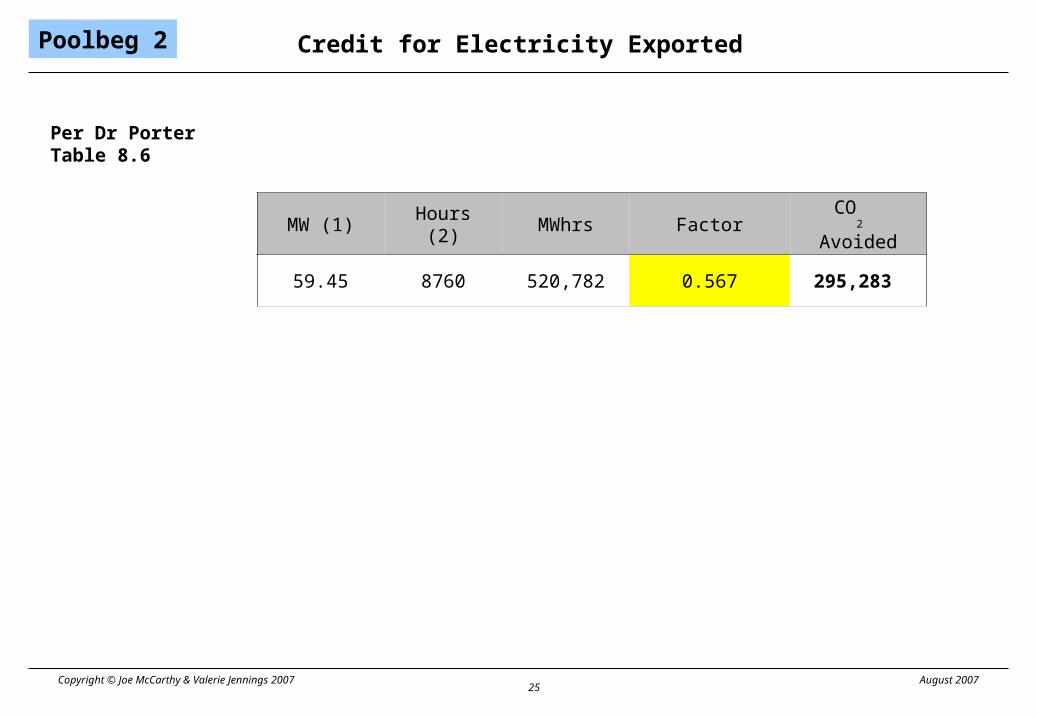
Credit for Electricity Exported
MW (1) Hours (2) MWhrs Factor CO2
Avoided
59.45 8760 520,782 0.567 295,283
Poolbeg 2
Per Dr PorterTable 8.6

26
Copyright © Joe McCarthy & Valerie Jennings 2007 August 2007
Correction 2 - Electricity Exported
MW (1) Hours (2) MWhrs Factor CO2
Avoided
Per Dr Porter 59.45 8760 520,782 0.567 295,283
Per C Norgaard 53.45 8,352 446,414 0.4 178,566
Error 116,718
Poolbeg 2
Corrections:1. Internal electrical usage -6 MW2. Planned and Forced Outages -17 days3. Factor for avoided electricity
27
Copyright © Joe McCarthy & Valerie Jennings 2007 August 2007
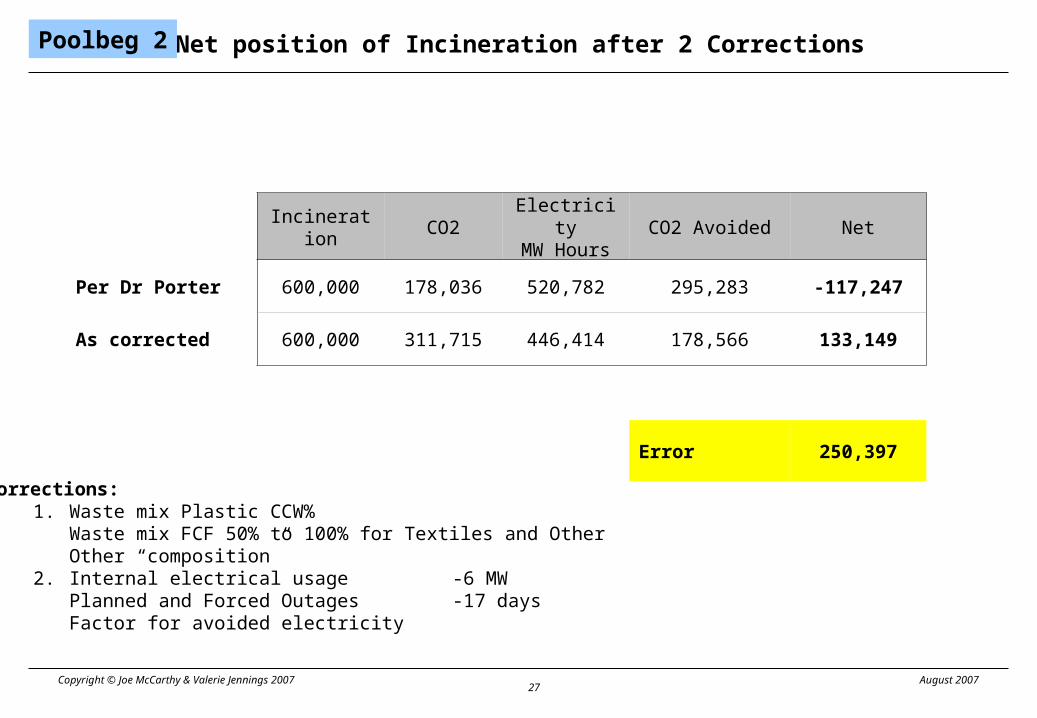
Net position of Incineration after 2 Corrections
Corrections:1. Waste mix Plastic CCW%
Waste mix FCF 50% to 100% for Textiles and OtherOther “composition”
2. Internal electrical usage -6 MWPlanned and Forced Outages -17 daysFactor for avoided electricity
Incineration CO2ElectricityMW Hours
CO2 Avoided Net
Per Dr Porter 600,000 178,036 520,782 295,283 -117,247
As corrected 600,000 311,715 446,414 178,566 133,149
Error 250,397
Poolbeg 2

28
Copyright © Joe McCarthy & Valerie Jennings 2007 August 2007
ScenariosPoolbeg 2
▪ Scenario 1 – Incineration v Landfilling▪ Scenario 2 – Incineration v Landfilling & AD▪ Scenario 3 – Incineration v Landfilling
• with reducing tonnages
▪ Scenario 4 – Incineration v Landfilling • with reducing biogenic content
▪ Scenario 5 – Incineration v Landfilling • As Scenario 4 with reducing gas capture
▪ Scenario 6 – Incineration v Landfilling & AD• with carbon sequestration
▪ Scenario 7 – Incineration v Landfilling • with 80,000 tonnes sludge
▪ Scenario 8 – Incineration v Landfilling & AD• with carbon sequestration and District Heating
29
Copyright © Joe McCarthy & Valerie Jennings 2007 August 2007
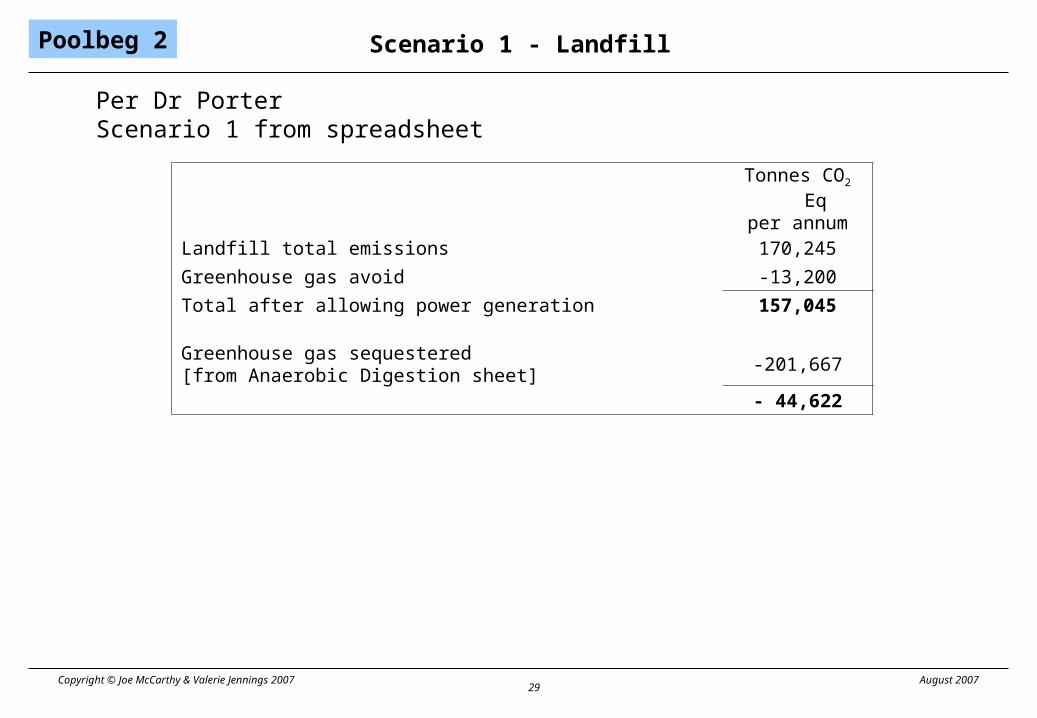
Scenario 1 - Landfill
Per Dr PorterScenario 1 from spreadsheet
Tonnes CO2 Eqper annum
Landfill total emissions 170,245
Greenhouse gas avoid -13,200
Total after allowing power generation 157,045
Greenhouse gas sequestered[from Anaerobic Digestion sheet]
-201,667
- 44,622
Poolbeg 2
30
Copyright © Joe McCarthy & Valerie Jennings 2007 August 2007
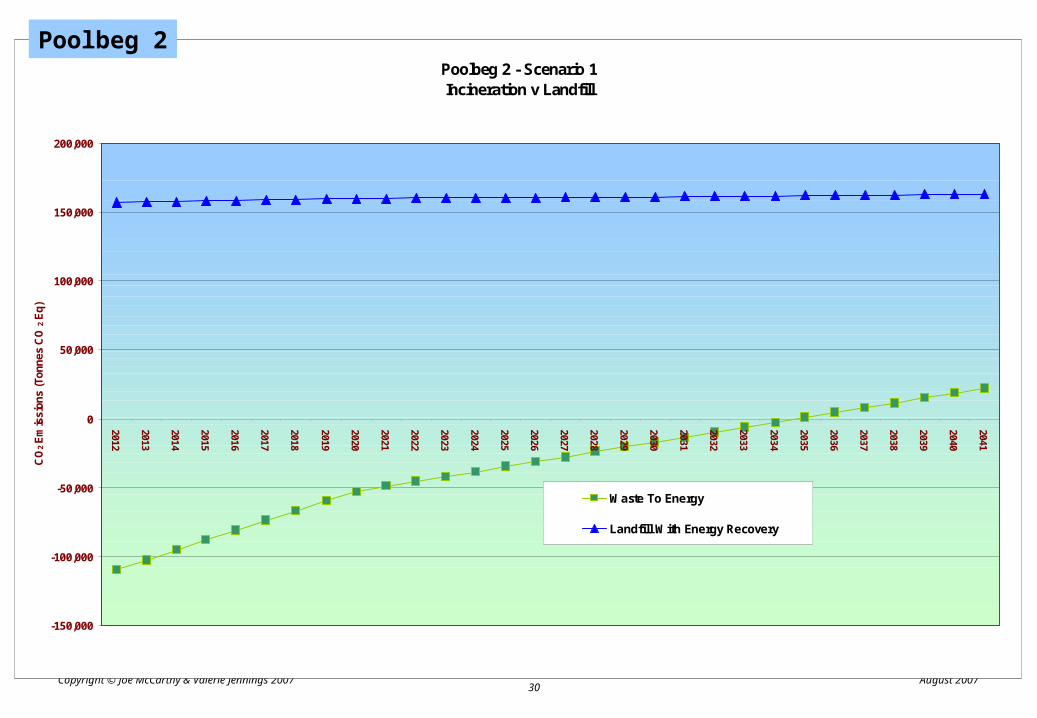
Poolbeg 2 - Scenario 1Incineration v Landfill
-150,000
-100,000
-50,000
0
50,000
100,000
150,000
200,000
2012
2013
2014
2015
2016
2017
2018
2019
2020
2021
2022
2023
2024
2025
2026
2027
2028
2029
2030
2031
2032
2033
2034
2035
2036
2037
2038
2039
2040
2041
CO
2 Em
issi
ons
(Ton
nes
CO
2 E
q)
Waste To Energy
Landfill With Energy Recovery
Poolbeg 2
31
Copyright © Joe McCarthy & Valerie Jennings 2007 August 2007
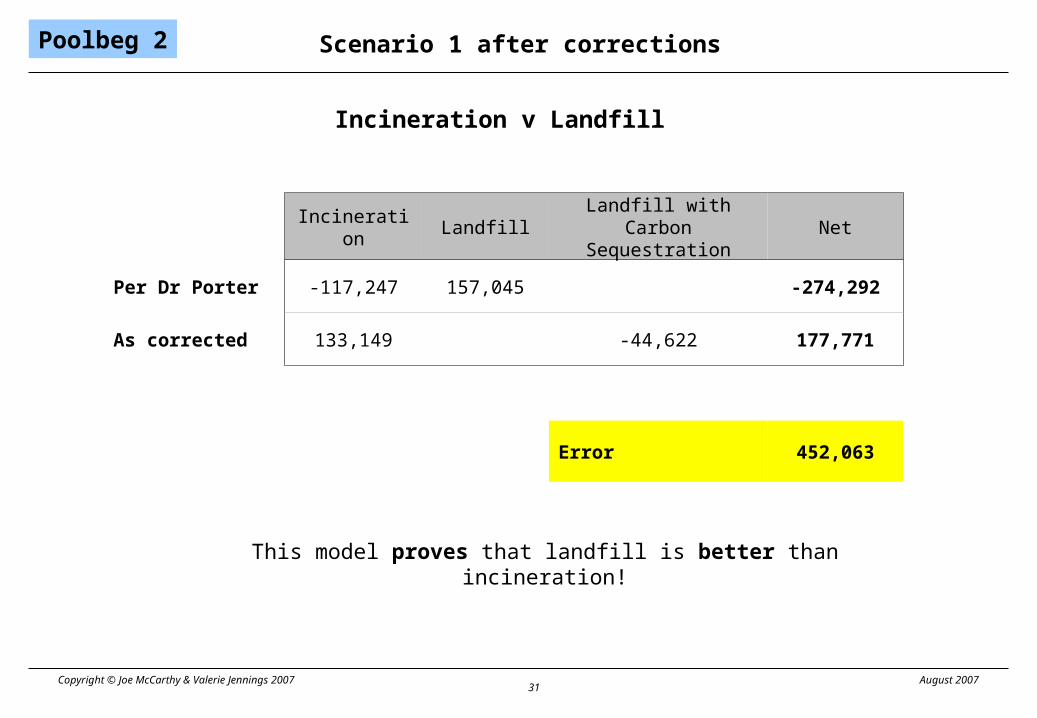
Scenario 1 after corrections
Incineration LandfillLandfill with Carbon
SequestrationNet
Per Dr Porter -117,247 157,045 -274,292
As corrected 133,149 -44,622 177,771
Error 452,063
Incineration v Landfill
Poolbeg 2
This model proves that landfill is better than incineration!

32
Copyright © Joe McCarthy & Valerie Jennings 2007 August 2007
Poolbeg 2 - Scenario 1 CorrectedIncineration v Landfill
-150,000
-100,000
-50,000
0
50,000
100,000
150,000
200,000
2012
2013
2014
2015
2016
2017
2018
2019
2020
2021
2022
2023
2024
2025
2026
2027
2028
2029
2030
2031
2032
2033
2034
2035
2036
2037
2038
2039
2040
2041C
O2
Em
iss
ion
s (
To
nn
es
CO 2
Eq
)
Waste To Energy
Landfill With Energy Recovery
Poolbeg 2
33
Copyright © Joe McCarthy & Valerie Jennings 2007 August 2007
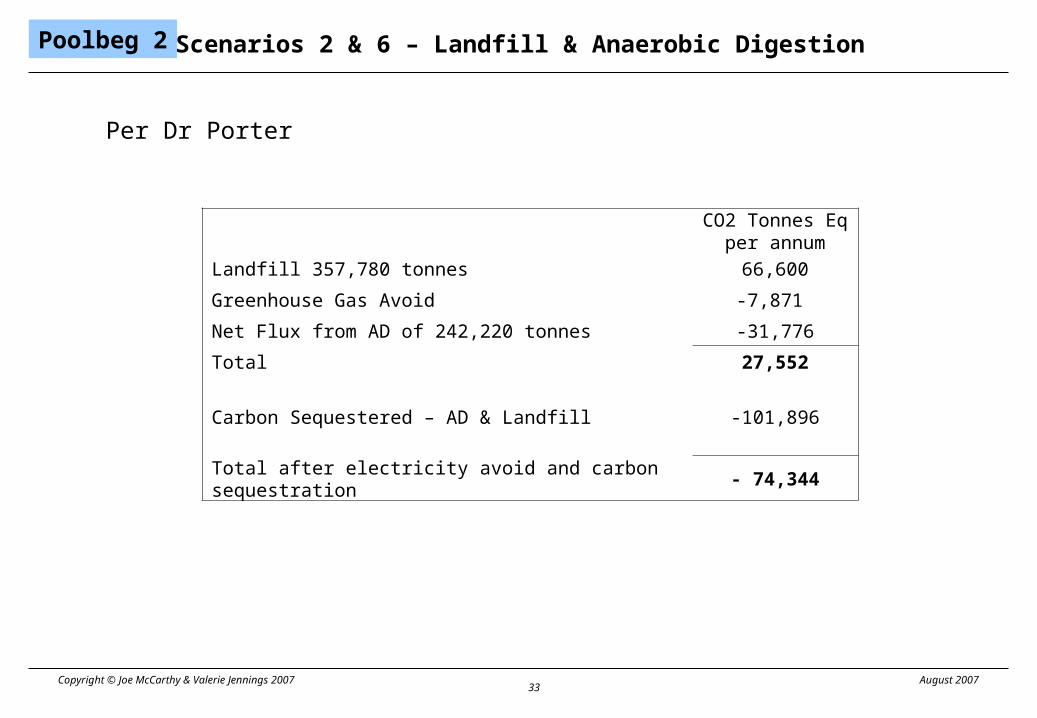
Scenarios 2 & 6 – Landfill & Anaerobic Digestion
Per Dr Porter
CO2 Tonnes Eqper annum
Landfill 357,780 tonnes 66,600
Greenhouse Gas Avoid -7,871
Net Flux from AD of 242,220 tonnes -31,776
Total 27,552
Carbon Sequestered – AD & Landfill -101,896
Total after electricity avoid and carbon sequestration - 74,344
Poolbeg 2
34
Copyright © Joe McCarthy & Valerie Jennings 2007 August 2007
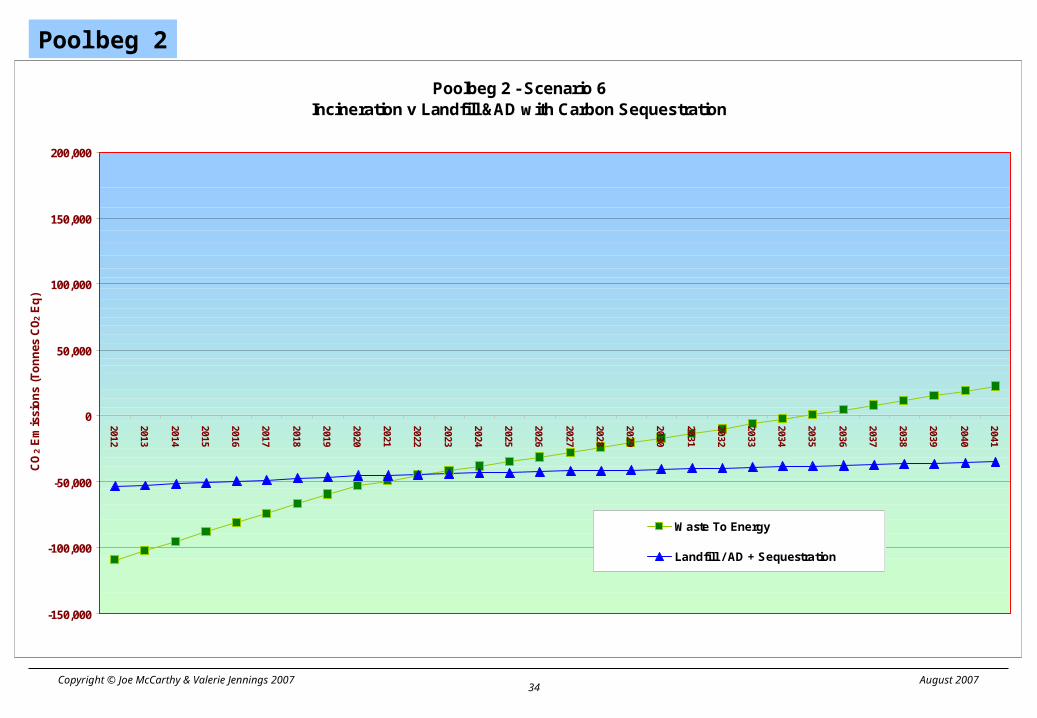
Poolbeg 2 - Scenario 6Incineration v Landfill &AD with Carbon Sequestration
-150,000
-100,000
-50,000
0
50,000
100,000
150,000
200,000
2012
2013
2014
2015
2016
2017
2018
2019
2020
2021
2022
2023
2024
2025
2026
2027
2028
2029
2030
2031
2032
2033
2034
2035
2036
2037
2038
2039
2040
2041C
O2 E
mis
sio
ns
(To
nn
es C
O2
Eq
)
Waste To Energy
Landfill / AD + Sequestration
Poolbeg 2

35
Copyright © Joe McCarthy & Valerie Jennings 2007 August 2007
Scenarios 2 & 6 after corrections
Incineration Landfill & ADLandfill & AD with
Carbon SequestrationNet
Per Dr Porter -117,247 27,552 -144,799
As corrected 133,149 -74,344 207,493
Error 352,292
Incineration v Landfill & Anaerobic Digestion
Poolbeg 2
This model proves that landfill and AD is much better than incineration!

36
Copyright © Joe McCarthy & Valerie Jennings 2007 August 2007
Poolbeg 2 - Scenario 6 CorrectedIncineration v Landfill & AD with Carbon Sequestration
-150,000
-100,000
-50,000
0
50,000
100,000
150,000
200,000
2012
2013
2014
2015
2016
2017
2018
2019
2020
2021
2022
2023
2024
2025
2026
2027
2028
2029
2030
2031
2032
2033
2034
2035
2036
2037
2038
2039
2040
2041C
O2
Em
issi
on
s (T
on
nes
CO
2 E
q)
Waste To Energy
Landfill / AD + Sequestration
Poolbeg 2

37
Copyright © Joe McCarthy & Valerie Jennings 2007 August 2007
Criticisms
▪ Dr Porter changes his models• 3 different attempts for this EIS
▪ Inconsistent sources• EPA, DEFRA, EC 2001, IPCC• Why were factors replaced?
▪ Electricity Avoid Factor• CCGT 0.4 or Renewable 0.0
▪ Models were not peer reviewed• His models were accepted at face value• Ringaskiddy• Meath 1 and Meath 2• Poolbeg 1

38
Copyright © Joe McCarthy & Valerie Jennings 2007 August 2007
Waste Mixes Used
0%
5%
10%
15%
20%
25%
30%
35%
40%P
ap
er
Gla
ss
Pla
stic
Fe
rro
us
Alu
min
ium
Oth
er
Me
tals
Te
xtile
s
Org
an
ics
WE
EE
Wo
od
Oth
ers
Ringaskiddy
Meath 2
Poolbeg 1
Poolbeg 2
ERM Defra
39
Copyright © Joe McCarthy & Valerie Jennings 2007 August 2007
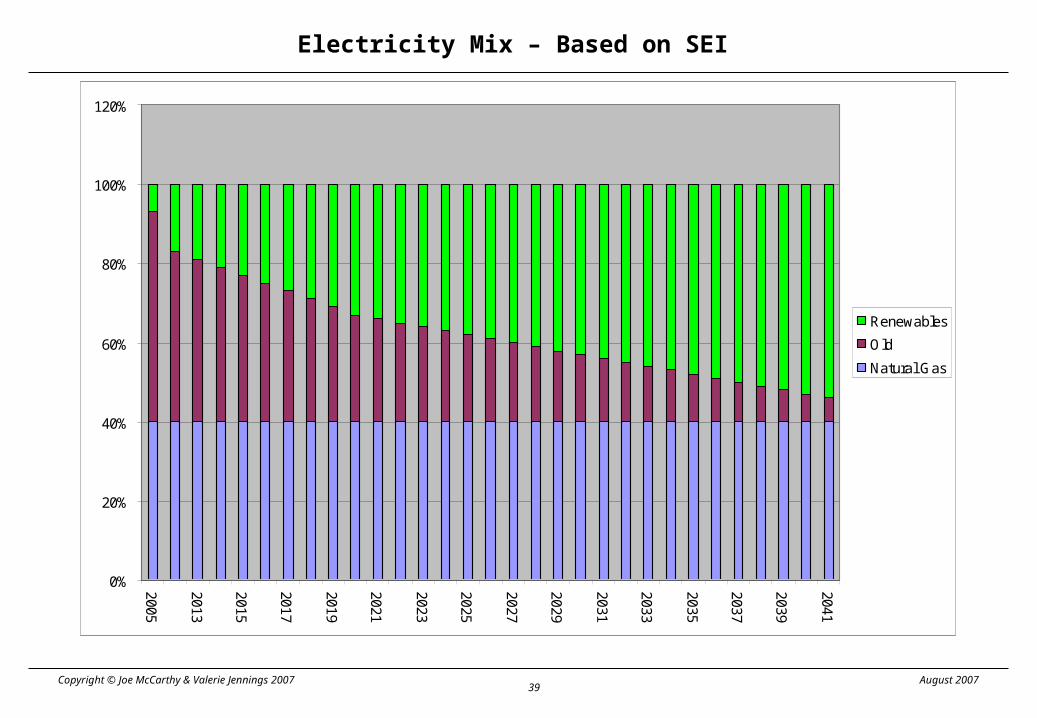
Electricity Mix – Based on SEI
0%
20%
40%
60%
80%
100%
120%
2005
2013
2015
2017
2019
2021
2023
2025
2027
2029
2031
2033
2035
2037
2039
2041
Renewables
Old
Natural Gas

40
Copyright © Joe McCarthy & Valerie Jennings 2007 August 2007
CCGT CO2 Avoided
0.000
0.100
0.200
0.300
0.400
0.500
0.600
0.700
2005
2012
2013
2014
2015
2016
2017
2018
2019
2020
2021
2022
2023
2024
2025
2026
2027
2028
2029
2030
2031
2032
2033
2034
2035
2036
2037
2038
2039
2040
2041
kg C
O2
pe
r kW
h
0%
10%
20%
30%
40%
50%
60%
70%
Corrected
AWN
Renewables

41
Copyright © Joe McCarthy & Valerie Jennings 2007 August 2007
Presentation of results
▪ Figures for comparison• Scientific Notation
3.45E+05 tonnes
• %s of large national total0.17%
• Simplify345,000 tonnes
▪ Graphs• Varying Scales• Confusing scenarios
▪ Presented results different from model

42
Copyright © Joe McCarthy & Valerie Jennings 2007 August 2007
Trends in interpretation
▪ Porter Models • Ringaskiddy• Meath 1• Meath 2• Poolbeg 1• Poolbeg 2• Poolbeg 3 – not submitted to the EPA
▪ Corrected Models• Poolbeg 1• Poolbeg 2• Poolbeg 3

43
Copyright © Joe McCarthy & Valerie Jennings 2007 August 2007
Porter Incineration ModelsEmissions per 1000 tonnes MSW
-500
-400
-300
-200
-100
0
100
200
300
400
500
600
Ringas
kidd
y
Mea
th 2
Poolb
eg 1
Poolbeg 2
Poolb
eg 3
IPCC 1
996
P1 Cor
recte
d
P2 Cor
rect
ed
P3 Cor
recte
d
To
nn
es
of
CO
2 e
q
CO2 emitted
Electricity Credit
Net

44
Copyright © Joe McCarthy & Valerie Jennings 2007 August 2007
Conclusion
▪ Dr Porter’s climate models are wrong
▪ EIS statements on climate are wrong
▪ Entire carbon fraction assessment omitted
▪ Policy on climate has changed
▪ The EPA should refuse licence
45
Copyright © Joe McCarthy & Valerie Jennings 2007 August 2007
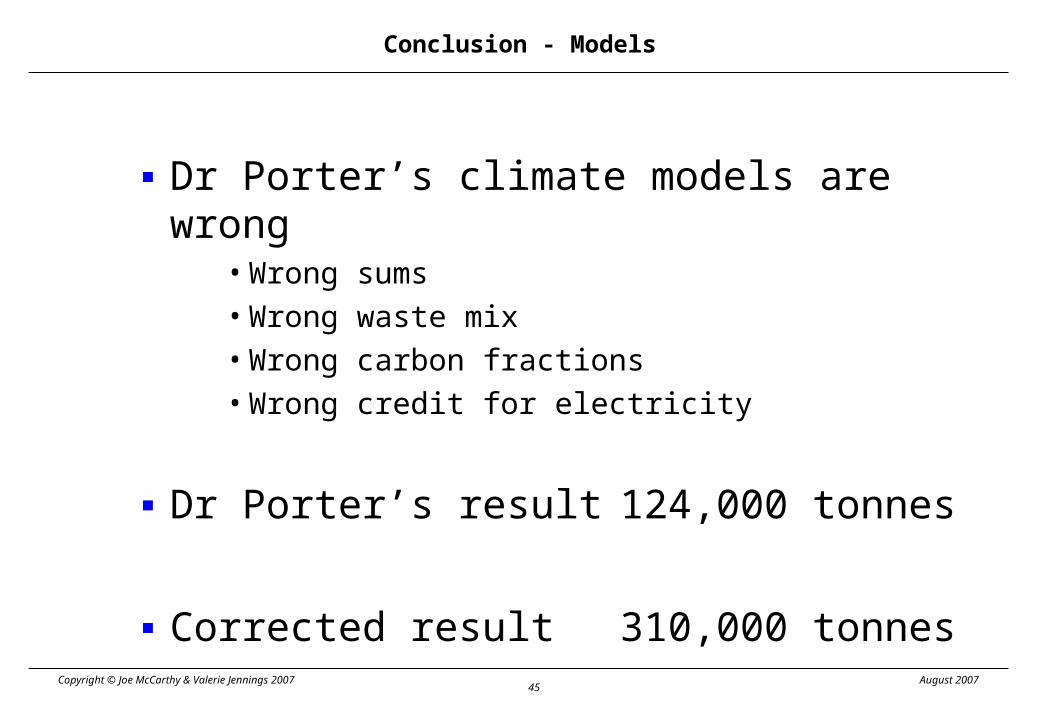
Conclusion - Models
▪ Dr Porter’s climate models are wrong• Wrong sums• Wrong waste mix• Wrong carbon fractions• Wrong credit for electricity
▪ Dr Porter’s result 124,000 tonnes
▪ Corrected result 310,000 tonnes

46
Copyright © Joe McCarthy & Valerie Jennings 2007 August 2007
Conclusion – EIS Statements
▪ EIS statements on climate are wrong
▪ Non Technical Summary is wrong

47
Copyright © Joe McCarthy & Valerie Jennings 2007 August 2007
Conclusion – Entire carbon fraction
▪ Entire carbon fraction not assessed
▪ Required by IPCC 2006 Rules
▪ Incineration 667,700 tonnes pa

48
Copyright © Joe McCarthy & Valerie Jennings 2007 August 2007
Cost of CO2 emitted
Tonnes Price per tonne Cost per annum
667,700 € 20 € 13,354,008
€ 50 € 33,385,019

49
Copyright © Joe McCarthy & Valerie Jennings 2007 August 2007
Cumulative CO2 over 25 yearsfrom Incineration 17.3m tonnesfrom Landfill 3.0m tonnes
0
100,000
200,000
300,000
400,000
500,000
600,000
700,000
20
12
20
13
20
14
20
15
20
16
20
17
20
18
20
19
20
20
20
21
20
22
20
23
20
24
20
25
20
26
20
27
20
28
20
29
20
30
20
31
20
32
20
33
20
34
20
35
20
36
20
37
To
nn
es e
q
Methane CO2 eqCarbon dioxide
Incineration

50
Copyright © Joe McCarthy & Valerie Jennings 2007 August 2007
Climate Policy Drivers
▪ Stern Report• Economic crisis
▪ NCCS in Ireland
▪ IPCC Reports• Urgent Action Required
▪ EU Heads of Government• 20% target announced for 2020• To become 30% with agreement
51
Copyright © Joe McCarthy & Valerie Jennings 2007 August 2007
Conclusion – Policy Changes
▪ Policy on climate has changed
▪ EC Heads of Government• 20% reduction by 2020• 30% if US, China and India agree
▪ Drastic change in policy
▪ Kyoto target of 63mt drops to 48mt

52
Copyright © Joe McCarthy & Valerie Jennings 2007 August 2007
Conclusion
▪ The EPA should refuse a licence
• Take climate policy changes into account
• Require DCC to produce a correct climate model• Require DCC to assess 100% carbon release• Require DCC to submit a fully revised EIS
• Allow the public to submit further objections