Copyright is owned by the Author of the thesis. Permission ... · Kevin Stafford for their guidance...
187
Copyright is owned by the Author of the thesis. Permission is given for a copy to be downloaded by an individual for the purpose of research and private study only. The thesis may not be reproduced elsewhere without the permission of the Author.
Transcript of Copyright is owned by the Author of the thesis. Permission ... · Kevin Stafford for their guidance...

Copyright is owned by the Author of the thesis. Permission is given for a copy to be downloaded by an individual for the purpose of research and private study only. The thesis may not be reproduced elsewhere without the permission of the Author.

EVALUATION OF DEHORNING DISTRESS AND ITS ALLEVIATION IN CALVES.
A thesis presented in partial fulfilment
of the requirements for the degree of
MASTER OF SCIENCE
in Physiology at
Massey University
Shauna P. Sylvester
2002

ll
ACKNOWLEDGMENTS
I wish to acknowledge my supervisors, Professor David Melior and Associate Professor
Kevin Stafford for their guidance throughout this work leading to the thesi s . I am
especially grateful to Professor Melior for encouraging me to resume my research after a
break of several years, and for his inspirational teaching and research leadership. I would
like to particularly thank Mr Neil Ward for his will ingness to provide expert help and
advice, wel l beyond the call of duty. His computing knowledge, his wide range of
technical expertise and his "can-do" attitude were invaluable to me.
I also acknowledge advice on cmtisol assays from Associate Professor Keith Lapwood
and technical advice from Jane Candy. Funding for the corti sol assays was provided by
Massey University research Fund (MURF) and the Ministry of Agriculture and Fisheries
(MAF Quality Management).
Field work cannot be carried out alone, but only as a team. That team included Nei l Ward,
David Mel ior, Kevin Stafford, Robert Bruce and Natalie Petrie. Their sense of humour,
good conversation and good fel lowship helped me through many long hours . I am
grateful to Steve Lees, Dave Grant, Gerard Poff and other farm staff at Keebles farm,
Tuapaka farm and Jennersmead farm, along with Alan Alexander, who was the director
of Animal Health Service Centre.
I wish to thank postgraduates and friends Steve Fox, Natalie Petrie, Cheryl McMeekan,
Kate Littin , Janet Sayers, John Sanders and Julie Best-Simanu et al . , for their many
di scussions on the physiological , quotidian and phi losophical aspects of this and their
work. I would also like to acknowledge other members of the "animal welfare" team,
Mark Foreman , Andrew Dinnis, Tamarra Diesch, Phi llipa Mello and Ngaio Beausoleil . A
special thank you to the many friends, flatmates and family who have supported and
encouraged me over the years including: Kath Best and Andrea Lowe, as well as
Caroline, Glenn, Marion, Elmar, Paul , Lee and Nancy.

lll
ABSTRACT
In this thesis, the pain-induced distress caused by the husbandry practice of dehoming
cattle is assessed and methods to alleviate it are evaluated. At the time this work was
conducted there were no comprehensive studies on the effects of amputation dehoming
upon the welfare of the cattle. The aims of the study were to assess the distress response
after dehoming and to explore the possibilities of alleviating that distress through the use
of different dehoming tool s, local anaesthetic and/or cautery of the scoop wound.
Changes in plasma cortisol concentrations and behaviour were used as indices of distress.
It was anticipated that this research would provide scientific data to aid in the writing of
welfare codes and advisory material concerning the dehoming of cattle.
The cortisol and behavioural responses of six-month-old male Friesian calves after
treatment were studied. In the cortisol studies, blood samples were taken by venipuncture
from the jugular vein of each calf prior to, for the first 9 hours and at 36 h after
treatment. Behavioural responses were scored by point scan behaviour sampling for the
first 10 h after and on day two between 26 and 29 h after treatment.
Amputation dehoming elici ted a marked, biphasic cortisol response that lasted six hours.
Dehoming elicited similar cortisol responses irrespective of the tool employed. ACTH bolus (i v . 0 .28!J,g/kg) elicited a maximal cortisol response. The similarity of the
magnitude of the dehoming and ACTH responses suggests that dehoming was extremely
distressing. The plateauing of the plasma cortisol values between 1 .5 and 3 hours after
dehoming suggests the appearance of a second phase of pain, presumably from
inflammation . Local anaesthesia virtually abolished the first three hours of the cortisol
response after dehoming, after which corti sol concentrations rose transiently . Overall ,
this equated to a 50% reduction in the integrated cortisol response. Cauterizing the scoop
wounds effected a marginal reduction in the cortisol response. The combination of local
anaesthesia plus cauterizing the scoop wound virtually abolished the cortisol response to
amputation dehoming. This striking result i s reminiscent of pre-emptive analgesia. The
destruction of, and the prevention of sensitization of, nociceptors in the wound is thought
to contribute to thi s effect. The four behaviours of tai l shaking, head shaking, ear flicking
and rumination, met the criteria required to use behaviour as evidence of di stress . The
interpretation of the behaviour data conesponded with that of the cortisol data.
Taken together, the cortisol and behaviour data from this study, along with the
subsequent work it generated, indicate that scoop dehoming is extremely noxious . If the
cattle are older and amputation dehoming is necessary, it is recommended that local
anaesthetic be given and if practicable combined with either ketoprofen (McMeekan et al. ,
1 998b) or wound cautery. However, it i s preferable to dehom calves when they are
younger by cautery disbudding (Petrie et al. , 1 996b ) .

iv
TABLE OF CONTENTS
Title page . . . . . . . . . . . . . . . . . . . . . . . . . . . . . . . . . . . . . . . . . . . . . . . . . . . . . . . . . . . . . . . . . . . . . . . . . . . . . . . . . . . . . . . . . . . . . i
Acknowledgements . . . . . . . . . . . . . . . . . . . . . . . . . . . . . . . . . . . . . . . . . . . . . . . . . . . . . . . . . . . . . . . . . . . . . . . . . . . . . . . . i i
Abstract . . . . . . . . . . . . . . . . . . . . . . . . . . . . . . . . . . . . . . . . . . . . . . . . . . . . . . . . . . . . . . . . . . . . . . . . . . . . . . . . . . . . . . . . . . . . . i i i
Table of contents . . . . . . . . . . . . . . . . . . . . . . . . . . . . . . . . . . . . . . . . . . . . . . . . . . . . . . . . . . . . . . . . . . . . . . . . . . . . . . . . . . . iv
List of figures and tables . . . . . . . . . . . . . . . . . . . . . . . . . . . . . . . . . . . . . . . . . . . . . . . . . . . . . . . . . . . . . . . . . . . . . . . . . . ix
CHAPTER ONE General Introduction . . . . . . . . . . . . . . . . . . . . . . . . . . . . . . . . . . . . . . . . . . . . 1
1 .0 History of this work . . . . . . . . . . . . . . . . . . . . . . . . . . . . . . . . . . . . . . . . . . . . . . . . . . . . . . . . 1
1 .1 Introduction . . . . . . . . . . . . . . . . . . . . . . . . . . . . . . . . . . . . . . . . . . . . . . . . . . . . . . . . . . . . . . . . 1
1 .2 Animal Welfare . . . . . . . . . . . . . . . . . . . . . . . . . . . . . . . . . . . . . . . . . . . . . . . . . . . . . . . . . . . . 2
1 .2 . 1 Ethics . . . . . . . . . . . . . . . . . . . . . . . . . . . . . . . . . . . . . . . . . . . . . . . . . . . . . . . . . . . . . . . . . . . . . . . . . . . . . . . . 2
1 .2 .2 Legislation . . . . . . . . . . . . . . . . . . . . . . . . . . . . . . . . . . . . . . . . . . . . . . . . . . . . . . . . . . . . . . . . . . . . . . . . . . 3
1 .2 .3 Animal welfare . . . . . . . . . . . . . . . . . . . . . . . . . . . . . . . . . . . . . . . . . . . . . . . . . . . . . . . . . . . . . . . . . . . . 4
1.3 Stress . . . . . . . . . . . . . . . . . . . . . . . . . . . . . . . . . . . . . . . . . . . . . . . . . . . . . . . . . . . . . . . . . . . . . . . 6
1 .3 . 1 Background . . . . . . . . . . . . . . . . . . . . . . . . . . . . . . . . . . . . . . . . . . . . . . . . . . . . . . . . . . . . . . . . . . . . . . . . 6
1 .3 .2 Terminology . . . . . . . . . . . . . . . . . . . . . . . . . . . . . . . . . . . . . . . . . . . . . . . . . . . . . . . . . . . . . . . . . . . . . . . 7
1 . 3 .3 Pain . . . . . . . . . . . . . . . . . . . . . . . . . . . . . . . . . . . . . . . . . . . . . . . . . . . . . . . . . . . . . . . . . . . . . . . . . . . . . . . . . . 8
1.3 .4 The Stress Response . . . . . . . . . . . . . . . . . . . . . . . . . . . . . . . . . . . . . . . . . . . . . . . . . . . . . . . . . . . . 1 0
1.4 Measurement of stress . . . . . . . . . . . . . . . . . . . . . . . . . . . . . . . . . . . . . . . . . . . . . . . . . . . . 12
1 .4. 1 Cortisol and behaviour. . . . . . . . . . . . . . . . . . . . . . . . . . . . . . . . . . . . . . . . . . . . . . . . . . . . . . . . . . 1 2
1 .4 .2 Behaviour . . . . . . . . . . . . . . . . . . . . . . . . . . . . . . . . . . . . . . . . . . . . . . . . . . . . . . . . . . . . . . . . . . . . . . . . . 1 2
1 .4 .3 Interpretative problems . . . . . . . . . . . . . . . . . . . . . . . . . . . . . . . . . . . . . . . . . . . . . . . . . . . . . . . . . 14
1 .4.4 Critique of analyses . . . . . . . . . . . . . . . . . . . . . . . . . . . . . . . . . . . . . . . . . . . . . . . . . . . . . . . . . . . . . 1 5
1.5 Alleviation of pain-induced distress . . . . . . . . . . . . . . . . . . . . . . . . . . . . . . . . . . . . . . . 16
1 .5 . 1 Local anaesthetic . . . . . . . . . . . . . . . . . . . . . . . . . . . . . . . . . . . . . . . . . . . . . . . . . . . . . . . . . . . . . . . . 16
1 . 5 .2 Cautery . . . . . . . . . . . . . . . . . . . . . . . . . . . . . . . . . . . . . . . . . . . . . . . . . . . . . . . . . . . . . . . . . . . . . . . . . . . . 16
1.6 Aims and format of the thesis . . . . . . . . . . . . . . . . . . . . . . . . . . . . . . . . . . . . . . . . . . . . . 16
CHAPTER TWO Critique of the analyses of the cortisol responses . . . . . . . . . . . . . . 19
2.0 Abstract . . . . . . . . . . . . . . . . . . . . . . . . . . . . . . . . . . . . . . . . . . . . . . . . . . . . . . . . . . . . . . . . . . 19
2.1 Introduction . . . . . . . . . . . . . . . . . . . . . . . . . . . . . . . . . . . . . . . . . . . . . . . . . . . . . . . . . . . . . . 1 9
2.2 Experimental overview . . . . . . . . . . . . . . . . . . . . . . . . . . . . . . . . . . . . . . . . . . . . . . . . . . . 21
2.2 . 1 Scientific method . . . . . . . . . . . . . . . . . . . . . . . . . . . . . . . . . . . . . . . . . . . . . . . . . . . . . . . . . . . . . . . . 2 1
Experimental design . . . . . . . . . . . . . . . . . . . . . . . . . . . . . . . . . . . . . . . . . . . . . . . . . . . . . 2 1
Dala transformati-ons . . . . . . . , _ . . . . . . . . . . . . . . . . . . . . . . . . . . . . . . . . . . . . . . . . . . . 2 1
Statistical theory . . . . . . . . . . . . . . . . . . . . . . . . . . . . . . . . . . . . . . . . . . . . . . . . . . . . . . . . . 22

V
2.2.2 Cortisol data analyses . . . . . . . . . . . . . . . . . . . . . . . . . . . . . . . . . . . . . . . . . . . . . . . . . . . . . . . . . . . 22
2.2 .3 Assumptions and limitations of baseline transformations . . . . . . . . . . . . . . . . . 23
Raw data . . . . . . . . . . . . . . . . . . . . . . . . . . . . . . . . . . . . . . . . . . . . . . . . . . . . . . . . . . . . . . . . . . 23
Adj usted data . . . . . . . . . . . . . . . . . . . . . . . . . . . . . . . . . . . . . . . . . . . . . . . . . . . . . . . . . . . . . 24
2.2.4 The problem - 28% of the responses were unusual . . . . . . . . . . . . . . . . . . . . . . . . . 25
Changing baseline . . . . . . . . . . . . . . . . . . . . . . . . . . . . . . . . . . . . . . . . . . . . . . . . . . . . . . . 27
Refractory period to cortisol secretion 0 0 0 0 0 0 0 0 0 0 0 0 0 0 0 0 0 0 0 0 0 0 0 0 0 0 0 0 0 0 0 0 28
Circadian rhythm . . . . . . . . . . . . . . . . . . . . . . . . . . . . . . . . . . . . . . . . . . . . . . . . . . . . . . . . . 28
Sensitive to pretreatment stress . . . . . . . . . . . . . . . . . . . . . . . . . . . . . . . . . . . . . . . . 28
2.2.5 Can post-treatment values be used as reference values? . . . . . . . . . . . . . . . . . . . 29
2.2.6 Aims . . . . . . . . . . . . . . . . . . . . . . . . . . . . . . . . . . . . . . . . . . . . . . . . . . . . . . . . . . . . . . . . . . . . . . . . . . . . . . . 3 1
2.3 Materials and Methods . . . . . . . . . . . . . . . . . . . . . . . . . . . . . . . . . . . . . . . . . . . . . . . . . . . 32
2.3 .1 Data transformations . . . . . . . . . . . . . . . . . . . . . . . . . . . . . . . . . . . . . . . . . . . . . . . . . . . . . . . . . . . . 32
2.3.2 Statistical analyses . . . . . . . . . . . . . . . . . . . . . . . . . . . . . . . . . . . . . . . . . . . . . . . . . . . . . . . . . . . . . . 32
2.3.3 Sample data . . . . . . . . . . . . . . . . . . . . . . . . . . . . . . . . . . . . . . . . . . . . . . . . . . . . . . . . . . . . . . . . . . . . . . 34
2.4 Results . . . . . . . . . . . . . . . . . . . . . . . . . . . . . . . . . . . . . . . . . . . . . . . . . . . . . . . . . . . . . . . . . . . 36
2.4.1 Cmtisol timecourse analyses . 0 0 . 0 0 • • 0 0 • • • • 0 0 • • • • • 0 0 . . . . . . . . . . . . . . . . . . . . . . . . . . . . 36
2.4.2 Integrated response analyses . . . . . . . . . . . . . . . . . . . . . . . . . . . . . . . . . . . . . . . . . . . . . . . . . . . 37
2.5 Discussion . . . . . . . . . . . . . . . . . . . . . . . . . . . . . . . . . . . . . . . . . . . . . . . . . . . . . . . . . . . . . . . . 40
CHAPTER THREE The acute cortisol responses of calves following four methods of dehorning . . . . . . . . . . . . . . . . . . . . . . . . . . . . . . . . . . . . . . . . . . . . . . . . . . . . 42
3.0 Abstract . . . . . . . . . . . . . . . . . . . . . . . . . . . . . . . . . . . . . . . . . . . . . . . . . . . . . . . . . . . . . . . . . . 42
3.1 Introduction . . . . . . . . . . . . . . . . . . . . . . . . . . . . . . . . . . . . . . . . . . . . . . . . . . . . . . . . . . . . . . 42
3 . 1 . 1 Dehoming and production studies . . . . . . . . . . . . . . . . . . 0 0 . . . . 0 0 . . . . . . . . . . . . 0 0 . . . . 43
3.1.2 Dehorning and welfare studies . . . . . . . . . . . . . . o o . . . . . . 0 0 . . 0 0 0 0 0 0 . . 0 0 . . . . 0 0 0 0 . . . . 45
3.1.3 Aims of study . . . . . . . . . . . . . . . . . . . . . . . . . . . . . . . . . . . . . . . . . . . . . . . . . . . . . . . . . . . . . . . . . . . . 45
3.2 Materials and Methods . . . . . . . . . . . . . . . . . . . . . . . . . . . . . . . . . . . . . . . . . . . . . . . . . . . 47
3 .2.1 Experimental design . . . . . . . . . . . . . . . . . . 0 0 . . . . . . . . . . . . 0 0 0 0 . . . . 0 0 0 0 0 0 0 0 . . 0 0 . . 0 0 0 0 . . 47
3.2.2 B lood sampling . . . . . . . . . . . . . . . . . . . . . . . . . . . . . . . . . . . . . . . . . . . . . . . . . . . . . . . . . . . . . . . . . . 48
3.2.3 Treatments . . . . . . . . . . . . . . . . . . . . . . . . . . . . . . . . . . . . . . . . . . . . . . . . . . . . . . . . . . . . . . . . . . . . . . . . 48
3 .2.4 Plasma Cmtisol Analysi s . . . . . . . . . . . . . . . . . . . . . . . . . . . . . . . . . . . . . . . . . . . . . . . . . . . . . . . 49
3 .2 .5 Statistical Analyses . . . . . . . . . . . . . . . . . . . . . . . . . . . . . . . . . . . . . . . . . . . . . . . . . . . . . . . . . . . . . . 49
3.3 Results . . . . . . . . . . . . . . . . . . . . . . . . . . . . . . . . . . . . . . . . . . . . . . . . . . . . . . . . . . . . . . . . . . . 54
3.3 . 1 Pretreatment Cortisol Concentrations . . . . . . . . . . . . . . . . . . . . . . . . . . . . . . . . . . . . . . . . 54
3.3.2 Control Calves . . . . . . . . . . . . . . . . . . . . . . . . . . . . . . . . . . . . . . . . . . . . . . . . . . . . . . . . . . . . . . . . . . . 54
3.3.3 Dehorned Caives . . . . . . . . . . . . . . . . . . . . . . . . . 0 0 . . . . . . . . . . . . . . . . . . _ . . . . . . . . . . . . . . . . . . 54
3.3.4 ACTH Calves . . . . . . . . . . . . . . . . . . . . . . . . . . . . . . . . . . . . . . . . . . . . . . . . . . . . . . . . . . . . . . . . . . . . 55

Vl
3 .3 .5 Cortisol timecourse gradients . . . . . . . . . . . . . . . . . . . . . . . . . . . . . . . . . . . . . . . . . . . . . . . . . . 55
3 .3 .6 36 hour cortisol sample . . . . . . . . . . . . . . . . . . . . . . . . . . . . . . . . . . . . . . . . . . . . . . . . . . . . . . . . . 55
3 .3 .7 Integrated cortisol responses . . . . . . . . . . . . . . . . . . . . . . . . . . . . . . . . . . . . . . . . . . . . . . . . . . . 55
3.4 Discussion . . . . . . . . . . . . . . . . . . . . . . . . . . . . . . . . . . . . . . . . . . . . . . . . . . . . . . . . . . . . . . . . 60
3 .4. 1 The response to dehoming . . . . . . . . . . . . . . . . . . . . . . . . . . . . . . . . . . . . . . . . . . . . . . . . . . . . . 60
3.4.2 ACTH (maximal frame of reference) . . . . . . . . . . . . . . . . . . . . . . . . . . . . . . . . . . . . . . . . . 6 1
3 .4 .3 Control (minimal frame of reference) . . . . . . . . . . . . . . . . . . . . . . . . . . . . . . . . . . . . . . . . 62
3 .4.4 B iphasic pattern of response to dehoming . . . . . . . . . . . . . . . . . . . . . . . . . . . . . . . . . . . 63
Physiological and anatomical substrates of pain . . . . . . . . . . . . . . . . . . . . . 63
Components of the response to dehoming . . . . . . . . . . . . . . . . . . . . . . . . . . . . 65
3 .4 .5 Choice of dehoming method . . . . . . . . . . . . . . . . . . . . . . . . . . . . . . . . . . . . . . . . . . . . . . . . . . . 67
3 .4 .6 Critique of the experimental design . . . . . . . . . . . . . . . . . . . . . . . . . . . . . . . . . . . . . . . . . . . 68
3 .4 .7 Conclusions . . . . . . . . . . . . . . . . . . . . . . . . . . . . . . . . . . . . . . . . . . . . . . . . . . . . . . . . . . . . . . . . . . . . . . 69
3 .4 .8 Epi logue . . . . . . . . . . . . . . . . . . . . . . . . . . . . . . . . . . . . . . . . . . . . . . . . . . . . . . . . . . . . . . . . . . . . . . . . . . 69
CHAPTER FOUR Cortisol responses of calves to scoop dehorning with local anaesthesia and/or cautery of the wound . . . . . . . . . . . . . . . . . . . . . . . . . . . . 70
4.0 Abstract . . . . . . . . . . . . . . . . . . . . . . . . . . . . . . . . . . . . . . . . . . . . . . . . . . . . . . . . . . . . . . . . . . 70
4.1 Introduction . . . . . . . . . . . . . . . . . . . . . . . . . . . . . . . . . . . . . . . . . . . . . . . . . . . . . . . . . . . . . . 70
4. 1 . 1 Aims of study . . . . . . . . . . . . . . . . . . . . . . . . . . . . . . . . . . . . . . . . . . . . . . . . . . . . . . . . . . . . . . . . . . . . 72
4.2 Materials and Methods . . . . . . . . . . . . . . . . . . . . . . . . . . . . . . . . . . . . . . . . . . . . . . . . . . . 73
4.2 . 1 Experimental design . . . . . . . . . . . . . . . . . . . . . . . . . . . . . . . . . . . . . . . . . . . . . . . . . . . . . . . . . . . . 73
4 .2 .2 Blood sampling . . . . . . . . . . . . . . . . . . . . . . . . . . . . . . . . . . . . . . . . . . . . . . . . . . . . . . . . . . . . . . . . . . 74
4.2 .3 Treatments . . . . . . . . . . . . . . . . . . . . . . . . . . . . . . . . . . . . . . . . . . . . . . . . . . . . . . . . . . . . . . . . . . . . . . . . 74
4.2.4 Plasma Cortisol Analysis . . . . . . . . . . . . . . . . . . . . . . . . . . . . . . . . . . . . . . . . . . . . . . . . . . . . . . . 75
4 .2 .5 Statistical Analyses . . . . . . . . . . . . . . . . . . . . . . . . . . . . . . . . . . . . . . . . . . . . . . . . . . . . . . . . . . . . . . 76
4.3 Results . . . . . . . . . . . . . . . . . . . . . . . . . . . . . . . . . . . . . . . . . . . . . . . . . . . . . . . . . . . . . . . . . . . 80
4.3 . 1 Pretreatment Cortisol Concentrations . . . . . . . . . . . . . . . . . . . . . . . . . . . . . . . . . . . . . . . . 80
4 .3 .2 Data excluded from the analyses as outl iers . . . . . . . . . . . . . . . . . . . . . . . . . . . . . . . . . 80
4 .3 .3 Cortisol responses to treatment . . . . . . . . . . . . . . . . . . . . . . . . . . . . . . . . . . . . . . . . . . . . . . . . 80
Control and LA-Control. . . . . . . . . . . . . . . . . . . . . . . . . . . . . . . . . . . . . . . . . . . . . . . . . 80
Scoop . . . . . . . . . . . . . . . . . . . . . . . . . . . . . . . . . . . . . . . . . . . . . . . . . . . . . . . . . . . . . . . . . . . . . . 8 1
LA-Scoop . . . . . . . . . . . . . . . . . . . . . . . . . . . . . . . . . . . . . . . . . . . . . . . . . . . . . . . . . . . . . . . . . 8 1
Scoop compared to LA-Scoop and LA-Control. . . . . . . . . . . . . . . . . . . . . 8 1
Scoop+Cautery . . . . . . . . . . . . . . . . . . . . . . . . . . . . . . . . . . . . . . . . . . . . . . . . . . . . . . . . . . . 8 1
Scoop+Cautery compared to Scoop . . . . . . . . . . . . . . . . . . . . . . . . . . . . . . . . . . . 82
LA-Scoop+Cautery . . . . . . . . . . . . . . . . . . . . . . . . . . . . . . . . . . . . . . , , , . . ... . . . . . . . . 82

Vll
LA- Sc oop+Cautery compared to LA-S coop and
LA-Control . . . . . . . . . . . . . . . . . . . . . . . . . . . . . . . . . . . . . . . . . . . . . . . . . . . . . . . . 82
Comparison of the 36 h cortisol samples . . . . . . . . . . . . . . . . . . . . . . . . . . . . . 82
4.3 .4 Test of duration of analgesia (skin prick test) . . . . . . . . . . . . . . . . . . . . . . . . . . . . . . . 83
4.4 Discussion . . . . . . . . . . . . . . . . . . . . . . . . . . . . . . . . . . . . . . . . . . . . . . . . . . . . . . . . . . . . . . . . 90
4.4. 1 Local anaesthesia . . . . . . . . . . . . . . . . . . . . . . . . . . . . . . . . . . . . . . . . . . . . . . . . . . . . . . . . . . . . . . . . 90
4.4.2 Cautery . . . . . . . . . . . . . . . . . . . . . . . . . . . . . . . . . . . . . . . . . . . . . . . . . . . . . . . . . . . . . . . . . . . . . . . . . . . . 92
4.4.3 Combined regimes (LA-Scoop+Cautery) . . . . . . . . . . . . . . . . . . . . . . . . . . . . . . . . . . . . 93
4.4.4 Critique of the experimental design . . . . . . . . . . . . . . . . . . . . . . . . . . . . . . . . . . . . . . . . . . . 95
4.4.5 Conclusions . . . . . . . . . . . . . . . . . . . . . . . . . . . . . . . . . . . . . . . . . . . . . . . . . . . . . . . . . . . . . . . . . . . . . . 95
4.4.6 Epi logue . . . . . . . . . . . . . . . . . . . . . . . . . . . . . . . . . . . . . . . . . . . . . . . . . . . . . . . . . . . . . . . . . . . . . . . . . . 95
CHAPTER FIVE Behavioural responses of calves to scoop-amputation dehorning with and without local anaesthesia . . . . . . . . . . . . . . . . . . . . . . . . . . . . 97
5.0 Abstract . . . . . . . . . . . . . . . . . . . . . . . . . . . . . . . . . . . . . . . . . . . . . . . . . . . . . . . . . . . . . . . . . . 97
5.1 Introduction . . . . . . . . . . . . . . . . . . . . . . . . . . . . . . . . . . . . . ... . .. . . . . . . . . . . . . . . . . . . . 97
5 . 1 . 1 Interpretative problems . . . . . . . . . . . . . . . . . . . . . . . . . . . . . . . . . . . . . . . . . . . . . . . . . . . . . . . . . 99
5 . 1 .2 Aims of study . . . . . . . . . . . . . . . . . . . . . . . . . . . . . . . . . . . . . . . . . . . . . . . . . . . . . . . . . . . . . . . . . . . 100
5.2 Materials and Methods . . . . . . . . . . . . . . . . . . . . . . . . . . . . . . . . . . . . . . . . . . . . . . . . . . 101
5 .2. 1 Experimental design . . . . . . . . . . . . . . . . . . . . . . . . . . . . . . . . . . . . . . . . . . . . . . . . . . . . . . . . . . . 1 0 1
5 .2.2 Treatments . . . . . . . . . . . . . . . . . . . . . . . . . . . . . . . . . . . . . . . . . . . . . . . . . . . . . . . . . . . . . . . . . . . . . . . 1 0 1
5 .2 .3 Behaviour measurements . . . . . . . . . . . . . . . . . . . . . . . . . . . . . . . . . . . . . . . . . . . . . . . . . . . . . . 1 02
5 .2 .4 Data Analyses . . . . . . . . . . . . . . . . . . . . . . . . . . . . . . . . . . . . . . . . . . . . . . . . . . . . . . . . . . . . . . . . . . . 103
5.3 Results . . . . . . . . . . . . . . . . . . . . . . . . . . . . . . . . . . . . . . . . . . . . . . . . . . . . . . . . . . . . . . . . . . 107
5 .3 . 1 Behavioural comparisons (Day one) . . . . . . . . . . . . . . . . . . . . . . . . . . . . . . . . . . . . . . . . . 107
5 .3 .2 Summary of the behaviour of Control , Scoop and LA-Scoop
calves (day one) . . . . . . . . . . . . . . . . . . . . . . . . . . . . . . . . . . . . . . . . . . . . . . . . . . . . . . . . . . . . . . . . 1 1 3
5 .3 .3 Behavioural comparisons (Day two) . . . . . . . . . . . . . . . . . . . . . . . . . . . . . . . . . . . . . . . . . 1 14
5.4 Discussion . . . . . . . . . . . . . . . . . . . . . . . . . . . . . . . . . . . . . . . . . . . . . . . . . . . . . . . . . . . . . . . 125
5 .4. 1 Dehoming . . . . . . . . . . . . . . . . . . . . . . . . . . . . . . . . . . . . . . . . . . . . . . . . . . . . . . . . . . . . . . . . . . . . . . . 126
5 .4.2 Local anaesthetic . . . . . . . . . . . . . . . . . . . . . . . . . . . . . . . . . . . . . . . . . . . . . . . . . . . . . . . . . . . . . . . 1 27
5 .4.3 Differences between the behaviour and cortisol data . . . . . . . . . . . . . . . . . . . . . . 1 29
5 .4 .4 Interpretation issues concerning specific behaviours . . . . . . . . . . . . . . . . . . . . . . 1 30
5 .4 .5 Day two after treatment. . . . . . . . . . . . . . . . . . . . . . . . . . . . . . . . . . . . . . . . . . . . . . . . . . . . . . . . 1 32
5 .4 .6 Critique and recommendations to experimental design . . . . . . . . . . . . . . . . . . . 133
5 .4.7 Conclusions . . . . . . . . . . . . . . . . . . . . . . . . . . . . . . . . . . . . . . . . . . . . . . . . . . . . . . . . . . . . . . . . . . . . . 1 35
5 .4 .8 Epilogue . . . . . . . . . . . . . . . . . . . . . . . . . . . . . . . . . . . . . . . . . . . . . . . . . . . . . . . . . . . . _ . . . . . . . . . . . . 136

viii
CHAPTER SIX General Discussion . . . . . . . . . . . . . . . . . . . . . . . . . . . . . . . . . . . . . . . . . . . . 137
6.1 Conclusions . . . . . . . . . . . . . . . . . . . . . . . . . . . . . . . . . . . . . . . . . . . . . . . . . . . . . . . . . . . . . 137
6. 1 . 1 Dehorning . . . . . . . . . . . . . . . . . . . . . . . . . . . . . . . . . . . . . . . . . . . . . . . . . . . . . . . . . . . . . . . . . . . . . . . 138
6 . 1 .2 Local anaesthetic . . . . . . . . . . . . . . . . . . . . . . . . . . . . . . . . . . . . . . . . . . . . . . . . . . . . . . . . . . . . . . . 1 38
6 . 1 . 3 Local anaesthesia and cautery of the wounds . . . . . . . . . . . . . . . . . . . . . . . . . . . . . . 140
6 . 1 .4 Recommendations . . . . . . . . . . . . . . . . . . . . . . . . . . . . . . . . . . . . . . . . . . . . . . . . . . . . . . . . . . . . . . 14 1
6.2 Subsequent work . . . . . . . . . . . . . . . . . . . . . . . . . . . . . . . . . . . . . . . . . . . . . . . . . . . . . . . . 141
6.2 . 1 Amputation dehoming . . . . . . . . . . . . . . . . . . . . . . . . . . . . . . . . . . . . . . . . . . . . . . . . . . . . . . . . . 1 4 1
6 .2 .2 Disbudding . . . . . . . . . . . . . . . . . . . . . . . . . . . . . . . . . . . . . . . . . . . . . . . . . . . . . . . . . . . . . . . . . . . . . . 1 43
6.3 Pain-induced distress - insights . . . . . . . . . . . . . . . . . . . . . . . . . . . . . . . . . . . . . . . . . . 143
6.4 Future directions and Critique of the experimental design . . . . . . . . . . . . . . . 145
BIBLIOGRAPHY . . . . . . . . . . . . . . . . . . . . . . . . . . . . . . . . . . . . . . . . . . . . . . . . . . . . . . . . . . . . . . 147
APPENDICES . . . . . . . . . . . . . . . . . . . . . . . . . . . . . . . . . . . . . . . . . . . . . . . . . . . . . . . . . . . . . . . . . 165
A Presentations and publications of this work . . . . . . . . . . . . . . . . . . . . . . . . . . . . . 165
Sylvester et al., 1 993 . . . . . . . . . . . . . . . . . . . . . . . . . . . . . . . . . . . . . . . . . . . . . . . . . . . . . . . . . . . . . . . . . . . 1 66
Sylvester et al., 1998b . . . . . . . . . . . . . . . . . . . . . . . . . . . . . . . . . . . . . . . . . . . . . . . . . . . . . . . . . . . . . . . . . . 1 67
Sylvester et al., 1998a . . . . . . . . . . . . . . . . . . . . . . . . . . . . . . . . . . . . . . . . . . . . . . . . . . . . . . . . . . . . . . . . . . 1 7 1
B Data excluded from the analyses . . . . . . . . . . . . . . . . . . . . . . . . . . . . . . . . . . . . . . . . . 176
C The cortisol radioimmunoassay . . . . . . . . . . . . . . . . . . . . . . . . . . . . . . . . . . . . . . . . . . 179

lX
LIST OF FIGURES AND TABLES
Table 1 . 1
Fig 1 . 1
Major attributes of pain . . . . . . . . . . . . . . . . . . . . . . . . . . . . . . . . . . . . . . . . . . . . . . . . . . . . . . . . . . . . 9
Schematic diagram of the major components of the hypothalamic-
pituitary-adrenal axis . . . . . . . . . . . . . . . . . . . . . . . . . . . . . . . . . . . . . . . . . . . . . . . . . . . . . . . . . . . . . 1 1
Fig 2 . 1 Schematic diagram showing the calculat ion of the integrated
cortisol responses using raw and adj ustedpre. tmt data . . . . . . . . . . . . . . . . . . . . . . . 24
Fig 2.2 Schematic diagram of the cortisol timecourse of the subpopulation . . . . . . . 26
Table 2 . 1 Sample data, data series 5, 3, 4 and 2 . . . . . . . . . . . . . . . . . . . . . . . . . . . . . . . . . . . . . . . . . . 34
Table 2 .2 Statistics of the pretreatment and post-treatment cortisol reference
values . . . . . . . . . . . . . . . . . . . . . . . . . . . . . . . . . . . . . . . . . . . . . . . . . . . . . . . . . . . . . . . . . . . . . . . . . . . . . . . 36
Table 2 .3 Integrated responses (ng.hr/ml) of data series "5 " , "3" , "4" and "2"
us ing raw, adjuste�re . tmt and adj uste�ost . tmt data (mean ±
SEM) . . . . . . . . . . . . . . . . . . . . . . . . . . . . . . . . . . . . . . . . . . . . . . . . . . . . . . . . . . . . . . . . . . . . . . . . . . . . . . . . 37
Fig 2 .3 Corti sol t imecourse of data series 5 and 3 , us ing raw ,
adjustedpre . tmt and adjuste�ost .tmt data . . . . . . . . . . . . . . . . . . . . . . . . . . . . . . . . . . . . . 38
Fig 2 .4 Cortisol t imecourse of data series 4 and 2, using raw,
adjustedpre.tmt and adjuste�ost. tmt data . . . . . . . . . . . . . . . . . . . . . . . . . . . . . . . . . . . . . 39
Fig 3 . 1 Dehorning equipment. . . . . . . . . . . . . . . . . . . . . . . . . . . . . . . . . . . . . . . . . . . . . . . . . . . . . . . . . . . . . 5 1
Fig 3 .2 Horn removal using the embryotomy wire . . . . . . . . . . . . . . . . . . . . . . . . . . . . . . . . . . . . . 5 1
Fig 3 . 3 Horn removal using the scoop dehorner . . . . . . . . . . . . . . . . . . . . . . . . . . . . . . . . . . . . . . . . 52
Fig 3 .4 The blood sampling procedure . . . . . . . . . . . . . . . . . . . . . . . . . . . . . . . . . . . . . . . . . . . . . . . . . . 53
Fig 3 .5 Relationship between the pretreatment corti sol concentrations and
order in which the calves were sampled . . . . . . . . . . . . . . . . . . . . . . . . . . . . . . . . . . . . . . . 56
Fig 3 .6 Changes in plasma cortisol concentrations of calves in response to
Scoop dehorning and Control handl ing and bloodsampling . . . . . . . . . . . . . . . . . 57
Fig 3 .7 Changes in plasma cortisol concentrations of calves in response to
Scoop, Saw, Guillotine shears and Embryotomy wire dehorning . . . . . . . . . . 57
Fig 3 .8 Changes in plasma cortisol concentrations of calves in response to
ACTH bolus and Control handling and bloodsampl ing . . . . . . . . . . . . . . . . . . . . . . 58
Fig 3 .9 Changes in plasma cortisol concentrations of calves in response to
Scoop dehorning, ACTH bolus and Control treatment . . . . . . . . . . . . . . . . . . . . . . 5 8
Table 3 . 1 Characteri stics of the corti sol responses for each group . . . . . . . . . . . . . . . . . . . . . 59
Fig 3 . 1 0 Schematic diagram of the cortisol timecourse after dehorning . . . . . . . . . . . . . 66
Fig 4 . 1 Injection of local anaesthetic . . . . . . . . . . . . . . . . . . . . . . . . . . . . . . . . . . . . . . . . . . . . . . . . . . . . . 78
Fig 4 .2 The cautery iron . . . . . . . . . . . . . . . . . . . . . . . . . . . . . . . . . . . . . . . . . . . . . . . . . . . . . . . . . . . . . . . . . . . 79
Fig 4.3 Relationship between the pretreatment cortisol concentrations and
order in which the calves were sampled . . . . . . . . . . . . . . . . . . . . . . . . . . . . . . . . . . . . . . . 84

Fig 4 .4
Fig 4 .5
Fig 4 .6
Fig 4.7
Fig 4.8
Fig 4.9
Fig 4 . 1 0
Fig 4 . 1 1
Table 4 . 1
Table 5 . 1
Fig 5 . 1
Fig 5 .2
Fig 5 .3
Fig 5 .4
Fig 5 .5
Fig 5 .6
Fig 5 .7
Fig 5 . 8
Table 5 .2
Fig B.1
Fig B .2
X
Changes in plasma corti sol concentrations of calves in response to
Control and LA-Control treatment. . . . . . . . . . . . . . . . . . . . . . . . . . . . . . . . . . . . . . . . . . . . . . 85
Changes in plasma cortisol concentrations of calves in response to
Scoop dehorning and Control handli ng and bloodsampling . . . . . . . . . . . . . . . . . 85
Changes in plasma cortisol concentrations of calves in response to
LA-Scoop and LA-Control treatment . . . . . . . . . . . . . . . . . . . . . . . . . . . . . . . . . . . . . . . . . . 86
Changes in plasma cortisol concentrations of calves in response to
LA-Scoop and Scoop treatment . . . . . . . . . . . . . . . . . . . . . . . . . . . . . . . . . . . . . . . . . . . . . . . . . 86
Changes in plasma cortisol concentrations of calves in response to
Scoop+cautery and Control treatment . . . . . . . . . . . . . . . . . . . . . . . . . . . . . . . . . . . . . . . . . . 87
Changes in plasma cortisol concentrations of calves i n response to
Scoop+cautery and Scoop treatment . . . . . . . . . . . . . . . . . . . . . . . . . . . . . . . . . . . . . . . . . . . 87
Changes in plasma cortisol concentrations of calves in response to
LA-Scoop+cautery and LA-Control treatment . . . . . . . . . . . . . . . . . . . . . . . . . . . . . . . . 88
Changes in plasma cortisol concentrations of calves in response to
LA-Scoop+cautery and LA-Scoop treatment. . . . . . . . . . . . . . . . . . . . . . . . . . . . . . . . . . 88
Characteri stics of the corti sol responses for each treatment group . . . . . . . . . 89
Percentage incidence of al l behaviours (day 1 ) . . . . . . . . . . . . . . . . . . . . . . . . . . . . . . 1 16
Number of calves ruminating (day 1 ) . . . . . . . . . . . . . . . . . . . . . . . . . . . . . . . . . . . . . . . . . 1 1 8
Number of calves tail shaking (day 1 ) . . . . . . . . . . . . . . . . . . . . . . . . . . . . . . . . . . . . . . . . . 1 19
Number of calves head shaking (day 1 ) . . . . . . . . . . . . . . . . . . . . . . . . . . . . . . . . . . . . . . . 1 20
Number of calves ear flicking (day 1 ) . . . . . . . . . . . . . . . . . . . . . . . . . . . . . . . . . . . . . . . . . 1 2 1
Number of calves neck extending (day 1 ) . . . . . . . . . . . . . . . . . . . . . . . . . . . . . . . . . . . . 1 22
Number of calves leg scratching to face (day 1 ) . . . . . . . . . . . . . . . . . . . . . . . . . . . . . 1 22
The timecourse of the restlessness index of calves after Scoop,
LA-Scoop and Control treatment (day 1 ) . . . . . . . . . . . . . . . . . . . . . . . . . . . . . . . . . . . . . 1 23
Changes i n the cort isol concentrations of calves after Scoop,
LA-Scoop and Control treatment (day 1 ) . . . . . . . . . . . . . . . . . . . . . . . . . . . . . . . . . . . . . 1 23
The percentage of calves head shaking, ear fl icking, tai l fl icking
or ruminating on day two after treatment . . . . . . . . . . . . . . . . . . . . . . . . . . . . . . . . . . . . . 1 24
The cortisol t imecourse of calves with aberrant responses . . . . . . . . . . . . . . . . . 1 78
The cortisol timecourse of calves where the local anaesthetic did
not work . . . . . . . . . . . . . . . . . . . . . . . . . . . . . . . . . . . . . . . . . . . . . . . . . . . . . . . . . . . . . . . . . . . . . . . . . . . 178
Fig B .3 The cort i sol t imecourse of calves experiencing a pre-exist ing
stress . . . . . . . . . . . . . . . . . . . . . . . . . . . . . . . . . . . . . . . . . . . . . . . . . . . . . . . . . . . . . . . . . . . . . . . . . . . . . . . 178
Table C . 1 The setting up of the radioimmunoassay and the appropriate
controls . . . . . . . . . . . . . . . . . . . . . . . . . . . . . . . . . . . . . . . . . . . . . . . . . . . . . . . . . . . . . . . . . . . . . . . . . . . . 1 8 1

1 1.0
Chapter 1 : General Introduction
GENERAL INTRODUCTION
HISTORY OF THIS WORK
1
The research described here began in 1 99 1 , al l experiments were completed by 1 992
and most of the thesis had been written by 1 993. The candidate then became i ll and
recovery was protracted. The candidate returned in 200 1 to update the written material
and submit the thesis for examination. At the t ime this work was conducted there were
no comprehensive studies on the effects of amputation dehorning upon the welfare of
the cattle . Subsequently a significant amount was done (Petrie et al. , 1996b; McMeekan
et al. , 1 997, 1 998a,b, 1 999; S utherland, 1 999; S tafford et al. , 2000). The work
embodied in Chapters three and four made a significant contribution to knowledge in
this area and constituted the basis of two publicat ions (Sylvester et al. , 1 998a,b).
Chapters three and four are presented here in a form reflecting the state of knowledge in
1 993. By contrast chapter five, which describes work yet to be publ i shed, is written
from a contemporary standpoint . Updated information , taking account of developments
in the field since 1993 has been provided in the General Discussion .
1.1 INTRODUCTION
The e l imination of the problems associated with horned cattle , and the alleviation of
dehorning distress may confer the most benefit to cattle welfare (Gee, 1986). Dehorning
of cattle i s a routine husbandry practice performed to reduce inj ury to stock handlers
and s tock, to reduce economic losses through hide and carcass damage and to improve
husbandry . However, dehorning per se i s a welfare i ssue because i t i nvolves t issue
damage and causes significant di stress. At the t ime this work was undertaken some
research had been conducted into the effects of cautery di sbudding on calf welfare
(Allyn, 199 1 ; Laden et al. , 1 985) , but there were no comprehensive studies into the
effects of amputation dehorning on the welfare of cattle. In this thesi s , the pain-induced
di stress caused by amputat ion dehorning is examined. The aims are firstl y to
characterize the distress response using changes in plasma cort isol concentrations and
changes in behaviour, and second to explore the possibilities of al leviating that distress
through the appl ication of differen t dehorning tool s , loc al anaesthetic and/or
cauterization of the dehorning wound. It i s intended that thi s research wi l l provide
scientific data to aid in the writing of welfare codes and advi sory material concerning
the dehorning of cattle.

Chapter 1 : General Introduction 2
The assessment of the emotional state of animals incl uding pain and stress i s
problematic. In addition , there i s considerable debate concerning the concept of stress.
The debate focuses on terminology, techniques of measurement, interpretation and
calibration of the response, the relative merits of psychological versus physiological
indices (Barnett and Hemsworth, 1 990), whether animals are sentient beings, whether
we can measure subjective states and the relationship between stress and welfare . The
debate has been driven by advances in our knowledge of biology and changing societal
values which have influenced legislation concerning the care of animals .
In this thesi s , changes in plasma cortisol concentrations and behaviour have been used
to assess the pain-induced distress of dehorning. The merits and l imitations of using
these indices are examined in l ight of apparently paradoxical responses and the large
inter-animal variation of response.
1.2 ANIMAL WELFARE
1 .2 .1 Ethics
The debate concerning the care of animals has centred on whether they are worthy of
our moral concern, by examining similarities or differences according to the presence or
absence of a sou l , reason , l anguage or sentience . The maj or contributing western
philosophies as described by Rollin ( 1 98 1 ) include the Judeo-Chri stian ethic that "Man
has dominion over the rest of nature" (Genesis 1 : 28) ei ther by God, or put "non
theological l y when it i s asserted that man stands at the apex of the evolutionary
pyramid" (Rol l in , 198 1 ) . Thi s has been used as an argument to both include animals in
and exclude animals from our moral concern. The absence of a soul in animals , equated
with the inabi lity to reason, has been used as a justification for excluding animals from
our moral concern (Plato [427 -347 BC] , Ari stot le [3 84-322 BC] , Catholic doctrine) .
Saint Thomas Aquinas [ 1 225- 1 274] and Kant [ 1724- 1 804] believed that animals were
not worthy of our moral concern but, that humans had a duty towards them as their
stewards, because to be cruel to them would be intrinsically reprehensible for humans.
Descartes [ 1 596 - 1650] assumed language to be the only evidence of reason , cognition
and sentience. This Cartesian view has provided j ustification for ignoring the suffering
of animals under the auspices of humans.
Jeremy Bentham [ 1 748-1 832] disagreed with this l ogic and proposed that moral concern
be equated with the abil i ty to feel (sentience) . He argued that "The question is not, Can
they reason? nor, Can they talk? but, Can they suffer?" (in Craig and Swanson , 1 994).
Peter S inger in his book Animal Liberation ( 1 975) , popularized Bentham's argument
and legitimized the concept o[ animal rights. Tom Regan (1983) went further, proposing

Chapter 1: General Introduction 3
that animals have inherent value, interests and needs and this became the main thesis for
animal rights groups.
In Western society the 1 960s and 1 970s was a period of increased esoterica and
humanitarianism presumably as a result of basic needs being met and increased leisure
t i me , le i sure being "the mother of phi l osophy " (Rol l in , 1 98 1 ) . The r ights of
disenfranchised humans (blacks, women, foetuses etc) were peti t ioned. Concern about
the welfare of domestic animals increased dramatically with the publication of the book
Animal Machines (HaiTison, 1 964). There fol lowed investigat ions of the needs of
i ntensively farmed ani mals (e .g . the Brambell Report, 1 965) and subsequently
amendments to animal care legislation in Bri tain.
The changing tide of social values concerning the use of animals, has been paralleled by
advances in our knowledge of human and animal biology, i n particular observed
simi larities of anatomy, physiology, and presumed sent ience and consciousness. The
appreciation of such simjJarities has been expressed by the recent creation of the field of
animal welfare science . Unfortunately there has been a di ssociation of morality versus
the evaluative concepts of animal welfare (Van Rooijen , 199 1 , 1 992). Whi ls t this may
be a valuable divis ion for the purposes of the scientific assessment of animal welfare
(Broom, 1 986) and the continued uti l itarian treatment of animals , the raison d'etre of
animal welfare, and the final decis ion as to what level of compromise consti tutes poor
welfare, are ultimately ethical concerns.
1 .2.2 Legislation
Ethics and law are logical ly inseparable and causal l y influenced (Rol l in , 1 98 1 ; Battye,
1 995). The emergence of the self-regulation of scientific experiments by "ethical
committees" , whereby the uti l i tarian premise of the "three R's" reduction, refinement
and replacement (Russe l l and Burch, 1959 ) is employed, i l lustrates the cuiTent ethical
obl igation to mjn imise the costs to animals. Likewise consumers have demonstrated
their changing ethical posit ion by a shift in demand for products. Demands which were
previously price and then qual i ty are now i ncreasingly conscience driven (O'Hara,
1 992).
The British Cruelty to Animals Act ( 1 876) served as the basi s for New Zealand's
Animals Protection Act ( 1 960). With regard to animal welfare New Zealand law went
further and was recognized international ly as leading the world (Bayvel , 1 992). The
Animals Protection Act ( 1 960) was primari ly concerned with the possible abuse of
animals. Subsequent amendments focused on neglect and deprivation (O'Hara, 1 992). In
accordance wilh ihe increasing concern for animal welfare the Ani mals Protect ion Act
( 1 960) was repealed by the Animal Welfare Act ( 1999) where the primary emphasis

Chapter 1 : General Introduction 4
was directed away from cruelty and towards an explicit emphasi s of a duty of care
towards animals. Transitional Provisions (sections 20 1 , 202) have continued the effect
of the Animals Protection Act (1960) as it applies to dehoming for a further three years
unt i l January 2003. Thereafter Codes of Animal Welfare (section 65 part 5) for
husbandry practices wi l l take effect. These statutory instruments wi l l allow revision as
our knowledge of biology and technology i mproves (Animal Welfare Act 1 999).
Currently i t is an offence to dehom cattle over the age of 20 months unless the operation
is conducted under anaesthesia of sufficient power to prevent the animal from feeling
pain (section 3y, Animals Protection Act 1960).
1 .2.3 Animal welfare
There are various definitions of the terms "wel l-being" or "welfare " . The Concise
Oxford Dictionary (1 986) defines wel l-being as the " state of being happy, healthy or
prosperous " , and welfare is defined similarly but includes the maintenance of thi s
conditi on (wel l -being) by the community. The American Veterinary Medical
Association (Anon , 1 99 1 ) describes animal welfare as the "human responsibil ity that
encompasses all aspects of animal wel l -being, including proper housi ng, management,
nutrit ion, di sease prevention and treatment, responsible care, humane handling, and,
when necessary, humane euthanasia" . Other defini tions of animal welfare include an
animal's "state in coping with the environment" (Broom, 1986), "mental and physical
wel l-being" (Stamp-Dawkins , 1 980) ; and an absence of 'suffering ' a term which
embraces i ts constituents of anxiety, fear, pain and di stress (Melior and Reid, 1 994 ) .
Most defini tions or assessments of animal welfare involve the satisfaction of "needs"
where a lack of needs met is positively correlated wi th poor welfare (for example see
Humik, 1988 ; Curtis, 1 985) .
The concept of physiological and behavioural needs for farm livestock originated with
the Brambell Report ( 1965) , a United Kingdom technical inquiry into the welfare of
animals. The Brambell Report was adopted into the Council of Europe's convention for
the Protection of Animals (1976). In 1979, the Farm Animal Welfare Council (UK), a
quasi autonomous n on-govern mental organ izat ion , was formed to make
recommendations to the Minister concerning the welfare of intensively housed farm
animals. It used the concept of needs, derived from the Brambell Report, to produce a
l i st of "fi ve freedoms" that animals were enti tled to. Webster (1 986) promulgated these
principles . The revi sed wording (Anon, 1992) of the Five Freedoms reads:
"Farm ani mals are enti tled to:
1 ) Freedom from hunger and ihirst- by ready access to fresh water and a diet to
maintain ful l health and vigour;

Chapter 1: General Introduction
2) Freedom from discomfort - by providing an appropriate environment, inc luding
shelter and a comfortable resting area;
3 ) Freedom from pain, injury or disease - by prevention or rapid diagnosis and
treatment;
4) Freedom to express normal behaviour - by providing sufficient space, proper
faci l ities and company of the animal's own kind; and
5) Freedom from fear and distress - by ensuring conditions and treatment which
avoid mental suffering".
5
Good animal welfare has been equated with the Five Freedoms being met (Mel ior,
1 992; Matthews, 1992). The use of the term "freedom" is interesting in that it has moral
overtones concerning the obl igations of humanity towards their wards in this case
animals, and would elicit a strong reaction being presumably derived from the famous
"Four Human Freedoms" speech of F.D. Roosevelt (1 94 1 ) . It is general ly accepted that
the identification of physiological needs (or freedoms) is relatively easy, and can be
characterized by physiology (Mel ior, 1992 ) . But, the identification and assessment of
behavioural needs i s more difficult . Sometimes the needs are arranged hierarchical ly to
indicate priority, a concept simi lar to Maslov's (1940) hierarchy of human needs (Curtis,
1985) . There is a comprehensive l iterature detai ling the various needs of animals (see
Curtis, 1985 ; Hurnik, 1988) all of which may be encompassed by the Five Freedoms.
The Five Freedoms is a satisfactory operational definition of good animal welfare.
Good animal welfare has been defined as the absence of suffering, where suffering is an
unpleasant or undesired state resulting from noxious stimuli (Stamp-Dawkins, 1980;
Mel ior and Reid, 1994 ) . However, good animal welfare i s more than the absence of
suffering. It embraces positive attributes and is better described as satisfied when the
Five freedoms are met (Mel lor, 1 992; Matthews, 1 992) . Melior and Reid (1 994)
transformed the Five Freedoms i nto "domains of potential welfare compromise" as a
means of rating scientific experiments. These domains are nutritional , environmental ,
heal th , behavioural and mental (state), and correl ate to freedoms one to five
respectively . This simple model highlights the fact that compromise in the first four
domains w i l l be manifest in welfare terms i n the fifth domain . The fifth domain
represents the components of suffering (distress, pain , fear and anxiety) and relates to
the intensity of the state where i t retains its original character (Melior and Reid, 1 994).
This model can be appl ied to all si tuations where animals are under the auspices of
humans, and is implicit within the Animal Welfare Act 1 999.

1.3 STRESS
Chapter 1 : General Introduction 6
There is considerable debate concerning the concept of stress (e.g. Rushen, 1 986, 1 99 1 ) .
The debate focuses on terminology , semant ics , techniques of measurement ,
interpretation and calibration of the response, the relative merits of psychological versus
physiological factors (Bamett and Hemsworth , 1 990) , whether animals are sentient
beings, whether we can measure subjective states and the relationship between stress
and welfare .
1 .3.1 Background
The physiological concept of stress originated with the recognition , by Claude Bemard
[ 1 8 1 3 - 1 878], of the constancy of the milieu interieur despite a wide range of
environmental conditions and metabolic needs (Reite, 1 985) . Cannon [ 1 87 1 - 1945] later
described this as "homeostasi s " . Cannon ( 1 935) examined the " special physiological
agencies" employed to maintain homeostasis in the face of environmental challenge,
and described the autonomic nervous system's responses to a variety of stimul i . He
termed the autonomic nervous system's response the "fight or flight syndrome" and the
stimuli that caused that response he termed "stress" .
In the 1 930s and 1940s Hans Seyle ( 1 936, 1946) described a non-specific response of
laboratory animals to a variety of diverse noxious agents (e.g. painful stimuli , toxins,
extreme temperatures). He termed the response the "General adaptation syndrome" . The
response primari l y involved act ivation of the hypothalamic-pi tu i tary-adrenal axi s
(HP A-axis) , and was similar regardless of the agent that caused i t . The syndrome had
three phases, an i ni tial alarm or "emergency phase" , a "resistance phase" characterized
by high levels of circulat ing corticosteroids, and, he theorized, a final "exhaustion
phase" characterized by pathology, morbidity and possible death . This non-specific
response of the adrenal cortex to noxious stimuli became the operational defin i tion of
stress in physiological research . The concept of the non-speci fic i ty of the stress
response was markedly divergent from the then prevalent view that disease resulted in
specific etiology.
Subsequently Mason ( 1 968) attempted to e lucidate the common factors behind the
diverse agents that activated the neuroendocrine system. He proposed that psychological
factors were the key, wherein the adrenal response resulted from emotional di stress
caused by the experimental paradigm rather than a non-specific stress reaction. He
demonstrated that if care were taken to e l iminate the di stress associated wi th the
experimental procedures, then certain stimuli which had previously elicited an adrenal
response (e .g . cold, heat, hunger) , would not elicit an adrenal response (Mason,
1 975a,b). Hence, the non-specificity lay in the afferent not efferent part of the stress
Chapter 1: General Introduction 7
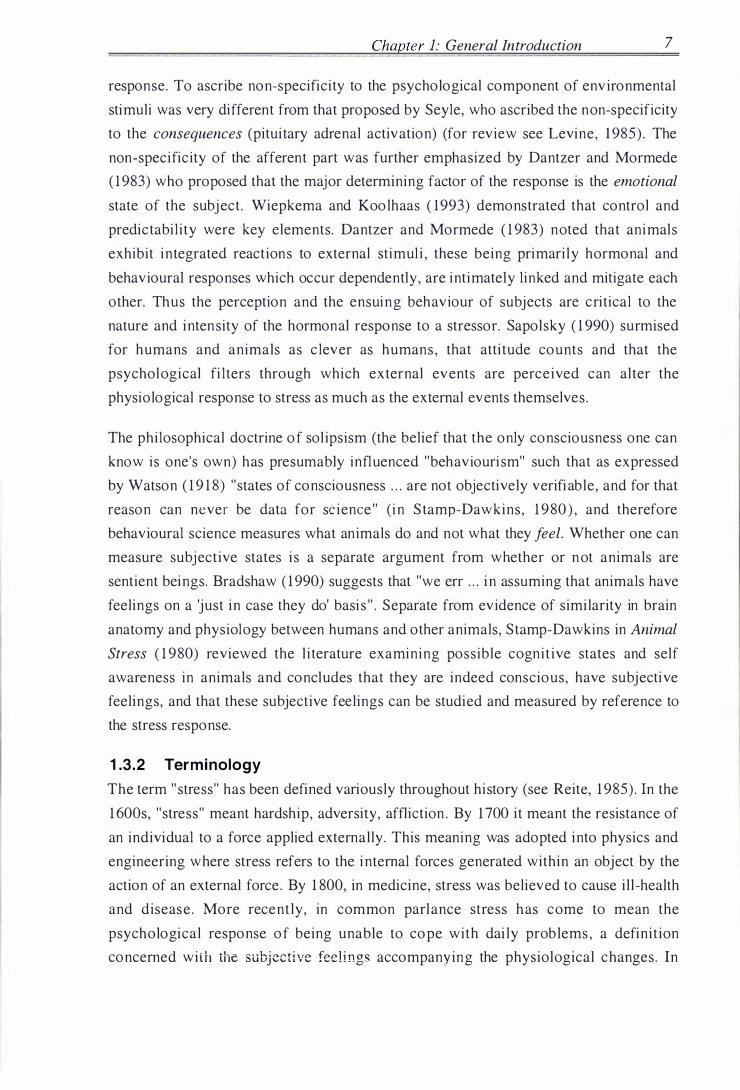
response. To ascribe non-specificity to the psychological component of environmental
stimuli was very different from that proposed by Seyle, who ascribed the non-specificity
to the consequences (pituitary adrenal activation) (for review see Levine, 1 985) . The
non-specificity of the afferent part was further emphasized by Dantzer and Mormede
( 1 983) who proposed that the major determining factor of the response is the emotional
state of the subject . Wiepkema and Koolhaas ( 1993) demonstrated that control and
predictabi l i ty were key elements. Dantzer and Mormede ( 1 983) noted that animals
exhibit integrated reactions to external stimul i , these being primari l y hormonal and
behavioural responses which occur dependently, are intimately linked and mitigate each
other. Thus the perception and the ensuing behaviour of subjects are critical to the
nature and intensity of the hormonal response to a stressor. Sapolsky ( 1 990) surmised
for humans and animals as c lever as humans , that atti tude counts and that the
psychological fi l ters through which external events are perceived can alter the
physiological response to stress as much as the external events themselves.
The philosophical doctrine of sol ipsism (the belief that the only consciousness one can
know is one's own) has presumably infl uenced "behaviouri sm" such that as expressed
by Watson ( 1 9 1 8) "states of consciousness . . . are not objectively verifiable, and for that
reason can never be data for science" (in S tamp-Dawkins, 1 980 ) , and therefore
behavioural science measures what animals do and not what they feel. Whether one can
measure subjective states i s a separate argument from whether or n ot animals are
sentient beings. Bradshaw ( 1 990) suggests that "we err . . . i n assuming that animals have
feelings on a 'just in case they do' basi s " . Separate from evidence of similarity in brain
anatomy and physiology between humans and other animals, Stamp-Dawkins in Animal
Stress ( 1 980) reviewed the l i terature examining possible cognit ive states and self
awareness in animals and concludes that they are indeed conscious, have subjective
feelings, and that these subjective feelings can be studied and measured by reference to
the stress response.
1 .3.2 Terminology
The term "stress" has been defined variously throughout history (see Reite, 1 985) . In the
1 600s, "stress" meant hardship, adversity, affliction . By 1 700 it meant the resistance of
an individual to a force applied externally. This meaning was adopted into physics and
engineering where stress refers to the internal forces generated within an object by the
action of an external force. By 1 800, in medicine, stress was believed to cause i l l -health
and disease . More recent ly , in common parlance stress has come to mean the
psychological response of being unable to cope with dai ly problems , a definit ion
concerned wilh the subjective feelings accompanying the physiological changes. In

Chapter 1: Genera/ Introduction 8
scientific circ les i t has been defined as the biological response, or the stimuli which
causes the stress response (tautology intended) or both.
One difficulty in the study of stress is that the term " stress" has been associated with
various parts of the general adaptation syndrome. This has necessitated the use of stress
qualifiers according to the " leve ls " of magnitude and the adaptive outcome of the
animal 's responses to stressors (Ewbank, 1 992). The term stress has been used; a) to
describe the whole of the general adaptation syndrome (Seyle, 1 956) ; b) to denote a
low level of response (Ewbank, 1 973), ei ther being the adaptive processes only (Seyle,
1 974) or some damage to an animal whether adaptive or not (Fraser et al. , 1 975) ; c) to
denote the greater responses termed overstress (Ewbank, 1 973) or the damaging and
unpleasant termed "distress" (Seyle, 1 974); or d) both where overstress and di stress
denote increasing levels of response respectively (Ewbank, 1985) . Furthermore, very
low levels of stress have been defined as physiological stress (Ewbank, 1 985) , or
homeostasis , or when adaptive are not referred to as stress at a l l (Fraser et al. , 1 975) .
However, there i s a consensus to define " stress" as the biological response to
chal lenges, and to define the stimulus that elicits a stress response as the "stressor"
(Ewbank, 1992).
For the purposes of clari ty, in this thesis the term " stress " wi l l be used to refer to the
biological responses of an animal to challenge . Thi s embraces the whole response
continuum from deviations just beyond activation of minor homoeostatic mechanisms
through to maximal responses. The term "distress " wi l l be used to denote the "conscious
awareness of an unpleasant state" (Ewbank, 1 992; Melior et al. , 2000) in order to
identify the contributions of the cogniti ve and emotional elements to that response.
Suffering is an unpleasant emotional state which occurs when its consti tuents, anxiety,
fear, pain or di stress, increase in intensity. Whil st a stress response may not involve an
emotional component, suffering and i ts consti tuents (distress, pain , fear and anxiety)
always do. For example, surgery conducted under general anaesthesia wi l l el icit a stress
response, but the individual is not considered to be distressed, in pain or suffering as
there is no conscious awareness. To be able to experience these subjective states an
individual must be both sentient and conscious.
1 .3.3 Pain
The assessment of pain in animals i s problematic . Pain i s a perception with no physical
dimensions , it is a sensory experience evoked by stimuli that cause or threaten to cause
inj ury to tissue. Pain in humans has been described as having sensory-discriminative
�md motivational -affective dimensions (Melzack and Casey, 1 968) . Solipsism states that
only our own experiences are knowable. Modern theory however, states that experience
need not be direct to establ ish that a state or substance exists (Kitchel l and Johnson ,

Chapter 1 : General Introduction 9
1 985) . Thus by comparative anatomical , physiological and behavioural analogies that
indicate a simi lari ty of pain perception in ani mals and humans, we can infer that pain i s
experienced in animals which are unable to verbal l y communicate with us . Both
humans and ani mals share s imilar nociceptive and pain pathways, structures and
neurotransrnitters (Dart, 1 994a; see 3 .4.4), and exhibi t simi lar nocifensive responses to
acute pain and depression responses to chronic pain . The pain t hreshold, that is the
mini mal level at wh ich pain is detected, appears to be s imi lar across species
(Dart, 1 994a). However, the pain tolerance threshold, that i s the max imum level of pain
tolerable, varies markedly within a species and may be influenced by physiological and
motivational factors. Consciousness and sentience are requisite to pain perception . Thus
whi l st an unconscious animal can exhibit nocifensive reflexes and neural activity there
is no awareness, and hence no perception of pain . The International Society for the
Study of Pain has provided a systematic description of pain (see Table 1 . 1 ) .
Table 1 . 1
Attribute
Purpose
Detection
Perception
Character
Definition
Variation
Major attributes of pain (from Mel ior et al. , 2000 modified from Merskey, 1979) .
Description
Pain is understood to have evolutionary survival value
Pain sensations depend on activation of a d iscrete set of receptors (nociceptors) by
noxious stimuli
Further processing via nerve pathways enables the noxious stimuli to be perceived as
pain
Pain perception varies according to site, duration and intensity of stimulus and can be
modified by previous experience, emotional state and perhaps innate individual
differences
Pain is defined as an unpleasant sensory and emotional experience assoc iated with
actual or potential tissue damage, or is describable in terms of such damage
The pain-detection threshold is apparently uniform across species, whereas the pain
tolerance threshold may be more species specific and subject to modification
In addition to having a pain warning system, mammals have an endogenous pain control
system (endogenous analgesic system) which i s i mportant in the modulation of pain
perception and adaptation to painful stimuli . Evidence of ihi s system is based on two
sets of observations (see Rose and Adams , 1 989 for review). First there i s evidence of

Chapter 1 : General 1ntroduction 10
descending pain-control circuits involving serotonergic neuropeptides, endogenous
opiates, vasopressin, neurotensisn, substance P and perhaps noradrenergic involvement.
The second set of observations involve the opiate system. There are three families of
endogenous opioid peptides and receptors in the body which are involved in nociceptive
reflexes , analgesic activity and show naloxone antagonism. A variety of painful or
stressful events induce analgesia, and i t is presumed that thi s stress-induced analgesia i s
an adaptive response which permits motor activity in order to evade and thus mitigate
the noxious stimulus. The animal reacts as if the pain tolerance threshold were reduced.
Depending on the type, intensity and duration of stimulus, two types of stress-induced
analgesia are observed, one is opioid dependent and the other is non-opioid dependent.
Pain is a potent stimulus which may elicit stress responses involving the sympathetic
adrenomedullary system (SNS) and the hypothalamic-pituitary-adrenal system (HPA
axis).
1 .3.4 The Stress Response
The maintenance of the relative constancy of the milieu interieur despite a wide range
of external stimuli is called homeostasis . There are primari ly two homeostatic systems
which respond to significant threat and injury (Melior et al. , 2000). They are the SNS
and the HPA-axis which collectively are responsible for the stress response. The SNS
provides the physiological basis for the fight/fl ight behaviours and the HPA-axis
provides the physiological conditions which combat i njury and promote heal ing.
Acti vation of the SNS increases mental alertness , energy mobi l i zation , basal
metabolism, respiratory function , cardiovascular tone and changes in perfusion from the
gastro-intestinal tract to the skeletal muscles. Acti vation of the HPA-axis affects
carbohydrate, protein and fat metabol ism. This provides increased c ircul at ing
concentrations of energy sources for fuell ing the fight/flight responses and the synthetic
processes involved in inflammation and the heal ing of ti ssues. In addi tion, the end
product of activation of the HPA-axis, cortisol, serves to control or inhibit the process
of inflammation (Goldstein et al. , 1992; Matteri et al. , 2000).
The HP A-axis responds to a range of both physical and psychogenic stimul i . With the
onset of stress, transmi tted by the relevant neural pathways, corticotropin-releasing
factor (CRF) is secreted from the hypothalamus. CRF is secreted into the hypophysial
pitui tary portal circulation, and is carried to the anterior pituitary where it stimulates the
secretion of adrenocorticotropic hormone (ACTH). CRF is among the most important of
the stress-related secretagogues which inc lude vasopressin , oxytoc in , and the
catecholamines (adrenalin and nor-adrenal in) . ACTH is released into the general
circulation where it is carried to the adrenal cortex . At the adrenal cortex ACTH
stimulates the secretion of corticosteroid hormones, primari ly glucocorticoids , i nto the

Chapter 1: General Introduction 1 1
circulation from whence they reach and exert their effects on target tissues throughout
the body . In both humans and cattle the primary glucocorticoid is cortisol
(hydrocorti sone) . Glucocorticoids exert their effect by interacting with cytostolic
receptors which , upon binding the hormone, translocate to the nucleus and regulate
genomic events (Sapolsky, 1 992) . Glucocort icoids mobi l i ze energy through
gluconeogenesis and inhibiting energy storage, affect the cardiovascular system, and
inhibit anabolic processes including growth, reproductive, immune and inflammation
systems (Saplosky, 1990). Activity of the HPA-axis is modulated by the end prcx:iuct
cortisol (Fig 1 . 1 ) .
Stressor � brain
v '+ hypothalamus .---------------�J
- CR anterior
_ pitu itary
adrenal cortex
+ metabolic adjustments
� anti-inflammatory �' actions
Fig 1 . 1 Schematic diagram of the major components of the hypothalamic-pituitary-adrenal axis . A
stimulus perceived as a stressor initiates a cascade of events inc luding release of corticotropin-
releasing factor (CRH) and vasopressin (VP) from the hypothalamus . These stimulate the
release of adrenocorticotropic hormone (ACTH) from the anterior p ituitary, which in turn
stimulates the adrenal cortex to release cortisol. Cortisol acts on a variety of target tissues to
maintain homeostasis.

Chapter 1 : General 1ntroduction 12
The activity of the HP A-axis i s more complex than that described in the above review
(see Sapolsky, 1 992). Other pertinent features include: 1) There appears to be a dose
response relationship between the severity of the stressor and the magnitude of the
adrenocortical response . Once the maximal glucocorticoid secretion is attained, further
increases in ACTH concentrations do not lead to a larger secretory response but rather
to a l onger one (Kel ler-Wood et al. , 1983 ) . 2) The adrenocortical axis exhibits
circadian rhythmicity, with peak glucocorticoid concentrations shortly after waking and
troug h s around t h e onset of s l eep (Mac A dam and Eberhart , 1 97 2 ;
Guyton , 1992) . 3 ) There i s some debate as to whether glucocorticoids mediate the
stress response (Sapolsky, 1992) or cause recovery from the stress response (Munck
et al., 1984).
1.4 MEASUREMENT OF STRESS
1 .4.1 Cortisol and behaviour
Changes in plasma cortisol concentrations and behaviour have been used extensively to
assess distress elicited by physical ly or emotionally noxious experiences (Mellor et al. ,
2000) . Changes in plasma cortisol concentrations and/or behaviour evoked by various
husbandry procedures, including castration and/or tai l ing, branding, transport, unusual
handling or environment and veterinary procedures , have been measured in many
species including sheep, goats and cattle (e.g. Adeyemo and Heath, 1 982; Alam and
Dobson , 1 986; Mel ior and Murray, 1 989a; Mellor et al. , 199 1 ; Lay et al., 1992a,b;
Lyons et al. , 1 993).
Whilst increased activity of the HP A-axis i s the hal lmark of stress (Seyle, 1 936), i t is
recommended that a series of indices be measured to assess stress (Stamp-Dawkins,
1980). Changes in behaviour are considered a valid indicator of stress and may have
advantages over measuring changes in plasma cortisol concentrations.
1 .4 .2 Behaviour
Changes in behaviour are often the first indication that a stress has occurred (Morton
and Griffiths, 1 985), and may indicate the nature of the stressor and the way in which
the animal i s attempting to cope with that stressor. An animal's freedom to move may be
one of its most important adaptations to environmental conditions (Martin and Bateson,
1986).
Tinbergen ( 1 963) identified four approaches for use when studying behaviour. These
are : causation , ontogeny, function and phy logeny . Traditional ly psychologi sts have
focused on the causation of behaviour. This includes proximate causation questions
such as "How do internal and external causal factors elicit and control the behaviour?" ,

Chapter 1: General Introduction 13
and ontogenic questions such as "What internal and external factors influence the way
in which the behaviour develops during the l ifetime of the individual? " . Ethologists
have focused on the biological function of the behaviour and how it evolved, including
functional questions l ike "What is the current survival value of the behaviour"?, and
phylogenetic questions l ike "How did the behaviour evolve during the hi story of the
species? " . The study of behaviour from these four logically distinct approaches may
help one elucidate and understand the effect of stressors and the stress responses upon
the animal.
Historical ly there have been three approaches to identifying the behavioural expression
of suffering in animals . These are (Stamp-Dawkins, 1980): 1 ) conelating the change in
behaviour with evidence of physiological stress; 2) correlating the change in behaviour
with known behavioural changes under si tuations which are presumed to cause stress,
such as, fear, frustration and confl ict ; and 3) examining "abnormal " behaviours.
Abnormal behaviour may be defined as a significant change from normal or usual
behaviour, and maladaptive or damaging behaviours .
Ewbank ( 1 985) suggested that in order to show a clear relationship between the
behavioural change and stress four criteria must be fulfi l led: 1 ) the stressor must be
identified; 2) the physiological responses to stress must be quantified and ideal ly
correlated with the change in behaviour; 3 ) the behaviour must be described and
measured; and 4) damage to the physical or psychological wel l -being must be
demonstrated.
A number of c lassical abnormal behaviours have been identified which include :
stereotypie s ; anomalous react ivi ty i nc l uding apathet ic , ton ic i mmobi l i ty or
hyperacti vity; self-directed abnormal behaviour (i .e . abnormal in its extent or location) ;
inappropriate ly directed behaviour (towards other animals or obj ects) ; fai lure of
function ; and vacuum activi ties (behaviours performed in the absence of suitable
stimuli) (Matthews, 1 992 ) . In addition to these behaviours, which are often associated
with chronic stressors, are those particu larly associated with i l l-health and pain
including: changes in temerament (e .g. restlessness); postural adj ustments or protective
responses; changes in appearance (especially body care and grooming) ; and avoidance
of handlers or yards where an aversive si tuation was encountered.
There are two reasons why there may be some difficulty with the assessment of pain in
cattle using behavioural indices. First, cattle are prey species and as a means of
improving survival, may have evolved to not show behavioural responses to many
aversive stimuli (Hinch, 1 994). The apparent absence of abnormal behaviour does not
prove that cattle are not stressed, but rather that they are "stoic" (KJ Stafford, personal
Chapter 1 : General 1ntroduction 14
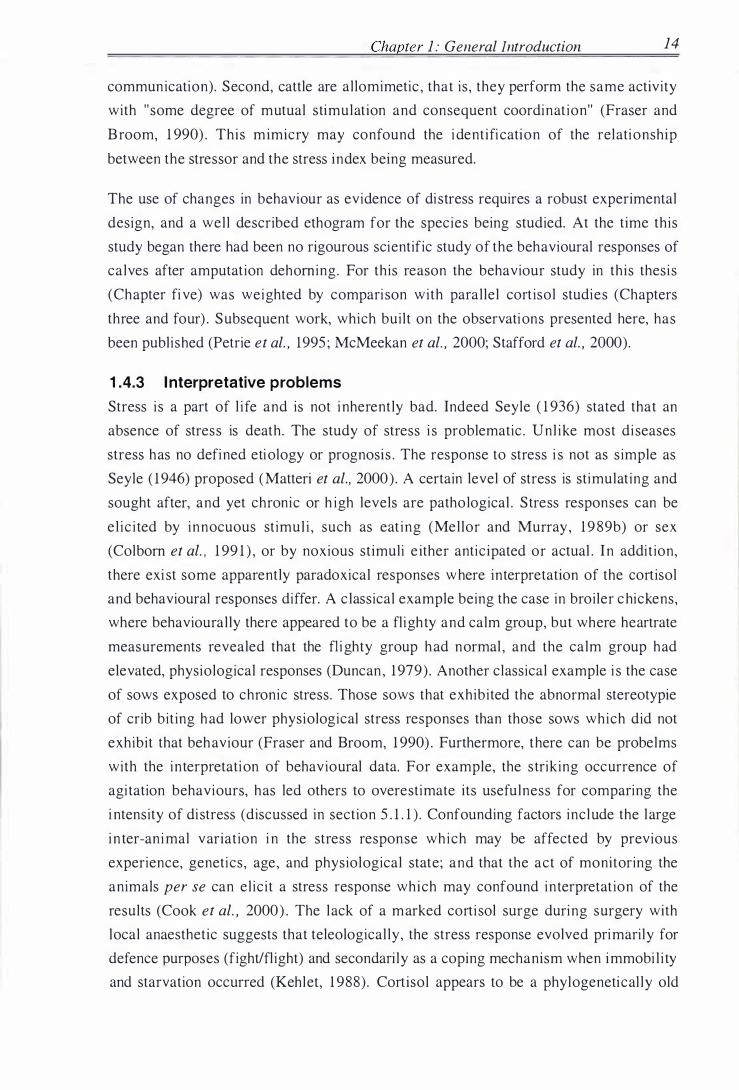
communication). Second, cattle are allomimetic , that is , they perform the same activity
with " some degree of mutual stimulation and consequent coordination" (Fraser and
Broom, 1 990) . This mimicry may confound the identification of the relationship
between the stressor and the stress index being measured.
The use of changes in behaviour as evidence of di stress requires a robust experimental
design, and a well described ethogram for the species being studied. At the time this
study began there had been no rigourous scientific study of the behavioural responses of
calves after amputation dehoming. For this reason the behaviour study in this thesi s
(Chapter fi ve) was weighted by compari son with parallel cortisol studies (Chapters
three and four) . Subsequent work, which built on the observations presented here, has
been published (Petrie et al. , 1995 ; McMeekan et al. , 2000; Stafford et al. , 2000).
1 .4.3 Interpretative problems
Stress i s a part of l i fe and is not inherently bad. Indeed Seyle ( 1 936) stated that an
absence of stress is death. The study of stress i s problematic . Unl ike most di seases
stress has no defined etiology or prognosis . The response to stress i s not as simple as
Seyle ( 1 946) proposed (Matteri et al., 2000) . A certain level of stress is stimulating and
sought after, and yet chronic or h igh levels are pathological . Stress responses can be
e l ic i ted by innocuous stimul i , such as eat ing (Melior and Murray , 1 9 89b) or sex
(Colbom et al. , 1 99 1 ) , or by noxious stimuli e ither anticipated or actual . In addition,
there exi st some apparently paradoxical responses where interpretation of the cortisol
and behavioural responses differ. A c lassical example being the case in broiler c hickens,
where behaviourally there appeared to be a flighty and calm group, but where heartrate
measurements revealed that the fl i ghty group had normal , and the calm group had
elevated, physiological responses (Duncan , 1979) . Another classical example i s the case
of sows exposed to chronic stress. Those sows that exhibited the abnormal stereotypie
of crib biting had lower physiological stress responses than those sows which did not
exhibit that behaviour (Fraser and Broom, 1 990) . Furthermore, there can be probelms
with the interpretation of behavioural data. For example, the striking occurrence of
agitation behaviours, has led others to overestimate its usefulness for comparing the
i ntensity of di stress (discussed in section 5 . 1 . 1 ) . Confounding factors include the large
in ter-animal variation i n the stress response which may be affected by previous
experience, genetics, age, and physiological state; and that the act of monitoring the
animals per se can el icit a stress response which may confound interpretation of the
results (Cook et al. , 2000) . The lack of a marked corti sol surge during surgery with
local anaesthetic suggests that teleological ly , the stress response evolved primarily for
defence purposes (fight/fl ight) and secondarily as a coping mechanism when immobi l i ty
and starvation occurred (Kehlet, 1 988) . Cortisol appears to be a phylogenetical ly old

Chapter I : General Introduction 15
tool for survival and may have l i ttle use in the modern surgical operation, i n fact the
suppression of the cmtisol response may be beneficial (Kehlet, 1 988 ; Dart, 1994b) .
Given such paradoxical responses and problems it would appear that the measurement
of stress is too daunting and condemned to the " too difficult" basket. However, Melior
et al., (2000) advanced some principles and caveats to guide the quantitati ve and
qual i tative evaluation of physiological (cortisol) and behavioural responses to painful
st i m ul i . When eva l uating cort i so l re sponses the fol l ow ing need to be
considered: 1 ) what do the cortisol responses represent? 2 ) how can those responses be
characterized quanti tatively (see Chapter two)? 3) i s there a correlation of the response
with the presumed noxiousness of the stimul i? and 4) what are the implications of inter
animal variabil ity? When evaluating behavioural responses the fol lowing need to be
considered: 1 ) is the observed behaviour correlated with the noxious sensory
input? 2) i s i t injury specific? 3) can i t be used to identify different features of the
distress responses? 4) i s i t a sensiti ve index of pain-induced distress? 5) i s it clearly
defined? and 6) can it be scaled according to different levels of pain?
1 .4.4 Critique of analyses
Individual differences are relevant (Wiepkema et al. , 1 987) and indeed central to the
area of animal welfare science (Manteca and Deag, 1 993) , because animal welfare i s
concerned with the state of the individual (Broom, 1988) . Manteca and Deag ( 1 993)
proposed that individual differences in temperament may be important when designing
experiments and when interpreting the results from animal welfare behaviour studies .
Such individual di fferences are not those well recognized to be accounted for by age,
sex , genetics or previous experience. Laedwig ( 1 99 1 ) suggested that if experimental
animals are subdivided into subpopulations according to temperament then individual
variation in results would be decreased. The identification of subgroups according to
temperament needs to be validated against independent measures (Manteca and Deag,
1 993) . Whilst Manteca and Deag ( 1 993) were addressing the idea of indi vidual
variation in behavioural responses, presumably the same variation occurs in the
physiological responses and in the relative contribution of the behavioural versus the
physiological manifestation of the stress response.
During the course of analysing the cortisol responses after dehoming, it was noted that
in 28% of the cases, the cortisol concentrations resolved and remained at a new baseline
value that was two standard deviations lower than the mean starting value. It w as
thought that these could either be a subpopulation or an artifact of data transformation.
In Chapter two, the assumptions and l imitations underlying transforming the corti sol
data are examined. Possible explanations for these responses are advanced, and an
innovative method for transforming the cortisol data i s suggested. Possible differences

Chapter 1: General Introduction 1 6
m the interpretation of the corti sol responses using raw or transformed data are
discussed.
1.5 ALLEVIATION OF PAIN-INDUCED DISTRESS
1 .5 .1 Local anaesthetic
The application of local anaesthetic reduces the physiological and psychological
responses to painful stimuli (Bonica, 1 990b) . Local anaesthetics may be considered
therapeutic and prophylactic , as some of the pain -induced di stress responses may
counter healing, exacerbate the trauma and if severe enough promote pathology (Bonica
and Buckley, 1 990). When local anaesthetic is applied to the sensory nerves serving the
area of trauma, it blocks al l sensation from that area including nociception, rendering
that peripheral section of the nociceptive pathways temporaril y nonfunctional, whi lst
the cognitive and emotional aspects of pain perception are left functioning. It i s possible
that even with the efficacious application of local anaesthetic , there may yet be a
di stress response arising from cues other than pain . In the context of dehoming these
may include: manipulation or restraint, unusual sounds or sensations, the smell of blood,
changes in the weight or sensations of the head. In addition , some anaesthetics and
analgesics appear to have a direct action on the function of the HP A-axis (Fox, 1994;
Bonica, 1990a) .
1 .5.2 Cautery
Cautery has been used throughout medical hi story to promote hemostasi s which was
considered more important than the attendant retardation of wound healing . The use of
cautery to decrease pain-induced distress per se as opposed to aiding hemostasis is a
relatively novel idea. At first sight this may appear to be paradoxical because it involves
the additional insult of a bum injury. The possibi lity of a therapeutic effect from cautery
in surgical amputations is primari ly derived from observations in this laboratory. Lester
et al. ( 199 1 a) reported that the cortisol responses of lambs that were tai l docked using a
heated docking iron were lower than those when a knife was used. They proposed that
the lower cortisol concentrations after cautery rather than surgical tai l docking may be
due to the thermal destruction of nociceptors at the site of inj ury. The impact of wound
cautery on the cortisol response to amputation dehoming was therefore examined here
(Chapter four) and has since been published (Sylvester et al. , 1 998a) and confirmed
(Sutherland, 1 999) .
1.6 AIMS AND FORMAT OF THE THESIS
This study was conducted in order to assess the pain-induced di stress of amputation
dehoming in six-month-old calves. The aims of the study were, firstly, to characterize

Chapter 1: General 1ntroduction 1 7
the pain-induced distress response, and second, to determine whether that distress could
be alleviated by the application of different tools , local anaesthetic and/or cauterizing
the dehorning wound. Changes in plasma corti sol concentrations and changes in
behaviour were used as indices of di stress. Such work has the potential to improve the
welfare of cattle, contribute to our understanding of the assessment and physiology of
pain-induced distress, and therefore have application to other management practices.
The work described in this thesi s was preceded by a pi lot study (Sylvester et al. , 1 993)
(see Appendix A) which was carried out in order to characterize the magnitude and
duration of the cortisol response to dehorning through an adequate sampling frequency .
This had been a problem in previous studies, resulting in the data being equivocal
(Carter et al. , 1983 ; Johnston and Buckland, 1976; Boandle et al. , 1 989).
The thesi s is structured as following:
Chapter 1 General Introduction.
This chapter introduces some problems which arise when trying to assess the emotional
state of animals, in particular, pain-induced di stress, and discusses the welfare, ethical
and legislative issues related to this work.
Chapter 2 Critique of the analyses of the cortisol responses.
Chapter two IS a critique of the assessment of the corti sol responses. Thi s is an
examination of how cortisol responses are analyzed and of the importance of
experi mental design in animal welfare science. The assumptions and l imitations of
using different frames of reference for assessing cortisol data are examined using a
sample data set.
Chapter 3 The acute cortisol responses of calves following four methods of
de homing.
Chapter three describes the effects of dehoming, using four commonly employed tools,
on the plasma cortisol concentrations in order to characterize the stress response in six
month-old calves, and to assess if there i s a method which causes the least distress. In
addition , Chapter three establishes a frame of reference for studying cortisol responses
in six-month-old cattle by identifying "basel ine" and "maximal " corti sol values, the
latter through conducting an ACTH challenge (Sapolsky, 1 992 ; Verkerk et al., 1 993 ;
Petrie et al. , 1 996b) . The ACTH challenge also tests the functioning of the adrenal
gland component of the HPA-axis (Melior et al. , 2000; Melior and Murray, 1 989b).
This work has now been published (Sylvester et al. , 1 998b; Appendix A).

Chapter 4
Chapter 1 : General Introduction 18
Cortisol responses of calves to scoop dehorning with and without
local anaesthetic and/or subsequent cautery of the wound.
Chapter four describes the effect of prior appl ication of local anaesthetic and/or
subsequent cauteriz ing of the dehorn ing wound on plasma cort iso l responses to
dehorning by scoop amputation. This work has now been publi shed (Sylvester et al. ,
1998a; Appendix A).
Chapter 5 The acute behavioural responses of calves to scoop dehorning with
and without local anaesthetic.
Chapter five describes the behavioural responses of calves to dehorning with and
without local anaesthetic . The study was conducted in paral lel , but not s imultaneously
with, the corti sol studies of Chapters three and four. By comparison with the cortisol
studies, this study supports the credibil ity of using changes in behaviour as an i ndex of
distress, and thus subsequently supports the use of behaviour alone.
Chapter 6 General Discussion.
Chapter s ix I S a synopsis of the original findings from this work i ntegrated with
developments in the field since 1 993 (Petrie et al . , 1 996b; McMeekan et al. , 1997,
1998a,b, 1 999; Sutherland, 1999; Stafford et al. , 2000; Sutherland et al. , 2002a,b).

Chapter 2: Critique of analyses 19
2 CRITIQUE OF THE ANALYSES OF THE CORTISOL
RESPONSES
2.0 ABSTRACT
Activation of the HP A-axis , as measured by an increase in circulating corti sol, i s used
as evidence that stress has occurred. This response may be analysed as changes in the
timecourse of plasma corti sol concentrations and/or the integrated cortisol response.
The raw data may be used, or the data may be transformed to examine changes from a
pretreatment value (adjustedpre.tmt). The usual approach is to use adjustedpre.tmt values
for these analyses. The validity of analysing data transformed in this manner was
questioned when it was found that 28% of the corti sol responses resolved to values
about two standard devi ations below their pretreatment value, as th i s would
underestimate the cortisol response. In order to account for these responses the data was
adjusted relative to a value at a time when the response to the treatment was over. The
mean value during the period 7-9 h post-treatment was used in place of the pretreatment
value, and the response recalculated relative to this value (termed adjustedpost.tmt )· The
purposes of this chapter were a) to examine the assumptions and l imitations inherent in
using raw, adjustedpre. tmt or adjustedpost.tmt cortisol data; and b) to determine whether
resulting differences are statistically or biological l y significant in the context of real
data sets. The use of the post-treatment value, as opposed to the pretreatment value, as
the reference point from which to compare responses, decreased the data variance but
resulted in no change in the stati stical differences between treatments when comparing
the time integral of the response and few differences when comparing the timecourse of
the response. Irrespective of which basel ine adj ustment was made or whether
unadjusted data was used, there were no differences in the biological interpretation of
the data. These results suggest that our experimental design was sufficiently robust to
account for systematic or random variation, and this confirms that our methodology was
sound. Whi lst there appeared to be no advantage in using this technique, it is possible
that under some circumstances, the post-treatment sample may more accurately
represent baseline values than the pretreatment sample.
2.1 INTRODUCTION
Animals have a range of biological mechani sms to cope with chal lenges which threaten
their survival . Activation of the HPA-axis , as measured by an increase in circulating
concentrations of corticosteroids i s often used as evidence that stress has occurred
(Seyle, 1936; Moberg, 1985) . In cattle the major glucocorticoid secreted in response to

Chapter 2: Critique of analyses 20
a stressor is cort isol . The response may be analysed by examining changes m the
t imecourse and the i ntegral of the cortisol response. The raw data may be used, or the
data may be transformed to examine changes from a pretreatmen t va lue
(adj ustedpre.tmt) · The usual approach i s to use adjustedpre.tmt values for these analyses.
Thi s is done primari ly to account for any pretreatment effects and possible i ndividual
variation in baseline cortisol values. However, this transformation causes weighting of
the data around the pretreatment reference point. Therefore one must be confident that
the pretreatment state i s representative of an unstressed state . If i t i s not, then the
adjusted analyses may underestimate the cortisol response to the stressor.
The val idity of analysing data transformed in this manner was questioned w hen it was
found that 28% of the cortisol responses resolved to values about two standard
deviations below their pretreatment value (Chapter four) . Possible explanations for
these responses are advanced, and an innovative method for transforming the cortisol
data to account for these responses is suggested. The assumptions and l imitations
underlying transforming the corti sol data are examined. Possible differences in the
interpretation of the cortisol responses, using either raw data or data transformed by
either reference value, are discussed.
A goal of animal welfare science is to assess the effects of stressors, which can be done
by examining changes in plasma cortisol concentrations. When examining the cortisol
response to a stressor we are interested in answering certain questions including: What
i s the duration and extent of the response?; and are there signi ficant differences
between-treatments? These biological questions are answered by analysi ng i nformation
derived from the corti sol timecourse, and the differences are assessed statistical ly . An
adrenal response may be e l ic i ted by the emotional di stress associated with the
experimental paradigm (Mason, 1 968) . Thi s may complicate i nterpretation of the
results. Because an ani mal's stress response is exqui sitely sensitive to the vagaries of
experimental design, animal welfare science requires a robust experimental design to
either account for or mitigate these effects. In addition, a series of blood samples of
sufficient frequency are required to characterize (pattern, magnitude and duration) the
corti sol response. In the present chapter, before di scussing the analys is of cortisol
responses along with the underlying assumptions, consideration wi l l be given to some
aspects of scientific method pertinent to animal welfare science, namely : experimental
design, data transformations and statistical theory.

Chapter 2: Critique of analyses
2.2 EXPERIMENTAL OVERVIEW
2.2.1 Scientific method
Experimental design
21
The purpose of good experimental design i s to el iminate confounding effects . Ideally
four precautions should be taken to ensure sound design ; a) control groups, b) placebos
or sham procedures c) double or single blind procedures and d) random assignment. A
control group i s a group of subjects which are left untreated and a treatment group is a
group of subjects which are given the treatment being studied. The use of control groups
ensures that there i s something with which to compare a treatment group so that one can
determine whether or not the response i s caused by the treatment or the experimental
si tuation per se. In addition, pretreatment samples are taken . This act as another form of
control compari son, i n th i s case for the indi vidual response. Placebos are inert
substances which are administered in the same way as a treatment medication. Sham
procedures closely resemble treatment procedures but are not intended to have the effect
of the treatment. A study i s double blind if neither the researcher nor the subj ects know
which subjects are in the control and which are in the treatment groups. Randomization
is where the assignment of subj ects to treatment or control groups i s done by some
chance-governed mechanism. If confounding effects are to be decreased, the control and
treatment groups must be s imi lar with respect to any characteri stic that could affect the
results (e.g. age, sex, health or size).
Data transformations Prior to analysis , the data may be transformed mathematical ly including : geometric
(mul t i p l i cat ive , logari thmic ) or ari thmet ic ( addi t i ve) manipul a t ions . Data
transformations are often used to correct for violations of normal ity and equal-variance
assumptions, and to deal with non-linear relationships, so that correlation or regression
analyses can be applied to the data. Skewed data can be normalized by taking square
roots, logari thms, or reciprocals ( 1 /x) or by squaring the data (Shott, 1 990; Fowler and
Cohen, 1 990). It is a mathematical fact that a transformation which normalizes the data
al so removes the dependency of the variance upon the mean , and so ensures that a
particular statistical method can be val idly applied (Fowler and Cohen, 1 990).
Transformations conducted to correct for basel ine (or pretreatment) effects are
essential ly ari thmetic . Thi s is done when the focus is on i solating the response to a
stimulus, that i s , examjning changes in concentration from a pretreatment situation. The
values are adjusted by subtracting the pretreatment concentration from every corti sol
concentration which renders the pretreatment sample a zero relative concentration and
thus equates all individual baselines. However, the effect upon the interpretation of the

Chapter 2: Critique of analyses 22
cortisol response usmg data transformed in this manner has apparently not been
qualified.
Statistical theory When measuring any biological parameter there wil l be a range of values obtained as a
result of biological variation . While variables such as age, sex and time of day can be
control led through good experimental design , there wi l l be others that can not. If the
measurement h as been made using a random sample representative of the normal
population, then an estimate of the normal range for a given physiological measurement
can be calculated using standard stati stical techniques. Most biological characteri stics
conform to a normal distribution which expresses a certain relationship between the
mean value and the variance. A measurement of the variation (or error) i s the standard
deviation (SD), which is a measure of the average of deviations from the mean . In a
normal distribution the range covered by plus or minus (±) l SD includes 68%, ± 2SD
includes 95%, and ± 3SD includes 99.73% of the observations. The standard deviation
is a measure of variation of an individual measurement within the sample. A measure of
the variation in the mean is the standard error of the mean (SEM, where SEM=SD/..Jn) .
This i s an estimate of the SD that would be obtained from the mean of a given number
of samples . It is possible to predict from the mean and SEM of the sample, the
probabil i ty that any particular value in the general population is normal . The probability
(P) of a sample being greater or less than 2SD from the mean is 5% or less, that is, the
probabil i ty that the difference i s due to chance is less than 5 % and is therefore
considered to be due to the treatment . Thi s criterion i s often used to determine if a
difference i s significant and is usually denoted P<0.05. When comparing the difference
between the means of two groups of samples, the question often being asked is are they
from the same population? That is, do they lie within a range represented by the SEM of
each other, or not? As for a single di stribution above, if the di fference between the
means is greater than two multiples of their SEM then the difference is considered
significant. Various stati stical tests are used to calculate the significance of the
difference between means . In this thesi s analysis of variance (ANOV A), Mann
Whitney, correlation and regression have been used.
2.2.2 Cortisol data analyses
There are various analyses and statistical tests which may be employed to assess the
corti sol responses to stressors. The data are commonly analysed by examining changes
in plasma cortisol concentrations with time (timecourse) and related characteristics such
as maximum increment, time to maximum increment, increment at particular t imes after
treatment, duration or perimeter of the timecourse and the integral of the timecourse
(integrated response) either for the whole response or of different phases.
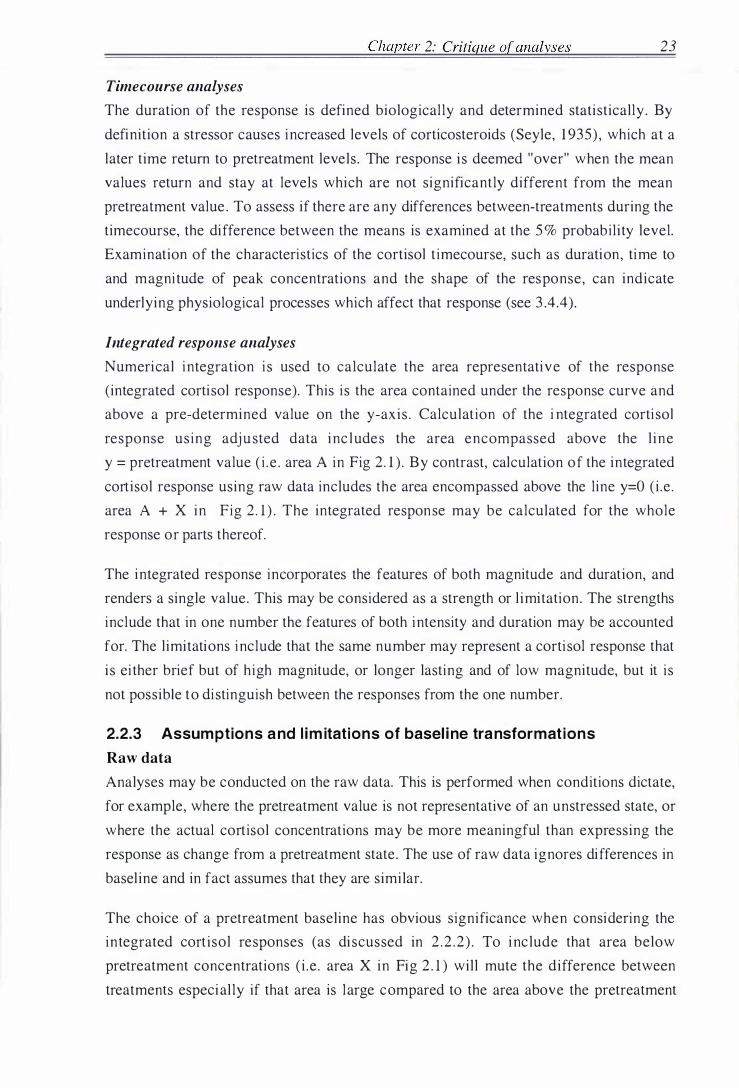
Timecourse analyses
Chapter 2: Critique of analyses 23
The duration of the response is defined biological ly and determined statistically . By
definition a stressor causes increased levels of corticosteroids (Seyle, 1 935) , which at a
later time return to pretreatment levels . The response is deemed "over" when the mean
values return and stay at levels which are not significantly different from the mean
pretreatment value . To assess if there are any differences between-treatments during the
timecourse, the difference between the means is examined at the 5 % probabil ity level.
Examination of the characteristics of the cortisol t imecourse, such as duration, time to
and magni tude of peak concentrations and the shape of the response, can indicate
underlying physiological processes which affect that response (see 3 .4.4).
Integrated response analyses
Numerical integration i s used to calculate the area representative of the response
(integrated cortisol response). This i s the area contained under the response curve and
above a pre-determined value on the y-axis . Calculation of the i ntegrated corti sol
response us ing adj u sted data inc l udes the area encompassed above the l ine
y = pretreatment value ( i . e . area A in Fig 2 . 1 ) . By contrast, calculation of the integrated
cortisol response using raw data includes the area encompassed above the line y=O (i .e .
area A + X in Fig 2 . 1 ) . The integrated response may be calculated for the whole
response or parts thereof.
The integrated response incorporates the features of both magnitude and duration, and
renders a single value. This may be considered as a strength or l imitation. The strengths
include that in one number the features of both intensity and duration may be accounted
for. The limitations include that the same number may represent a corti sol response that
i s ei ther brief but of high magnitude, or longer lasting and of low magnitude, but it i s
not possible to di stinguish between the responses from the one number.
2.2.3 Assumptions and l im itations of basel ine transformations
Raw data Analyses may be conducted on the raw data. This is performed when conditions dictate,
for example, where the pretreatment value is not representative of an unstressed state, or
where the actual cortisol concentrations may be more meaningful than expressing the
response as change from a pretreatment state . The use of raw data ignores differences in
basel ine and in fact assumes that they are similar.
The choice of a pretreatment baseline has obvious significance when considering the
integrated cortisol responses (as di scussed in 2 .2 .2) . To inc lude that area below
pretreatment concentrations ( i .e . area X in Fig 2 . 1 ) will mute the difference between
treatments especial ly if that area is large compared to the area above the pretreatment

Chapter 2: Critique of analyses 24
value (i .e . the response). Thi s point is demonstrated in the theoretical situation shown in
Fig 2. 1 . The cortisol response curve A has an area of 5 units, the cortisol response curve
B has an area of 1 unit . The area below (x) both pretreatment values has an area of 1
unit. The ratio of response of B to A using raw data i s 6 :2 , whereas, the ratio using the
adj usted data i s 5 : 1 . These are quite different ratios and thi s demonstrates how the area
below the pretreatment level may modify or mask the differences between-treatments,
and may even alter the statistical significances between-treatments . Therefore when
comparing integrated responses it is recommended that the adjusted data be used.
Fig 2 . 1
plasma cortisol concentrations
time
Schematic d iagram showing the calculation of the integrated cortisol responses using raw
and adjustedpre.tmt data. Using adjustedpre.tmt data, the integral is calculated as the area
under the curve and above the pretreatment value, i .e . area A . Using the raw data, the
integral is calculated as the area under the curve and down to y=O concentration, i .e. area
A + X. Where the integral of the response is small (eg. area B), then area X dominates.
Adjusted data The most commonly employed approach for analysing the corti sol response after a
stressor i s to use data that have been transformed to represent changes from a
pretreatment state . The pretreatment value i s subtracted from al l values which renders
the pretreatment zero relative concentration . The pretreatment cortisol concentration is
presumed to be representative of an unstressed state . This i s because i t i s taken as
quickly as possible before any increase in cortisol associated with the handling required
to take that sample occurs . This pretreatment concentration, called such because i t is

Chapter 2: Critique of analyses 25
taken prior to any stressor effect, is assumed to be i ndicative of basel ine cortisol
concentrations, that is the basal values required for normal function which are at
dynamic equil ibrium, and presumably wi l l not change with treatment. The response to
the treatment is defined as the change from the pretreatment (or basel ine) concentration .
The pretreatment value may differ from animal to animal . Referencing all responses to
the corresponding individual's pretreatment value, and denoting th is as zero units,
effectively equates all previous or existing stressors and stresses. In this manner the
pretreatment reference point acts as a 'before experiment control' which assumes that all
animals are at the same state . However, this may not be the case. It may be that for
some animals the pretreatment value reflects a pre-experiment state, in particular the
recent experiences of the animals . For this reason the term 'pretreatment' level I S
preferred to the term 'baseline' level although the latter is implied mathematical ly .
In summary, when analysing corti sol responses, data which have been adjusted relative
to the pretreatment value are generally used because they describe changes from a
pretreatment state and this accounts for indi vidual variation in basel ine values and any
pretreatment effects. A major limitation underly ing adjusting the data to examine
changes from a pretreatment value is that the data are weighted around the pretreatment
reference point, and this has most meaning when this reference is representative of an
unstressed state . If however, the pretreatment value i s not representative of an
unstressed state, then the subsequent response may be underestimated or di storted.
2.2.4 The problem - 28% of the responses were unusual
During the course of analysing the corti sol responses elici ted by the dehorning
experiment (Chapter four) , i t was found that in 28% of the animals the corti sol
concentrations resolved and remained at a new baseline value (z ' ) (7-9 h) that was about
two standard devi ations lower than the mean starting value (z) (Fig 2 .2) . This pattern of
corti sol values plateauing to levels substantial ly below pretreatment concentrations has
not been commonly reported, nor is it our experience from similar studies (Petrie, 1 994;
Sylvester et al. , 1 993) . It was thought that these animals could be either outliers or a
subpopulation ari sing ei ther because of unique responses or their experiencing a
pretreatment stress. That 28% had this feature however, merited further examination.
The calves that exhibited these responses were evenly distributed between treatments,
days, time of day and order of blood sampling. For these responses, the pretreatment
corti sol concentrations were nearly statistical outliers, that is, they were all about two
standard deviations greater than the mean (m) for the unadjusted pretreatment sample
(n=52) . In a normal di stribution only half of 5% of the observations are expected to be
greater than two standard deviations (SD) from the mean , so that this di sparity (in

Chapter 2: Critique of analyses 26
distribution of 2 .5% versus 28%) suggests that these samples belonged to another
population.
Fig 2.2
i ncrement in plasma cortisol concentrat ions
z
z' time
Schematic diagram of the cortisol timecourse of the subpopulation. Where the pretreatment
cortisol concentration is z but the values resolve to z', thereby underestimating the integral
of the response by area Y .
In addit ion to underestimating the integrated responses for these animals (Fig 2 .2) , the
coefficients of variation (CV, where CV=SD/m) of the mean timecourse and the
integrated responses were greater using adj usted data than those for the respective
unadjusted data. This suggests that the pretreatment value was not the best choice for
the reference point for analyses, and further, that the data transformation per se had
introduced artifactual variance. This raised the question of whether the data represented
a statistical abnormality or biological normal i ty i . e . were these animals a genuine
subpopulation rather than outliers per se.
It is possible that this subgroup was either:
a) a group with pretreatment cortisol concentrations that reflected a genuine
basal state, but where the subsequent stress somehow adjusted their cortisol
baseline to a new lower levels; or

Chapter 2: Critique of analyses 2 7
b) a group with pretreatment cortisol concentrations that reflected a genuine
basal state, but where the subsequent stress caused a temporary refractory
period for cortisol secretion , which will later return to the pretreatment level ;
or
c) a group where both the pre-treatment and the 7-9 h cortisol concentrations
reflected a basal state but where the difference between the two reflected a
circadian rhythm to cortisol secretion ; or
d) a group which is more sensitive to the 'pretreatment experience ' whereas by
7 to 9 hours their corti sol concentrations had returned to values more
representative of their true baseline level s .
These possibil ities will be considered in turn:
a) Changing baseline It is possible that for this group of animals the pretreatment cortisol concentrations
represented their genuine baseline, but that somehow the subsequent stressor adjusted
their cortisol basel ine to a lower level. This implies that exposure to noxious and/or
novel stressors changes cortisol baselines. However, there is no evidence for stressors
changing baseline cortisol concentrations once the stressor is absent. Most studies report
the response to stressors , and not data on base lines per se. There is large variation
between individual s in that response. There is evidence that the response to stressors
may be affected by many factors, including previous experience. In the case of repeated
stressors the response is usual ly the same regardless of whether it is the "first or the
umpteenth stressor in a series" (Sapolsky, 1992). However in some instances facilitation
or inhibition of the adrenocortical response occurs, the balance of which reflects the
timjng and type of the repeated stressors (for review see Sapolsky, 1 992).
There were on ly two calves (3%) where the corti sol levels at 7 -9 h were significantly
greater than their respective pretreatment value. Both these cal ves had aberrant
responses and both were exc luded from the study as outliers (see Fig B . 1 ) . One of the
calves subsequently died. The continued high corti sol concentrations for these two
calves suggests that they were experiencing a stressor throughout the period of
observation. This effect could have resulted from a combination of the treatment and a
pre-existing stressor which did not manifest as a change in cortisol concentrations at the
pretreatment period, but with treatment constituted a major stressor on the body.
b) Refractory period to cortisol secretion It is possible that for those 28% of calves, their pretreatment value is their true baseline,
and the decrease in concentrations after six hours reflects a temporary refractory period

Chapter 2: Critique of analyses 28
to cortisol secretion. However, there appears to be no evidence of this and the activity of
the HPA-axis is under rapid negative feedback regulation . There may however, be
differences in the magnitude of the stress response over the circadian cycle (see
Sapolsky, 1 992) .
c) Circadian rhythm It is possible that for those 28% of calves, both the pretreatment and the post-treatment
cortisol values were at baseline levels, and that the difference between the two reflected
a circadian rhythm. There appears to be a circadian rhythmic ity to glucocorticoid
release, with glucocorticoid concentrations peaking after waking and being at a nadir
around the onset of s leep (in Sapolsky, 1992) . In cattle, corti sol concentrations are
usual ly highest in the early morning (MacDiarmid and Cooper, 1982) and have been
reported to vary by as much as 30ng/ml in the day (Fulkerson et al. , 1 980). However,
one should be cautious about comparing magnitudes between studies as differences in
the absolute values may be due to differences in the corti sol assay or the experimental
des ign . There was no apparent circadian rhythm in the cortisol concentrations of the
Control calves, but this may be due to l imitations of the experimental design or data
variation which might obscure subtle osci l lations in cortisol concentrations. The
circadi an rhythm may be better detected wi th remote sampl ing and a different
experimental design .
d) Sensitive to pretreatment stress It i s possible that this group of animals was more sensitive to the 'pretreatment
experience' and that by 7 to 9 hours their cortisol concentrations had returned to values
more representative of their true baseline levels . At the time of pretreatment sampling,
animals had been recently subjected to novel experiences . These novel stressors
included being mustered and brought into the yards, restrained by strangers as numbers
were painted onto their backs, held overnight in cattle yards and fasted. In addition , the
random al location of calves into mobs of 1 2 wil l have resulted in novel social groupings
and the di sruption of the normal peer associations and h ierarchies, to which cattle are
particularly sensitive (Hinch, 1 994). It i s possible that these pretreatment experiences
may have affected some calves so severely that they were stil l stressed at the time of the
pretreatment sample.
Cortisol concentrations appeared to plateau at low levels 7 -9 h after treatment. By the
time these last samples (7-9h) were taken there had been a uniform exposure to defined
procedures over the 9 hours. Therefore there may be less variation within treatments at
7-9 hours than at the pretreatment time. This suggests that values at 7-9h may better
represent baseline than those at the pretreatment time. The variation at 7-9h may l argely
reflect random variation in baselines whereas the variation at the pretreatment t ime may

Chapter 2: Critique of analyses 29
largely reflect a systematic error of variation in response to recent stressors . Thi s
suggests that the mean post-treatment value between 7 and 9h could b e used as the
reference point instead of the pretreatment value .
In the majority of cases the cortisol concentrations before and after a stressor i s over are
simi lar. In this study , there was a greater number of post-treatment samples than
pretreatment samples which gives greater confidence in the post-treatment sample than
in the pre-treatment sample . It seems l i ke ly that for these 2 8 % of calves the
pretreatment value indicated a stressed state and that the post-treatment value is a better
reflection of the baseline. There appears to be no evidence that corti sol baselines are
ei ther temporari ly or permanently affected by stress . Therefore, it wi l l be assumed that
the cmtisol concentrations have returned to basal levels .
It would be preferable to c larify i f the post-treatment value was the same as the
pretreatment value. This could be ascertained by taking a series of samples before and
after the experi ment, for example for a 24h period before and a 24h period after. In
addition , this would also determine the presence and magni tude of any diurnal rhythm.
However, in the current study, this was not possible for practical reasons .
2.2.5 Can post-treatment values be used as reference val ues?
The meri t of the pretreatment, versus the post-treatment, reference point has been
discussed. In the current study it seems l ikely that the post-treatment value is a more
true representation of the baseline. Can the post-treatment value be used as a reference
point? This begs the question : Is it valid to use a post-treatment sample as the
pretreatment sample? The pretreatment value is understood to be representative of the
state of the animal before treatment, whereas the post-treatment animal will always be
post treatment , and is presumably modified in some way by the experimental
experience. Therefore, because we can never be sure of what effect that experience wil l
be, i t i s not possible to exclude or account for such changes. Thus to use post-treatment
samples to approximate more accurately to an unstressed pretreatment value appears
incorrect . However, when we reference data to the pretreatment sample, and evaluate
the changes from that pretreatment state, we presume, and it is l ikely, that there will be
a time at which the corti sol concentrations wi l l or do return to the pretreatment value
(Melior et al. , 2000). This implies that the post-treatment sample and the pretreatment
sample could have the same value.
The concern is that by using the pretreatment sample as that which allows for individual
vari ation , it may not be as independent of stress as assumed, and is therefore
introducing variabi l i ty or l imits to the analysis . By using the mean of the last three
samples (7 -9h), that is , after all animals have been exposed to nine hours of handling,
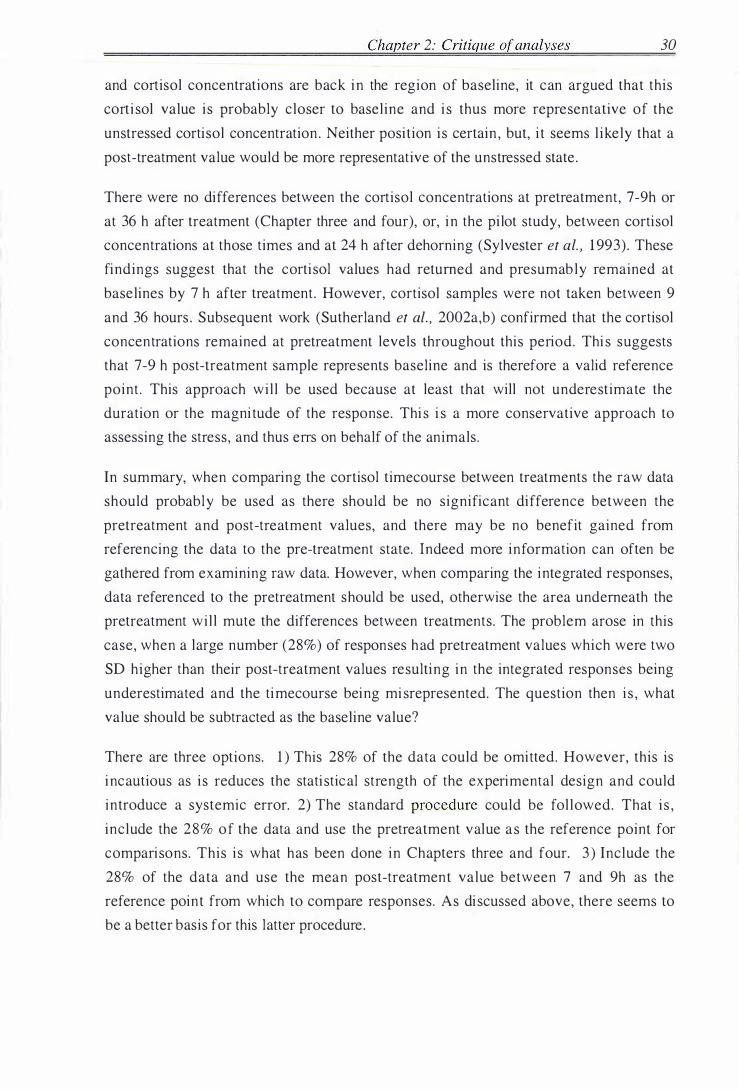
Chapter 2: Critique ofanalyses 30
and cortisol concentrations are back in the region of baseline, it can argued that this
corti sol value is probably closer to baseline and i s thus more representative of the
unstressed cortisol concentration . Neither position is certain , but, i t seems l ikely that a
post-treatment value would be more representative of the unstressed state .
There were no differences between the cortisol concentrations at pretreatment, 7-9h or
at 36 h after treatment (Chapter three and four), or, in the pi lot study, between cortisol
concentrations at those times and at 24 h after dehorning (Sylvester et al. , 1 993) . These
findings suggest that the cortisol values had returned and presumably remained at
baselines by 7 h after treatment. However, cortisol samples were not taken between 9
and 36 hours . Subsequent work (Sutherland et al. , 2002a,b) confirmed that the cortisol
concentrations remained at pretreatment levels throughout this period. Thi s suggests
that 7-9 h post-treatment sample represents baseline and is therefore a valid reference
point . This approach wi l l be used because at least that will not underestimate the
duration or the magni tude of the response. Thi s i s a more conservative approach to
assessing the stress, and thus errs on behalf of the animals.
In summary, when comparing the cortisol timecourse between treatments the raw data
should probably be used as there should be no significant difference between the
pretreatment and post-treatment values, and there may be no benefit gained from
referencing the data to the pre-treatment state. Indeed more information can often be
gathered from examining raw data. However, when comparing the integrated responses,
data referenced to the pretreatment should be used, otherwise the area underneath the
pretreatment wi l l mute the differences between treatments. The problem arose in this
case, when a large number (28%) of responses had pretreatment values which were two
SD higher than their post-treatment values resulting in the integrated responses being
underestimated and the timecourse being mi srepresented. The question then i s , what
value should be subtracted as the baseline value?
There are three options. 1 ) This 28% of the data could be omitted. However, this is
incautious as i s reduces the stati stical strength of the experimental design and could
introduce a systemic error. 2) The standard procedure could be fol lowed. That i s ,
include the 28% of the data and use the pretreatment value as the reference point for
comparisons. This i s what has been done in Chapters three and four. 3 ) Include the
28% of the data and use the mean post-treatment value between 7 and 9h as the
reference point from which to compare responses. As di scussed above, there seems to
be a better basis for this latter procedure.

2.2.6 Aims
Chapter 2: Critique of analyses 31
The purposes of this chapter are to a) to examine the assumptions and l imitations
inherent in using raw, adjustedpre.tmt or adjustedpos t . tm t cortisol data; and b) to
determine whether resulting differences are statistical l y and biologically significant in
the context of real data sets. The aim here is to use some sample data to examine these
i ssues, not to discuss the response to the treatment per se. S uch a discussion is provided
in Chapter four.

Chapter 2: Critique of analyses
2.3 MATERIALS AND METHODS
32
The sample data (Table 2 . 1 ) , to which these transformations and analyses were applied
were taken from the experiment described in Chapter four. The data were from calves in
response to Scoop+Cautery (n= 1 0) , Scoop (n= 1 0), LA-Scoop (n=8) and LA-Control
(n=8) treatment . However, as the aim is to examine whether transformation of the data
changes the interpretation of the results, and not to di scuss the response to the treatment
per se, the data are labelled simply as data series " 5 " , " 3 " , "4" and "2" respectively . The
experimental design is not described here, save that b lood samples were taken at 0.66
(pretreatment) and 0.25 h before treatment, and at 0.25, 0 .5 , 1 , 1 .5 , 2, 2 .5 , 3 , 4, 5, 6, 7, 8,
9 and 36 h after treatment. The compari son between data series 5 and 3 , and data series
4 and 2 wil l be examined here. To ascertain if there were any differences between these
data series, stati stical analyses were conducted on the timecourse and the integral of the
cortisol responses after treatment. In addition to ascertain if there are any differences
according to whether the data is transformed, these analyses were conducted using
either 1) raw, 2) adjustedpre.tmt or 3) adjustedpost.tmt data.
2.3.1 Data transformations
The data used in the analyses were transformed in the fol lowing three ways :
1 ) Raw data: No transformation .
2) Adjustedpre.tmt: The pretreatment value was subtracted from all values,
rendering the pretreatment as zero relative concentration .
3) Adjustedpost . tmt : The mean value of the three sample values taken at 7 , 8 and
9 hours after treatment was used as if it were the pretreatment value, and this
value was subtracted from al l other values, making both the pretreatment
and the mean of the post-treatment values zero relative concentration .
2.3.2 Statistical analyses
Statistical analyses were conducted on the timecourse and the integral of the corti sol
responses after treatment using either 1 ) raw, 2) adj ustedpre.tmt and 3) adjustedpost.tmt
data. Corti sol data are expressed as the mean ± the standard error of the mean (SEM).
The significance of the difference between the means was determined using a two-way
analysis of variance (ANOV A) with Fisher's probability of least significant differences
(PLSD). All statistical calculations were conducted using a standard stati stical computer
package (Statsview + Graphics, Version 2, Abacus Concepts Inc . , USA).

Timecourse ofthe cortisol response
Chapter 2: Critique of analyses 33
To calculate when the cortisol response to a treatment was complete, that is when the
corti sol concentrations returned to and remained at pretreatment levels, a factorial
ANOV A design was used. To calculate if there were any differences in the mean
timecourse of the cortisol response between treatments a repeated measures ANOV A
design was used.
Integrated cortisol response
Numerical integration was used to calculate the total cortisol response, hereafter called
the integrated cortisol response. The integrated cortisol response was defined as the area
under the cortisol curve and above a l ine drawn horizontall y through either, y=O,
y=pretreatment value or y=post-treatment value. This produced the integral of the raw,
adj ustedpre.tmt and adjustedpost . tmt data sets respectively. A factorial ANOV A was used
to determine the difference between the mean integrated cortisol responses of different
treatments.
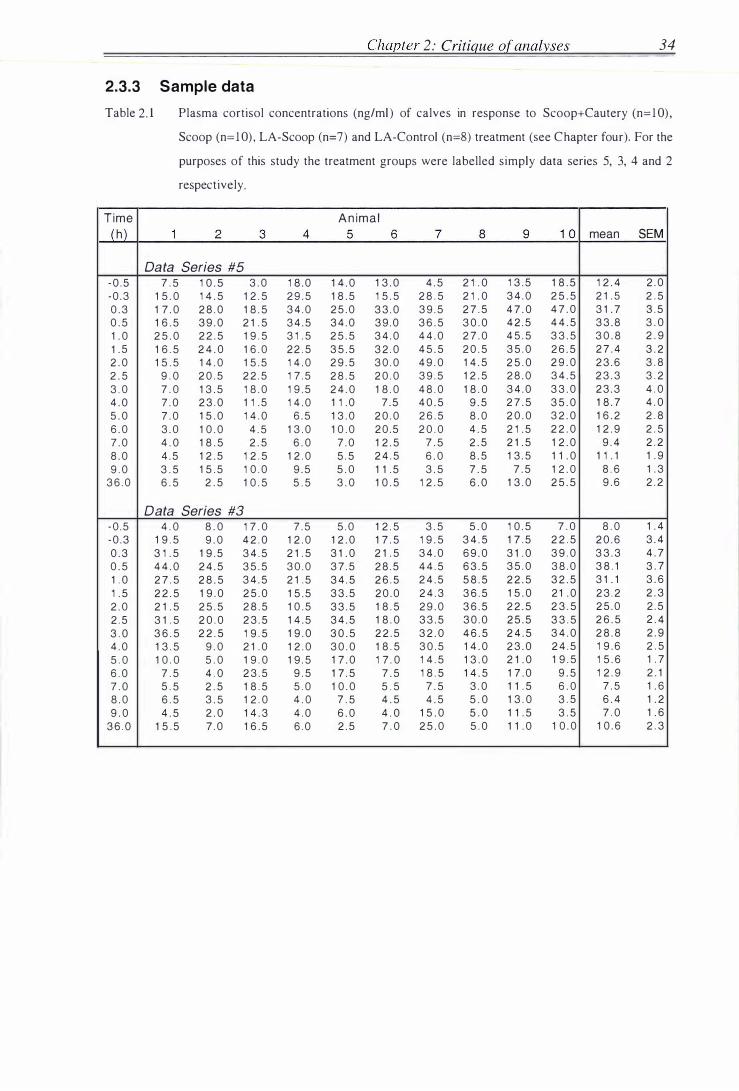
2.3.3 Sample data
Chapter 2: Critique of analyses 34
Table 2 . 1 Plasma cortisol concentrations (ng/ml ) of calves in response to Scoop+Cautery (n= l O) ,
Scoop (n= l O) , LA-Scoop (n=7) and LA-Control (n=8) treatment (see Chapter four). For the
purposes of this study the treatment groups were labelled simply data series 5, 3, 4 and 2
respectively.
Time A n i m a l
lhl 1 2 3 4 5 6 7 8 9 1 0 mean SEM
Da ta Series #5
- 0 . 5 7 . 5 1 0 . 5 3 . 0 1 8 . 0 1 4 . 0 1 3 . 0 4 . 5 2 1 . 0 1 3 . 5 1 8 . 5 1 2 . 4 2 . 0 - 0 . 3 1 5 . 0 1 4 . 5 1 2 . 5 2 9 . 5 1 8 . 5 1 5 . 5 2 8 . 5 2 1 . 0 3 4 . 0 2 5 . 5 2 1 . 5 2 . 5 0 . 3 1 7 . 0 2 8 . 0 1 8 . 5 3 4 . 0 2 5 . 0 3 3 . 0 3 9 . 5 2 7 . 5 4 7 . 0 4 7 . 0 3 1 . 7 3 . 5 0 . 5 1 6 . 5 3 9 . 0 2 1 . 5 3 4 . 5 3 4 . 0 3 9 . 0 3 6 . 5 3 0 . 0 4 2 . 5 4 4 . 5 3 3 . 8 3 . 0 1 . 0 2 5 . 0 2 2 . 5 1 9 . 5 3 1 . 5 2 5 . 5 3 4 . 0 4 4 . 0 2 7 . 0 4 5 . 5 3 3 . 5 3 0 . 8 2 . 9 1 . 5 1 6 . 5 2 4 . 0 1 6 . 0 2 2 . 5 3 5 . 5 3 2 . 0 4 5 . 5 2 0 . 5 3 5 . 0 2 6 . 5 2 7 . 4 3 . 2 2 . 0 1 5 . 5 1 4 . 0 1 5 . 5 1 4 . 0 2 9 . 5 3 0 . 0 4 9 . 0 1 4 . 5 2 5 . 0 2 9 . 0 2 3 . 6 3 . 8 2 . 5 9 . 0 2 0 . 5 2 2 . 5 1 7 . 5 2 8 . 5 2 0 . 0 3 9 . 5 1 2 . 5 2 8 . 0 3 4 . 5 2 3 . 3 3 . 2 3 . 0 7 . 0 1 3 . 5 1 8 . 0 1 9 . 5 2 4 . 0 1 8 . 0 4 8 . 0 1 8 . 0 3 4 . 0 3 3 . 0 2 3 . 3 4 . 0 4 . 0 7 . 0 2 3 . 0 1 1 . 5 1 4 . 0 1 1 . 0 7 . 5 4 0 . 5 9 . 5 2 7 . 5 3 5 . 0 1 8 . 7 4 . 0 5 . 0 7 . 0 1 5 . 0 1 4 . 0 6 . 5 1 3 . 0 2 0 . 0 2 6 . 5 8 . 0 2 0 . 0 3 2 . 0 1 6 . 2 2 . 8 6 . 0 3 . 0 1 0 . 0 4 . 5 1 3 . 0 1 0 . 0 2 0 . 5 2 0 . 0 4 . 5 2 1 . 5 2 2 . 0 1 2 . 9 2 . 5 7 . 0 4 . 0 1 8 . 5 2 . 5 6 . 0 7 . 0 1 2 . 5 7 . 5 2 . 5 2 1 . 5 1 2 . 0 9 . 4 2 . 2 8 . 0 4 . 5 1 2 . 5 1 2 . 5 1 2 . 0 5 . 5 2 4 . 5 6 . 0 8 . 5 1 3 . 5 1 1 . 0 1 1 . 1 1 . 9 9 . 0 3 . 5 1 5 . 5 1 0 . 0 9 . 5 5 . 0 1 1 . 5 3 . 5 7 . 5 7 . 5 1 2 . 0 8 . 6 1 . 3
3 6 . 0 6 . 5 2 . 5 1 0 . 5 5 . 5 3 . 0 1 0 . 5 1 2 . 5 6 . 0 1 3 . 0 2 5 . 5 9 . 6 2 . 2
Data Series #3
- 0 . 5 4 . 0 8 . 0 1 7 . 0 7 . 5 5 . 0 1 2 . 5 3 . 5 5 . 0 1 0 . 5 7 . 0 8 . 0 1 . 4 - 0 . 3 1 9 . 5 9 . 0 4 2 . 0 1 2 . 0 1 2 . 0 1 7 . 5 1 9 . 5 3 4 . 5 1 7 . 5 2 2 . 5 2 0 . 6 3 . 4 0 . 3 3 1 . 5 1 9 . 5 3 4 . 5 2 1 . 5 3 1 . 0 2 1 . 5 3 4 . 0 6 9 . 0 3 1 . 0 3 9 . 0 3 3 . 3 4 . 7 0 . 5 4 4 . 0 2 4 . 5 3 5 . 5 3 0 . 0 3 7 . 5 2 8 . 5 4 4 . 5 6 3 . 5 3 5 . 0 3 8 . 0 3 8 . 1 3 . 7 1 . 0 2 7 . 5 2 8 . 5 3 4 . 5 2 1 . 5 3 4 . 5 2 6 . 5 2 4 . 5 5 8 . 5 2 2 . 5 3 2 . 5 3 1 . 1 3 . 6 1 . 5 2 2 . 5 1 9 . 0 2 5 . 0 1 5 . 5 3 3 . 5 2 0 . 0 2 4 . 3 3 6 . 5 1 5 . 0 2 1 . 0 2 3 . 2 2 . 3 2 . 0 2 1 . 5 2 5 . 5 2 8 . 5 1 0 . 5 3 3 . 5 1 8 . 5 2 9 . 0 3 6 . 5 2 2 . 5 2 3 . 5 2 5 . 0 2 . 5 2 . 5 3 1 . 5 2 0 . 0 2 3 . 5 1 4 . 5 3 4 . 5 1 8 . 0 3 3 . 5 3 0 . 0 2 5 . 5 3 3 . 5 2 6 . 5 2 . 4 3 . 0 3 6 . 5 2 2 . 5 1 9 . 5 1 9 . 0 3 0 . 5 2 2 . 5 3 2 . 0 4 6 . 5 2 4 . 5 3 4 . 0 2 8 . 8 2 . 9 4 . 0 1 3 . 5 9 . 0 2 1 . 0 1 2 . 0 3 0 . 0 1 8 . 5 3 0 . 5 1 4 . 0 2 3 . 0 2 4 . 5 1 9 . 6 2 . 5 5 . 0 1 0 . 0 5 . 0 1 9 . 0 1 9 . 5 1 7 . 0 1 7 . 0 1 4 . 5 1 3 . 0 2 1 . 0 1 9 . 5 1 5 . 6 1 . 7 6 . 0 7 . 5 4 . 0 2 3 . 5 9 . 5 1 7 . 5 7 . 5 1 8 . 5 1 4 . 5 1 7 . 0 9 . 5 1 2 . 9 2 . 1 7 . 0 5 . 5 2 . 5 1 8 . 5 5 . 0 1 0 . 0 5 . 5 7 . 5 3 . 0 1 1 . 5 6 . 0 7 . 5 1 . 6 8 . 0 6 . 5 3 . 5 1 2 . 0 4 . 0 7 . 5 4 . 5 4 . 5 5 . 0 1 3 . 0 3 . 5 6 . 4 1 . 2 9 . 0 4 . 5 2 . 0 1 4 . 3 4 . 0 6 . 0 4 . 0 1 5 . 0 5 . 0 1 1 . 5 3 . 5 7 . 0 1 . 6
3 6 . 0 1 5 . 5 7 . 0 1 6 . 5 6 . 0 2 . 5 7 . 0 2 5 . 0 5 . 0 1 1 . 0 1 0 . 0 1 0 . 6 2 . 3

Table 2 . 1 cont.,
T i m e
(h) 1 2
Da ta Series #4
- 0 . 5 8 . 0 5 . 5 - 0 . 3 1 1 . 0 3 1 . 5 0 . 3 1 5 . 0 2 7 . 5 0 . 5 1 2 . 0 2 6 . 5 1 . 0 6 . 5 1 2 . 5 1 . 5 8 . 0 9 . 5 2 . 0 1 0 . 5 8 . 5 2 . 5 8 . 0 8 . 0 3 . 0 1 6 . 5 7 . 0 4 . 0 2 4 . 5 1 5 . 0 5 . 0 3 2 . 5 2 1 . 0 6 . 0 2 5 . 0 1 2 . 0 7 . 0 1 3 . 0 6 . 0 8 . 0 1 0 . 5 4 . 0 9 . 0 7 . 5 4 . 0
3 6 . 0 6 . 0 1 6 . 5
3
9 . 0 1 5 . 5 2 1 . 0 1 7 . 5 1 4 . 0 1 0 . 0
5 . 5 5 . 5 3 . 5
1 4 . 0 1 9 . 0 1 2 . 0
8 . 0 3 . 5 5 . 0 2 . 0
Data Series #2
- 0 . 5 1 0 . 5 * 7 . 0 - 0 . 3 1 7 . 0 1 3 . 0 0 . 3 1 5 . 5 7 . 0 0 . 5 1 9 . 0 3 . 5 1 . 0 1 1 . 5 6 . 0 1 . 5 7 . 0 6 . 0 2 . 0 9 . 5 4 . 5 2 . 5 1 4 . 0 7 . 0 3 . 0 1 3 . 0 1 3 . 0 4 . 0 5 . 0 3 . 0 5 . 0 7 . 5 1 0 . 0 6 . 0 3 . 0 7 . 8 7 . 0 2 . 5 5 . 5 8 . 0 4 . 0 8 . 5 9 . 0 4 . 5 5 . 0
3 6 . 0 2 . 0 4 . 0
4
*
4 . 5 8 . 5 9 . 5 9 . 5 4 . 5 4 . 5 5 . 5 7 . 5 8 . 5 7 . 0 7 . 5 4 . 0 4 . 0 3 . 0 5 . 0 3 . 0
Chapter 2: Critique o[analyses
A n i m a l
5 6 7 8 9 1 0
1 0 . 5 1 6 . 0 8 . 5 * 1 5 . 5 n / a 1 6 . 0 3 4 . 0 1 8 . 0 1 5 . 5 1 1 . 0 5 1 . 5 2 6 . 5 23 . 5 1 2 . 5 2 5 . 5 1 9 . 0 1 8 . 5 1 0 . 5 1 0 . 0 1 1 . 0 30 . 0 1 2 . 0 1 2 . 5 2 4 . 3 24 . 3
9 . 5 2 2 . 5 1 0 . 0 1 8 . 5 1 0 . 5 2 9 . 0 1 3 . 5 1 4 . 5 1 0 . 0 2 3 . 0 2 2 . 0 1 7 . 5 2 0 . 5 1 1 . 0 2 7 . 0 1 4 . 5 1 7 . 0 1 0 . 0 3 0 . 0 1 6 . 0 1 6 . 5 9 . 0 3 9 . 5 7 . 0
7 . 5 1 2 . 0 1 7 . 5 8 . 5 1 0 . 0 1 2 . 5 1 0 . 5 5 . 5
4 . 0 6 . 5 8 . 5 3 . 0 7 . 0 2 2 . 5 1 8 . 5 3 . 0
2 . 5 9 . 0 6 . 5 * 3 . 5 8 . 5 1 4 . 5 2 5 . 0 2 2 . 0 1 8 . 0 2 2 . 0 1 7 . 0 2 2 . 5 1 9 . 0 1 1 . 5 1 5 . 5 1 4 . 0 1 5 . 5 2 2 . 0 9 . 5 1 4 . 0
4 . 5 7 . 5 1 2 . 5 8 . 0 1 3 . 5 3 . 5 6 . 0 8 . 5 8 . 0 2 4 . 3 5 . 5 4 . 5 1 2 . 5 6 . 5 6 . 5 7 . 5 4 . 0 1 1 . 5 6 . 5 8 . 0 4 . 0 8 . 5 8 . 5 1 1 . 5 8 . 0 2 . 0 3 . 0 9 . 1 1 0 . 5 3 . 5 2 . 5 2 . 0 4 . 0 4 . 5 5 . 5 2 . 5 2 . 0 1 2 . 5 1 5 . 5 1 7 . 0 1 . 5 6 . 0 6 . 5 4 . 0 7 . 0 3 . 5 5 . 5 1 1 . 5 9 . 0 8 . 0 2 . 5 3 . 0 5 . 0 4 . 5 7 . 0 1 . 5 4 . 0 8 . 5 2 . 0 2 . 0
* calves which were excluded from the study as outliers (see appendix B) .
35
mean SEM
1 0 . 4 1 . 6 2 0 . 2 3 . 6 2 5 . 1 5 . 3 1 8 . 8 2 . 3 1 3 . 5 3 . 1 1 4 . 4 2 . 8 1 2 . 1 2 . 5 1 2 . 7 3 . 2 1 4 . 2 3 . 1 1 8 . 1 2 . 4 2 0 . 8 3 . 2 1 7 . 3 4 . 7 1 0 . 4 1 . 6
8 . 1 1 . 5 5 . 5 0 . 8
1 0 . 8 3 . 4
6 . 5 1 . 1 1 7 . 5 2 . 1 1 4 . 7 1 . 9 1 3 . 4 2 . 2
8 . 5 1 . 3 8 . 5 2 . 5 6 . 9 1 . 0 8 . 3 1 . 2 9 . 4 1 . 1 5 . 4 1 . 2 5 . 4 1 . 0 8 . 0 2 . 3 4 . 6 0 . 7 6 . 6 1 . 2 4 . 6 0 . 5 3 . 4 0 . 9

2.4 RESULTS
Chapter 2: Critique of analyses
2.4.1 Cortisol timecourse analyses
36
The mean cortisol timecourse using adjustedpost.tmt data compared to the adjustedpre.tmt
data was similar, but, the mean responses of the adjustedpost.tmt data were i ncreased
throughout by the ari thmetic difference between the pretreatment and post-treatment
values . This arithmetic difference ranged from 2.7 ng/ml for data series "5 " , to 1 ng/ml
for data series "3 " (see Table 2.2) . For all data series the SEMs of the adjustedpost.tmt
data were smal ler than those for the adj ustedpre.tmt data (Table 2.2), especially when the
response was over, that is when values returned to baseline (Fig 2 .3 , Fig 2 .4).
There were some minor discrepancies in the compari sons between treatments of the
timecourse according to how the data were transformed (P<0.05) . Comparisons between
data series "5 " and "3" using raw data indicated that there were no differences, whereas
using the adjustedpre.tmt data indicated that cortisol levels were significantly different at
0 .5 , 2 . 5 and 3h after treatment. Compari sons using the adjustedpost.tmt data indicated
that levels were significantly different at 0.5 and 3h after treatment (Fig 2 .3) .
Compari sons between data series "4" and "2" us ing raw data indicated that corti sol
levels were significantly different at 0.5 , 4 to 7 and at 36 h after treatment, whereas
using the adjustedpre.tmt data indicated that cortisol levels were significantly different at
5 h after treatment only . Compari sons using the adjustedpost.tmt data indicated that
levels were significantly different at 4 to 6 h after treatment (P<0.05) (Fig 2.4).
Table 2 .2 Statistics of the pretreatment and post-treatment cortisol reference values.
pre.tmt post.tmt differences between pre.tmt and post.tmt data
Data series mean SEM CV mean SEM CV !'!. mean I'!. SEM !'!. CV
(ng/ml) (ng/ml) (%) (ng/ml) (ng/ml) (%) (ng/ml ) (ng/ml) (%) a b c d e f g=a-d h=e/b- 1 i=c-f
series "5" 1 2 .4 2 .0 58 9 .7 1 .5 45 -2 .7 -25% - 1 3
series "3" 8 .0 1 .4 54 7 .0 1 .3 56 - 1 .0 -7% +2
series "4" 10.4 1 .6 38 8 .0 0.9 36 -2.4 -44% -2
series "2" 6.5 l . l 43 5 .3 0.6 33 - 1 .2 -46% - 10
letters i ndicate how columns are calculated. CV = SD/m. Where: CV=coefficient of variation; SD=standard deviation; m=mean; !'!.=difference.

Chapter 2: Critique of analyses 37
2.4.2 Integrated response analyses
Regardless of the transformation employed, the mean integrated cortisol response (0-9h)
of data series "5" was not significantly different from that of data series "3" (Table 2 .3 ;) .
However, the coefficients of variation were different. The coefficients of variation were
greatest with adjustedpre.tmt data, intermediate with adj ustedpost .tmt data and smallest
using raw data. It appears that the using adjustedpost.tmt data " improved" the coefficients
of variation of adjustedpre.tmt data by about 1 5% . A similar trend was apparent between
data sets "4" and " 2 " (Table 2 . 3 ;) , although the order of the " improvement" i n the
coefficients of variation was about 40%.
Table 2 . 3
Data series
data "5"
data "3 "
data "4"
data "2"
Integrated responses (ng . h r/ml) of data series " 5 " , " 3 " , "4" and "2" us ing raw,
adjustedpre.tmt and adjustedpost.tmt data (mean ± SEM).
Integral Integral Integral Intgl under ratio of Intgl * Raw adjpre.tmt adjpost.tmt pre.tmt** under pre.tmt
(ng.h/ml) to area above
m ±..SEM CV m ±..SEM CV m ±..SEM CV (ng.h/ml) (%) (ng .h/ml) (%) (ng.h/ml) (%)
a b c d e=dlb
l79Y ± 2 1 35 S lY ± 20 79 87Y ± 1 9 65 98 1 .2
l 75Y ± 14 23 l 05Y ± 17 50 l l 0Y ± l 3 34 70 0.6
l 39XY ± l4 24 52XY ± 14 70 6SXY ± 6 23 87 1 .7
nx ± 7 27 22X ± 5 64 25X ± 3 32 5 1 2 .3
* * the mtegral (Intgl) of the cortisol response below the pretreatment value and above y=O ng/ml for the period 0-9h .
* the ratio of the integral of the cortisol response under the pretreatment value to that above the pretreatment value for the period 0-9h (see Fig 2 . 1 ) .
The different superscripts, x and y , within columns indicate statistically significant differences between treatments (P<0.05) .

40
a ) 30
0 20 en '€ 0 u
b ) --
..§ Cl) E ...... c: (]) E (]) '"" (.)
. s 0 . � ...... '"" 0 u
c )
-
E --Cl) c: ..__. ...... c: (]) E (]) '"" (.)
. s 0
en . .... t 0 u
10
40
30
20
10
0
40
30
20
10
0
( 10)
e
e
( 1 ) 0
Chapter 2: Critique of analyses
Unadj usted data
Data series "3 "
-<>- Data series " 5 "
A dj usted to pretreatment
Data series "3 "
-<>- Data series " 5"
Adj usted to post-treatment
Data series "3" (adj post.tmt)
e - - - - + - · · - Data series "3" (adj pre.tmt)
-<>- Data series "5" (adj post .tmt)
. . . ....... . . . . ...... Data series " 5 " (adj pre.tmt)
.. .. - - - · ·-t ·· . .. ..... .... . . .. . . .. . . . . . . . .. �
2 3 4 5 6 7 8 9 Fig 2.3 Comparison of the cortisol timecourse (mean ± SEM) between data series "3"
(n=l O) and " 5 " (n=lO) , using a) raw, b) adjustedpre.tmt and c) adjusted-
post.tmt data. e = data series "3 " is significantly different from data series "5" .
38

40
a ) 30
-E --b!) c --
0 20 -� ....... .... 0 u
10
40
b) - 30
E --b!) c --....... c 20 Q) E Q) .... u c
0 10 V)
·� .... 0 u
0
40
c )
- 30
] b!) c -...... 5 20 E Q) .... u
.S 0 V) "E 0 u
10
b
Chapter 2: Critique o{analyses
U nadj usted data
Data series "4"
--o- Data series "2"
b
Adj usted to pretreatment
----o- Data series "4"
--o- Data series "2"
b
Adj usted to post-treatment
- - - - -+ - - - -
• • • • • • • • •O• • • • • • • • •
b
Data series "4" (adj post.tmt)
Data series "4" (adj pre.tmt)
Data series "2" (adj post.tmt)
Data series " 2" (ad j pre.tmt)
(1 0) -f--,.----,,---r--.--...--r---,----r--.---,.-...l..\ ( 1 )
Fig 2.4 Comparison of the cortisol timecourse (mean ± SEM) between data series "4" (n=7) and data series "2" (n=8) using a) raw, b) adjustedpre.tmt and c) adjusted-
post.tmt data. b = data series "4" is significantly different from data series "2 " .
39

2.5 DISCUSSION
Chapter 2: Critique of analyses 40
In this chapter three methods of comparing corti sol responses have been examined,
namely using raw data, adjustedpre.tmt and adjustedpre.tmt data. The use of the post-
treatment value, as an alternative to the commonly used pretreatment reference, was
proposed. The post-treatment value was used as the reference point for comparisons
because there can be unknown factors acting which cause a higher pretreatment value
and therefore using adjustedpre.tmt data might artifactual ly reduce the magni tude of the
response compared to using raw data. The raw data may be used but it is assumed that
differences in i ndi vidual basel ines , by i ncreasing the vari ance of the mean
adjustedpre.tmt data, will mute the difference between groups. Thi s did not appear to be
the case for compari sons of the timecourse, but i s a problem when comparing the
integral of the responses (see 2 .2 .3) . If there are large differences in baselines then
compari sons using raw data are not recommended. If there is a large variance in the
mean pretreatment value then the post-treatment value may be used as the reference
point . Ideally , the post-treatment should be the same as the pretreatment, and the
relationship between groups should be simi lar whether using raw or adjusted data.
The use of the post-treatment mean , as opposed to the pretreatment mean , as the
reference point from which to compare cortisol responses resulted in no change in the
stati sti cal differences between-treatments when comparing the integral of the responses
and few differences when comparing the timecourse of the responses. In some cases the
number of time periods for which significant differences between treatments were
observed increased. In addition, using adjustedpost . tmt data tended to decrease the
variance in the mean integrated cortisol responses and to a lesser extent the variance of
the timecourses . Furthermore, the reduction in the SEMs using the post-treatment
adj ustment increased the duration of significant differences when there exi sted a
separation between comparative groups on the timecourse. However, in some cases,
despite the improvement in the SEMs, the convergence of the mean values (as a result
of differences in the pretreatment mean) reduced the significance of the differences. It i s
important to note that the post-treatment adjustment made the relationships between
groups more s imi lar to that observed with the raw data. However, no matter which
baseline adjustment was made, or whether the unadjusted (raw) data was used, there
were no differences in the biological interpretation of the data.
In every case using adjustedpost . tmt data, the mean cortisol timecourse increased
compared to that using adjustedpre.tmt data, although the increase was not biologically
significant (range : l -2 .7ng/ml) . The parsimonious explanations would be that most of
the animals were already stressed to some degree by the time the first sample was taken,
presumably from the novelty of the experimental s ituation, or that this small increase

Chapter 2: Critique of analyses 41
could reflect a circadian rhythm. Cortisol levels peak in the morning j ust after waking
and fal l to a nadir during s leep in humans (Sapolsky, 1 992), whereas in cattle the same
relationship i s observed (MacDiarmid and Cooper, 1 982) but the patterns of sleep are
different (Kilgour and Dalton, 1 984). Alternatively, this decrease in the post-treatment
period could reflect a refractory period to cortisol secretion due to the previous large
cortisol surge. However, this interpretation is unlikely as previous studies have shown
that cortisol surges can be elicited in succession with l i ttle effect on the subsequent
responses (Melior and Murray, 1989b; Sapolsky, 1 992).
Interestingly, the vari ance of the pretreatment and post-treatment samples of the raw
data were similar. It would appear that the pretreatment variance was primaril y due to
systematic variation in basel ine values (i .e . 28% starting two SD greater than the mean
value) whereas the post-treatment variance was primari l y due to random variation.
Relatively speaking the variation at the beginning and the end were similar and the
responses were uniform. In general, it appeared that there was greater variation in the
response to the treatment (stressor) than in the baselines. It i s a common observation
that there is large inter-animal variation in the response to stressors (Moberg and
Mench, 2000).
The fact that there were no differences in interpretation whether one used the
adjustedpre.tmt or adj ustedpost.tmt data suggests that the pretreatment value was not
sufficiently different from the post treatment to be detected unambiguously given the
data variance, or that the difference between the pretreatment and post-treatment values
was compensated across the groups. In addition , the simi lari ty in the analyses gives
confidence that the data can be analysed using either the pretreatment or post-treatment
reference point.
The experimental design, including the use of control groups, even di stribution of
groups across days, mobs and time of day and the method of blood sampling and
handling was appropriate. Presumably the sample size of 10 protected the mean data
from being unduly influenced by random events. This analysis has demonstrated that
our methodology was sufficiently robust to account for systematic or random variation.
In this study, there appeared to be no advantage in using the post-treatment value as a
reference point for comparing cortisol responses, therefore, for the remainder of the
thesi s the pretreatment value has been used. It is possible that under some
circumstances, the post-treatment values may more accurately represent baseline than
do the pretreatment values. This conundrum can only be resolved by addit ional
sampl ing before and after treatment , idea l ly for 24 hours in e ach period.

Chapter 3: Dehorning methods 42
3 THE ACUTE C ORTISOL RESPONSES OF CALVES
FOLLOWING FOUR METHODS OF DEHORNING
3.0 ABSTRACT
Dehorn ing of cattle is a routine husbandry practice , but, there has been no
comprehensive research to assess the distress associated with thi s procedure. Changes in
plasma cortisol concentrations were used to assess the pain-induced di stress in Friesian
calves (six-months old, about 1 30 kg, n=57) during the first 9 hours and at 36 h after
amputation dehorning using different tool s (scoop, saw, gui l lotine shears or
embryotomy wire) , after control handl ing and bloodsampl ing and after an
adrenocorticotropic hormone (ACTH) bolus ( iv . 0 .28 j.lg/kg) . Calves were separated
from herds at pasture and kept overnight in cattle yards with access to water but not
food. On the day of the study cal ves were studied in mobs of 12 with equal
representation of treatments in the mob. Blood was taken by venipuncture from either
jugular vein while calves were held against the wal l s of the pen . Treatment was
conducted in a cattle race. Amputation dehorning elicited a marked biphasic cortisol
response that lasted for about six hours . Dehorning elicited simi lar (P>0.05) cortisol
responses irrespective of the tool employed, although there i s a suggestion that the
depth of the wound may affect the level of di stress. The cortisol response to Control
handling and bloodsampling lasted 1 .5 h and was significantly less in magnitude ,
duration and integral than that after dehorning (P<0.05) . ACTH injection elicited a
plateauing of high corti sol concentrations which decayed exponentially to pretreatment
levels after 2 . 5 h . The plateauing of high cortisol concentrations indicates maximal
cortisol secretion of the adrenal gland. The simi larity in the first hour, of the responses
after dehorning and ACTH, suggests that dehorning is very di stressing. These results
suggest that amputation dehorning is extremely noxious. Further work should be
conducted to explore avenues to alleviate this pain-induced di stress.
3.1 INTRODUCTION
The dehorning of cattle is a routine husbandry practice performed to reduce injury to
stockhandlers and stock, to reduce economic losses through carcass bruising and hide
damage (Meischke et al. , 1 974) and to improve cattle husbandry (Anon , 1974; Ernst,
1973) . Whilst dehorning is performed for the welfare of cattle it i s itself a welfare issue ,
because i t involves ti ssue damage and is presumably a painful and noxious experience.
However, at the time this work was done little research h ad been conducted on the
distress caused by dehorning and how this may affect the welfare of cattle.

Chapter 3: Dehorning methods 43
Cattle may be dehorned at any age according to husbandry systems . At the time this
study was conducted i t was an offence to dehorn cattle over the age of 20 months unless
the operation was conducted under anaesthesia of sufficient power to prevent the animal
from feeling pain (section 3y Animals Protection Act, 1 960) . In New Zealand, dairy
cattle are usually dehorned within a few weeks of birth or at weaning, and beef cattle
are usually dehorned at about six months when a series of procedures such as weaning,
castration and ear tagging are performed (Anon, 1 974 ). Al l methods of dehorning
involve either destruction or removal of the horn-forming cel ls (germinal tissue) and
their blood vasculature (Oehme, 1974). Caustic chemicals or cautery are used to disbud
young cal ves with minimal horn development, and surgical amputation is used to
dehorn cattle older than three months (Owen, 1 984). The caustic chemicals used to
di sbud young calves include caustic paste (potassium hydroxide) and calcium chloride
injection. The chemical is applied to the emerging horn bud within one week of birth,
and acts by con·oding and thereby destroying the horn bud germinal ti ssue and its blood
supply (Owen, 1 984). In cautery di sbudding a hot circular-shaped iron is placed over
the horn and cauterizes the tissue at the base of the horn bud. This method may be used
on calves aged one to eight weeks (Owen , 1 984), after which time the horn bud is
usually too big to allow the effective use of the cautery iron . With surgical amputation,
the whole of the horn including the adjacent germinal tissue is removed. The germinal
tissue has a vascular supply and is innervated. The tools used to amputate the horn
include the scoop dehorner (also known as scallop-, cup-, gouge- or Barnes-dehorner),
guil lotine shears, saw and embryotomy wire (wire saw). In some instances only the
di stal part of the horn is removed which is termed tipping, but this i s only a temporary
solution because the horn germinal ti ssue remains intact and the horn re-grows.
3.1 .1 Dehorning and production stud ies
Traditional management practices were developed and assessed for their practicality on
the basis of ease of use, compatibility with existing management practices , economics,
labour-costs, effects on production parameters and health and safety factors (Stafford
and Melior, 1 993) .
Horned cattle are more difficult to handle and transport, require more space in feedlot
troughs and during transport (in Winks et al. , 1 977), and have an increased incidence of
carcass bruising (Meischke et al. , 1 974) which occurs main ly during transport (Shaw
et al. , 1 976). For this reason it has been recommended that horned cattle be banned
from, or penned separately for, transport (Animal Welfare Advisory Committee, 1 994) .
The major incentive for complying with this recommendation might be economic rather
than concern for the welfare of the cattle .

Chapter 3: Dehorning methods 44
Dehorning improves the handling of cattle (Anon, 1974) , reduces flight di stances (K.J.
Stafford, personal communication) , decreases dominance at food troughs (Ernst, 1 973)
and reduces the feeding space and housing requirements for indoor-housed cattle ( in
Al lyn , 1 99 1 ; in Winks et al. , 1 977) . Conversely, dehorn ing contributes to the
transmi ssion of blood borne di seases (DiGiacomo et al. , 1 987) , decreases mi lk
production (Eckles and Anthony , 1 956) and decreases (Winks et al. , 1 977; Loxton
et al. , 1 982 ; Goonewardene and Hand, 199 1 ) or has no effect on (Laden et al. , 1 985 )
subsequent bodyweight gains.
Winks et al. ( 1 977) reported decreased bodyweight gains in mature Brahman crossbred
steers during the six months after dehorning which were not subsequently compensated
for by a similar decrease in carcass-bruise trim. They concluded that adult cattle should
not be dehorned. In a follow-up study , Loxton et al. ( 1 982) reported that dehorning
Brahman crossbred steers of various ages (4, 7 , 19, and 30 months old) led to decreased
bodyweight gains for six weeks after dehorning, after which there were no differences
between dehorned and horned cattle. They concluded that the age of dehorning was not
cri tical yet they recommended that cattle be dehorned at an early age for 'welfare'
reasons , but this was not explained. They also noted that the period of depressed
bodyweight gains coincided with the t ime taken for wounds to heal properly (4-6
weeks), and l ike Winks et al. ( 1 977) they attributed this production loss to a decreased
desire to graze. Goonewardene and Hand ( 1 99 1 ) reported significant decreases in the
bodyweight gains of adult steers for the three months after dehorning, which equated to
a loss of 5 kg per steer at sl aughter. They also noted that the changes in bodyweights
were related to feeding management systems where the difference between dehorned
and horned cattle was reduced by making more feed avai lable. It is possible that the
differences in the duration of depression of bodyweight gains after dehorning of six
months (Winks et al. , 1977), three months (Goonewardene and Hand, 1991 ) and six
weeks (Loxton et al. , 1982), were due to differences in experimental design features
such as age, breed, sex, or indeed feed avai labil ity . However, it is not possible to say
which , and this i l lustrates the difficulty of drawing conclusions from the results of
different studies .
Laden et al. ( 1 985) reported that cautery disbudding had no effect on the bodyweight
gains of 8-week-old cal ves four weeks after treatment. I t is possible that cautery
di sbudding, by contrast with amputation dehorning, had minimal or no effect on
bodyweight gains because the nature of the tissue insult, the resultant wound, and the
i nflammatory responses are different. On the other hand it is possible that had
bodyweights been measured more frequently than once after treatment, differences i n

Chapter 3: Dehorning methods 45
bodyweight gain s between the untreated and di sbudded cattle may have become
apparent .
3.1 .2 Dehorning and welfare studies
The effects of dehorning on performance does not necessari ly equate to welfare. Whilst
poor production may indicate poor welfare, the reverse, good performance indicates
good welfare, is not necessari ly true (Stamp-Dawkins, 1 980). Whilst dehorning is
performed for the welfare of cattle it also rai ses welfare i ssues, because it involves
ti ssue damage and is therefore presumably a painful and noxious experience. However,
the level of that di stress and the avenues for its al levi ation have not been thoroughly
examined. A variety of parameters have been used to assess the effects of husbandry
procedures on animals. Most commonly measured are those associated with activation
of the hypothalamic-pitui tary-adrenal axi s , usually assessed as changes in plasma
cortisol concentrations (e .g. Melior and Murray, 1 989a,b; Lester et al. , 199 1 a,b; Wood
et al. , 1991 ) .
At the time that this study began only the effect of cautery disbudding on plasma
corti sol concentrations had been clearly defined. In four- (Al lyn, 1 99 1 ) and eight-week
old calves (Laden et al. , 1985) cautery disbudding elicited a corti sol response that lasted
about two hours. This was significantly greater and one hour longer than that elicited by
control handling and blood sampling. In addition , there had been three other studies in
which the cortisol responses of cattle to amputation dehoming (Johnston and Buckland,
1976; Carter et al. , 1 983) or cautery disbudding (Boandle et al. , 1 989) were reported.
However, the infrequent sampling schedule in these studies means that interpretation of
the partial cortisol responses is equivocal .
Changes in behaviour are considered a valid indicator of stress (Stamp-Dawkins, 1980) ,
and have been reported fol lowing various noxious husbandry procedures including:
cautery disbudding (Taschke and Folsche, 1993 ; Morisse et al. , 1 995) , tail docking
(Petrie et al. , 1 995), castration and/or tail docking (Robertson et al., 1 994 ; Melior and
Murray, 1 989a) and branding (Lay et al. , 1 992a,b ). However, there have been no
rigourous studies in which behavioural indices have been used to examine the effect of
amputation dehorning on calf welfare. For this reason a study was conducted, as part of
this thesis , using changes in behaviour to assess the effects of dehoming (Chapter five) .
3.1 .3 Aims of study
The present study was designed to address the fol lowing; first, to use plasma cortisol
concentrations to characterize the stress response to dehorning in six-month-old calves;
second, to investigate whether there are differences in the cortisol response when the
different amputation tools of scoop, gui l lotine shears , saw and embryotomy wire are

Chapter 3: Dehorning methods 46
employed; third to establ ish a frame of reference for studying cortisol responses in
six-month-old cattle by identifying "baseline" and "maximal" cortisol values, the latter
through conducting an ACTH challenge of sufficient dose to elicit a maximal cortisol
response (Verkerk et al. , 1 993). The ACTH chal lenge wi l l also test the functioning of
the adrenal component of the hypothalamic-pituitary-adrenal axis (Mel ior and Murray,
1989b ) ; and fourth, by extrapolation from the cortisol responses, to comment on the
welfare implications of dehoming and the application of this to the animal husbandry
practice of dehoming.
Chapter 3: Dehorning methods
3.2 MATERIALS AND METHODS
3.2.1 Experimental design
47
Fifty seven male Friesian calves aged five to s ix months, weighing 99- 1 59 kg (mean
1 30 kg) and scheduled for dehorning according to usual husbandry practice, were used
in thi s study. They were separated into five mobs (n= 1 2) and the study was carried out
on a Massey University farm over four consecuti ve days in February 1 992. Prior
approval to conduct this study was obtained from the Massey University Animal Ethics
Committee.
The evening before each experimental day at 2000 h two mobs each of 1 2 calves were
randomly selected from the herd, numbers were painted on their backs for identification
purposes, and they were penned overnight outdoors in cattle yards ( 1 0 x 10 m) with
access to water but not food.
On each experimental day 24 calves were studied in two mobs of 12 , commencing at
0700 h , and 1 1 00 h respectively . Each mob was moved quietly in to a small pen
(3 x 4 m) where a pretreatment blood sample was taken . Al l blood samples were taken
in that pen because its small size restricted movement of the cal ves and thus facil itated
catching, restraint and sampling. Fifteen minutes later the calves were moved into the
adj acent cattle race where they were restrained manual ly and the treatment was
performed. Immediately after treatment they were returned to the small pen where blood
samples were taken with decreasing frequency throughout the fol lowing 9 hours .
Between 3 and 9 hours after treatment, when sampling was at hourly in tervals, the
calves were moved into an adjacent larger yard ( 1 0 x 10 m) where water was avai lable
ad libitum. When required for b lood sampling they were quietly moved back to the
smal ler pen . The duration of blood sampl ing was about 12 minutes for the mob.
At the end of the 9-hour-sampling period the two mobs of calves were reuni ted and
returned to pasture overnight. The fol lowing afternoon at 1600 h they were mustered
into the yards and left to settle for 3 hours . Thi s was done because mustering and
bloodsampling caused elevations in plasma cortisol concentration for about three hours
(Sylvester et al . , 1993. See Appendix A). Thereafter a blood sample was taken, the time
of that sample being about 33 or 36 hours after treatment.
This whole procedure was repeated over four consecutive days in different calves.
During the course of this experiment, the mustering of other stock nearby, at 1600 h and
1900 h on each day, elicited some interest from the experimental animals.

3.2.2 Blood sam pl ing
Chapter 3: Dehorning methods 48
Blood samples ( 1 0 ml) were taken by venipuncture from either jugular vein. Samples
were taken at 0.25 hr before treatment (pretreatment), and at 0.25, 0 .5 , 1 , 1 .5 , 2 , 2 . 5 , 3 ,
4 , 5 , 6 , 7 , 8 , 9 and 36h after treatment. Intensive blood sampling was carried out during
the first 9 hours because a previous study had shown that the acute plasma corti sol
concentrations return to pretreatment values by about 7 hours after dehorning (Sylvester
et al. , 1 993 . Appendix A) , and a 36h sample was taken because it was not known
whether dehorning caused a long-lasting increase of plasma cortisol concentrations.
Blood samples were taken by one person whi lst the calf was restrained by being held
firmly against the yard wall by three other people. This procedure usual ly took less than
45 seconds for each calf. Calves were bled in the same order each time to test for
possible effects of sampling order on plasma corti sol concentrations.
3.2.3 Treatments
The calves were randomly al located to one of s ix treatments which were equal ly
represented in each mob of 1 2 calves. Each calf was restrained manual ly for treatment
while the whole mob was packed closely together i n a cattle race. One person held each
calf's head firmly whilst another person performed the treatment. The two operators
moved down the race dealing with each calf in succession. Dehorning implements were
di s infected (Hibi tane concentrate 5 % . Hospi tal Products, ICI, Austral ia) between
ani mals . The amount of horn and skin ti ssue removed during dehorning varied
depending on the horn size and head movements. The order of treatment was the same
for each mob to test for possible effects of the treatment order on plasma cortisol
concentrations. The time of treatment was defined as time zero for each calf.
Control calves n=l 0
Calves were handled to simulate the restraint required for dehorning without bei ng
dehorned.
Scoop calves n=l 0
Calves were dehorned using an i ndustry standard scoop dehorner (Barnes Dehorners,
S tones, USA). The scoop dehorner (Fig 3 . 1 ) has two interlocking semi -circular blades
(radius of 20mm) which when engaged remove the horn and the adj acent cutaneous
tissue, i ncluding the germinal tissue of the horn. This was the only dehorning method
where the frontal sinus of the skull was occasional ly perforated.
Saw calves n=l 0
Calves were dehorned using a standard butcher's saw (Fig 3 . 1 ) .

Guillotine Shears calves n=l 0
Chapter 3: Dehoming methods 49
Calves were dehorned using a small pair of industry standard guillotine shears (James
Sculley, Pomeroy , PA . , USA) (Fig 3 . 1 ) with a cutting hole of 60x80mm.
Embryotomy wire calves n=l 0
Calves were dehorned using industry standard embryotomy wire (Arnold's wire saw) .
The embryotomy wire i s a length (0 .5 m) of j agged wire with handles at both ends
(Fig 3 . 1 ) . To operate, both ends are held and the wire is pul led repeatedly across the
base of the horn, which , in a manner similar to a saw, cuts the horn. The embryotomy
wire is usually used in si tuations where a saw would not fit, for example, fetotomy and
the cutting of boars' teeth . This method is purported to cauterise tissues (Owen, 1 984;
Oehme, 1 974 ).
Adrenocorticotropic Hormone (ACTH) calves n=l O
40J..lg (approximately 0.28 Jlglkg calf) o f ACTH (Synacthen, Ciba Pharmaceutical,
Auckland, NZ) were injected into a jugular vein of each calf in order to elicit a maximal
corti sol response and test adrenal reactivity (Melior and Murray, 1 989b; Verkerk et al. ,
1993).
3.2.4 Plasma Cortisol Analysis
Blood samples were col lected in vacutainer tubes containing l i th ium heparin , chi l led
immediately, centrifuged and the plasma was stored at -20°C unti l analysed. Plasma
cortisol concentrations were determined by radioimmunoassay (see Appendix C). The
corti sol radioimmunoassay technique was that of Ruder et al. ( 1 972) as modified by
Evans ( 1 979) (see Mac Diarmid, 1 982). The intra-assay and inter-assay coefficients of
variation were calculated using the three sets of plasma pools and were 1 1 % and 1 5%
respectively . The lowest detectable concentration of corti sol was 0 .3 ng/ml .
3.2.5 Statistical Analyses
Statistical analyses were conducted on 1 ) the non-transformed pretreatment cortisol
concentrations, 2) the time-course of the corti sol responses after treatment, and 3) the
integrated cortisol responses after treatment.
Cortisol data are expressed as the mean ± the standard error of the mean (SEM). The
significance of the difference between the means was determined using a two-way
analysis of variance (ANOV A) with Fisher's probabil ity of least significant differences
(PLSD). Except for checking whether the pretreatment data from different experimental
groups (mobs) could be pooled, the corti sol concentrations were transformed as the
arithmetic difference from the pretreatment value . The data were transformed in this

Chapter 3: Dehorning methods 50
manner to correct for individual variation or pre-study effects i n baseline cortisol
values. All statistical calculations were conducted using a standard stati stical computer
package (Statsview + Graphics, Version 2, Abacus Concepts Inc . , USA).
1) Pooling the data
To ascertain whether the results from all experimental groups (mobs) could be pooled,
an ANOV A was conducted on the non-transformed pretreatment cortisol concentrations
according to day , mob, and time. In addition , the possibi l i ty of a relationship between
the pretreatment concentrations and the order in which the calves were sampled was
examined using Pearson's correlation coefficient (r) or regression (r2) .
2) Timecourse of the cortisol response
To calculate when the cortisol response to a treatment was complete, i .e . when the
cortisol concentrations returned to and remained at pretreatment levels, a factorial
ANOV A design was used. To calculate i f there were any differences between
treatments in the mean timecourse of the cortisol response a repeated measures
ANOVA design was used.
3) Integrated cortisol response
Numerical integration was used to calculate the total cortisol response, hereafter cal led
the integrated corti sol response. The integrated cortisol response was defined as the area
under the cortisol curve and above a line drawn horizontal ly through the pretreatment
value (Melior and Murray , 1989b ). A factorial ANOV A was used to determine if there
were any differences between treatments in the mean integrated cortisol responses.
The strength of using the integrated corti sol response lies in the fact that it combines in
one number the features of both magnitude and duration, and so provides a means for
comparing the total cortisol response between treatments. The l imitation of this
measurement i s that the same number may represent both a short-l ived large response or
a protracted low or moderate response.

Fig 3 . 1
Fig 3 . 2
Chapter 3: Dehoming methods
Dehoming equipment. Left to right: saw; guillotine shears; scoop; cautery
irons and embryotomy wire .
Horn removal using the embryotomy w ire.
51

Fig 3 .3
Chapter 3: Dehoming methods
Horn removal using the scoop dehomer. Photo courtesy of Cheryl
McMeekan (McMeekan , 1997) .
52

Fig 3 .4
Chapter 3: Dehoming methods
The blood sampling procedure.
53

3.3 RESULTS
Chapter 3: Dehorning methods
3.3.1 Pretreatment Cortisol Concentrations
54
There were no significant differences (P>0.05) in the non-transformed pretreatment
plasma cortisol concentrations between days , mobs, or treatments, nor was there a l inear
con-elation with the order in which the animals were bled (r2=0. 1 9) (Fig 3 .5 ) . There was
a significant difference (P<0.05) in pretreatment cortisol concentrations between the
early ( 8 . 1 ± 1 .2 ng/ml , n=34) and late ( 1 2 .6 ± 1 .4 ng/ml , n=23) mobs, but, thi s was
considered to be of l i ttle or no biological significance in relation to the magnitude of the
subsequent cortisol responses. Therefore the results from all mobs were pooled and used
to calculate the mean corti sol response to each treatment. The mean pretreatment
concentration was 10 . 1 ± 0.9 ng/ml (n=57).
After treatment, a l l calves showed significant transient increases in plasma corti sol
concentrati ons, the magnitudes and durations of which varied according to the
treatment. There were three distinct patterns in the timecourse of the corti sol response
which were exhibited by Control, dehomed and ACTH calves respectively. The results
will be discussed in these three groupings.
3.3.2 Control Calves
Restraint, blood sampling, and simulated dehorning in the race resulted in a small but
significant transient rise in plasma cortisol concentrations (P<0.05) . The maximum
increment of 23 ± 4 ng/ml occurred 15 minutes after treatment, after which the cortisol
concentrations decreased and returned to pretreatment values by 1 . 5 hours (Fig 3 .6) .
Thereafter the mean plasma cortisol concentrations were not significantly different from
pretreatment values (P>0.05).
3.3.3 Dehorned Calves
Amputation dehorning resul ted m marked transient Increases m plasma cortisol
concentrations (P<0.05) . All four amputation methods (scoop, saw, guil lotine shears,
and embryotomy wire) resulted in similar mean corti sol responses, with no sign ificant
di fferences in peak magni tude , duration or integrated cortisol responses (P>0 .05)
(Fig 3 . 7 and Table 3 . 1 ) . The maximal i ncremen t in cort i sol concentrations
(33-45 ng/ml) occurred 30 minutes after treatment. During the next hour, cortisol
concentrations decreased rapidly, but, between 1 . 5 and 3 hours values plateaued. In
Guil lotine shear calves the plateau values (at 2 and 2 .5 hours) were less (P<0.05) than
those of the other groups of dehomed calves. Thereafter, from 3 hours after treatment
corti sol concentrations continued to decrease and returned to pretreatment values by 6
hours after treatment.

3.3.4 ACTH Calves
Chapter 3: Dehorning methods 55
ACTH admini stration resulted i n a marked transient n se m plasma cortisol
concentrations, the peak increment (46 ng/ml) of which occurred 1 hour after treatment.
High values were sustained for about two and a h alf hours (P<0.05), after which cortisol
concentrations decreased to pretreatment values by 4 hours , and remained non
significantly below pretreatment concentrations between 4 and 9 hours (Fig 3 . 8) .
Between 6 and 9 hours the cortisol concentrations in ACTH calves were significantly
less than those of Control calves, which exhibited a non-significant rise (P>0.05) in
concentrations during this period.
3.3.5 Cortisol timecourse gradients
During the first hour after treatment the rates of rise in cortisol concentrations of ACTH
and dehomed calves appeared to be simi lar (Fig 3 .9) . The initial rate of decrease of
cottisol concentrations from maximal values in ACTH calves, which occurred between
2 and 4 hours, was similar to that in dehomed calves (between 0 . 5 and 1 . 5h) , and in
Control calves (between 0 .25 and 1 h) and all three were of the order of 0.40 ng/ml/min .
This rate of decrease of corti sol concentrations was greater than that from the plateau to
pretreatment concentrations in dehomed calves , which occurred between 3 and 6 hours,
and was of the order of 0 . 1 3 ng/ml/min.
3.3.6 36 hour cortisol sample
The cortisol concentrations in Guil lotine shears and S aw calves at 36 h were greater
than those in the Control and ACTH calves (P<0 .05) . There were no significant
di fferences between the pretreatment and the 36h plasma cortisol concentration within
any group (Table 3 . 1 ) .
3.3.7 Integrated cortisol responses
There were no significant differences (P>0.05) between the mean integrated corti sol
responses of calves dehomed by any method (Scoop 1 42 ± 10 ng.hr/ml , S aw 1 36 ± 14
ng.hr/ml, Gui l lotine shears 1 1 2 ± 18 ng.hr/ml, Embryotomy wire 1 37 ± 21 ng.hr/ml) ,
nor between the integrated corti sol responses of dehorned and ACTH ( 1 46 ± 16
ng.hr/ml) calves (Table 3 . 1 ) . The mean integrated corti sol responses of dehomed and
ACTH calves were between 3 and 3 .9 times greater (P<0.05) than those for the Control
calves (36 ± 5 ng.hr/ml) .

Chapter 3: Dehorning methods
40.----------------------------------------------------,
t: 0 ....... ro .... E a) u t: 0 u 0 VJ "€
20
8 1 0
0
Pretreatment sample and bleeding order
X X
2 3 4 5 6 7 8 Bleeding order
X X
X
9
X
X
X X X
1 0 1 1
X
1 2 1 3
Fig 3 . 5 Relationsh ip between the pretreatment plasma cortisol concentrations and the order in which the calves were sampled (bleed ing order) (n=57). The straight line corresponds to a l inear regression for which the correlation coefficient r2=0. 1 9 ( i .e. weak correlation).
56

-
] bl) t:: ,_.. ...... c <l) E <l) '""' (.) t:: .......
0 C/i .€ 0
u
60
50
40
30
20
1 0
0
a
}l I I I I I \ I \ I I I \
Chapter 3: Dehoming methods
Scoop and Co ntrol
� Scoop
--------- Control
I I l',l/f''k+ 1 ,,,
( 10)4---.---�--.---r--,.--.---.---.---.---.�H���� (1 ) 0 2 3 4 5 6
Time (hours) 7 8 9 3 6
Fig 3.6 Changes in plasma cortisol concentrations (mean ± SEM) of calves in response to Scoop dehorning (n=lO) and Control (n=lO) treatment.
60
50
-
E 40 --bl) s ...... c 30 <l) E <l) .... (.) c
20 .........
0 C/i .€ 0 10 u
0
( 10)
a = Scoop values are significantly different from Control values (P<O.OS) .
( 1 ) 0
All Dehorned respo nses
b b c c e e
2
--o---
3 4 5 6 Time (hours)
7
Scoop
Saw
Embryotomy wire
Guil lotine shears
8 9 3 6
Fig 3.7 Changes in plasma cortisol concentrations (mean ± SEM) of calves in response to Scoop (n=lO) , Saw (n=l O) , Embryotomy wire (n=lO) and Guil lotine shears (n=lO) dehoming. Guil lotine shears values are significantly different from: b Scoop; c Saw; e Embryotomy wire (P<O.OS) .
57
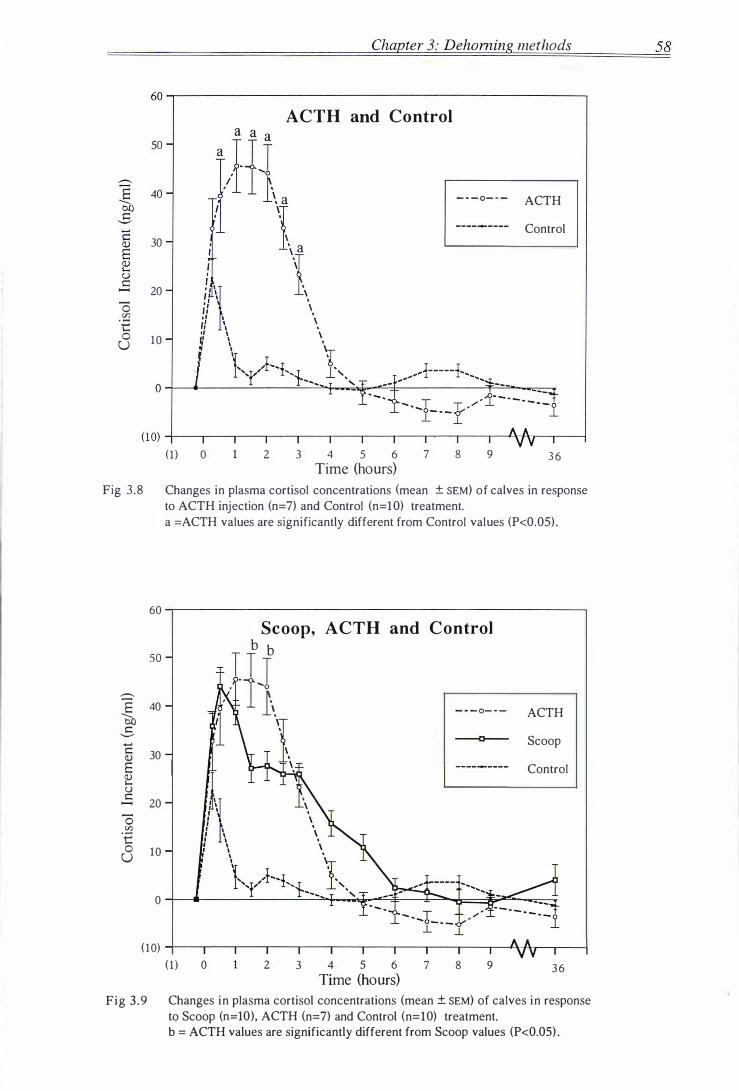
0 (/.) "€ 0 u
Chapter 3: Dehoming methods
60�--------------------------------------------------.
so
40
30
20
10
( 1 ) 0 2
ACTH and Control
3 4 s 6 Time (hours)
7
- - - o- - - ACTH
Control
8 9 3 6
Fig 3 .8 Changes in plasma cortisol concentrations (mean ± SEM) of calves in response to ACTH injection (n=7) and Control (n=lO) treatment.
60
so
-::=:-E 40
--bO c: -...... c: 30 Q) E Q) .... <.) c:
20 ........
0 Cl) "€ 0 10 u
0
( 10)
a =ACTH values are significantly different from Control values (P<O.OS) .
( 1 ) 0
Scoop, b b
ACTH and Control
. _1TJ L. 1 \
2 3 4 s 6 Time (hours)
- - - o- - -
...1..
7 8 9
ACTH
Scoop
Control
36
Fig 3 .9 Changes in plasma cortisol concentrations (mean ± SEM) of calves in response to Scoop (n=lO), ACTH (n=7) and Control (n=lO) treatment. b = ACTH values are significantly different from Scoop values (P<O.OS) .
58

Chaeter 3: Dehorning_ methods 59
Table 3 . 1 Characteri st ics o f the cortisol responses for each group before and after treatment
(mean±SEM ) . Different superscripts wi th in columns i nd icate stat ist ical ly s ign ificant
differences between treatments.
Treatment n Pretreatment Peak Time Response Integral* Integral* * 36h
(ng/ml) increment to peak duration (ng.hr/ml) as ratio of (ng/ml)
(ng/ml) (hours) (hours) Control
Control 1 0 7 ± 1 23a ± 4 0.25 1 .5 36a ± 5 5 ± 1
Gui l lotine 1 0 14 ± 2 4 1 b ± 4 0.5 6 1 1 2b ± 1 8 3 . 1 1 6 ± 3
shears
Embryotomy 10 12 ± 3 36b ± 4 0.5 6 1 37b ± 2 1 3 . 8 12 ± 4
wire
Saw 10 1 1 ± 2 42b ± 3 0.5 6 1 36b ± 1 4 3 .8 12 ± 3
Scoop 10 8 ± 2 44b ± 3 0.5 6 1 42b ± 1 0 3.9 1 1 ± 2
ACTH 7 7 ± 2 46b ± 6 4 146b ± 1 6 4 . 1 5 ± 1
* = the integral of the cortisol response. Defined as the area under the cortisol response curve and above the pretreatment level (ng.hr/ml).
** = the integral expressed as a ratio of the i ntegral of the Control response.

3.4 DISCUSSION
Chapter 3: Dehorning methods 60
Using changes in plasma cortisol concentrations as an index of pain-induced distress,
the present study led to the following findings :
1 ) A l l amputation dehorning treatments resulted m simi lar cortisol responses
regardless of the method employed. The corti sol response was marked, biphasic
and lasted for about six hours .
2) The timecourse of the plasma corti sol response after ACTH administration
suggests that maximum corti sol secretion had been induced, providing a reference
against which to compare the other cortisol responses. The corti sol responses in
the first hour after dehorning were simi lar to those fol lowing ACTH treatment
indicating that dehoming caused maximal cortisol secretion and thus by inference
was very distressing.
3) Both the duration ( 1 . 5 h) and the integral of the cortisol response of the Control
calves were about a quarter of that after dehorning, so that control handling was
considered to be a relatively benign experience.
4) There were three distinct patterns in the timecourse of the plasma corti sol
concentrati ons after ACTH, Dehorning, and Control treatment respecti vely.
Analysis of these three patterns of corti sol response suggest different underlying
physiological processes and indicate avenues for alleviation of that pain-induced
distress.
3.4.1 The response to dehorning
Amputation dehorning el ic i ted a marked biphasic elevation in pl asma cortisol
concentrations which lasted for about six hours . There were no significant differences in
the timecourse or integral of the cortisol response according to which dehorning method
was used. It is not surpri sing that there were no significant differences i n the peak
magnitudes, durations, patterns or integrated cortisol responses amongst cattle dehomed
by different methods (Table 3 . 1 ) . This is because the methods employed involved
similar surgical amputation of the horn and presumably s imi lar trauma. Two
observations suggest that the extent of the insult, or the different nature of the insult,
may have affected the corti sol response . First, scoop dehorning, which caused the
deepest wounds and was the only treatment where the frontal sinus of the skul l was
sometimes perforated, el icited corti sol responses which had the biggest (non
significantly) integrated cortisol response and peak-magnitude. Second, dehoming with
the gui l lotine shears, which resulted in the most superficial wounds , el icited mean
cortisol responses which a) at 2 and 2 .5 hours after treatment were significantly less

Chapter 3: Dehorning methods 61
than those for the other dehorned groups, and b) had the smallest (though non
significant) integrated response. The size and ergonomics of the gui l lotine shears used
did not allow a deeper cut to be made. The effect of wound depth was subsequently
i nvestigated by other members of our husbandry di stress research team (see below,
McMeekan et al. , 1 997).
The possibility of a synergistic effect upon the corti sol response of sampling animals in
pain , ei ther as a result of increased pain from the sampling procedure per se, or as a
result of an increase in the negative psychological component because of the association
of that pain with the operators (Hemsworth et al. , 1 994) was discounted (Lester et al.,
1 99 1 b) . Lester et al. ( 1 9 9 1 b) commenced blood sampling at different periods after
surgical castration and tai l ing in l ambs, and detected no effects of the sampl ing
procedure on the cortisol response. They suggested that this may be because ei ther
sampling was a benign procedure, or because the most noxious stimulus, in their case
surgical castration and tai l docking, tended to dominate lesser noxious inputs such as
sampling (Lester et al. , 1 99 l b) .
3.4.2 ACTH (maximal frame of reference)
Our understanding of the dynamics at each level of the HP A-axis on cortisol secretion is
sti ll rudimentary. In cattle treated with a series of increased doses of ACTH, plasma
corti sol concentrations increase to a maximal value, after which further increases in
ACTH dose only lengthen the duration of the plateau (Keller-Wood et al., 1983 ; Keith
et al. , 1 986 ; Verkerk et al. , 1 993) . Th i s p lateauing of corti sol concentrati ons
demonstrates that the adrenal cortex cannot secrete more cortisol in response to further
increases in doses of ACTH, that is , maximal stimulation of the adrenal cortex has
occurred, and by inference reflects the "maximal secretory capacity" of the adrenals to
exogenous ACTH. In the present study, ACTH admini stration resulted in a plateauing
of high plasma corti sol concentrations, which indicates the maximum corti sol secretory
capacity of the adrenals. Whilst thi s demonstrates that the adrenal gland is responding to
ACTH stimulat ion appropriately, it reveals nothing about the functioning of the
HPA-axis proximal to the adrenals . I t may be more informative to stimulate the
HPA-axis at the h igher level of the pituitary gland through the administration of
corticotropin-releasing factor. The half hour delay in the appearance of maximal cortisol
concentrations after the ACTH bolus presumably reflects the time required for the
synthesis of steroid hormones (Goldstein et al. , 1 992).
Comparison of dehorning and ACTH responses The observation that the integrated cortisol responses for al l four dehorning treatments
were not significantly different from those after ACTH administration is fortuitous. This
i s because increasing the dose of ACTH only lengthens the duration of the plateau of

Chapter 3: Dehorning methods 62
maximal cortisol concentrations (Kel ler-Wood et al. , 1 983 ; Keith et al., 1 986; Verkerk
et al. , 1 993) and concomitantly increases the integrated response. However, comparing
the timecourses of the cortisol responses is informative.
The rate of ri se of plasma corti sol to maximal values and those maximal values attained
after dehoming were similar to those after ACTH injection . Evidently dehoming caused
maximal stimulation of both endogenous CRF and endogenous ACTH secretion during
the first 30 minutes. It fol lows that dehoming was extremely di stressing. In addition ,
this simi lari ty in the initial cortisol response suggests that, in this case , the dynamics of
the corti sol response was simi lar regardless of whether from nociceptive or exogenous
ACTH stimulation.
The ACTH curve has an exponenti al decay indicative of a first order reaction process
removing corti sol from the b lood (Endrenyi , 1 989) . The decrease in corti sol
concentrations i n ACTH calves reflects the biological removal of both exogenous
ACTH and endogenous cortisol as the levels of that ACTH returned to basal values .
Whereas the ACTH calves exhibited a single phase decrease, the decrease in corti sol
concentrations after dehorning had three phases. The init i al rate of decrease from
maximal cortisol concentrat ions in dehorned calves , wh ich occurred between
0 . 5 and 1 . 5 hours, had a simi l ar timeconstant as that of the ACTH calves and
presumably l ikewise represented the biological removal of corti sol . In the case of
dehomed cal ves the cortisol surge was elicited by the nociceptive barrage from tissue
damage. The fal l in the rate of decrease of cortisol concentrations in dehorned calves
after 1 .5 hours indicates the appearance of a secondary stimulus to cortisol secretion
which was presumably el icited by continuing nociceptive impulses from inflamed
tissues. After three hours the rate of decrease in corti sol concentrations increased again
and levels retumed to pretreatment values by six hours after treatment.
3.4.3 Control (m in imal frame of reference)
The duration of the cortisol response after control handl ing and bleeding was 1 . 5 hours,
a period which is similar to that reported in other studies on calves (Laden et al. , 1 985 ;
Allyn, 1 99 1 ) . That the integrated cortisol response was 67 to 75% less than that after
dehorning, and was resolved 4 . 5 hours earlier, and that the rate of decrease from
maximal values i n the Control calves was similar to that in ACTH calves (suggesting
the elimination of an initial surge of cortisol, as opposed to any on-going stimulus to
cortisol secretion), all combine to indicate that the control experience, and by inference
the experimental si tuation, was relatively benign. It is l ikely that any stress associated
with handling and bleeding was transient and was primaril y due to the novelty (Mason ,
1 968) of the situation.
Chapter 3: Dehorning methods
3.4.4 Biphasic pattern of response to dehorning
63
There were three di sti nct patterns i n the timecourse of the p lasma cortisol
concentrations after ACTH, dehoming, and control treatment respectively. Comparison
of these three patterns of cortisol response provides insight regarding the underlying
physiological processes and indicates avenues for alleviation of that pain-induced
distress . Before analysing this , a discussion is presented of the events fol lowing tissue
injury, including the anatomical and physiological substratum of pain , inflammation,
heal ing and the ' s tress ' response. This fol lowing section is sourced from The
Management of Pain edited by Bonica ( 1 990a) which uses information from animal and
human studies.
Physiological and anatomical substrates of pain Acute pain is a complex constel lation of unpleasant sensory, emotional , and mental
experiences and autonomic, psychological and behavioural responses provoked by
tissue damage . Injury to tissues, w hether induced by disease, accident or surgical
operations, constitutes a noxious stimulus and causes the release of intracel lular
biochemical (algogenic) substances. Noxious stimuli and these endogenous algogenic
substances acti vate specialized high-threshold sensory receptors , cal led nociceptors ,
which transduce the stimuli into nociceptive impulses that are transmitted via various
relays in the neuraxis to the central nervous system. At each relay station various
autonomic, neuroendocrine, psychological or behavioural responses are ini tiated aimed
at maintaining the body's integrity. In addi tion , at these relay stations the ascending
nociceptive impulses are subjected to modulation from higher centres in the brain . The
final perception of pain , including its sensory, evaluative and emotional aspects, and the
responses to it are a complex synthesis of these inputs and modulation from the
ascending and descending pathways.
Nociceptive impulses are transmitted to the central nervous system in peripheral nerves,
the nerve fibres of which are classified according to conduction characteri stics. Wi th
minor exceptions all nociceptive afferents conduct impulses in high threshold A delta
(A8) and C fibres . The sensory terminal endings, the nociceptor, have no special ized
structures , rather they are free nerve endings, which respond to either mechanical ,
thermal or chemjcal stimuli or a mixture of these. Nociceptors are supplied to the skin,
subcutaneous ti ssue, fascia, muscle, periosteum, joints, bones and muscle . In human
skin 95% of cutaneous nociceptors are located in the sub-epidermis , and 5% in the
epidermis (Bonica, 1 990c) . The periosteum of bone is richly supplied with A8 and C
fibres, which run along with the blood vessels in the Haversian canal s . The cancellous
portion of bone has few nociceptors , and the cortex and marrow is not normall y pain
sensitive (Bonica, 1 990c) .

Chapter 3: Dehorning methods 64
Injury induced nociceptive afferent input enters the neuraxis by way of the spinal or
medullary dorsal horn, where second order neurones conduct the information either to
higher centres or laterally to stimulate spinal reflexes. The dorsal horn i s not just a
simple relay station, but i s a site for complex local processing of the ascending
nociceptive information . This is achieved by the phenomena of central convergence and
central summation of excitatory and inhibitory influences coming from the periphery,
local interneurones, and from higher centres.
After modulation in the dorsal horn , some nociceptive impulses pass via second order
neurones to the anterior ipsi lateral horn where they stimulate somatomotor and
preganglionic sympathetic neurones to provoke autonomic segmental nocifensive reflex
responses . Somatomotor stimulation produces reflex withdrawal and skeletal muscle
tension which becomes a new source of nociceptive impulses and reinforces the existing
nociception . The stimulation of sympathetic fibres results in peripheral vasoconstriction
especial ly in the skin and splanchnic regions, increased cardiac output and blood
pressure, and decreased gastrointestinal tone . Local ly the decreased microcirculation in
the inj ured and adj acent t issues may become ischemic and generate additional
nociceptive impulses.
Other nociceptive impulses are transmitted to second order neurones which pass to the
contralateral ventral horn and join the ascending tracts to the brain . Nociceptive
impulses originating from below the head enter the spinal dorsal horn and are
transmitted to the central nervous system in three ascending pathways - the
spinothalamic tract, spinoreticular tract, and spinomesencephalic tract - collectively
termed the anterolateral fasciculus. In contrast, nocicepti ve impulses from the head
originate primari ly in the peripheral sensory distribution of the four cranial nerves (5, 7 ,
9 , 1 0) and the first three cervical nerves. These nocicepti ve impulses activate second
order neurones in the trigeminal brain stem nuclei and the spinal dorsal horn , which
relay the information via the ventral trigeminothalamic tract to other sites in the central
nervous system including the reticular activating system, thalamus, hypothalamus,
periacqueductal gray, limbic system and cerebral cortex. The anatomy, physiology and
biochemi stry of the ventral trigeminothalamic tract i s simi lar to the anterolateral
fasciculus and they appear to terminate in s imi lar regions of, though sometimes
different nuclei in , the brain.
Suprasegmental ( i . e . supraspinal) reflex responses result from nociceptive-induced
stimulation of the medullary centres of venti lation and circulation, of hypothalarnic
autonomic and neuroendocrine centres, and l imbic structures. The resultant increased
sympathetic tone and accompanied catecholamine secretion enhances the effects of the
spinal reflexes and further increases total peripheral resistance, cardiac output and blood

Chapter 3: Dehorning methods 65
pressure. There i s also an increased secretion of catabolic hormones including ACTH,
cortisol and glucagon , as well as plasma cyclic adenosine mono phosphate, adenosine
diphosphate, and a reciprocal decrease of anabolic hormones such as insul in . These
neuroendocrine respon ses cause an increase i n metabol i sm through increased
concentrations of blood glucose and free fatty acids, effectively mobi l izing substrates
from storage to central organs and damaged tissues. Such responses are characteristic of
the 'stress' response.
The degree and duration of these metabolic and endocrine changes are related to the
degree and duration of tissue damage. Intense anxiety and fear can be an integral part of
the pain experience and response, and can greatly enhance the hypothalamic responses
through stimulation from higher cortical centres . Finally, acute pain fol lowing tissue
damage is usual ly a self-limiting experience due to progress of the healing processes.
Components of the response to dehorning The corti sol response to dehorning is a neuroendocrine reflex el icited by nociceptive
stimulation of the HPA-axi s integrated wi th negati ve emotional or evaluative
enhancement from higher centres. The cortisol timecourse after dehoming was biphasic
whereas that after Control and ACTH treatment was monophasic . The fol lowing logical
speculation on the consti tuents of the corti sol response to dehorning deri ved from
comparison of the dehomed, Control and ACTH cmtisol responses (Fig 3 .9), suggests
underlying physiological processes and indicates possible avenues for alleviating that
distress.
Rise to maximal
The plateauing of high corti sol concentrations after ACTH injection indicates maximal
cortisol secretion of the adrenal gland (see section 3 .4 .2) . The rate of ri se and the
maximal concentrations attained in dehomed and ACTH calves were similar and
indicate that amputation dehorning elici ted maximal stimulation of the adrenal cortex
and was, by inference, extremely di stress ing. The rapid rise in p lasma cortisol
concentrations after dehorning was presumably el icited by the afferent barrage of
nociceptive input from cut and damaged nerves, the ensuing nociceptive impulses
generated by the release of algogenic substances from damaged t issues plus any
psychological effect of that nociceptive input.
Decrease from maximal
The ACTH curve has an exponential decay indicative of a first order reaction process
removing corti sol from the blood (Endreny i , 1 989) . The decrease in corti sol
concentrations in ACTH calves reflects the biological removal of both exogenous
ACTH and endogenous cortisol as the levels of that ACTH returned to basal values. The

Chapter 3: Dehorning methods 66
initial rate of decrease from peak cortisol concentrations in the Scoop and the Control
responses has a simi lar timeconstant as that of the ACTH response, indicating the same
underlying physiological corti sol reaction process.
Sub-maximal plateau
The deviation from exponential decay which occurs at around 1 . 5 hours after dehoming
indicates the generation of new corti sol (see Fig 3 . 1 0) . This is taken as evidence of on
going stimulation to cortisol secretion presumably from nociceptive impulses from
inflamed tissues, which is represented by area B in Fig 3 . 10 .
Fig 3 . 10
- (j) g c ·- 0 t::: · -o -(.) � � c: E m Cl) (.) � c
- 0 0.. (.)
Schematic diagram of the cortisol timecourse after dehorning (curve l ) . The biphasic shape
suggests either the response would have followed the curve 2, but for the addition of area B
(from inflammatory pain), or less l ikely the response would have followed curve 3 , but for
the loss of area A (as a result of stress-induced analgesia).
The biphasic corti sol response corresponds with the observation that tissue damage
produces two phases of sensory input. The first is associated with the ti ssue damaging
stimulus, i .e . during surgery, and the second is from the inflammation reaction to the
damaged tissue. In addition, the biphasic pattern of the cortisol response corresponds to
Woolf and Chong's ( 1 993) theoretical graphs of nociceptor input depicting these two
phases. It may be the case that 1 .5 h after dehorning i s an i mportant ti me in the
inflammatory process when there is an increase or change in the nature of the pain of
inflammation , or both . The constituent of the response el icited by i nflammation could
be derived by examining the effect of an anti - inflammatory agent v e rsus local
anaesthetic on the cortisol response.

Chapter 3: Dehoming methods 67
Alternatively, the deviation from exponential decay might be an artifact of a loss of area
A (Fig 3 . 1 0) . That is , the response would have followed curve 3 but for the loss of area
A as a result of some effect that has waned by about three hours after treatment. The
loss of area A may resul t from a) some l imi tation of corti sol secretion under
physiological condi tions ; or a decrease in nociceptive input either b) at the level of the
primary afferent input; or c) from higher centres at any nociceptive relay in the neuraxis
as a result of descending inhibition. The latter i s termed stress-induced analgesi a
(Carmody, 1992). There appear to be two forms of thi s . One is opiate based and the
other i s non-opiate based (see section 1 . 3 .3) . The presence of stress-induced analgesia
may be infeiTed by: 1) a decreased response to a noxious stimulus at a site remote from
the tissue damage; or 2) the enhancement of a "stress" response after the admini stration
of antagonists to nociception inhibition . Such drugs include opioid antagonists, such as
Naloxone, and non-opioid antagonists, such as an alpha-2 adrenergic and serotonergic
antagonists. It is more l ikely and parsimonious that, rather than nociceptive inhibition
resulting in the loss of area A, it is the pain of inflammation resulting in the appearance
of area B that is the dominant force shaping the corti sol response curve (Fig 3 . 10) .
Decrease to pretreatment levels
The degree and duration of the metabolic and endocrine changes subsequent to tissue
injury are related to the degree and duration of tissue damage. Acute pain fol lowing
tissue damage is usual ly a self-l imiting experience due to progress of the heal ing
processes . By six hours after dehoming cortisol concentrations have returned to
pretreatment levels. This indicates that either the pain, or stress, or both, have subsided
to levels that do not stimulate, or attain the threshold of, the stress response. At this
stage the wound is not healed, and we would expect the continued presence of pain,
though of a less intense magnitude. Presumably the quality and magnitude of pain at
th is t ime serves to promote heal ing behaviours (e .g . rest) and wound heal ing
physiological processes (e .g. anabolism).
3.4.5 Choice of dehorning method
The deci sion as to which method of dehoming wi l l be employed wi l l involve
considerations of practicality including ease of use , labour-costs, heal th and safety
i ssues and cattle welfare. In the current study, only the acute di stress response to
dehorning was examined. Dehorning complications such as wound healing and
infection, and the long term efficacy of the different methods were not examined.
It is noteworthy that 36h after treatment the plasma cortisol concentrations were at
pretreatment values. This suggests that any pain experienced on the second day was of a
low leve l . However, amputation dehorning wounds have been reported to take 4-6
weeks to heal (no definition given) (Loxton et al., 1 982) , or 14 weeks to heal (by

Chapter 3: Dehoming methods 68
epithel ial migration) (Kihurani et al. , 1989) . Personal experience tells us that wounds
sti l l hurt after 36h . It may be the case that the pain at 36h is much less than, or of a
different nature to, that experienced in the first six hours . A lternatively the calf may stil l
be in pain but may have habituated to the pain .
Amputation dehorning is carried out when cautery disbudding is not possible, that i s on
calves older than 8- 12 weeks of age . The wounds infl icted are large , there may be
considerable blood loss and often the frontal sinus of the skull i s perforated. The
presence of an open wound may increase the chance of horizontal transmission of blood
borne pathogens (DiGiacomo et al. , 1 987) and casual i nfections (Allyn, 199 1 ) which
impair wound healing especially in the wet season.
It is our experience that the various dehorning tools differ in their ease of use. The
scoop is designed with ergonomics in mind, such that the cutting force is achieved with
a push rather than a pull and thereby allows the use of body weight rather than the need
for muscular force. The gui l lotine shears, saw and embryotomy wire require more effort
to cut off the horn . The embryotomy wire results in less blood loss (Oehme, 1 974;
Owen , 1 984; Weaver, 1 986) but i s exhausting to use. The latter three methods may be
used on larger horns . By contrast, di sbudding by cautery , which can only be done on
calves less than 6-8 weeks old, is a simpler, c leaner and more steri le procedure
(Allyn, 1 99 1 ) than other modes of dehorning. There is no blood loss, and because there
i s no open wound it may be performed at any time of the year. Subsequent research
showed that cautery disbudding was less di stressing, as assessed by corti sol responses,
than amputation dehorning in six -week-old calves (Petrie et al. , 1 996b) .
3.4.6 Critiq ue of the experimental design
The experimental conditions used here including repeated handl ing and blood sampling
and confinement, may have caused additional di stress. Of these, repeated handling and
blood sampling was the least l ikely to cause di stress. Thi s conclusion is based upon the
fol lowing: regression analyses showed that there was no effect of repeated handl ing
upon corti sol concentrations (Fig 3 .5) ; pretreatment corti sol concentrations were similar
to those reported previously (Herd, 1 9 89) and for the Control calves these
concentrations had returned to pretreatment levels by 1 .5 hours . Furthermore, Lester
et al. ( 1 99 1 b) demonstrated that repeated blood sampling and handl ing had no effect
upon the cortisol response of lambs to surgical castration and tai l ing. Confinement in
the yards presumably inhibited the activities of the calves, which normally spend about
33% of their time grazing and walking, 33% ruminating and 33% being idle (Fraser and
Broom, 1 990), and this may have caused more di stress than might have occurred had
the cattle been in their usual habitat . For these reasons i t i s possible that the cortisol
responses in the present study were conservative and overestimated the distress caused
Chapter 3: Dehorning methods 69
by the treatments. The use of remote portable monitors with indwelling catheters, which
obviate repeated handling and al low the cattle to be studied in their normal habitat, may
reveal attenuated distress responses (lngram et al. , 1994) .
3.4.7 Conclusions
Amputation dehorning of six-month-old calves el icited a marked, biphasic di stress
response that lasted for about six hours . Amputation dehorning resulted in similar
corti sol responses regardless of the amputation method employed, although there is a
suggestion that the depth of the wound may affect the level of di stress . The plateauing
of maximal cortisol concentrations after the ACTH bolus indicated that maximal
secretory capacity of the adrenal gland was reached. The rate of increase and the
maximal corti sol levels attained after dehorning and ACTH injection were similar
indicating that dehorning caused maximal corti sol secretion by the adrenal gland and
was, by inference, very distressing. The cortisol response after dehorning appears to be
biphasic . The appearance of a sub-maximal plateauing of corti sol concentrations
between 1 .5 and 3 hours suggests the occurrence of either stress-induced analgesia, or
more l ikely the appearance of a second phase of pain presumably from inflammation.
3.4.8 Epi logue
Subsequent studies confirmed that the cortisol response to scoop dehorning lasted about
six to seven hours (Petrie et al. , 1996b; McMeekan et al. , 1997, 1 998a,b). Further, as a
result of the present finding regarding the simi larity of cortisol responses for different
dehorn ing methods, subsequent amputation dehorning work used the scoop only
because of i ts ease of operation . The findings in thi s thesis regarding the depth of
wound led to a specific study of shallow versus deep scoop dehorning, which
subsequently demonstrated no significant effect of scoop wound depth (McMeekan
et al. , 1 997) . Final l y , the cortisol timecourse after dehorning was subsequently
investigated to see if i t was possible to di stingui sh the presumed phases of amputation
pain versus inflammation-related pain in that response (McMeekan et al. , 1998b) . These
subsequent works are discussed in more detail in the General Discussion .

4 4.0
Chapter 4: Alleviation of distress 70
CORTISOL RESPONSES OF CALVES TO SCOOP
DEHORNING WITH LOCAL ANAESTHESIA AND/OR
CAUTERY OF THE WOUND
ABSTRACT
Dehoming of cattle is a routine husbandry practice which causes significant and marked
distress that lasts for about six hours (Chapter three). There has been no comprehensive
research into alleviation of that distress. Changes in plasma cortisol concentrations were
used to assess the pain-induced distress in Friesian calves (six-months old, about 1 30 kg,
n=59) during the first 9 hours and at 36 h after amputation dehoming with local
anaesthesia (LA) ancl/or wound cautery. There were six treatment groups : Control,
LA-Control, Scoop, LA-scoop, Scoop+cautery and LA-scoop+cautery. Calves were held
overnight in cattle yards with access to water but not food. On the day of the study, calves
were studied in mobs of 12 with equal representation of treatments in the mob. Blood was
taken by venipuncture from either jugular vein while calves were held against the walls of
the pen. Treatment was conducted in a cattle race. Local anaesthesia significantly reduced
the cortisol response to dehoming by 50% (P<0.05) . Cauterizing the scoop wound
effected a marginal reduction in the cortisol response compared to dehoming alone
(P>0.05). The combination of local anaesthetic plus cauterizing the scoop wound virtually
abolished the cortisol response to amputation dehoming. These results suggest that local
anaesthetic should be administered before dehoming and that if possible the scoop wound
should be cauterized. However, further research is needed to determine the duration of the
apparent cautery-induced analgesia, its effects upon wound healing and the practicalities
of the additional handling and care required to carry out this procedure.
4.1 INTRODUCTION
Dehoming of cattle is a routine husbandry practice performed to reduce injury to stock
handlers and stock, to reduce economic losses through hide and carcass damage and to
improve husbandry. The dehoming of cattle is a welfare issue because it causes
significant and marked distress that lasts for about six hours , as judged from plasma
cortisol concentrations (Chapter three) . It is likely that the cortisol response elicited by
dehoming i s due to pain and may therefore be alleviated by applying strategies which alter
the perception of pain such as systemic analgesics, general anaesthetics, sedatives and
tranquil li sers, or strategies which decrease the transmission of nociception from the
wound such as local or regional anaesthetics and possibly cauterising of the wound, or by
a combination of these techniques . Alternatively, there may be a method of dehoming
which evokes less distress than other methods (Chapter three). At the time this work was

Chapter 4: Alleviation of distress 71
done little research had been conducted on the assessment or alleviation of the pam
induced distress caused by amputation dehoming.
In accordance with the increasing concern for animal welfare the Animals Protection Act
( 1960) was repealed by the Animal Welfare Act ( 1999). Transitional Provi sions (sections
20 1 , 202) have continued the effect of the Animals Protection Act ( 1 960) as it applies to
dehoming for up to a further three years. Currently it is an offence to dehom cattle over
the age of 20 months unless the operation is conducted under anaesthesia of sufficient
power to prevent the animal from feeling pain (section 3y, Animals Protection Act 1 960) .
Cattle younger than 20 months have no such legislative protection. However, it i s likely
that this arbitrary age limit will be decreased to a no less arbitrary age limit of three
months (K.J Stafford, and D.J Melior, personal communication).
It i s possible that the different methods of dehoming may evoke dissimilar distress
responses because of vruiations in the nature or magnitude of the insult. The cortisol
responses of six-month-old calves dehomed by scoop, saw, gui l lotine shears, or
embryotomy wire were similar, however, there was an indication that the gui llotine shears
may cause slightly less distress than the other methods, possibly because the wound is
more superficial (Chapter three).
Local anaesthetics are drugs that block all types of nerve conduction when applied locally
to nerves in approptiate concentrations. Thus they cause both sensory and motor paralysis
in the area with no loss of consciousness or impairment of central control of autonomic
functions. Effective loss of sensory input to the brain from the bovine horn and the
surrounding tissue is accomplished by a regional nerve block of the cornual nerve
(Weaver, 1986) (see Fig 4 . 1 ) . Local anaesthetic has been shown to virtual ly eliminate the
cortisol and behavioural responses after ring castration and tailing in lambs (Wood et al. ,
1 99 1 ) .
The rationale for cauterizing wounds as a means of al leviating pain comes from historical
anecdotes (Lord Nelson, 1 8 10) , medical literature (Freund and Marvin, 1 990) , and
previous work done in this laboratory (Lester et al . , 1 99 1 a) . Prior to the advent of
modem medicine it was common practice to cauterize wounds for the purposes of
haemostasis and anti-sepsi s . Patients suffering from third degree bums report less pain
than those suffering from second or first degree bums (Freund and Marvin, 1 990) . This
is because the nociceptors have been destroyed (Freund and Marvin, 1990) . Lester et al.
( 1 99 1 a) reported a lower acute cortisol response after docking lambs tails with the heated
docking-iron than when a knife was used. They attributed this to a beneficial by-product
of the docking iron which through cauterizing the wound, may destroy nociceptors at the
wound, and thus decrease pain transmission and accordingly distress.

Chapter 4: Alleviation of distress 72
Cauterizing the wound may therefore alleviate the distress associated with some surgical
husbandry practices. Husbandry tools which incorporate this cauterizing effect include
docking irons, hot iron brands, disbudding irons and, possibly, the embryotomy wire -
which heats up when it is used (Oehme, 1974; Owen, 1 984).
4 . 1 . 1 Aims of study
The aims of the current study were to investigate the alleviation of amputation dehoming
distress. In particular the objectives were; 1 ) to characterize the cortisol response elicited
by amputation dehoming in six-month-old cattle; 2) to investigate the effects of local
anaesthesia on the cortisol response to dehoming; 3) to investigate whether cauterizing the
dehoming wound confers any benefit on the cortisol response to dehoming; 4) to
ascertain whether the effect on the corti sol response to dehoming with local anaesthesia
combined with wound cautery is additive, multiplicative or whether one feature of the
treatment dominates. It is intended that this research will proved scientific data to aid in
the writing of welfare codes and advisory material concerning the dehoming of cattle. In
addition , this study may provide further insight into the physiology of pain-induced
distress which could have application to other husbandry procedures.

Chapter 4: Alleviation of distress
4.2 MATERIALS AND METHODS
4 . 2 . 1 Exper i menta l des i g n
73
The major features of the experimental design were the same as that described in Chapter
three, except that 1 0 minutes after the pretreatment blood sample , local anaesthetic was
administered to those calves scheduled to receive i t , and a second pretreatment blood
sample was taken fifteen minutes later from all calves. Thereafter there were no
differences except for the treatments. The main features were as follows:
Fifty-nine male Friesian calves aged five to s ix months, weighing 1 0 1 - 1 49 kg
(mean 1 28 kg) and scheduled for dehorning according to usual farm practice, were used
in this study. Prior approval to conduct this study was obtained from the Massey
University Animal Ethics Committee. The cattle were divided into five mobs of 1 2 calves,
with an even distribution of calves receiving the different treatments represented in each
mob. The study was carried out over four days in February 1992.
The evening before each experimental day at 2000 h , two mobs each of 1 2 calves were
randomly selected from the herd, numbers were painted on their backs for identification
purposes, and they were penned overnight outdoors in cattle yards ( 1 0 x 1 0 m) with
access to water but not to food.
On each experimental day investigation began in the first mob at 0700 h and the second
mob at 1 1 00 h . Each mob of 1 2 calves was quietly moved into a small pen ( 3 x 4 m)
where a pretreatment blood sample was taken. Ten minutes later 6 ml of a local
anaesthetic were administered to each cornual nerve for those animals scheduled to receive
i t . Fifteen minutes later the efficacy of anaesthesia was tested, and if required another
dose of local anaesthetic was administered to that cornual nerve. At this juncture another
blood sample was taken from all calves . This extra blood sample was taken in order to
check for the effect of the administration of the local anaesthetic on plasma cortisol
concentrations. Fifteen minutes later the calves were moved into an adjacent cattle race
where the treatment was performed. Immediately after treatment they were returned to the
small pen where blood samples were taken with decreasing frequency throughout the
subsequent 9 hours (see below). Between 3 and 9 hours after treatment, when sampling
was at hourly intervals, the calves were moved into an adjacent larger yard ( 1 0 x 1 0 m)
where water was available ad libitum . When required for sampling they were quietly
moved back to the smaller pen . The duration of blood sampling on each occasion was
about 1 2 minutes for the mob.
At the end of the 9 hour sampling period the two mobs of calves were reunited and
returned to pasture overnight. The fol lowing afternoon ( 1 600 h) they were mustered into

Chapter 4: Alleviation of distress 74
the yards and left to settle for three hours (Sylvester et a l. , 1993 . Appendix A), after
which a blood sample was taken, the time of that sample being about 3 3 or 36 hours
after treatment.
This whole procedure was repeated over four consecutive days in different calves. During
the course of this experiment, the mustering of other stock nearby, at 1 600 h and 1 900 h
on each day, elicited some interest from the experimental animals.
4 . 2 . 2 B lood sam p l i n g
Blood samples ( 1 0 ml) were taken by venipuncture from either jugular vein . Blood
samples were taken at 0.66 (pretreatment) and 0.25 h before treatment, and at 0 .25 , 0 . 5 ,
1 , 1 . 5 , 2 , 2 . 5 , 3 , 4 , 5 , 6 , 7 , 8 , 9 and 3 6 h after treatment. Intensive blood sampling was
canied out during the first 9 hours because a previous study had shown that plasma
cortisol concentrations returned to pretreatment values by about 6 hours after dehorning
(Sylvester et al. , 1993. Appendix A), and a 36 h sample was taken because it was not
known whether dehorning caused a long-lasting increase of plasma cortisol
concentrations. Blood samples were taken by one person whilst the calf was restrained
against the yard wall by three other people. This procedure usual ly took less than 45
seconds for each calf. Calves were bled in the same order each time to test for possible
effects of the blood sampling order on plasma cmtisol concentrations.
4 . 2 . 3 T reat ments
The calves were randomly al located to one of six treatments which were equally
represented in each mob of 1 2 calves. Each calf was restrained manually for treatment
while the mob was packed closely together in a race. One person held each calf's head
firmly whilst another performed the treatment. The two operators moved down the race
dealing with each calf in succession. Between animals, dehorning implements were
disinfected (Hibitane concentrate 5 % . Hospital Products, ICI Australia) . The order of
treatment was the same for each mob in order to test for possible effects of the treatment
order on plasma cortisol concentrations. The time of treatment was defined as time zero
for each calf.
Control n=l 0
Calves were handled m the race to simulate the restraint required for dehorning but
without being dehorned.
Local A naesthetic Control (LA -Control) n=lO
Local anaesthetic was administered to calves 0 .5 h before Control treatment as above.
Local anaesthetic (6 m! of 2% lignocaine hydrochloride. Ethkal Agents ltd, Auckland,
New Zealand) was injected near each cornual nerve where it crosses between the

Chapter 4: Alleviation of distress 75
postorbital bar and the horn (Weaver, 1986) (see Fig 4 . 1 ) . The cornual nerve receives
sensory information from the horn and the immediately surrounding tissues .
Anaesthesia, which occurs 1 0- 1 5 minutes after lignocaine administration (Ritchie and
Greene, 1990) , was tested by pricking the skin around the horn with a hypodermic needle
and observing if there was a response (for instance ear, eye or head flinches) . If a
response to this stimulus did occur, another 6 ml of local anaesthetic were injected near
the con·esponding cornual nerve.
Scoop n=lO
Calves were dehorned using an industry standard dehorning scoop (Barnes Dehorners,
Stones, USA). The scoop (Fig 3 . 1 ) consists of two interlocking semi-circular blades
(diameter about 45 mm) which when engaged removed the horn and the adjacent
cutaneous tissue, including the germinal tissue of the horn. This procedure often resulted
in the frontal sinus of the skull being perforated. The amount of horn and skin tissue
removed during dehorning depended on the horn size and head movements.
Local A naesthetic followed by Scoop (LA-Scoop) n=9
Local anaesthetic was administered and it efficacy was tested as described for LA-Control
calves, after which the calves were dehorned as described for Scoop calves.
Scoop and Cautery (Scoop+Cautery) n=l 0
Calves were dehorned as described for Scoop calves, and immediately afterwards each
wound was cauterized with a custom built iron which was heated over a gas flame. The
cauterizing iron was shaped as a half sphere with a diameter of 30 mm (Fi g 4 . 2) . When
sufficiently hot to burn wood it was applied firmly over the wound to cauterize the
tissues. This usually took about 6 seconds per wound.
Local A naesthetic followed by Scoop and Ca utery
(LA-Scoop +Cautery) n = l O
Local anaesthetic was administered and its efficacy was tested as described for
LA-Control calves, thereafter the calves were dehorned and the wound was cauterized as
described for Scoop+Cautery calves.
4 . 2 . 4 Plasma Cort isol Analysis
Blood samples were collected in lithjum heparinised vacutainers, chilled immediately,
centrifuged and the plasma stored frozen at -20°C until analysed. Plasma cortisol
concentrations were determined by radioimmunoassay using the technique
Ruder et al . ( 1 972) as modified by Evans ( 1 979) [see Mac Diarmid ( 1 982) and
Appendix C] . The intra-assay and inter-assay coefficients of variation were 9% and 14%
respectively . The smallest detectable concentration of cortisol was 0.3 ng/ml .

4 . 2 . 5 Stat ist ical Analyses
Chapter 4: Alleviation of distress 76
Statistical analyses were conducted on 1 ) the non-transformed pretreatment cortisol
concentrations, 2) the time-course of the cortisol responses after treatment, and 3 ) the
integrated cortisol responses after treatment.
Cortisol data are expressed as the mean ± the standard error of the mean (SEM). The
significance of the difference between the means was determined using a two-way
analysis of variance (ANOV A) with Fisher's probability of least significant differences
(PLSD). A probability of 5% or less (P<0.05) was considered to indicate a significant
difference. Except for checking whether the data from different experimental mobs could
be pooled, the cortisol concentrations were transformed as the arithmetic difference from
the pretreatment value. The data were transformed in this manner to correct for individual
variation or pre-study effects in baseline cortisol values . All statistical calculations were
conducted using a standard statistical computer package (Statsview + Graphics, Version
2 , Abacus Concepts Inc . , USA).
1) Pooling the data
To ascertain whether the results from all experimental groups (mobs) could be pooled an
ANOV A was conducted on the non-transformed pretreatment cortisol concentrations
according to day, mob, and time. In addition, the possibility of a relationship between the
pretreatment concentrations and the order in which the calves were sampled was examined
using Pearson's correlation coefficient (r) or regression (r2) .
2) Timecourse of the cortisol response
To calculate when the cortisol response to a treatment was complete, i .e . when the cortisol
concentrations returned to and remained at pretreatment levels, a factorial ANOV A design
was used. To calculate if there were any differences between treatments in the mean
coitisol timecourse, a repeated measures ANOVA design was used.
3) Integrated cortisol response
Numerical integration was used to calculate the total corti sol response, hereafter called the
integrated cortisol response. The integrated cortisol response was defined as the area
under the cortisol curve and above a line drawn horizontally through the pretreatment
value (Melior and Murray, 1 989b). A factorial ANOVA was used to determine if there
were any differences in the mean integrated corti sol responses, between treatments.
The strength of using the integrated cortisol response lies in the fact that it combines in
one number the features of both magnitude and duration, and so provides a means for
comparing the total cortisol response between treatments. The limitation of this

Chapter 4: Alleviation of distress 77
measurement is that the same number may represent both a short-lived large response or a
protracted low or moderate response.

Fig 4 . 1
Chapter 4: Alleviation of distress. 78
Injection of local anaesthetic . Photo courtesy of Cheryl McMeekan
(McMeekan, 1997).

Chapter 4: Alleviation of distress. 79
Fig 4 . 2 The cautery iron. (Photo from S utherland, 1 999).

4.3 RESULTS
Chapter 4: Alleviation of distress
4 . 3 . 1 Pretreatment Cort isol Concentrat ions
80
The non-transformed pretreatment plasma cortisol concentrations were examined for the
effects of extraneous factors. There were no significant effects upon either the first or
second pretreatment cottisol sample of days, treatments, mobs, or time of day (i .e . early
versus late mobs) (Table 4 . 1 ) (P>0 .05 in all cases) . Nor was there a difference in the
plasma cortisol concentrations of the second pretreatment sample between those calves
which did (n=23) and those that did not (n=29) receive local anaesthetic (P>0.05) . There
was no linear correlation between the pretreatment concentrations and the order in which
the animals were bled (first sample: r2=0.23, second sample: r2=0.06) (Fi g 4 . 3 ) .
Therefore the data from all experimental mobs were pooled and used to calculate the mean
response for each treatment. The overall mean pretreatment cortisol concentrations (n=52)
for the first and second samples were 9 .8-+ 0.7 and 19 .5 ± 1 . 1 ng/ml respectively.
4 . 3 . 2 Data excl uded from the analyses as outl iers
The data from seven calves were excluded from the study as outliers. The determination
of an outlier was made by satisfying two crite1ia which indicated that the calves were
abnormally or excessively distressed prior to and/or throughout the study: 1 ) i f
examination of the cortisol timecourse showed a unique and aberrant pattern, and
2) where statistical analysis of the cortisol response found the pretreatment and/or the
integrated cortisol response were greater than those encompassed by two standard
deviations from the mean for that treatment. For calves # 1 05 (LA-Scoop),
#8 1 (LA-Scoop+Cautery), #70 (Control) , #90 (LA-Control), and #66 (LA-Control) it
was concluded that they were suffering from a previous di stress prior to and during the
study, which masked the effect of the treatment. For calves #79 (LA-Scoop) and
#69 (LA-Scoop+Cautery) it was concluded that the local anaesthetic had not worked in
decreasing the initial distress of dehorning. As individual differences are central to animal
welfare science (Wiepkema et al., 1987; Manteca and Deag, 1993 ; Broom, 1988) detai ls
of these responses are provided in Appendix B.
4 . 3 . 3 Cort isol responses to treatment
All calves showed significant transient increases in plasma corti sol concentrations after
treatment, the magnitudes and durations of which varied according to the treatment.
Control and LA-Control
Control and LA-Control calves exhibited similar small but significant transient increases
in plasma cortisol concentrations which returned to pretreatment levels by 1 hour after
treatment. There were no significant differences between Control and LA-control calves in
the peak increment (Control 8 ng/ml, LA-Control 1 1 ng/ml) , duration, or integrated

Chapter 4: Alleviation of distress 81
response (0-9h: Control 1 9 ± 4 ng.hr/ml , LA-Control 2 2 ± 5 ng .hr/ml) (see F ig 4 . 4
and Table 4 . 1 ) . For both, cortisol concentrations decreased below pretreatment values at
9 and 36 hours but thi s was significant only in Control calves .
S c o op
Scoop dehorning (Fig 4 .5 ) elicited a marked significant transient increase in plasma
cortisol concentrations, with the maximal increment (30 ng/ml) occurring 0 . 5 h after
treatment. During the next hour, the mean cortisol concentrations decreased rapidly to
values which plateaued between 1 . 5 and 3 hours . Thereafter corti sol concentrations
continued to decrease returning to pretreatment levels by 6 hours after treatment . The
integrated cortisol response (0-9h) was 105 ± 1 7 n g . h r/m l .
LA - Sc o op
Calves which received local anaesthetic prior to scoop dehorning exhibited a biphasic
response (Fig 4 .6) . There was an initial small but significant transient increase in mean
plasma cortisol concentrations, the peak increment ( 1 5 ng/ml) of which occurred 1 5
minutes after treatment. Thereafter cortisol concentrations decreased and returned to
pretreatment levels by 1 h and remained there unti l 3 hours after treatment. After 3 h
cortisol concentrations rose again, the peak increment ( 1 0 ng/ml) of this second ri se,
which was of similar magnitude to the first r ise, occurred at 5 h. However, the
timecourse of this second rise was more protracted than that of the first rise. Cortisol
concentrations then decreased and returned to pretreatment values by 6 h where they
remained. The integrated cortisol response (0-9h) was 52 ± 1 4 ng . hr/ml .
Scoop compared to LA-Scoop and LA-Control
Prior application of local anaesthetic abolished the initial cortisol response exhibited by
Scoop calves for the first three hours after treatment, so that the cortisol concentrations of
LA-Scoop calves were simi lar to those of LA-Control calves during thi s period (Fi g 4 . 6 ) .
After 3 hours the responses diverged, and whilst LA-Control calves remained at
pretreatment values, the cortisol concentrations of LA-Scoop calves increased to levels
similar to those in Scoop calves, and thereafter in both groups cortisol concentrations
decreased in a similar fashion (Fig 4 .7) .
The integrated cortisol response (0-9h) of LA-Scoop calves ( 5 2 ± 1 4 ng.hr/ml ) was
50% less (P<0.05) than for Scoop calves ( 1 05 ± 17 ng .hr/ml ) and 2 .4 times greater
than for LA-Control calves (22 ± 5 ng .hr/ml (P<0.05) (Table 4 . 1 ) .
Scoop +Cautery
Cauterizing the wound after scoop dehorning resulted in a marked significant transient
increase in mean plasma cortisol concentrations, the peak increment (22 ng/ml) of which

Chapter 4: Alleviation of distress 82
occuned 0 . 5 h after treatment (Fig 4 .8 ) . Thereafter, mean cortisol concentrations
decreased and returned to pretreatment values by 5 hours. Between 2 and 3 hours the rate
of fall of cmtisol concentrations decreased resulting in a plateauing of cortisol
concentrations. The integrated cortisol response (0-9h) was 78 ± 20 ng . hr/m l .
Scoop+Cautery compared to Scoop
The pattem of the cortisol timecourse in Scoop+Cautery calves was essentially similar to
that in Scoop calves. However, the cortisol concentrations in Scoop+Cautery calves were
lower than those in Scoop calves at every sampling time, but only significantly so at 0 . 5 ,
2 .5 , and 3 hours after treatment (Fig 4 .9) . The plateauing of cortisol concentrations
between 1 . 5 and 3 hours was less marked in Scoop+Cautery calves than in Scoop
calves.
The integrated cortisol response (0-9h) of Scoop+Cautery calves (7 8 ± 20 ng . hr/ml )
was 25% less than that for Scoop calves ( 1 05 ± 1 7 ng.hr/ml) , but, this difference was
not significant, presumably because of the high coefficients of variation (79% and 50%,
respectively) (Table 4. 1 ) .
LA - Scoop + Cautery
LA-Scoop+Cautery calves (Fig 4 . 1 0) exhibited a small but significant transient increase
in mean plasma cmtisol concentrations, the peak increment ( 1 0 ng/ml) of which occuned
at 0.25 h after treatment. The mean cortisol concentrations then decreased to pretreatment
values by 1 hour after treatment where they remained, except for a small but significant
increase (P<0.05) at 3 hours . The integrated corti sol response (0-9h) was
2 6 ± 7 ng . hr/ml .
LA-Scoop+Cautery compared to LA -Scoop and LA-Control
Local anaesthetic combined with cauterization of the scoop wound virtually abolished the
second rise in cortisol concentrations exhibited by LA-Scoop calves between 4 and 6 h .
The cortisol concentrations in LA-Scoop+Cautery calves were similar to those in the
LA-control calves throughout the period of observation, and there were no significant
differences in peak-magnitudes, durations, or integrated responses (see Fig 4 . 1 1 and
Table 4. 1 ) .
The integrated cortisol response (0-9h) of the LA-Scoop+Cautery calves
( 2 6 ± 7 ng. hr/ml ) was 50% less than that for the LA-Scoop ( 5 2 ± 1 4 ng . hr/ml )
calves, however, these differences were not significant (P>0.05) (Table 4. 1 ) .
Comparison of the 3 6 h cortisol samples
For all groups the plasma corti sol concentrations 36 h after treatment were not
significantly different from their respective pretreatment values. But, between treatments

Chapter 4: Alleviation of distress 83
those in the Control and LA Control calves were marginal ly lower from those m
LA-Scoop+cautery , LA-Scoop, Scoop+cautery and Scoop calves (P>0.05) (Table 4. 1 ) .
4 . 3 . 4 Test of duration of a nalgesia (skin pr ick test)
The needle-prick testing of the skin adjacent to the horn buds in the LA-Control calves
indicated that sensation began to return to the area 2.5 to 3 h after treatment.
Of the 23 calves which were given local anaesthetic, eight required a second application
on one side as anaesthesia was incomplete. After analysis of their cortisol responses, two
calves were excluded as outliers as it was obvious that the local anaesthetic had not
worked in decreasing the response to dehorning. Interestingly six of the seven calves
which were excluded as outliers had received local anaesthetic .

Chapter 4: Alleviation of distress
2 5,---------------------------------------------------�
2 0
.g 1 5
g <1.>
� 0 1 0 u
....... 0
·€ 0
0 5
0
Fig 4 .3
Pretreatment sample and bleeding order
-t -t r r
-t r ""
� "" ""
0 2 3 4 5 6 7 8 9 1 0 1 1 1 2 1 3 1 4 Bleeding order
Relationship between the pretreatment plasma cortisol concentrations and the order in which the calves were sampled (bleeding order) (n=52) . The straight l i ne corresponds to a linear regression for which the correlation coefficient r2=0.23 (i .e. weak correlation).
84

--E -.... bO = ._.. ..... = <l> E <l> 1-o u
.s 0
Cl) '€ 0 u
Chapter 4: Alleviation of distress. 85
40,-------------------------------------------------�
30
20
10
0
T
I' l ,)··: ·i •: \ E \ • . ·. € ... r \
Control and LA-Control
- - - o- · - L A - C o n t r o l
•••••••••0••••••••• C o n tro l
(1 0) -+--..-----.----r---r---r---r---r---r---r---r-�rftl--r--i ( 1 ) 0 2 3 4 5 6
Time (hours) 7 8 9
Fig 4.4 Changes in plasma cortisol concentrations (mean ± SEM) of calves in response to Control (n=9) and LA-Control (n=8) treatment.
-E -.... bO c ._.. ..... c <l> E <l> 1-o u
.5 0
Cl) '€ 0 u
There were no significant differences between treatments (P>O.OS) .
40
a Scoop and Control
a 30
a S c o o p
a ......... g .....••.• C o n t r o l
20
1 0 · ··l : 1 i ..... \.
0
( 1 0) +---r---r-"""T"-"T"""-r---r---r--.----,---.--llt-A-J-.---l ( 1 ) 0 2 3 4 5 6
Time (hours) 7 8 9 3 6
Fig 4.5 Changes in plasma cortisol concentrations (mean ± SEM) of calves in response to Scoop (n=l O) and Control (n=9) treatment. a = Scoop values are significantly different from Control values (P<O.OS).

-"E ........ bl) c -...... c <1.) E <1.) ... u
.s 0 en "€ 0 u
Chapter 4: Alleviation of distress. 86
40,-----------------------------------------------� LA-Scoop and LA-Control
30
L A - S co o p
- - - <>- - - L A - C o n t r o l
20
1 0
0
(1 0) +---"T""""----,r---r----r----r---�----r----r---r---"T""""--9.-fh--r---i (1) 0 2 3 4 5 6 7 8 9 3 6
Time (hours) Fig 4.6 Changes in plasma cortisol concentrations (mean ± SEM) of calves in response
to LA-Scoop (n=7) and LA-Control (n=8) treatment.
40
30
-] bl) s ...... 20 c <1.) E <1.) ... u
.s - 1 0 0 en "€ 0
u
0
b=LA-Scoop values are significantly different from LA-Control values (P<O.OS) .
d Scoop and LA-Scoop
d
S c o o p
L A - S c o o p
L A - C o n t r o l
( 1 0 ) +---"T""""----,r---r----r----r--�----r---r--r--"T""""--9clh--.---i ( 1 ) 0 1 2 3 4 5 6 7 8 9 3 6
Time (hours) Fig 4. 7 Changes in plasma cortisol concentrations (mean ± SEM) of calves in response
to Scoop (n=lO) and LA-Scoop (n=7) treatment. d = Scoop values are significantly different from LA-Scoop values (P<O.OS) .

-8 -.... bl) c -� c Q) E Q) ..... u
.s 0 .� ....... ..... 0 u
Chapter 4: Alleviation of distress. 87
40.-------------------------------------------------� Scoop+Cautery and Control
30
S co o p + C au t e ry
......... a......... C o n t r o l
20
10 T
" \\ 0
( 10) -+--�-.---,.---.-"""T"-""T""--,--.--.-----r�"\ 1-\r--r---i ( 1 ) 0 2 3 4 5 6
Time (hours) 7 8 9 36
Fig 4.8 Changes in plasma cortisol concentrations (mean ± SEM) of calves in response to Scoop+Cautery (n=lO) and Control (n=9) treatment.
-E -.... bl) c -....... c Q) E Q) ..... u
.s 0
en '€ 0 u
a = Scoop+Cautery values are significantly different from Control (P<O.OS) .
40-r----------------------------------------------------.
e
30
20
1 0
0
Scoop+Cautery and Scoop
e
e
··· ··· • ·o·· ·
S c o o p
S c o o p + C a u t e r y
......... a......... C o n tr o l
(1 0 ) -+--�---,----.-..,.--.--�---r--....---.----.----"L.W\�.---l ( 1 ) 0 2 3 4 5 6 7
Time (hours) 8 9 3 6
Fig 4.9 Changes in plasma cortisol concentrations (mean ± SEM) of calves in response to Scoop+Cautery (n=lO) and Scoop (n=l O) treatment. e=Scoop values are significantly different from Scoop+Cautery values (P<O.OS) .

---. E --
Chapter 4: Alleviation of distress. 88
40.---------------------------------------------------, LA-Scoop+Cautery and LA-Control
30
----o--- L A - S c o o p +Cau tery
OJ) - - - 0- - - L A - C o n t ro l c '--' ...., c Q) E Q) .... u c
0 ·= .... 0 u
20
1 0 T
0
(1 0) -+---r-----,.-------,.-�--r--r-----,--"T"---r---y---'-\ ( 1 ) 0 2 3 4 5 6
Time (hours) 7 8 9
Fig 4. 1 0 Changes i n plasma cortisol concentrations (mean ± SEM) of calves i n response to LA-Scoop+Cautery (n=8) and LA-Control (n=8) treatment.
---. E --OJ)
s ...., c Q) E Q) .... u c
0 CJ:l
"t 0 u
There were no significant differences between treatments (P>O.OS) .
40.---------------------------------------------------,
LA-Scoop+ cautery and LA- Scoop
30 --o- L A - S c o o p
----o--- L A - S c o o p + C a u te ry
- . - . -· - . - · L A - C o n t r o l 20
f
10
0
( 1 0) -+---r--�-r-----,---,--�--.---y---r----;.----.L\-J'"h---.----1 (1) 0 2 3 4 5 6
Time (hours) 7 8 9 3 6
Fig 4 . 1 1 Changes in plasma cortisol concentrations (mean ± SEM) of calves in response to LA-Scoop+Cautery (n=8) and LA-Scoop (n=7) treatment. f = LA-Scoop is significantly different from LA-Scoop+Cautery (P<O.OS) .

Chapter 4: Alleviation of distress 89
Table 4 . 1 Characteristics o f the cortisol responses (mean ± SEM) for each group before and after
treatment. Different superscripts within columns indicate statistically significant differences
between treatments.
Treatment n Pretreatment( Peak Time Response Integral* Integral** 36h
ng/ml) increment to peak duration (ng.hr/ml ) as ratio of (ng/ml)
(ng/ml) (hours) (hours) Control
Control 9 8 ± 2 8 ± 2 0.25 1 9a ± 4 4 ± 1
LA-Control 8 7 ± 1 1 1 ± 2 0.25 na ± 5 1 .2 3 ± 1
LA- 8 9 ± I 10 ± 3 0.25 26a ± 7 1 .4 8 ± 2
Scoop+Ct
LA-Scoop 7 10 ± 2 1 5 ± 5 0.25 6 52ab ± 14 2 . 7 1 1 ± 3
Scoop+Ct 1 0 1 2 ± 2 22 ± 3 0 .5 6 78b ± 20 4. 1 10 ± 2
Scoop 1 0 8 ± I 30 ± 5 0 .5 6 1 05b ± 1 7 5 . 5 1 1 ± 2
* = the integral of the cortisol response. Defined as the area under the cortisol response curve and above the pretreatment level (ng.hr/ml) .
** = the integral expressed as a ratio of the integral of the Control response.

4.4 DISCUSSION
Chapter 4: Alleviation of distress 90
Using changes in plasma cortisol concentrations as an index of distress, the present study
led to the following findings :
1 ) The time course of the changes in plasma cortisol concentrations m calves after
Scoop dehoming in this study was similar to that described in Chapter three. The
response was marked, biphasic and lasted for about six hours, indicating that
dehoming is an extremely noxious experience.
2) Injection of local anaesthetic prior to Scoop dehoming virtually abolished the first
three hours of the cortisol response eljcited after dehoming. This equated to a 50%
reduction in the integrated cortisol response (0-9h) and indicates that local
anaesthetic should be given to alleviate the pain-induced distress of dehoming.
3) Cauterizing the wounds after scoop dehoming appeared to marginal ly reduce the
cortisol response compared to dehoming alone. This suggests that there may be
some benefit in caute1izing the dehoming wound. However, the behavioural
response to the cautery indicated that it was very aversive.
4) Surprisingly, the combination of local anaesthetic before and cauterizing the wound
after dehoming virtually eliminated the cortisol response. The cortisol response was
simjlar to the control response which suggests that pain-induced di stress was either
absent or minimal . The apparent benefit of the combined regime has paral lels with
recent discoveries in pain physiology and merits further investigation.
Scoop dehorning elicited a marked biphasic elevation in plasma corti sol concentrations
which lasted for about six hours. The simj larity of the Scoop response with the ACTH
response suggests that scoop dehorning was an extremely distressing experience, as
described in the previous study (Chapter three). The predorrunant stimuli to cortisol
secretion were presumably noxious input of nociception from damaged tissues and
psychological interpretation of that from higher centres. By contrast, the co11isol response
elici ted by control handling and blood sampling lasted for 1 .5 hours and was of low
magnitude, and simi lar to that described for Control calves in Chapter three. This was
taken as evidence that control handling and bleeding was a relatively benign experience
and any distress associated with it was minimal and caused by the novelty of the
experimental condition.
4 . 4 . 1 Local a naesthes ia
Prior injection of local anaesthetic virtually abol i shed the cortisol response to scoop
dehoming for the first three hours . During this period the plasma cortisol concentrations

Chapter 4: Alleviation of distress 91
m LA-Scoop calves were similar to those in LA-Control and Control cal ves. This
similarity indicates that the local anaesthetic eliminated or substantially decreased the irutial
nociceptive banage due to damage to peripheral nerves, along with any subsequent
nociceptive input from inflamed damaged tissues for the first three hours . Presumably the
small corti sol response exhibi ted by these three groups during this period, was elicited by
psychological response to the novelty of the experimental situation, which stimulates the
HP A-axis from the higher centres of the brain . This simi larity of the LA-Scoop response
to the Control response is surprising as one might expect the other non-noxious and novel
stimuli, such as changes in sensation, weight of the head or dripping blood, to elicit a
greater cortisol response than that exhibited by the Control calves. In addition, the
similarity of the cmtisol responses of LA-Control and Control calves supports the
findings that the admini stration of local anaesthetic per se causes minimal distress (Petrie,
1 994; Petrie et al. , 1993).
The increase in cmtisol concentrations m LA-Scoop calves after 3 hours presumably
reflected the retum of sensation to the area served by the cornual nerve and the first
appearance of noxious stimuli associated with the tissue damage to that area. The return of
sensation was evidenced by a) pricking the cutaneous area served by the cornual nerve
with a hypodermic needle, at about 2-3h calves began to respond to this stimulus; b) at
about 3 hours there was an increase in the general activity of LA-Scoop calves, in
particular increased occunences of tail shaking, head shaking, ear flicking and walking
(see Chapter five); and c) the duration of action of lignocaine is 60 to 1 20 minutes, but
this may be extended by increasing the amount of drug injected (Ritchie and Greene,
1 990) . S imi lar behavioural responses were exhibited by six-week-old calves after
dehoming with local anaesthetic or after ring tai l-docking with epidural anaesthesia
(Petrie, 1 994). That the response is elici ted by pain-inducing stimuli and not other stimuli
is deduced from the following. The similarity of the LA-Control and Control responses
suggests that there i s no additional di stress associated with the return of sensation to the
head, or the wearing-off of local anaesthetic per se. The similarity of the LA-Scoop and
LA-Control response during the first three hours, suggests that there is no additional
effect of local factors such as hemonhage or algogenic substances eliciting a cortisol
response through systemic means. Presumably this continues to be the case when the
local anaesthetic wears off. These findings support the conclusion that the increase of
cortisol concentrations in LA-Scoop calves after three hours was elicited by the
appearance of pain-induced distress.
Interestingly the increase in cortisol concentrations at 3h in LA-Scoop calves rose to the
level of that in Scoop calves at the same time, after which they both followed a similar
course back to pretreatment levels, so that between 4 and 6 hours the responses were

Chapter 4: Alleviation of distress 92
simi lar. Nerve blockade eliminates sensory transmission from the area of trauma, and
therefore the spinal and supraspinal reflexes which are responsible for the catabolic and
altered circulation state of the stress response to surgery do not occur. Based on the
cortisol responses, it would appear that the sequence of the local events of inflammation
was similar to that which occurred after dehoming. At the local level, tissue damage
causes the release of algogenic substances, resulting in local vasodilation and
extravasation of other inflammatory mediators. These algogenic substances may persist
for hours or days and become a source of nociceptive impulses when local anaesthetics
wear-off. Nociceptive input from such sources elicited a stress response as indicated by
the second cortisol ri se, but with character different from that in calves which did not
receive local anaesthetic, and yet after three hours it followed the same sequence as those
calves which did not receive local anaesthetic. Overal l , the effect of the local anaesthetic
equated to a 50% reduction in the integrated cortisol response (0-9h) compared to scoop
dehoming without local anaesthetic . This suggests that there may be merit in investigating
the effect of a long-acting local anaesthetic, that is , one which i s of duration longer than
the response to dehoming; or in investigating the effect of a long acting anti-inflammatory
agent.
4 . 4 . 2 Ca utery
The marginal reduction m the corti sol response with the addi tion of wound cautery,
compared to the scoop calves, suggests that cauterizing the wound confers some benefit .
This effect was anticipated from previous studies (Lester et al . , 199 1 a) and from
observations that third degree bums are analgesic (Freund and Marvin, 1990). However,
there was the possibi lity that wound cautery could increase the corti sol response as it was
an insult additional to the dehoming.
A knowledge of the anatomy of the skin, in particular the location of nociceptors therein,
and hi stological examination of bum injuries, help us understand why some bum injuries
are painful and others are analgesic. Pain receptors, pathways and transmitters are similar
in humans and animals (Bonica, 1 990a; in Dart, 1 994a) . In humans 95% of cutaneous
nociceptors are located in the subepidermis, and 5% in the epidermis. With first degree
bums only parts of the epidermis are destroyed resulting in mild discomfort. In second
degree bums the epidermis and variable amounts of dermis are destroyed. These wounds
are extremely painful due to damaged nerves and other intact nerve endings which, with
the protective layer of skin gone, are sensitized and exposed to stimulation. A third degree
bum causes complete destruction of the skin leaving the initial wound analgesic, although
there may be a component of dull throbbing pain. Around the periphery of third degree
bums are areas of second degree bum which are painful . Over time as the wound heals
and the neural tissue is reorganized there appears sharp pain . Thus, third degree bums are

Chapter 4: Alleviation of distress 93
analgesic because the relative number of nociceptors in the damaged area have been
decreased by ablation (Freund and Marvin, 1990) .
The marginal reduction in the cortisol response with the addition of wound cautery,
compared to the scoop calves contrasts with the markedly smaller cortisol responses of
lambs tai l-docked with a heated docking-iron rather than a sharp knife. The destruction of
nociceptors in the wound site has been advanced as a possible reason for the decreased
cortisol responses after those amputations (Lester et al. , 199 1a; Petrie et al. , 1996a) or
procedures (Petrie et al. , 1996b) which incorporate cautery as opposed to those which do
not (Lester et al. , 199 1a ; Kent et al. , 1 993). It is possible that destruction of nociceptors
is more effective when ti ssues are severed by cautery than when wounds caused by
cutting are subsequently cauterized. Indeed it is surpri sing that the effect of amputation
followed by cauterization of wound was less than that from amputation alone - as the
latter involves the additional insult of a bum. Alternatively, the nature of the insult may be
different in that more damage was inflicted on bony structures rather than cutaneous
tissue. However, the periosteum of bone has a rich supply of nociceptors and fascia i s
also innervated with nociceptors (Bonica, 1990c) . Nonetheless, these results provide a
pa11ial confinnation of the benefit of cautery in surgical amputation as advanced by Lester
et al. ( 1 99 1 a) .
4 . 4 . 3 C o m b i ned reg i m es (LA-Scoop+Cautery)
The virtual elimination of the cortisol response to scoop dehoming throughout the nine
hour period of observation by the prior injection of local anaesthetic and subsequent
cauterizing of the wound was surprising and striking (Fig 4 . 10), especial ly in view of the
marginal reduction effected by cauterising the scoop wounds without prior local
anaesthesia.
The increase in cm1isol concentrations after the local anaesthetic wore off in LA-Scoop
calves demonstrates that there is sufficient pain during this period to elicit a delayed
cortisol rise . Somehow the additional effect of cauterizing the wound prevented the
delayed rise in cm1isol concentrations when the local anaesthetic wore off. The synergistic
effect of the combined regime of local anaesthetic plus cautery is reminiscent of pre
emptive analgesia and merits further investigation .
Woolf and Chong ( 1 993) reviewed the literature on various pain management therapies,
and showed that a knowledge of the physiological mechanisms by which pain is evoked,
and a change in attitude towards providing pain relief before pain is present, results in a
decrease in post-operative pain relief requested by human patients. Originally anaesthesia
was used to allow surgical manipulations, as opposed to pain relief per se. Post-operative
pain relief is often given after pain has manifested. Woolf and Chong ( 1 993) observed

Chapter 4: Alleviation of distress 94
that when the noxious sensory barrage of surgery was blocked by the use of local or
regional anaesthesia there was a reduced intensity and delayed onset in the appearance of
post-operative pain . This has been termed "pre-emptive analgesia" . The suggested
mechanism for thi s phenomenon is that the surgery-induced sensory barrage decreases the
pain threshold, resulting in an increased sensitivity to stimuli including pain (Wall , 1988;
Katz et al. , 1992; Woolf and Chong, 1993). If thi s afferent barrage can be prevented,
through the use of local anaesthetic, then, when the local anaesthetic wears off the
experience of pain is reduced, because there has been no reduction in the pain threshold.
The virtual elimination of the cortisol response to dehorning by the combined regime of
local anaesthesia and cautery may be analogous with the findings of Woolf and Chong
( 1 993). The increase in plasma cortisol concentrations at 3h after dehorning with local
anaesthesia indicates that the nociception at this stage is of sufficient magnitude to elicit a
sizeable cortisol response and, by inference, may sensitize the pain pathways . It has been
suggested that cautery destroys nociceptors in the wound and thereby decreases
nociception (Lester e t al. , 199 l a) . The marginal decrease in the cortisol response
throughout from cauterizing the scoop wounds alone suggests that if the number of
functioning nocireceptors has been decreased by the cautery, then those that remain
functioning have had their threshold decreased (i .e. are sensitized) by the afferent barrage
from dehorning. The mechanism of the effect from the combined regime of local
anaesthetic and wound cautery may be that the local anaesthetic has prevented the
nociceptor banage caused by the amputation of tissues, and hence that there is no change
to the nociceptor pain threshold. Consequently when the local anaesthetic wears off, the
few functional nociceptors have not had a change in their pain threshold and the
magnitude of the noxious stimulation cannot elicit a cortisol surge.
Before commenting on the overall efficacy of this procedure in reducing the pain-induced
distress of dehorning the following points need to be addressed: 1 ) How long does this
analgesic effect last? This study monitored the acute cortisol response. The similarity of
the 36h and pretreatment sample suggests that there was little distress experienced on day
two. 2) Does the apparent analgesia outlast the time required for the wound to properly
heal? This i s impot1ant because as noted above, when third degree burns heal and the
neural tissue is reorganized sharp pain will appear (Freund and Marvin, 1990). 3) Would
this new pain be less noxious overall than that experienced by dehorning alone? 4) Wi 1 1
there be a negative impact on wound healing process? Historical ly cautery has been
applied to wounds where the risk of hemorrhage was greater than the risk from the
attendant delayed healing. It has been recommended to use a firing iron after dehorning to
accomplish haemostasis (Oehme, 1 974) . The marginal decrease in the cortisol response
after cauterizing the scoop wound would not offset the risks of delayed wound healing.

Chapter 4: Alleviation of distress 95
The benefit derived from the combination of local anaesthetic and wound cautery after
scoop dehoming, would need to be weighed against the additional handling and great care
required to can·y out this procedure.
4 . 4 . 4 Crit ique of the experimental des i g n
As discussed i n Chapter three (see 3 .4 .6), the experimental conditions of repeated
handl ing and blood sampling and confinement may have caused additional distress . In a
simi lar expetimental situation repeated handling and blood sampling had no apparent
effect upon the cortisol response (Lester et al. , 1 99 1 b) . Presumably confinement in the
yards was an additional source of di stress for the calves . This confinement would have
frustrated their pursuit of normal activities, such as grazing and walking. However, the
use of appropriate control groups makes allowances for such confounding effects. These
problems could be obviated by the use of remote sampling devices (Ingram et al. , 1 994) .
This study, with its intensive sampling in the first nine hours, monitored only the acute
cortisol responses to dehoming. In order to ful ly assess the distress of dehoming, the
chronic effects such as continued pain or problems associated with wound healing need to
be investigated. The similarity of the 9h and 36 h cmtisol values with the pretreatment
values suggests that there was little di stress experienced on day two.
4 . 4 . 5 Co n c l u s i o n s
The application of local anaesthetic reduced the co1tisol response to dehoming by 50%.
This suggests that there would be merit in investigating the effect of a local anaesthetic or
an anti-inflammatory agent which has a duration of action longer than the response to
dehoming (6h). The combination of local anaesthetic prior to, and cauterizing the wound
after, scoop dehoming, virtual ly abolished the cortisol response to amputation dehoming.
These results suggest that local anaesthetic should be adrllinistered before dehoming and
that if possible scoop wound should be cauterized. However, further research i s needed
to deterrlline the duration of the apparent cautery-induced analgesia, i ts effects upon
wound healing and the practicalities of the additional handling and care required to carry
out this procedure.
4 . 4 . 6 E p i l o g u e
Subsequent work showed that the local anaesthetic merely delayed the response to
dehoming, as opposed to reducing it overall (Petrie e t al. , 1996b ; McMeekan et al . ,
1998a; Sutherland, 1 999; Sutherland et al. , 2002b). This i s in contrast to the findings
here and is discussed in the General Discussion (Chapter s ix) . The virtual elimination of
the cortisol response to dehoming by the combined regime of local anaesthetic plus

Chapter 4: Alleviation of distress 96
cauterizing the scoop wound was confirmed, and in addition, it was shown that cortisol
concentrations remained at Control values for at least 24 hours (Sutherland et al. , 2002a) .

5 5.0
Chapter 5: Behaviour study 97
BEHAVIOURAL RESPONSES OF CALVES TO SCOOP
AMPUTATION DEHORNING WITH AND WITHOUT
LOCAL ANAESTHESIA
ABSTRACT
Dehoming of cattle is a routine husbandry practice which causes significant and marked
di stress that lasts for about six hours (Chapter three), but may be al leviated by local
anaesthesia (Chapter four) . The aim of the current study was to use behavioural indices
to assess the di stress of dehoming and its alleviati on. Changes in behaviour were used
to assess the pain-induced di stress in Friesian calves (six months old, about 1 30 kg,
n=60) during the first 10 h and between 26 and 29 h after amputation dehoming with or
without local anaesthesia (LA) . There were three treatment groups: Control , Scoop and
LA-Scoop. Treatment was conducted in a cattle race. Thirty calves were studied at a
time in three mobs of 10 held in pens . Calf behaviour was recorded on video and on
data sheets using point scan behaviour sampling . There were di stinct behavioural
profi les according to the treatment received. The four behaviours of tail shaking, head
shaking, ear fl icki ng and rumination sati sfied the cri teri a required to use behaviour as
evidence of di stress. The first three behaviours occurred in an inverse relation to
rumination . Calves dehomed without local anaesthetic exhibited a high incidence of tail
shaking, head shaking and ear flicking that lasted for six hours , whereas Control calves
had significantly lower (P<O.OS) incidences of these behaviours and a high incidence of
rumination . When given prior local anaesthetic the behaviour of dehomed calves was
similar (P>0.05) to that of the Control calves for two hours , and thereafter tai l shaking,
head shaking and ear fl icking increased to levels similar to those in the Scoop calves .
Both the physiological study (Chapter four) and the current study suggest that
dehoming is a painful experience that lasts about s ix hours and that the application of
local anaesthetic alleviates that pain for about the first two hours . For thi s reason it i s
recommended that local anaesthetic be admini stered when conducting amputation
dehoming.
5.1 INTRODUCTION
Dehoming of cattle is a routine husbandry practice which may cause short term pain
and distress, but is performed to reduce injury to stock and stockhandlers, to decrease
carcass brui sing and hide damage (Meischke et al. , 1 974), and to improve the handling
of cattle (Anon , 1974 ) . At the time this work was done there had been l i ttle research
conducted to evaluate the distress of dehoming cattle . Using changes in plasma cortisol
concentrations as an index of di stress, amputation dehoming el ic i ted a marked and

Chapter 5: Behaviour study 98
biphasic cort isol response that lasted about six hours and was considered to be an
extremely noxious experience (Chapter three) . Local anaesthesia reduced the dehoming
response for the first three hours, after which there was a small cortisol rise, such that,
overall local anaesthetic reduced the corti sol response by 50% (Chapter four) . B y
contrast, the combination of local anaesthetic and cautery of the scoop wound virtual ly
el iminated the corti sol response to dehomi ng (Chapter four). The aim of the current
study was to assess and further qual i fy the distress of dehorning using behavioural
indices . As there had been no rigourous scientific research evaluating the behavioural
responses of calves to amputation dehorning, the behaviour study i n this thesis was
weighted by compari son with parallel corti sol studies (Chapters three and four) .
Subsequent work, which bui lt on the observations presented here, has been published
(Petrie et al. , 1 995 ; McMeekan et al. , 1 999; S tafford et al. , 2000).
Animals have to contend with a complex dynamic environment where they are
continual ly experiencing physical , soc ial , psychological and environmental factors
including injury and disease, which may compromise their well-being. They have a
variety of biological mechani sms avai lable to cope with challenges. These include,
primari ly , activation of the autonomic nervous system and the HP A -axi s, both of which
are often accompanied by behavioural changes (Moberg, 1985; Stamp-Dawkins , 1 980).
These physiological responses and their outcomes are int imately l inked in a feedback
and feedforward relationship (Dantzer and Mormede, 1983) and are designed to reduce
the effect of the stressor. Increased activity of the HPA-axi s and to a lesser extent
sympathetic outflow are the hallmarks of stress. There is no single rel iable or definit ive
indicator of stress, and i t i s recommended that, if possible, a variety of biological
parameters be measured (Stamp-Dawkins, 1 980). Changes in behaviour are considered
a val id indicator of stress and may have advantages over measuring changes in plasma
cortisol concentrations.
Changes in behaviour are often the first indication that a stress has occurred (Morton
and Griffi ths, 1985; S tamp-Dawkins, 1 980), and an animal's freedom to move may be
one of its most important adaptations to environmental conditions (Martin and Bateson,
1986). Changes in behaviour may also indicate the nature of the stressor and the way i n
which the an imal i s attempting to cope wi th i t (Matthews , 1 992) . Behavioural
measurements are non-invasive and so minimize the complicating effect of sampling
upon the response of the animal, and once categorized may be used by anybody with
minimal expertise if behaviour measurement rules are observed (Fraser and Broom,
1990) .
In ruminant species such as cattle, behavioural responses to many stimuli are subtle and
therefore a good knowledge of normal behaviour i s required (Hinch, 1 994) . The

Chapter 5: Behaviour study 99
apparent absence of abnormal behaviour does not imply that cattle are not stressed, but
rather that they may be better described as " stoi c " (K.J S tafford, personal
communication ) . Cattle are gregarious creatures with social organization based on
dominance hierarchies, making them sensitive to spacing and density changes (Hinch,
1 994) . The initial responses of cattle to a stressor are orientation towards the stimulus,
suppression of normal acti vities, and preparation for fight or flight . Thereafter,
behavioural changes may include increased aggressiveness or decreased amicable
behaviours ; changes in activity level , ei ther the increased activity of frustration at
having the motivation to express a normal behaviour thwarted, or decreased activity and
the adoption of the submissive posture indicative of social tension, pain or i l l -health;
reduction in maintenance behaviours such as grooming, feeding and stretching
associated with changes in appearance and posture ; and with chronic stressors the
possible appearance of stereotypies (Hinch, 1 994) . In addition to these behaviours the
expression of pain may be evinced by vocalization, increased aggression especial ly if
flight is thwarted, favouring of the traumatized area, severely depressed activity and the
adoption of an immobile and unresponsive stance , which may include a fixed stare with
the head and neck extended towards the ground (Hinch, 1994) .
Whi lst ruminant species such as cattle may be less expressive in their behavioural
responses to pain-induced di stress compared to other mammals ( Hinch, 1 994), changes
in behaviour have been assessed following noxious procedures including tai l docking
(Petrie et al. , 1 996a), castration (Robertson et al. , 1 994) and branding (Lay et al. ,
1 992a,b) . In partic ular, cautery di sbudding el ic i ted increased escape behaviours
(including rearing, head pushing, tai l wagging) during, and foot stomping, head
shaking, ear fl icking, vocal ization and restlessness after the procedure (Taschke and
Folsche, 1993, 1995 ; Morisse et al. , 1 995; Petrie et al. , 1 996b) .
5.1 . 1 Interpretative problems
In addition to the interpretative problems associated with the assessment of the
subjective states of pain and stress discussed in section 1 .4 .3 , there can be problems
interpretating behavioural responses per se as demonstrated below.
Behaviours indicative of injury, disease or pain include a change in active (restlessness)
and/or i n act ive ( e . g . inappetance) behaviours (Fraser and B room , 1 990;
e.g. Lester et al. , 1 996). Animals may either increase or decrease their activity to avoid
noxious stimul i . Whi lst studies have been conducted showing changes in behaviour
correlated to presumed distressful experiences, there have also been studies where there
was no apparent change in behaviour fol lowing a presumed noxious experience . For
example, Shutt et al. ( 1 9 87), did not observe any changes in behaviour fol lowing the
presumably painfu l operations of excising the skin around the anus ( mulesing) or

Chapter 5: Behaviour study 1 00
grinding down the teeth in sheep. Such studies have been interpreted in a variety of
ways . In some cases they have been used to infer an absence of pain or distress directly,
or indirectly as a result of stress-induced analgesia, or they have been taken as evidence
that grazing prey species have evolved the capacity to suppress the expression of such
behaviours as a means of improving survival (Shutt et al. , 1 987, 1 988) . The striking
occurrence of agitation behaviours, has led others to overestimate i ts usefulness for
comparing the intensity of di stress. For example, on these grounds Shutt et al. ( 1 988)
and Molony et al . ( 1 993) erroneously concluded that the knife caused less di stress than
the rings for castration and/or tai ling in lambs. Furthermore, these conclusions were not
consistent with their respective cortisol data (Shutt et al., 1 988 ; Kent et al. , 1993) . See
cri tiques of these studies by Melior and Holmes ( 1 988) and Lester et al. ( 1 996). Lester
et al. ( 1 996) concluded that for the behavioural assessment of distress intensity to be
credible, there needs to be a val idating continuum between behaviours, and therefore,
behaviours which are treatment specific cannot be used alone to gauge relat ive
intensities of di stress. In order to address such problems, Mel ior et al. , (2000) advanced
some principles and caveats to guide the quanti tative and quali tati ve evaluation of
physiological (cort isol) and behavioural responses to painful stimuli (see 5 .4 and 1 .4 .3) .
5.1 .2 Aims of study
The objectives of the current study were : 1 ) to characterize the behavioural response of
six-month-old calves to dehorning; 2) to determine i f the administration of local
anaesthetic might mitigate that response; 3) to compare the behavioural changes with
the plasma corti sol concentration changes (Chapter four) ; 4) to determine whether i t i s
possible to identify behaviours el icited by pain-induced distress versus non-noxious
stimul i ; and 5) to determine if i t i s possible to identify behaviours indicative of generic
versus dehoming pain-induced di stress by compari son with other studies.

Chapter 5: Behaviour study
5.2 MATERIALS AND METHODS
5.2.1 Experimental design
101
Sixty male Friesian calves aged fi ve to six months, weighing about 1 30 kg, and
scheduled for dehorning according to usual husbandry practice on a Massey University
farm, were observed in thi s study. Prior approval to conduct thi s study was obtained
from the Massey University Animal Ethics Committee.
The calves were randomly allocated to one of three treatments (n=20 in each case) and
were observed on the two days fol lowing treatment. In order to allow for more accurate
behavioura l monitoring 30 animals were studied at a time. Therefore the study was
spread over two successi ve periods of two days . On days one and two the first 30 calves
were observed, and on days three and four the next 30 calves were simi larly observed.
On the morning of the first day of the study at 0800 h , 30 calves were separated from
the herd, randomly allocated to one of the three treatment groups , and had numbers
spray painted on their backs for identification purposes. Calves receiv ing the same
treatment were handled and penned as a group. Each group of 1 0 calves was tightly
packed into a race where treatment was performed which took about six minutes for the
whole group. Thereafter the group was quietly herded 20 metres into nearby covered
yards (5 x 5 m) with access to water but not food. The allocation of the treatments to
each group was unknown to the observer, although the absence of scoop wounds made
Control calves easy to identify . The calves were observed for 10 hours . Afterwards the
calves were let out to pasture and reunited with the herd. On the morning of the second
day of the study, the same calves were separated from the herd, al located to the yards
according to treatment, a l lowed to settle for two hours and observed for three hours
between 1 000 h and 1 300 h. Thereafter the calves were reunited with the herd.
5.2.2 Treatments
Treatment was performed in a cattle race, wi th two operators moving sequential ly
through the calves, one restraining the calf and the other performing the treatment.
Between animals , the scoop dehorning tool was disinfected (Hibitane concentrate 5%.
Hospital Products, ICI Austral ia) . The amount of horn and sldn ti ssue removed during
dehorning varied depending on the horn size and head movements .
Control n=20
Calves were handled to simulate the restraint required for dehoming but without being
dehorned.

Scoop n=19
Chapter 5: Behaviour study 102
The ca lves were dehorned using an i ndustry standard dehorn ing scoop (Barnes
Dehorners, Stones, USA). The scoop dehorner (Fig 3 . 1 ) has two i nterlocking semi
circular blades (diameter about 45 mm) which when engaged removed the horn and the
adj acent cutaneous tissue, including the germinal tissue of the horn.
LA-Scoop n=20
Local anaesthetic (6 ml of 2% l ignocaine hydrochloride . Ethical Agents l td, Auckland,
New Zealand) was injected near each cornual nerve at a site a l i ttle below the lateral
ridge of the frontal bone (temporal ridge) about halfway between the lateral canthus
(outer corner of the eye) and the horn (Weaver, 1986) (see Fig 4 . 1 ) . Anaesthesia, which
occurs 1 0- 1 5 minutes after l ignocaine administration (Ritchie and Greene, 1990) , was
tested by p1icking the skin around the horn with a hypodermic needle and observing if
there was a response (for instance ear or eye flicks) . If a response to this stimulus did
occur, another 6 ml of local anaesthetic were injected near the corresponding cornual
nerve. Thereafter calves were dehorned as described for Scoop calves. No data were
collected on how many calves required an additional dose of local anaesthetic .
5.2.3 Behaviour measurements
The calf behaviour was recorded using "instantaneous point scan behaviour sampl ing" .
That i s , the number of anilnals exhibiting particular behaviours was scored, as opposed
to the behaviours that a particular calf was exhibit ing. Because of thi s, i t was not
possible to correlate behaviours that may have been expressed simultaneously i n
individual animals . No data were col lected on the duration, frequency or intensity of the
behaviours .
On the first day after treatment behaviours were scored every 1 5 minutes unti l five
hours, and then every 30 minutes unt i l 10 hours after treatment. On the second day after
treatment behaviours were scored every 30 minutes for three hours. The behaviours
scored were:
Behavioural States
Ruminating:
Lying:
Head down :
Behavioural Events
Ear fl icking:
Calves ruminating whi l st either standing or l yi ng.
Calves in sterna] recumbency.
Head below a horizontal plane drawn level wi th the withers
Vigorous shaking of one or both of the ears independently of a
head shake.

Head shaking:
Chapter 5: Behaviour study
Vigorous shaking of the head around a rostral to caudal axis .
103
Tai l shaking: Rapid movement of the tai l to and fro across the calf' s hind
quarters.
Walking: Calves pacing or walking, defined as more than four steps .
Leg scratching: Elevation of hind leg making contact with the head.
Head rubbing: Rubbing of the head on any object or another calf.
Neck extending: Extension of the j aw and neck towards the ground.
Riding: Calves mounting, or attempting to mount another calf.
Vocalizing: Any bawling made by the calves .
Continuous observations
In addition to the scan sampling, continuous monitoring of the calves was conducted to
score any other behaviours not l i sted above. Because head rub, neck extension, leg
scratch , riding and vocal iz ing occurred infrequently they were also monitored and
scored when they occun-ed. These results are not reported here.
Restlessness index
There were three dominant and frequently occurring apparent restless behaviours and
these were summed to produce a "restlessness index" . The separate behaviours that
were summed to produce this value were : tai l shaking, head shaking and ear fl icking. It
is important to note that each behaviour independently exhibited a pattern of incidence
that was similar to the overall pattern of the restlessness.
The term restlessness index is used to di stinguish this, which i s a composi te score of
three behaviours, from the term restlessness score which has been used to describe the
occun-ence of getting up and down in lambs (Melior and Mun-ay, 1 989a).
5.2.4 Data Analyses
General
The data collected were counts of occurrences of behaviours . Such data does not
necessari ly meet the criteria of the normal (gaussian) di stribution and therefore non
parametric stati stical tests should be conducted on them (Lehner, 1 992 ) . However, if the
number of observations i s " large enough" such data may approximate a normal
distribution and parametric tests may be used (Shott, 1 990) . In this case where n=20 i t
was considered safer to conduct non-parametric analyses on the data. The analyses were

Chapter 5: Behaviour study 104
based on i nstantaneous sampling of the occurrences of a behaviour during pre
determined time periods . The time periods were 0-2h , 2-6h , 6- 1 0 h, 0- lOh and 26-29h
after treatment. In each of these intervals there were 8 , 14, 8 , 30 and 7 sampl ings
respectively.
The decision as to which periods of observations should be used for stati stical
comparisons was based upon the need to di stingui sh the behavioural response during
the action of the local anaesthetic and during and after the period of di stress. The
importance of distinguishing the first two hours from the remaining periods was to
examine the effect of the local anaesthetic. The decision to use two hours was based on
the fol lowing : a) the duration of action for lignocaine is about 1 20 minutes (Ritchie and
Greene, 1990); b) the skin prick test indicated a return of sensation to the horn area
about 2 .5 hours after treatment (Chapter four) ; c) the study of the corti sol response to
dehoming with and without local anaesthetic (Chapter four) indicated that analgesia was
effective in delaying the cortisol rise unti l about 2 .5 hours after treatment; and d) these
periods for compari son have been used in simi lar trials (Petrie et al. , 1996a,b). The
reason for comparing the responses before six hours with that after six hours was based
upon data which showed that the cortisol response to dehoming with or without a local
anaesthetic was resolved by six hours (Chapters three and four) . And finally to conduct
many more compari sons, for example, every hour, would have necessi tated a few
hundred tests which would have resulted in too many type 1 and type 2 stati stical errors .
M ann- Whitney test
Mann-Whitney tests were conducted to ascertain i f there were differences between
treatments. Because the data from within-treatment compari sons are usual ly not
independent it is recommended to use the Friedman or Wi lcoxon test (Shott, 1 990,
1 99 1 ) . However, in this study behaviour sampl ing and not calf sampling was scored, i t
was not known whether the calves exhibiting a particular behaviour were the same as
those exhibiting that behaviour at another sampling. Thus the data were neither truly
independent nor truly not-independent (as they could have been the same calves). As i t
was impossible to analyse the data as not-independent they were therefore analysed as
independent. Consequently Mann-Whitney tests, which assume data independence,
were conducted to ascertain if there were any within treatment differences .
The Mann-Whi tney test i s a non-parametric technique for comparing the medians of
two unmatched samples, where the values of the observations are converted into their
ranks. It i s important to note that whi lst the data c i ted in the text and graphs are the
arithmetic mean ± SEM, statistical analyses were conducted on the medians. The Mann
Whitney tests were conducted using Statsview+Graphics software package (Version 2 ,

Chapter 5: Behaviour study 105
Abacus concepts Inc . , USA) . In addition, random manual Mann-Whitney tests were
conducted to check the results [for calculation see Fowler and Cohen ( 1 990)] .
The Mann-Whitney test does not require that the samples be matched, nor does i t
require that there be the same number of sampling observations . It i s worthwhi le noting
that for the within treatment comparisons the first period was two hours long with 8
observations, the middle period was four hours long with 14 observations and the last
period was four hours long with 8 observations. Neither the different number of
observations nor the di fferent duration of the observation periods wil l render the
mathematical analysi s inval id because the number of calves exhibiting the behaviour at
any instant was measured not the total amount of the acti vi ty . For example, the
incidence of tai l shaking not the sum total of tai l flicks was measured. Rather only the
rel iabi l ity and variation of the measurement may be affected, i .e . the rel i abi l i ty of a
short duration event i ncreases with the number of observations (Martin and Bateson,
1 986).
The Mann-Whitney test appeared to break down when compari sons were conducted
where one test group h ad low occurrences of a particular behaviour and the other test
group had no such occurrences. This was manifest as a significant di screpancy in the p
value (probabili ty value) between that adjusted and that not adjusted for ties (values of
equal rank). In fact many statistical tests break down if the observations compare less
than 5% of the total sample [e.g. Chi-square test (Fowler and Cohen , 1 990)] . To get
around thi s problem the fol lowing procedure was fol lowed, ei ther a) the results were
compared with one-way ANOV A - accepting the prob lems of assuming a normal
di stribution, and a 95% agreement was found w i th the Mann-Whi tney 's more
conservative p value; or b) the data used in the analyses were col lected from the whole
observation period (0 - 1 0h) . This produced more data for the comparisons leading to a
more rel iable Mann-Whi tney test. Perhaps , in these cases the statistical result should be
considered less important as there may simply be an underlying biological question
unanswerable through statistics . For example, where there is no difference between two
treatments and one group has a low incidence and another group has no occurrence of
the behaviour, it may be of high biological significance that one group never exhibited
the behaviour.
Data presentation
The data presented in the graphs are the number of cal ves exhibiting a behaviour for the
group (n=20 in each case). Whereas, the data presented in the table are the percentage
(mean ± SEM) of calves exhibit ing a behaviour, for each period. The mean ± SEM
percentage frequency i s shown as this provides additional information about the data
which medians alone fai l to do. Statistical analyses were conducted on the data from

Chapter 5: Behaviour study 106
pre-determined periods, these being 0-2h , 2-6h , 6- l Oh and 0- l Oh , and significant
differences are shown using different letters of the alphabet: a , b and c indicating
differences within treatments ; x , y and z indicating differences between treatments.
The data from day one are graphed, whereas the data from day two after treatment are
onl y reported i n the text and are not graphed. In addit ion, no statistical tests were
conducted on the day two data due to the low incidence of occurrence. However, the
data are described in terms of the mean (± sem) incidence.

5.3 RESULTS
Chapter 5: Behaviour study 107
The experiment went wel l . However, one Scoop calf was withdrawn from the study as i t
went berserk, becoming extremely active and unsettled, running and j umping the fences
after dehoming, which disturbed the other calves in the trial .
The data were analysed and the responses to each treatment were compared. There were
no significant differences between simi larly treated calves i n the two independent
studies, and therefore both sets of data for day one after treatment were pooled.
However, because of insufficient incidences of behaviours from which to check data
independence, the data from day two were not pooled. The results from day one are
discussed separately from those of day two after treatment (Table 5 . 1 ; Table 5 .2
respectively) .
All cal ves were restless for the first 1 5 to 30 min after treatment and their arrival
elicited restlessness in those calves already penned. This restlessness did not necessari ly
correlate with the scan observation t imes. The behaviours that consti tuted this init ial
restlessness were primari ly walking and mi l l ing around, tai l shaking, bawling, head
shaking and ear fl icking. Riding attempts were rare and only occurred in the Control
calves during this settl ing-down period.
5.3.1 Behavioural comparisons (Day one)
Ruminating Control calves
The maximum number of calves ruminating at any one t ime was 60% and this occurred
at 0 .75h after treatment. During the course of the day the mean number of Control
calves ruminating decreased, 28 ± 7% ruminated in the fi rst two hours, 1 5 ± 4%
ruminated during the following four hours and 9 ± 4% ruminated in the last four hours ,
and thi s decrease was significant (P<0.05 Mann-Whitney) (Fig 5 . 1 ) . It i s important to
note the underlying trend of decreasing rumination i n the Control calves when
interpreting the trends in the dehomed calves .
Scoop calves
There was l i tt le or no rumination in Scoop calves (4 ± 3 % 0-2h , 2 ± 1 % 2-6h) unti l the
last period (6- 10h) when a small but stati stical ly significant number of calves (9± 2%)
ruminated (P<0.05 Mann-Whi tney) .
LA-Scoop calves
The maximum number of calves ruminating was 50% and thi s occurred at 0.75h after
treatment. Thereafter the number of calves ruminating decreased significantly from

Chapter 5: Behaviour study 108
20 ± 7% (0-2h) to 2 ± 1 % (2-6h) and then remained at low levels (4 ± 2% 6- 10h )
(P<0.05 Mann-Whitney).
Between treatments
Over the 10 hour observation period the mean n umber of Control calves ruminating
( 1 7 ± 3%) was significantly greater (P<0.05 Mann-Whitney) than that for either Scoop
(4 ± 1 %) or LA-Scoop (7 ± 2%) calves which exhibited similar numbers (Fig 5 . 1 ) .
There was virtual ly no rumination during the first half hour irrespective of treatment.
During the first two hours after treatment the number of LA-Scoop calves (20 ± 7%)
and Control calves (28 ± 7%) ruminating was s imi lar (P<0.05 Mann-Whitney). The
number of LA-Scoop calves ruminating between 2 and 6h was simi lar to the number of
Scoop calves ruminating between 0 and 6h and both were significantly less than that of
Control cal ves for the correspondi ng periods. But , during the last period (6- 10h) there
were no differences between Control (9 ± 4%) LA-Scoop (4 ± 2%) or Scoop (9 ± 2%)
calves (P>0.05 Mann-Whitney).
Tail shaking Control calves
The mean number of Control cal ves tai l shaking ( 1 2 ± 1 %) over the ten hours was
di stributed as 9 ± 3% during the first two hours, 1 7 ± 1 % during the next four hours and
8 ± 2% during the last four hours (Fig 5 .2) . The number of calves tai l shaking in the
middle period (2-6h) was significantly greater than that in both the earl ier (0-2h) and
later (6- 10h) periods (P<0.05 Mann-Whitney).
Scoop calves
There were no differences in the number of Scoop cal ves tai l shaking over time (0-2h
26 ± 3%, 2-6h 3 1 ± 3%, and 6- l Oh 23 ± 2%) (P>0.05 Mann-Whitney) .
LA-Scoop calves
The number of LA-Scoop calves tai l shaking in the first period (0-2h 9 ± 2%) was
significantly less (P<0.05 Mann-Whitney) than that in the next two periods (2-6h
37 ± 3%, 6- 10h 27 ± 5%), which were simj lar.
Between treatments
Over the 10 hour observation period the mean number of Control calves tai l shaking
( 1 2 ± 1 % ) was significantly less (P<0.05 Mann-Whitney) than that tai l shaking for
either Scoop (28 ± 2%) or LA-Scoop (27 ± 3%) calves which were simi lar (Fig 5 .2) .

Chapter 5: Behaviour study 109
The number of Scoop and LA-Scoop calves tai l shaking was significantly greater than
those of the Control calves for most periods except the first period (0-2h) in LA-Scoop
calves when the number of calves tai l shaking was s imi lar to that in Control calves.
Head shaking Control calves
There were only three incidences of head shaking in Control calves and these occurred
at about one hour after treatment (Fig 5 .3) .
Scoop calves
Scoop calves exhibited a h igh incidence of head shaking for the first six hours (0-2h
19 ± 4%, 2-6h 1 5 ± 2%) followed by a significant decrease to minimal levels (6- 1 0h
2 ± 1 %) . The maximum number of calves head shaking (45%) at any one time occurred
at the first observation (0.25h) .
LA -Scoop calves
In LA-Scoop calves there was a low incidence of head shaking in the first period (0-2h
6 ± 2%) , most of which occurred in the fi rst hour, and this was significantly less than
that in the next period (2-6h 1 3 ± 2%). This was fol lowed by a smal l decrease in head
shaking during the last period (6 - 1 0h 1 1 ± 3%), which was of intermediate magnitude
between the former two periods and stati stical ly s imi lar to both (P>0.05 Mann
Whitney).
Between treatments
Over the 10 hour observation period the mean number of Control calves head shaking
(0.5 ± 0.4%) was signi ficant ly less (P<0 .05 Mann-Whitney) than that for e i ther
LA-Scoop ( 10± 1 %) or Scoop ( 1 3 ± 2%) calves which were simi lar (Fig 5 .3) .
Calves which were dehomed with or wi thout local anaesthetic had a significantly higher
(P<0.05 Mann-Whitney) incidence of head shaking in most periods than Control calves
except for the LA-Scoop calves in the first period (0-2h) and Scoop calves in the l ast
period (6- 10h) when values were similar to those in Control calves .
Ear flicking Control calves
There were only three incidences of ear flicking in Control calves and these occurred at
about one hour after treatment (Fig 5 .4).
Scoop calves
Scoop calves exhibited a h igh incidence of ear fl i cking for the first six hours . The
number of calves ear fl icking in the first period (0-2h 14 ± 3%) was significantly

Chapter 5: Behaviour study 110
greater than that in the second period (2-6h 7 ± 2%) which was fol lowed by a
significant decrease to minimal levels in the last period (6- 1 0h 4 ± 2%). The maximum
number of calves ear flicking (35%) occurred at the first observation (0.25h) .
LA-Scoop calves
LA-Scoop calves exhibited a low incidence of ear fl icking i n the first period (0-2h)
(4 ± 3%), most of which occurred in the first hour, fol lowed by a significant i ncrease in
ear fli cking (2-6h 1 5 ± 2% ; 6- 10h 14± 4%) (P<0.05 Mann-Whitney).
Between treatments
Over the 10 hour observation peri od the mean number of Control calves ear fl icking
(0.5 ± 0.4%) was s ignificant ly less (P<0.05 Mann-Whi tney) than that for e i ther
LA-Scoop ( 1 2 ± 2%) or Scoop (8 ± 1 %) calves which were simi lar (Fig 5 .4).
Cal ves which were dehorned with or without local anaesthetic had a significantly higher
(P<0.05 Mann-Whitney) incidence of ear fl icking in most periods than Control calves
except for the LA-Scoop calves i n the first period (0-2h) when values were simi lar to
those in Control calves.
Neck extending and leg scratching to face (infrequent) The numbers of calves exhibiting e i ther of these behaviours were low and the incidence
infrequent, rendering analyses for the three partial periods unre l iable . Analyses on the
data from the whole observation period (0- 10h) were rel iable and are reported here:
Neck extending
There were no occurrences of neck extending in Control calves. Over the 10 hour
observation period there few (0.7 ± 0.4%) occurrences of neck extending in LA-Scoop
calves and this was statistically simi lar to that i n Control calves (P>0.05) . The incidence
of neck extending in both Control and LA -Scoop calves was less than that in Scoop
cal ves (2 ± 1 %. P<0.05) . The instances of neck extending in LA-Scoop calves
occurred between 3 and 4 .25h whereas neck extending in Scoop calves occurred
between 0 and 5h (Fig 5 .5 ) .
Leg scratching to face
Over the 10 hour observation period the number of Control calves scratching their face
with their hind leg (0.2 ± 0.2%) was significantly less (P<0.05 Mann-Whitney) than that
for either LA-Scoop (2 ± 1 %) or Scoop (3 ± 1 %) calves which were themselves simi lar.
There was no apparent pattern over time (Fig 5 .6) .

Lying and Walking (time of day)
Chapter 5: Behaviour study 1 1 1
Other than an init ia l period (0 -0. 5h ) o f restlessness which affected the amount of
walking and lying, both behaviours appeared to be related to the time of day rather than
the treatment recei ved. Walking behaviour appeared to occur as the compliment of lying
which is expected because walking and lying are mutual ly exc lusive behaviours . But
walking i sn't exactly the compliment of lying - as the missing component of standing
has not been included.
Lying
Within each treatment there was an increase in the number of calves lying during the
course of the day (Table 5 . 1 ), these increases were statistical ly significantly as fol lows:
for Control calves the number lying in the first two periods (0-2h 3 ± 1 % , 2-6h
5 ± 2%) was less than that lying in last period (6- l Oh 1 8 ± 4%), whereas for LA-Scoop
calves the number lying during each successive period was greater than in the previous
period (0-2h 0 ± 0%, 2-6h 8 ± 1 %), 6- l Oh 1 8 ± 3%), and for Scoop calves the number
lying in first period (0-2h 0 ± 0%) was less than that in the last two periods (2-6h
1 8± 3%, 6- 10h 29 ± 4%).
Between treatments
Over the 10 hour observation period the number of Scoop calves lying ( 1 6 ± 3%) was
significantly greater than that for either LA-Scoop (9 ± 2%) or Control (8 ± 2%) calves
which were simi lar (P<0.05 Mann-Whitney). During the day th is pattern of scoop
calves lying the most occuned but was only significant in the middle period (2 -6h) .
Walking
Within each treatment there was a decrease in the number of calves walking over the
course of the day (Table 5 . 1 ), these decreases were stati stically significant ly as fol lows:
for both Control and Scoop calves the number walking in the first two periods (Control :
0-2h 7 ± 2%, 2 -6h 4 ± 1 %; Scoop : 0-2h 1 1 ± 3%, 2-6h 9 ± 2%) was greater than in
the last period (for both 6- 10h Q±. 0%), whereas for LA-Scoop calves the number
walking in the middle period (2-6h 13 ± 2%) was greater than i n the first (0-2h
6 ± 4%) and in the last period (6- 1 0h 4 ± 2%).
Between treatments
Over the 10 hour observation period the number of LA-Scoop calves walking (9 ± 2%)
was significantly greater than that for Control calves (5 ± 2%) whereas the number of
Scoop calves walking was of intermediate value (7 ± 2%) and not significantly different
from either.

Chapter 5: Behaviour study
Vocalization and riding (external events) Vocalization
112
Incidences of bawl ing appeared to be sporadic and occurred in response to external
events such as being mustered into the yards, and the mustering of other stock nearby.
Such external events did not necessari ly occur at the predetermined scan time.
Riding
Over the course of the entire study there were only four riding attempts observed. These
were initiated by Control calves during the init ial settling period and three of them were
by the same calf.
Head rubbing and head down (no pattern) Head rubbing
The number of cal ves head rubbing was low and the incidence infrequent (Table 5 . 1 ) ,
rendering analyses for the three periods unreliable. Analyses on the data from the whole
observation period (0- 1 Oh) are rel i able and are reported here. Over the 1 0 hour
observation period there were no di fferences between treatments in the number of
calves head rubbing (Control : 3 ± 1 %, LA-Scoop: 2 ± 1 % , Scoop: 2 ± 1 % ).
Head down
Over the 1 0 hour observation period there were no differences between treatments in the
number of calves with their heads down (Control : 5 5 ± 3%, LA-Scoop: 56 ± 2%,
Scoop: 52 ± 2%) (Table 5 . 1 ) .
Restlessness index (day one) The dominant and frequently occurring behaviours of tai l shaking, head shaking and ear
fl icking are now di scussed on terms of a summed index as described in section 5 . 2
(Fig 5 .7) .
Control calves
The mean incidence of restlessness in Control calves (0- 10h 1 3 ± 2%) was low . There
were minor but significant differences between periods : the restlessness in the second
period (2-6h 1 7 ± 1 %) was significantly greater than that in the last period (6- 10h
8 ± 2%) and both were simi lar to that in the first period (0-2h 1 3 ± 5%) (Table 5 . 1 )
(P<0.05 Mann-Whitney) .
Scoop calves
Scoop calves exhibited a h igh incidence of restlessness for the first s ix hours (0-2h
59 ± 9%, 2-6h 53 ± 5 %) fol lowed by a significant decrease in restlessness thereafter
(6- 10h 3 1 ± 3%).

LA-Scoop calves
Chapter 5: Behaviour study 113
There was a low incidence of restlessness in LA-Scoop calves during the first period
(0-2h 19± 4%), most of which occurred in the first hour, and th is was significantly less
than that between 2 and 10h (2-6h 64 ± 6%; 6- 1 0h 52 ± 10%) (P<0.05 Mann
Whitney).
Between treatments
Over the 10 hour observation period the mean incidence of restlessness in Control
calves ( 1 3 ± 2%) was significantly less than that for either LA-Scoop (49± 5 % ) or
Scoop (49 ± 4%) calves which were simi lar (P<0.05 Mann-Whitney) (Fig 5 .7) .
Calves which were dehorned with or without local anaesthetic had a significantly higher
incidence of restlessness in most periods than Control calves except for the LA-Scoop
calves in the first period (0-2h) when values were simi lar to those in Control calves
(P<0.05 Mann-Whitney).
5.3.2 Summary of the behaviour of Control , Scoop and LA-Scoop ca lves
(day one)
All calves were restless for the first 0 .5 hour after treatment. Thereafter, the main
di fferences in the behaviour of calves, according to treatment, were in changes of the
pattern of restlessness over time and in the occurrence of rumination, which appeared to
exhibit an inverse re lationship to each other. The separate behaviours of tai l shaking,
head shaking and ear fl icking were summed to produce a "restlessness index" . I t i s
important to note that each behaviour independently exhibited a pattem of incidence
that was similar to the overall pattern of restlessness.
Behaviour of Control calves The Control calves stood sti l l and ruminated with decreasing incidence throughout the
observation period (Fig 5 .7 ) . There were on ly three occurrences each of head shaking
and ear fl icking, and two of those coincided with the passing of a rai lway train nearby
(about 100 m) which aroused all calves regardless of treatment. Over the 10 hour study
period about 1 2% of the Control calves fl icked their tai ls intermittently and the
incidence of walking was low (5 ± 2%), did not occur after six hours, and its nature was
a slow amble of a few paces. The incidence of head rubbing was low (3 ± 1 %) and
infrequent. There was only one occurrence of a leg scratch and this was to the eye
region. Neck extending did not occur in this group.
Behaviour of Scoop calves Scoop calves exhibited a high level of restlessness immediately after treatment which
lasted for six hours (Fig 5 .7 ) . This activity was consti tuted predominantly from 28% of

Chapter 5: Behaviour study 1 14
the calves tai l shaking, 1 8% head shaking and 1 2 % ear flicking. In addition, there was
some ( 1 0%) walking (pacing) and low sporadic i ncidences of neck extension and leg
scratch to face occurred ( <3% for both . Note that all numbers are the weighted means of
the first and second periods) . Neck extension did not occur after five hours and leg
scratch occurred sporadical l y with no apparent time course pattern. There was virtually
no rumination (2 . 5% 0-6h) .
S ix hours after treatment the i ncidence of those behaviours had decreased (head
shaking, ear flicking and pacing <4% for each) except for tai l shaking which appeared
to continue at high levels (24% ). The incidence of rumination increased and approached
levels s imi lar to those in the Control calves.
Behaviour of LA-Scoop calves For the first two hours after treatment the behaviour of LA-Scoop calves was simi lar to
that of Control calves : 20% of the calves were ruminating, 9% tai l fli cking and there
was virtual ly no head shaking, ear fl icking or walking ( <6% for each) (Fig 5 .7) . After
two hours restlessness increased and remained high . Like Scoop calves between 0-6h,
thi s acti vi ty was reflected primari ly by 37% of the calves tai l shaking, 1 3 % head
shaking and 1 5 % ear fl icking. In addition, there was some (3%) pacing (walking) and
there were low and infrequent incidences of leg scratching and neck extending (<4% for
each) . Leg scratching occurred without pattern for the first seven hours and neck
extending only occurred between 3.25 and 4.25 hours after treatment.
Whilst the restlessness index in the last period (6- l Oh 52%) was statistical ly simi lar to
that in the middle period (2-6h 64%) there was an obvious decrease in restlessness after
7 .5h , but this decrease was rendered invisible by the grouping of the data. Between 6
and l Oh the number of calves ruminating was simi lar to that in Control calves (P>0.05);
this appears to be as a result of decreasing levels in the Control group.
5.3.3 Behavioural comparisons (Day two)
It was not possible to analyse the data from day two using the Mann-Whi tney test
because of the low i ncidence of all behaviours, the only exception being tail shaking
and rumination . Having remarked so, there appeared to be no differences between
treatments on e ither study day . But, there appeared to be some differences in the
behaviour and bleeding in calves according to the day the study was conducted (see
discussion 5 .4 .5) . It is possible that weather played a role . For that reason the day two
data from the different studies are discussed separately . The fol lowing reports the four
behaviours of rumination, tai l shaking, head shaking and ear fli cking (see Table 5 .2) .

Chapter 5: Behaviour study 1 15
In the first study the weather was sunny and hot, and there appeared to be a lot of flies
present. There were no apparent differences between treatments in the incidence of tail
shaking (Control 9±2%; Scoop 1 5±2% ; LA-Scoop 1 3±2%) or rumination (Control
1 4±4%; Scoop 1 1±2%; LA-Scoop 1 2t3%) . For both tail shaldng and rumination the
level s observed on day two were simi lar to those exhibited by the Control calves on day
one (2-6h) . For both, the data were acquired at the same time of the day . Head shaking
and ear fl icking were not observed in Control calves and were infrequent in calves
dehomed with or without local anaesthetic .
In the second study i t rained all day, was co ld and flies were scare. There appeared to be
no differences in behaviour between treatments. The incidence of rumination was low
(Control 6±3%; Scoop 6±3 %; LA-Scoop 9±2%) and there was no tai l shaldng or head
shaldng and only one ear flick was observed.
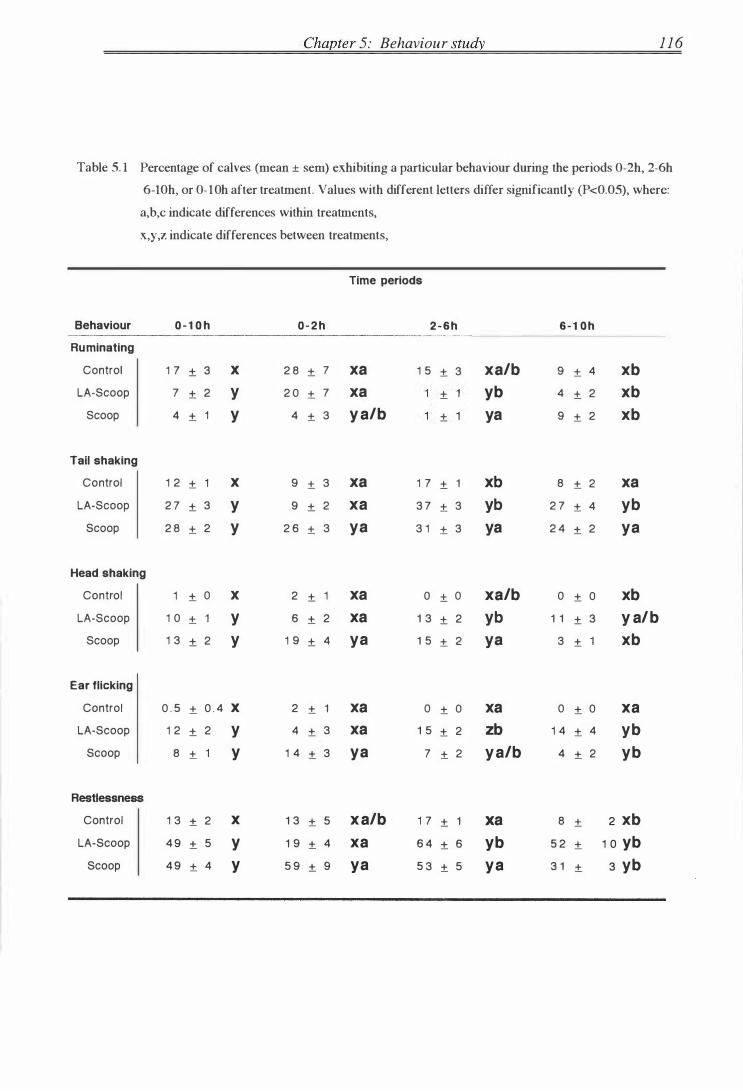
Chapter 5: Behaviour study 1 16
Table 5. 1 Percentage of calves (mean ± sem) exhibiting a particular behaviour during the periods 0-2h, 2-6h
6-lOh, or 0- lOh after treatment. Values with different letters differ significantly (P<O.OS), where:
a,b,c indicate differences within treatments,
x,y ,z indicate differences between treatments,
Time periods
Behaviour 0 - 1 0 h 0 - 2 h 2 - 6 h 6 - 1 O h
Ruminating
Control 1 7 ± 3 X 2 8 ± 7 xa 1 5 ± 3 xa/b 9 ± 4 xb LA-Scoop 7 ± 2 y 2 0 ± 7 xa ± yb 4 ± 2 xb
Scoop 4 ± y 4 ± 3 y a/b ± ya 9 ± 2 xb
Tall shaking
Control 1 2 ± X 9 ± 3 xa 1 7 ± 1 xb 8 ± 2 xa LA-Scoop 2 7 ± 3 y 9 ± 2 xa 3 7 ± 3 yb 2 7 ± 4 yb
Scoop 2 8 ± 2 y 2 6 ± 3 ya 3 1 ± 3 ya 2 4 ± 2 ya
Head shaking
Control 1 ± 0 X 2 ± 1 xa 0 ± 0 xa/b 0 ± 0 xb LA-Scoop 1 0 ± y 6 ± 2 xa 1 3 ± 2 yb 1 1 ± 3 y a/b
Scoop 1 3 ± 2 y 1 9 ± 4 ya 1 5 ± 2 ya 3 ± xb
Ear flicking
Control 0 . 5 ± 0 . 4 X 2 ± 1 xa 0 ± 0 xa 0 ± 0 xa LA-Scoop 1 2 ± 2 y 4 ± 3 xa 1 5 ± 2 zb 1 4 ± 4 yb
Scoop 8 ± y 1 4 ± 3 ya 7 ± 2 y a/b 4 ± 2 yb
Restlessness
Control 1 3 ± 2 X 1 3 ± 5 xa/b 1 7 ± 1 xa 8 ± 2 xb LA-Scoop 4 9 ± 5 y 1 9 ± 4 xa 6 4 ± 6 yb 5 2 ± 1 0 yb
Scoop 4 9 ± 4 y 5 9 ± 9 ya 5 3 ± 5 ya 3 1 ± 3 yb

Table 5. 1 cont.,
Behaviour 0 - 1 0 h
Neck extendi ng•
Control
LA-Scoop
Scoop
0 ± 0 X 0 . 7 ± 0 . 4 X
2 ± y
Leg scratching to face•
Control 0 . 2 ± 0 . 2 X
LA-Scoop
Scoop
Walking••
Control
LA-Scoop
Scoop
Lying••
Control
LA-Scoop
Scoop
Head rubbing#*
Control
LA-Scoo p
Scoop
Head down#
Control
LA-Scoop
Scoop
2 ± 3 ±
y
y
5 ± 2 X
9 ± 2 y 7 ± 2 x/y
8 ± 2 X
9 ± 2 X
1 6 ± 3 y
3 ± X
2 ± 1 X
2 ± X
5 5 ± 3 X
5 6 ± 2 X
5 2 ± 2 X
Chapter 5: Behaviour study
Time periods
0 - 2 h
o ± o xa
o ± o xa
4 ± 2 ya
o ± o xa
2 ± 3 ±
xa
xa
7 ± 2 xa
s ± 4 xa
1 1 ± 3 xa
3 ± xa
o ± o xa
o ± o xa
3 ± 2 ± 6 ±
x/y a
ya
xa
4 9 ± 6 xa/b
5 1 ± 3 xa
4 8 ± 5 xa
2 - 6 h
o ± o xa
± xa
2 ± xa/b
o ± o xa
3 ± 2 ±
4 ± 1 1 3 ± 2
9 ± 2
ya
x/y a
xa
yb
x/ya
5 ± 2 xa
8 ± xb
1 8 ± 3 yb
3 ± 3 ±
±
xa
xa
xb
6 3 ± 3 xb
5 5 ± 4 x/ya
5 4 ± 2 ya
• behaviours occurring with low incidence
6 - 1 O h
0 ± 0
0 ± 0
0 ± 0
0 ± 0
± 2
4 ± 4
6 ± 6
4 ± 2
0 ± 0
1 8 ± 4 1 8 ± 3
2 9 ± 4
±
±
± 1
4 8 ± 4
6 0 ± 4
5 2 ± 3
behaviours where the pattern of incidence appears related to the time of day not treatment
# behaviours with no apparent pattern of incidence
xa
xa
xb
xa
xa
xa
xa
xa
xb
xb
XC
xb
xa
xa
xb
xa
xa
xa
1 1 7

Chaeter 5: Behaviour study 1 18
20 1 9
Contro l : Ruminating 18 1 7 1 6
X 1S "' 14 a.> 13 >
x b -;;; 12 x a / b u 1 1 ...... 0 IO .....
9 a.> ..0
8 E ::> 7 z 6
s 4 3 2 I 0
l/) 0 l/) 0 l/) 0 l/) 0 l{) 0 l{) 0 l/) 0 l{) 0 l/) 0 l/) 0 0 0 0 0 0 0 0 0 0 0
� l/) r-- � "'! u: r-: 0 N l/) r-- � N l{) r-- 0 N l/) r-- 0 u: 0 l/) 0 l/) 0 l/) 0 l/) � 0 0 0 N N N N M M M M ..,f ..,f ..,f ..,f Lri l/) \C) \C) r...: r-- 00 00 o\ o\ 0 -
Time (h)
20 I9
LA-Scoop : Ruminating I8 I 7 I 6 y I S
"' I 4 y b x b � 13 x a
-;;; I 2 u u 0 I O ..... 9 a.> ..0 8 E ::> 7 z 6
5 4 3 2 I 0
l{) 0 l/) 0 l{) 0 l{) 0 l{) 0 l/) 0 l/) 0 l{) 0 l/) 0 l/) 0 0 0 0 0 0 0 0 0 0 0 N l{) r-- � � u: r-: 0 N l{) r-- 0 N l{) r-- 0 N l{) r-- � u: 0 l{) � l/) 0 l/) � l{) 0
0 0 0 N N N N M M M M ..,f ..,f ..,f ..,f l{) l/) \C) \C) r-- r...: 00 00 0\ o\ 0
Time (h)
20 I9
Scoop : Ruminating I8 I 7 I 6 y I S
"' I 4 y a / b � I3 y a x b -;;; 1 2
u u 0 10 ..... 9 a.> ..0 8 E ::> 7 z 6
s 4 3 2 1 0
l{) 0 l{) 0 l/) 0 I.(') 0 I.(') 0 I.(') 0 I.(') 0 I.(') 0 I.(') 0 l{) 0 0 0 0 0 0 0 0 0 0 0 N l{) r-- � "'! u: r-: 0 N I.(') r-- � � u: r-- 0 N l{) r-- 0 I.(') 0 I.(') 0 I.(') 0 l{) 0 I.(') 0
0 0 0 N N N N M M M M ..,f ..,f ..,f ..,f lfi lfi \C) \C) r...: r...: 00 00 o\ o\ 0 -Time (h)
Fig 5 . 1 Number of calves ruminating after treatment. Analyses were conducted for the periods: 0-Zh, 2-6h, 6-l Oh & 0-lOh. Values with different letters differ significantly (P<O.OS. Mann-Whitney) , where:
a,b,c indicate differences within treatments, x,y,z indicate differences between treatments.

V) "' ;> -;;; u ..... 0 .... "' ..c E ::J
z
V) "' ;> -;;; u ..... 0 .... "' ..c E ::J z
V) "' ;> -;;; u ..... 0 .... "'
..c E ::J z
20 1 9 1 8 1 7 1 6 1 5 1 4 1 3 x a 12 1 1 10 9 8 7 6 5 4 3 2 1 0
1./"l 0 1./"l 0 1./"l 0 1./"l 0 N 1./"l r-- � "'! ""! r-: 0
ci ci ci N
20 19 -18 -1 7 -16 -15 -14 -1 3 -1 2 - x a 1 1 -10 -9 -8 -7 -6 -5 -4 -
Chapter 5: Behaviour study
C o ntrol : Tail fl icking
X
x b
1./"l 0 1./"l 0 1./"l 0 1./"l 0 1./"l 0 1./"l N 1./"l r-- � N 1./"l r-- 0 N 1./"l r--
N N N (V") M M M '<i '<i '<i '<i
Time (h)
0
� 1./"l
LA- Scoop : Tail fl icking
y
y b
1 19
x a
0 0 0 0 0 0 0 0 0 0 ""! 0 1./"l 0 1./"l 0 1./"l � 1./"l 0
1./"l "' "' r--: r--: oci oci (]-. o\ ci ......
y b
3
�u, l!ll!l n ll l!l I 2
I 1 0 I
1./"l 0 1./"l 0 1./"l 0 1./"l 0 1./"l 0 1./"l 0 1./"l 0 1./"l 0 1./"l 0 1./"l 0 0 0 0 0 0 0 0 0 0 0 N 1./"l r-- � "'! ""! r-: 0 N 1./"l r-- 0 N 1./"l r-- 0 N 1./"l r-- � 1./"l 0 1./"l 0 1./"l 0 1./"l 0 1./"l 0
ci ci ci N N N N M M M M '<i '<i '<i '<i 1./"l vi "' "' r--: r--: oci oci o\ o\ ci
Time (h)
20 19 -
Scoo p : Tail flicking 18 -1 7 -1 6 - y 15 -14 -1 3 -1 2 - y a y a y a 1 1 -1 0 -9 -8 -7 -6 -5 -4 -3 -
11 Jl I 11 2 -1 -0
1./"l 0 1./"l 0 1./"l 0 1./"l 0 1./"l 0 1./"l 0 1./"l 0 1./"l 0 1./"l 0 1./"l 0 0 0 0 0 0 0 0 0 0 0 N 1./"l r-- � "'! ""! r-: 0 N 1./"l r-- 0 N 1./"l 1'- 0 N 1./"l r-- 0 ""! 0 1./"l 0 1./"l 0 1./"l 0 1./"l 0
ci ci ci ...... ...... N N N N M M M (V") '<i '<i '<i '<i vi l/") "' "' r--: r--: oci oci o\ o\ ci
Time (h)
Fig 5.2 Number of calves tail flicking after treatment. Analyses were conducted for the periods: 0-2h, 2-6h, 6-lOh & 0-lOh. Values with different letters differ significantly (P<O.OS. Mann-Whitney), where:
a,b,c indicate differences within treatments, x,y,z indicate differences between treatments.

Chaeter 5: Behaviour study 120
20 1 9 Control : Head shaking 18 1 7 16 X 1 5
"' 14 � 13 -;;; 12 x a x a x a u l l o 10 ..... 9 Q) ..c 8 E ::> 7 z 6
5 4 3 2 1 0
l(") 0 l(") 0 l(") 0 l(") 0 l(") 0 l(") 0 l(") 0 l(") 0 l(") 0 l(") 0 0 0 0 0 0 0 0 0 0 0 N l(") r-- � "'l lf! I': 0 N l(") r-- � "'l l(") r-- 0 N l(") r-- 0 l(") 0 l(") 0 l(") 0 l(") � l(") 0
0 0 0 N N N N M M M M � � � � vi vi 0 0 r-..: r-..: cx:i cx:i 0.. o\ 0
Time (hrs)
20 19
LA-Scoop : Head shaking 18 17 16 y 1 5
"' 14 � 13 -;;; 1 2 u u 0 10
x a y b y a / b ..... 9 Q) ..c 8 E ::> 7 z 6
5 4 3 2 1 0
l(") 0 l(") 0 l(") 0 l(") 0 l(") 0 l(") 0 l(") 0 l(") 0 l(") 0 l(") 0 0 0 0 0 0 0 0 0 0 0 N l(") r-- � "'l lf! I': 0 N l(") r-- � N lf! r-- 0 N l(") r-- � lf! 0 l(") 0 l(") 0 l(") 0 l(") 0
0 0 0 N N N N M M M M � � � � l(") l(") 0 0 r-..: r-..: cx:i cx:i o\ o\ 0 ...... Time (hrs)
20 1 9
Scoop : Head shaking 1 8 1 7 1 6 y 15
"' 14 � 13 y a x b -;;; 1 2
u l l 0 10 ..... 9 Q) ..c 8 E ::> 7
z 6 5 4 3 2 1 0
l(") 0 l(") 0 l(") 0 l(") 0 l(") 0 l(") 0 l(") 0 l(") 0 l(") 0 l(") 0 0 0 0 0 0 0 0 0 0 0 N l(") r-- � "'l lf! r-- 0 N l(") r-- � "'l l(") r-- 0 N l(") r-- � l(") 0 l(") 0 l(") 0 l(") 0 l(") 0
0 0 0 ...... N N N N M M M M � � � � l(") vi 0 0 r-..: r-..: cx:i cx:i o\ o\ 0 ...... Time (h)
Fig 5.3 Number of calves head shaking after treatment. Analyses were conducted for the periods: 0-2h, 2-6h, 6-lOh & 0-l Oh. Values with different letters differ significantly (P<O.OS. Mann-Whitney) ,
a,b,c indicate differences within treatments, x,y,z indicate differences between treatments.

Chaeter 5: Behaviour study 121
20 19
C ontro l : Ear flicking 18 1 7 1 6 X 1 5
"' 14 � 13
x a x a x a c;; 1 2 u u 0 10 .... 9 "' ..0 8 E ::l 7 z 6
5 4 3 2 1 0
ll'l 0 ll'l 0 ll'l 0 ll'l 0 ll'l 0 ll'l 0 ll'l 0 ll'l 0 ll'l 0 ll'l 0 0 0 0 0 0 0 0 0 0 0 N ll'l r-- � � V! 1"': 0 N ll'l r-- � � V! r-- 0 N ll'l r-- � ll'l 0 ll'l 0 ll'l 0 ll'l 0 ll'l 0
c) c) c) ...... N N N N M M M M -.:i -.:i -.:i -.:i ll'l ll'l 0 0 r' r' cxi oci 0: 0: c) ......
Time (h)
20 1 9
LA-Scoop : Ear flicking 1 8 1 7 1 6 y 15
"' 14 y b "' 13 z b > x a c;; 12 u
..... 1 1 0 1 0 .... "' 9 ..0 E 8 ::l 7 z
6 5 4 3 2 1 0
ll'l 0 ll'l 0 ll'l 0 ll'l 0 ll'l 0 ll'l 0 ll'l 0 ll'l 0 ll'l 0 ll'l 0 0 0 0 0 0 0 0 0 0 0 N ll'l r-- � � V! 1"': 0 N ll'l r-- � N V! r-- 0 N ll'l r-- � ll'l 0 ll'l 0 ll'l � V! 0 ll'l 0
c) c) c) N N N N M M M M -.:i -.:i -.:i -.:i ll'l ll'l 0 0 r' r' 00 00 0: 0: c) ......
Time (h) 20 19
Scoop : Ear flicking 18 1 7 1 6 y 15
"' 14 "' 1 3 y a y a / b y b > c;; 1 2 u 1 1 ..... 0 1 0 .... 9 "' ..0
8 E :::l 7 z 6
5 4 3 2 1 0
ll'l 0 ll'l 0 ll'l 0 ll'l 0 ll'l 0 ll'l 0 ll'l 0 ll'l 0 ll'l 0 ll'l 0 0 0 0 0 0 0 0 0 0 0 N ll'l r-- � C'! V! 1"': 0 N ll'l r-- � N V! r-- 0 N ll'l r-- 0 V! 0 lO 0 ll'l 0 ll'l 0 ll'l 0
c) c) c) ...... ...... ...... N N N N M M M M -.:i -.:i -.:i -.:i o.ri lO 0 0 r' r' oci oci 0: 0: c) ......
Time (h)
Fig 5.4 Number of calves ear flicking after treatment. Analyses were conducted for the periods: 0-2h, 2-6h, 6-lOh & 0-lOh. Values with different letters differ significantly (P<O.OS. Mann-Whitney) , where:
a,b,c indicate differences within treatments, x,y,z indicate differences between treatments.

20
1 9 18
1 7
1 6
1 5
1 4
1 3
;g 12 ;> ""§ 1 1
� 1 0 Q) "E 9
z 8
7
6
5
4
3
2
Chapter 5: Behaviour study
Neck extending
• Control X
D Scoop y
IS1 LA-Scoop x
122
1
o�r-�,-����������r-���-T�--r-�.--.��r-r-,-��-,--r-,-lfl 0 lfl 0 lfl "! lfl r- � "! 0 0 0
Time (h)
0 0 0 0 0 0 0 0 0 0 0 0 lfl 0 lfl 0 lfl 0 lfl 0 lfl 0 � � � � � � 00 00 � � 0 ......
Fig 5 .5 Number of calves neck extending after treatment for the lOh observation period only. Different
20
19 18
1 7
1 6
1 5
14
13
letters (x, y, and z ) indicate significant differences between treatments (P<0.05) .
Leg scratching to face
:a 12 • Control x ;> ""§ 1 1 "-� 10 Q) "E 9 z 8
7
6
5
4
3
2
D Scoop y
� LA-Scoop y
1
o�r-¥-������,--.-T���--��LT���,-���m-��,--.�����
Time (h)
lfl 0 lfl 0 0 0 0 0 0 0 0 0 0 0 N lfl r- 0 lfl 0 lfl 0 lfl 0 lfl 0 lfl 0 � � � � � � � � � 00 00 � � 0 ......
Fig 5 .6 Number of calves leg scratching to face after treatment for the l Oh observation period only . D ifferent letters (x, y , and z) indicate significant differences between treatments (P<O.OS) .

Fig 5 .7
40
30
-
] bl}
E 20 .... c <!) E � u
.5 0 10 "' •t: 0
u
0
30
25
20 "' "' > -;;; u
0 ... I S "' .0 E ::l " E ::l
U) 1 0
5
I I
Chapter 5: Behaviour study
Restlessness index
ntl=LAS)<Scoop: Cntl<(LAS=Scoop)
0 4 5 1 Time (h) 1
S c o o p
LA - S co o p
C o ntrol
The timecourse of th� restlessness index after Scoop, LA-Scoop and Control treatment (0- 1 0h) . Significant differences between treatments are indicated by mat�ematical notation on the graph (P<0.05). The restlessness index i} the sum of the number of calves tail f!i�;king, head shaking or ear flicking.
I I
d Cortisol responses
d
d
d
f ..... ···············
.. ·· ;·;,.. ' ..... .. ..... ...-
· -.,.. - - - - - - r ·
········<>-········
- - - a - .. -
S c o o p
L A - Scoop
L A - Control
1 ( 1 0)�-----r-----r----�----,-----,-----,-----�----�----�----�--�
(1)
F i g 5.8 For comparison with Fig 5. 1 1 . The timecourse of the cortisol response (mean ± sem) of calves after Scoop, LA-Scoop and Control treatment (data from Chapter four). Significantly differences (P<0.05) between treatments are indicated: b: LA-Scoop * LA-Control; d: Scoop * LA-Scoop.
123

Chapter 5: Behaviour study 1 24
Table 5 .2 The percentage of calves head shaking, ear flicking, tail fl icking or ruminating on day two
after treatment (mean±sem), according to the day the study was conducted.
Behaviour Treatment
Group I (hot weather) Control Scoop LA-Scoop
Head shaking 0±0 1±1 1±1
Ear flicking 0±0 4±2 5±2
Tail flicking 9±2 1 5±2 1 3±2
Rumination 1 4±3 1 1±2 1 2±3
Group 2 (cold weather)
Head shaking 0±0 0±0 0±0
Ear flicking 0±0 0±0 1±1
Tail fl icking 0±0 0±0 0±0
Rumination 6±3 6±2 9±2
For group 1 the weather was hot and sunny, for group 2 the weather was cold and raining.

5.4 DISCUSSION
Chapter 5: Behaviour study 125
Using behavioural measurements as an index of the acute pain-induced distress
apparently caused by dehoming with or without local anaesthetic , the present study led
to the fol lowing findings:
1 ) There were distinct behavioural profiles according to the treatment received which
were presumably indicative of distressed and non-distressed states .
2 ) Calves dehorned without l ocal anaesthetic exhibi ted a h igh incidence of
restlessness that lasted for s ix hours, which presumably indicated the acute pain
induced distress of dehoming.
3) Prior appl ication of a l ocal anaesthetic virtual ly abol i shed the behavioural
response after Scoop dehoming for the first two hours . Thereafter, between 2 and
6 hours, restlessness increased to levels similar to those of Scoop calves during
the first s ix hours. It would appear that local anaesthetic delayed the distress
response.
4) The timecourse of the restlessness in the Control , Scoop and LA-Scoop cal ves
corresponded to the timecourse of plasma cortisol concentrations in those groups
respectively (Chapter four).
5 ) The incidence of rumination appeared to occur in an inverse rel ationship to
restlessness. Both were apparently sensitive indices of pain-induced distress.
The results wi l l be discussed and the fol lowing aspects considered. The criteria to be
met for using changes in behaviour to indicate changes in emotional state wil l be
described. Limitations upon interpretation of the data are di scussed and design
modifications are suggested to assist future work should any be conducted.
In the present study, twelve behaviours were measured in order to assess the pain
i nduced distress that calves experience when being dehorned with or without local
anaesthetic . Of these the four behaviours of tail shaking, head shaking, ear flicking and
rumination were found to be the most rel iable and informative. These four behaviours
satisfied the fol lowing criteria required to use behaviour as evidence of pain-induced
distress (Stamp-Dawkins, 1 980; Ewbank, 1 985 ; Melior et al. , 2000) : a) they showed
distinct differences between treatment; and b) interpretation was in agreement with a
s imi lar physiological study (Chapter four) ; plus c) these behaviours occurred in a l l
groups being compared and assured a validating continuum (Lester et al. , 1 996) thus

Chapter 5: Behaviour study 126
avoiding the problems associated with drawing conclusions based on behaviours which
do not occur in one group (see Lester et al 's. ( 1996) critique of Molony et al. ( 1 993) and
S hutt et al. ( 1988)) . Furthermore, these behaviours occurred in sufficient frequency that
the Mann-Whitney statistical analyses were rel i able . The three behaviours of tai l
shaking, head shaking and ear flicking were summed to produce a "restlessness index"
and the l imitations of using these derived data are discussed below. The remaining eight
behaviours measured were either related to the time of day (lying, walking), external
events (vocalization), had no pattern according to treatment (head down position) and/or
the incidence of occurrence was extremely low rendering statisti cal analysis unreliable
(riding, head rubbing, neck extending and leg scratch to face). Therefore the fol lowing
discussion wil l focus on the four behaviours of tail shaking, head shaking, ear flicking
and rumination and on the restlessness index. None-the-less occasional references wil l
be made to the incidences of other behaviours.
5.4.1 Dehorning
Scoop calves exhibited a high level of restlessness immediately after treatment which
lasted about s ix hours. This activity consisted of tai l shaking (28%) , head shaking
( 1 8% ) , ear fl icking ( 1 2%) as well as pacing ( 1 0%) and infrequent leg scratching and
neck extending (<3% for each) . This was in striking contrast to the lack of activity in
the Control calves which mainly stood sti l l , gently fl icked their tai l s ( 1 2%) and
ruminated (24%) . The behavioural response of the Control calves presumably reflected
the psychological reaction to the novelty of the experimental situation which included
disruptions to social spacing and h ierarchies, to which cattle are particularly sensitive
(Hinch , 1 994), as wel l as any reaction to the proximity of di stressed and bleeding
calves. The high incidence of rumination and the l ack of restlessness in Control calves
suggest that the experimental situation caused little distress.
The differences in behaviour between Scoop and Control calves are presumably because
the Scoop calves experienced pain-induced distress . This finding is supported by the
l ac k of rumination in Scoop calves (compared to Control calves) as rumination
decreases when animals are stressed or in pain (Fraser and Broom, 1 990). It i s also
supported by the fact that the timecourse of the restlessness in Scoop calves
corresponded with the timecourse of the plasma cortisol concentrations after dehorning
(Chapter four), the l atter being taken as evidence of di stress . Furthermore, local
anaesthetic virtually eliminated the behavioural differences between Scoop and Control
calves for the first two hours after treatment and confirmed that these behaviours
indicate pain-induced distress and not a reaction to non-noxious stimuli .
The changes in behaviour of the Scoop calves, in particular tail shaking, head shaking,
ear flicking and general activity, are similar to those reported during and after cautery

Chapter 5: Behaviour study 127
disbudding (Taschke and Folsch, 1 993 , 1 995 ; Morisse et al. , 1 995) and amputation
dehorning (McMeekan et al. , 1 999) . In addit ion, the s ix h our duration of the
behavioural response is simi lar to that reported by McMeekan et al . ( 1 999) .
5 .4.2 Local anaesthetic
The appl ication of local anaesthetic pnor to dehorning virtuall y e l iminated the
behavioural response exhibited by Scoop calves during the first two hours such that the
behaviour was similar to that of the Control calves. This is taken as evidence that the
local anaesthetic decreased or eliminated the nociceptive barrage from damaged nerve
and infl amed tissue and that the calves were experiencing minimal distress at this time.
Furthermore, these results support the finding that the app lication of the local
anaesthetic per se caused minimal distress (Morisse et al. , 1 995 ; Petrie et al. , 1 995,
1 996a,b; Graf and Senn, 1999).
After 2 hours there was an increase in restlessness in LA-Scoop calves and this
behavioural profi le (37% tai l shaking, 1 3 % head shaking, 1 5 % ear flicking, 1 3 %
pacing) was similar to that of Scoop calves for the first s ix hours (P>0.05) . This
s imi larity in behaviour suggests that during this period, the LA-Scoop calves were
experiencing pain-induced di stress. The marked increase in restlessness in LA-Scoq>
calves after two hours presumably reflected the return of sensation to the area served by
the cornual nerve, and concomitantly the first appearance of noxious inputs associated
with the tissue damage to that area. This is supported by an assessment of the efficacy
of anaesthesia which was tested by pricking the cutaneous area served by the cornual
nerve with a hypodermic needle. At about 2.5h calves began to respond to this stimulus,
and in addition, plasma cortisol concentrations increased at this time (Chapter four) .
Similar responses were reported after dehorning plus local anaesthesia (Petrie et al. ,
1 996b) and after tai l-docking plus epidural local anaesthesia (Petrie et al. , 1 996a) in
calves.
Unfortunately in the current study there was no LA-Control group and therefore it
cannot be demonstrated that the delayed rise in restlessness was not due to the local
anaesthetic wearing off, or any other sensation as distinct from the pain. Behavioural
responses can vary according to the site and duration of the stimulus. It is possible that
the behaviours directed to the region of trauma may not reflect noxiousness, but rather
the annoyance or discomfort from dripping blood, flies, movement of cold air into and
out of the cranial sinuses or a change i n the weight distribution of the head. The
similarity of the behaviour of the Control and LA-Scoop calves in the first two hours,
during analgesia, suggests that these associated non-noxious stimuli have minimal
effects on behaviour compared to the effect of dehoming on behaviour. This simi larity
i s surprising given that one might have expected more differences elicited by bleeding

Chapter 5: Behaviour study 128
from the scoop wounds, associated flies or other sensations (e.g. loss of sensation), all
of which were absent in the Control calves. Furthermore, the cortisol data support the
inference that non-noxious stimuli have minimal effects (Chapter four). The simil arity
of the corti sol responses of the LA-Control and Control c alves suggests that the
administration and the wearing-off of the local anaesthetic have minimal effect . The
similarity of the cortisol response of LA-Scoop and LA-Control calves in the first three
hours suggests that the delayed rise in cortisol in LA-Scoop calves after 3h is elicited by
pain-induced distress rather than other non-noxious stimuli . Both the behaviour and the
cortisol data indicate that after two hours the LA-Scoop calves experienced pain .
I n some physiological studies the effect of local anaesthetic on the timecourse of the
cortisol response following cautery disbudding has not been apparent. Thi s has occurred
w here either the cortisol response elicited by the procedure was similar to the cortisol
response after control handling and bleeding, which suggests that the procedure causes
minimal distress (Petrie et al. , 1 996a,b), or where the sampling scheme was not of
sufficient frequency or duration to detect the changes in plasma cortisol concentrations
(Morisse et al. , 1 995 ). Furthermore, the effect of local anaesthetic can be obscured by
the occurrence of a high number of cases where there i s incomplete anaesthesia (see
Chapter four) . This may be as a result of operator i mpreci s ion or variations of
i nnervation (Weaver, 1 986) . Morisse et al. ( 1 99 5 ) reported a 40% occurrence of
i ncomplete anaesthesia. In the current study the number of times i t was necessary to
administer local anaesthetic twice was not recorded, but, in the cortisol study (Chapter
four) 34% (ie . 8/23) of the calves required a second dose. It was apparent from the
timecourse of the cortisol concentrations that two calves had incomplete anaesthesia and
they were therefore excluded from the study as outliers . Interestingly s ix of the seven
outliers, the data from which were excluded from the results, received local anaesthetic .
I t i s possible that these aberrant responses were idiosyncratic responses caused by
i nadvertent intravenous injection (Weaver, 1986) . In many studies the appl ication of
local anaesthetic decreased the occurrence of escape behaviours , such as tripping,
rearing and backwards locomotion, during the noxious procedure (Morisse et al. , 1 995).
Indeed, this i s a general observation (L.R Matthews; D.J Melior; K.J Stafford, personal
communication) . In those studies above where no apparent therapeutic effect of local
anaesthesia was measured i t was none-the-less recommended. This was because of
anecdotal observations of decreased escape and avoidance behaviours during a noxious
procedure when local anaesthetic was given [e .g. see Melior and Stafford's ( 1 997)
comments on Petrie et al. ( 1 996b)] . Common sense and experience tel l us that local
anaesthetics rel ieve pain . Where the effect of local anaesthetic i s not measured, but i s
observed anecdotally , perhaps it i s our ethical duty to either act conservatively on behalf

Chapter 5: Behaviour study 129
of the animal and give local anaesthetic or, refine these experiments in order to measure
the effect of local anaesthetic .
5.4.3 Differences between the behaviour and cortisol data
Both the behaviour and the cortisol data indicated that the response to scoop dehoming
l asted about six hours and that the local anaesthetic reduced that response for the first
two to three hours. Furthermore, the cortisol data indicated that local anaesthetic halved
the distress response to dehoming (Chapter four) . However the quantitation of the effect
of l ocal anaesthetic using the behaviour data i s problematic. I t is clear that the local
anaesthetic decreased the behavioural response to dehoming for about the first two
hours. The problem lies in assessing the magnitude of the behavioural response in the
middle period (2-6h) and assessing when exactly the LA-Scoop response is back to
Control levels . At a casual g lance it appears that the local anaesthetic has merely
displaced the response by two hours because the magnitude and duration (2-7 .5h)
appears similar to that of the scoop response (0-6h) (Fig 5 .7). However the statistical
analyses indicated that the behavioural responses of Scoop and LA-Scoop calves
between 2 and 6 hours were simi lar (i .e . when both experienced pain) and between 6
and 1 0 hours were also simi lar (i .e . response over) . This suggests that the LA-Scoop
response is two hours (33%) shorter than the Scoop response. It is not possible to
deduce from these data whether the local anaesthetic has merely di splaced the response
or w hether it has reduced the response by up to a third. This may be because of the
grouping of the data for statistical analyses, or problems with weighting and comparing
behaviours .
If l ocal anaesthesia delayed the behavioural response, rather than decreasing it, this
would suggest one of the fol lowing physiological etiologies (discussed in Chapter four):
a) Central effect: that somehow the local anaesthetic has prevented the endogenous
stress-induced analgesia, which may occur after the Scoop dehoming, from being
activated; or b) Local effect : that the reduced stress response in the first two hours
(whether this be as a direct resul t of the pain, or the indirectly from algogenic
substances) has somehow affected the wound healing process so that the pain
experienced is greater at this later stage than would have occurred had there been no
local anaesthetic ; or c) Perception effect: that the wearing off of local anaesthetic and
the return of sensation, including the first experi ence of pain sensation, somehow
combines to heighten the perception or experience of pain .
Perhaps the behavioural data provide a more sensitive index of duration or magnitude of
response than the cortisol data. It i s not possible to deduce from these data whether the
local anaesthetic has mere ly displaced the response or whether i t has reduced the
response by up to a third. Nor is i t possible to state which approach (cortisol versus
Chapter 5: Behaviour study 130
behavioural indices) more accurately compares the scoop to LA Scoop response. Given
the l imitations of the experimental design of the behaviour study we are more confident
i n the cortisol data. However, dehoming studies since have shown that local anaesthetic
merely delayed the cortisol response (Petrie et al. , 1 996b; McMeekan et al., 1 998a;
S utherland, 1 999).
5 .4.4 Interpretation issues concerni ng specific behaviours
Rumination
The ruminant as an eat and hide animal retires to a safe place to ruminate (Kilgour and
Dalton, 1 984 ) . The feed acquisition behaviours of grazing and ruminating are decreased
w hen animals are stressed ( Schalk and Amadon, 1 928) or in pain (Fraser and Broom,
1 990). This finding has been confirmed in the present study where rumination occurred
i n an inverse relationship to restlessness . Thi s observation supports the view that
rumination may be a sensitive index of stress.
The apparent similarity in the incidence of rumination in Control , Scoop and LA-Scoop
c alves after s ix hours should be approached with caution . This s imi larity may be
fortuitous. The decrease in rumination throughout the day in Control calves was
presumably due to decreasing rumen content. But for calves which had been dehomed,
wi th or without the local anaesthetic , the increase in rumination after six hours may
have reflected ful l rumen contents , rather than indicating a decrease in pain-induced
distress. I t is possible that had food been provided throughout the day, the difference in
occurrence of rumination between dehomed and Control calves might have persisted
beyond six hours . It is interesting that near the end of the study period there was no
apparent increase in restlessness elicited by the additional stressor of hunger.
There was virtually no rumination during periods of high restlessness. It is interesting to
note however, that in Scoop calves between 0 .5 and 1 .5 hours after treatment, there was
a transient decrease i n restlessness and a transient i ncrease i n rumination which
corresponded to a decrease in plasma cortisol concentrations from peak values (Chapter
four). These three events indicate that there is a decrease or change i n nox ious input
during this period, which may be due to decreased or changed nociceptive input from
either the wound site or as a resul t of descending inhibit ion ( i .e . stress- induced
analgesia) .
Tail shaking
After six hours the behavioural profile in Scoop calves was similar to that of the Control
calves, and the behavioural profi le in LA-Scoop calves was approaching that of the
Control calves. However, tail shaking in both Scoop and LA Scoop calves continued at
h igh levels . McMeekan et al. ( 1 999) reported simil ar continued tail shaking after

Chapter 5: Behaviour study 131
dehorning of calves, and this tail shaking returned to levels observed in Control calves
by 24h . It is possible that a high level of tail shaking reflects an urge to escape a
stimulus, or i t may reflect general distress. Tail shaking presumably involves less effort
and, after an insult to the head region, e licits less pain , than head shaking or ear flicking.
Al ternatively it may be that tai l shaking is a social signal and that these cattle are
broadcasting their discomfort to the rest of the herd.
Neck extending
Neck extending is associated with animals that are in pain or diseased (Hinch, 1994) . In
thi s study i t was an infrequent abnormal behaviour which only occurred during periods
of maximal restlessness. In Scoop calves neck extending only occurred during the first
s ix hours and in LA-Scoop calves between 3 and 4h. The occurrence of this behaviour
corresponded to high cortisol levels (Chapter four) which suggests that neck extending
is a behaviour indicating extreme pain .
Leg scratching
Leg scratching occurred with low incidence and without pattern in calves dehorned with
or without local anaesthetic , suggesting that this is a response to non-noxious stimuli,
perhaps the dripping blood or the presence of flies.
Restlessness index
The restlessness of the LA-Scoop calves between 2 and 6 hours, appears to be similar to
that i n Scoop calves during the first s ix hours. Evaluation of these differences i s
complicated by the restlessness index being the sum of three behaviours . Should the
values be compared arithmetical ly? To do so could magnify the apparent distress
response, or i mply that those three behaviours had equal weighting with respect to
distress. Had the behaviours been scored to incorporate intensity, duration or number of
bouts it may sti l l not have been possible to arithmetically compare the data. Composite
measures can be justified, when the behaviours are related (Martin and Bateson, 1 986).
For simplicity, and given the lack of evidence to the contrary, the behaviours were
given equal weighting. However, thi s approach should be viewed with caution (Melior
et al. , 2000) . Note that the restlessness i ndex used here i s not the same as the
restlessness score that has been defined as the number of times an animal gets up and
down (Melior and Murray, 1 989a; Lester et al., 1 996; Petrie et al. , 1 996a).
Noxious stimulation, in addition to metabolic and neuroendocrine changes, el icits
classical withdrawal reflexes and/or defence and escape behaviours, termed the "fight or
flight" response, which are designed to minimize further injury, and later on the noxious
stimulation el icits behaviours aimed at promoting healing. Pain has been associated
with decreased activity (Fraser and B room, 1 990), i ncreased restlessness or both

Chapter 5: Behaviour study 132
(Lester et al., 1 996) . Decreased activity presumably minimizes further episodes of pain
and promotes heali ng through rest. Increased activity presumably reflects an animal's
urge to escape the source of the noxious stimulus. The walking, or rather pacing or
running, presumably reflected an urge to escape the noxious stimul i . Head shaking, ear
flicking or leg scratching to the face may be an attempt to dislodge the source of the
noxious stimulus or a response to non-noxious stimul i , for example the dripping of
blood. Presumably there is a conflict of motivation between the desire to escape and the
desire to decrease further episodes of pain caused by movement, combined with the
desire to blend in with the herd and thus avoid predation.
5.4.5 Day two after treatment
There appeared to be no differences in the behaviour of Control , Scoop or LA-Scoop
calves on day two after treatment, and this behaviour appeared to be simi lar to that of
the Control calves on day one. However, there appeared to be subtle differences in the
behaviour and bleeding of dehorned calves, according to the weather. In the first study
the weather was sunny and hot and fli es were abundant. In the second study it rained all
day and was cold and flies were scarce.
On the hot day some calves irrespective of treatment shook their tai l s at a level similar
to that of the Control calves on day one. Only those calves dehorned with or wi thout
local anaesthetic exhibited infrequent head shaking and ear flicking, whereas, on the
cold day there was no tail shaking, no head shaking and only one occurrence of ear flick
observed. On the day that i t was was hot there was more b leeding: one calf exhibited
arterial bleeding from its scoop wound, another calf dripped blood, and three calves
oozed blood all day, one of these having blood in i ts nostri ls . There was blood covering
much of the face of these five calves and to a lesser extent over the heads of the
remainder of the group. It was necessary to apply a tourniquet and l ater a bandage and
antibiotic to the calf that with arterial hemorrhage. B y contrast, in the second study,
when it was raining and cold, there was less evidence of bleeding. Some calves had a lot
of blood on their face, and three calves had evidence of fresh blood in their nostri ls . Our
data does not allow us to analyse whether these differences in behaviour or bleeding
between days were significant. Furthermore, it is not possible to say whether these
differences in behaviour reflect differences in the pain-induced distress experienced as
the different environmental conditions may affect not only the magnitude of non
noxious stimuli but also the pain-induced distress. However, the data suggest that the
weather could have a significant i mpact on the experience and outcome of such
procedures, and should be taken into account when dehorning.

Chapter 5: Behaviour study
5.4.6 Critique and recommendations to experimental des ign
133
A degree of caution should be exercised when drawing firm conclusions from this study
for the fol lowing reasons: Whilst marked differences in the pattern of restlessness were
observed, there were few occasions where the occurrence of a particular behaviour
exceeded 30%. For this reason i t i s l ikely that any external event, for example, the
mustering of stock nearby, while possib ly affecting only a small number of calves,
could have a substantial effect on the data. The low incidence of active behaviours of
calves in al l treatments may have been a result of the experimental environment, a
response for improving the chances of survival in the face of predation or possibly an
artifact of the scoring scheme. Further complicating factors include the fact that cattle
are all iomimetic and that there was no LA-Control group. In addition, there were minor
differences in the experimental design of the cortisol study (Chapter four) and the
behaviour study. Each of these is discussed below.
Experimental situation
The behaviour experiment was conducted in sheep yards which were small (5x5m),
covered and had a stony floor. This was done in order to simulate the experimental
conditions of, and allow comparison with, the paral lel cortisol study (Chapter four) .
Confinement in these environmentall y steri l e yards inhibited the expression of many
n ormal, active behaviours . Grazing cattle spend most of their time i n the feed
acquisition activities of grazing and walking (33%) and ruminating (33%), and about
3 3 % of their time idling ( i .e . either standing or lying) (Fraser and Broom, 1 990).
Grazing was not possible and therefore presumably the incidence of rumination
decreased during the day as a consequence of diminishing rumen contents. In addition,
the occurrence of rumination may have been low because the environment was stressful .
The usual incidence of ly ing may have been affected by thi s change of grazing
behaviour, and/or the inabili ty to avoid the accumulation of faeces in a confined area.
The perturbing effect of the experimental situation can be accounted for by the use of
controls . In the current study the Control calves were inactive compared to cattle at
pasture. They stood sti l l and ruminated with decreasing frequency (from 28% to 9%)
throughout the day. This indicates that the experimental situation affected their usual
behaviour but caused minimal distress . Apparently ruminants do not show overt
behavioural responses to pain or distress as a survival mechanism for protection from
predation (Hinch, 1 994). In the current study i t i s l ikely that the apparent lack of
behaviour was a result of the experimental situation .
Behaviour sampling scheme
Calf behaviour was recorded using "instantaneous point scan behaviour sampling" . That
is , the number of animals exhibiting particular behaviours at a point i n time was scored.

Chapter 5: Behaviour study 134
It was decided to behaviour sample in thi s way so as to make possible the scoring of a
large number of calves in a short period of time. Thi s resulted i n the fol lowing
limitations in interpretation of the data:
Because the number of animals exhibiting a particular behaviour was scored and not the
behaviour that an individual calf was exhibiting, i t was not possible to correl ate
behaviours which may have been expressed simultaneously in individuals , or to identify
outliers or subpopulations (see Chapter two) . In the dehoming study where changes i n
p lasma cort isol concentrations were measured (Chapter four), there were clearly
identifi able outliers. For example, there were two calves in which i t appeared that the
local anaesthetic had not worked, and these ani mals were excluded from the results so
as not to distort the mean response.
Because the sampling scheme involved instantaneous point scan sampling and the
behaviours were simply recorded as either present or absent, no information on the
frequency or duration of a behaviour bout was gathered. This information is obtained by
conducting period sampling, where the duration and number of bouts of particular
behaviours are recorded during a period, and provides more i nformation about the
animal 's behaviour. Instantaneous scan sampling is a recommended technique if the
frequency of occurrence of behaviour i s high and the time between observations is low,
in that case the resulting data will be a true snapshot of behavioural activity (Martin and
Bateson, 1 986) . If the frequency of observation i s high , then some information about the
frequency and duration of bouts can be inferred from the data (Fraser and Broom,
1 990). However, where frequency or duration of a behaviour is low i t is possible that
the behaviour may not be recorded at all, resulting in a distortion of results (Melior and
Murray, 1 989a) .
While not measured in this study, the i ntensity of a behaviour can be measured in point
scan sampling. The importance of such quantitation is that i t is possible that a difference
in the intensity of a behaviour may later be c lassified as a different behaviour. This was
of particular relevance to the scoring of walking and tail shaking; for example, with
respect to walking a s low rate i s a walk, a medium rate i s pacing and a fast rate may be
a run . For tail shaking i t appeared that Control calves slowly flicked their tai ls , while
dehomed calves, during periods of high restlessness, lashed their tai l s , thi s behaviour
being fast, sustained and with the tail traversing a greater distance than that observed in
Control calves . In the current study, period sampling, with information on duration,
frequency and intensity , may have been preferable for scoring behaviours, especiall y in
the case of tail shaking and walking. However, this may have made l ittle difference to
the interpretation of the data, presumably only exaggerating the difference between
Scoop and Control calves. For the scoring of behavioural states such as ruminating or

Chapter 5: Behaviour study 135
lying where the duration of a bout was rel atively long, the type of sampling has l i ttle
i mpact upon the results.
No LA-Control group
Good experimental design incorporates control groups to account for extraneous factors
and thi s allows changes to be correlated with treatment (Shott, 1 990). In the current
study there was a Control group but there was no LA-Control group. It was decided to
omit this latter group because of a shortage of calves and because the paral lel
physiological study (Chapter four) showed that there was no difference between the
LA-Control and the Control calves. However, it is possible that whi le this similarity
may be the case for plasma cortisol, it may not be the case for behaviour. Thus, it was
not possible to determine the contribution if any, of the possible negative effects of the
administration or the wearing-off of the local anaesthetic on the behavioural response.
S ubsequent work i ndicated that the effect of local anaesthetic per se i s negligible
(Morisse et al. , 1 995; Graf and Senn, 1999).
Comparison of the behaviour and cortisol data
While the behaviour study was conducted in an experimental situation similar to the
corti sol study, there were some design differences between the two. The main
difference was that unlike the behaviour study, the cortisol study involved repeated
handling and invasive blood sampling. Because of the possible confounding effects of
sampling on the interpretation of data from welfare studies, it is recommended to blood
sample with minimal i nterference. This may be done by using a remote sampler device
(see Cook et al., 2000). In the absence of such equipment, the calves could be behaviour
and blood sampled and their behaviour compared to a group which is just behaviour
sampled; or separate behaviour and cortisol sampling trial s could be conducted in
parallel . There are advantages and di sadvantages with both of these approaches.
Furthermore, cattle are al liomimetic, that i s , they tend to copy each other. This may
complicate interpretation of their behaviour. In the cortisol study each experimental
mob had calves from all treatment groups, whereas the calves in the behaviour study
were grouped according to treatment . The former approach would presumably decrease,
and the l atter approach would presumably increase, the differences between treatments.
But which approach is more correct? Whi lst there are some l imi tations in the
comparison of the two studies , there was none-the-less good agreement in the
interpretation of the results.
5.4.7 Conclusions
Amputation dehoming elicited a significant increase i n restless behaviours that lasted
for about six hours. Local anaesthetic virtually abolished the behavioural response to
scoop dehoming for the first two hours. These results suggest that dehoming is a painful
Chapter 5: Behaviour study 136
expenence that l asts about s ix hours and that the application of local anaesthetic
alleviates that pain for about the first two hours. These finding are consistent with the
physiological study (Chapter four). Better quality information may have been gathered
had period sampling of behaviour in the paddock been used. However, it i s unlikely that
the pattern of response would have differed. On the basis of the behaviour study it i s
recommended that local anaesthetic be admini stered when conducting amputation
dehorning.
5.4.8 Epi logue
S ince this research was conducted more recent work has been done (McMeekan et al.,
1 999; Stafford et al. , 2000) . These works confi rmed many of the behavioural changes
observed here and are discussed in the General Discussion.

6
Chapter 6: General Discussion
GENERAL DISCUSSION
137
In this thesis , the pain-induced distress caused by the husbandry practice of dehoming
cattle i s assessed and methods to alleviate it are evaluated. Cattle are dehomed to reduce
injury to stock handlers and stock and to improve husbandry. At the time this work was
conducted there were no comprehensive studies on the effects of amputation dehoming
on the welfare of the cattle. The aims of the study were to assess the distress response
after dehoming and to explore the possibilities of alleviating that di stress through the
use of different dehoming tools, local anaesthetic and/or cautery of the scoop wound.
Plasma cortisol concentrations and changes in behaviour were used as indices of
distress . S ubsequent to this work a series of studies investigating the distress of
amputation dehoming were conducted (see 6 .2 ) to which this work made a significant
contribution.
6.1 CONCLUSIONS
Using changes in plasma cortisol concentrations and behaviour as indices of the acute
pain-induced di stress apparently caused by the different treatments, the present study
led to the fol lowing findings:
1 ) A l l dehorning amputation methods resul ted i n s imi lar corti sol responses
irrespective of the tool used. The response was marked, biphasic and lasted for
about six hours.
2) The ti mecourse of the plasma corti sol response after ACTH administration
suggests that maximum corti sol secretion had been induced. The cortisol
responses in the first hour after dehoming were similar to those fol lowing ACTH
treatment indicating that dehoming initial ly caused maximal cortisol secretion and
by inference was very distressing.
3 ) Injection of local anaesthetic prior to Scoop dehorning virtually aboli shed the
behaviour and cortisol responses el icited in the first two to three hours after
dehoming. Overall , thi s equated to a 50% reduction i n the corti sol response to
dehoming.
4) Cauterizing the wounds after scoop dehoming appeared to marginally reduce the
cortisol response compared to scoop dehoming alone . This suggests that there

Chapter 6: General Discussion 138
may be some benefit i n cauterizing the dehorning wounds. However, the
behavioural response to the cautery indicated that it was aversive.
5) The combination of local anaesthetic and cauterizing the scoop wound virtually
el iminated the cortisol response after scoop dehorning. Thi s suggests that pain
induced distress was minimal . The apparent benefit of the combined regime has
paral le ls with recent di scoveries in pain physiology and merits further
investigation.
6) Control handl ing and bloodsampling and the admini stration of the local
anaesthetic caused minor distress which lasted for 1 .5 hours.
7) The four behaviours of tai l shalGng, ear fliclGng, head shalGng and rumination met
the criteria for use to indicate di stress . Interpretation of the behaviour data
corresponded with that of the cortisol data.
8) There were three distinct patterns in the timecourse of the plasma corti sol
concentrations after ACTH, Dehorning and Control treatment respectively
suggesting different underlying physiological processes, the understanding of
which may provide insight for the alleviation of pain-induced distress.
6.1 . 1 Dehorning
Amputation dehorning of six-month-old calves el ici ted a marked, biphasic cortisol
response (Chapter three) and a high level of restless behaviours (Chapter five) both of
which lasted for about six hours. All the dehorning amputation methods used resulted in
similar cortisol responses, although there is a suggestion that the depth of the wound
may affect the level of distress. The plateauing of high cortisol concentrations after the
ACTH bolus indicated that maximal secretory c apacity of the adrenal gland was
reached (Sapolsky, 1 992). The rate of increase and the maximal cortisol levels attained
after dehorning and ACTH injection were similar, i ndicating that dehorning caused
maximal cortisol secretion by the adrenal gland and was, by inference, very distressing.
The cortisol response after dehorning appears to be biphasic. The appearance of a sub
maximal plateauing of cortisol concentrations between 1 . 5 and 3 hours suggests the
occurrence of either stress-induced analgesia (between 1 and 3 h) , or more l ike ly the
appearance of a second phase of pain presumably from inflammation (between 1 .5 and
6 h) .
6.1 .2 Local anaesthetic
Injection of local anaesthetic near each cornual nerve before scoop dehorning almost
abo l ished the first three hours of the corti so l and the behaviour response after
dehoming. Noxious sensory input from the wounds persisted beyond the three hour
Chapter 6: General Discussion 139
action of the local anaesthetic, leading to an increase i n plasma cortisol concentrations
after the local anaesthetic effects wore off. This equated to a 50% reduction in the
integrated cortisol response. The extent of the benefit of local anaesthetic i s not clear
from the behaviour data, being somewhere between 33% and 0%, the l atter representing
a delay only. This possible disparity between the cortisol and behaviour data may arise
from problems associated with local anaesthetic failures, assessment of behavioural
indices or design limitations of the behaviour study.
There were di stinct behavioural profi les according to the treatment received which
presumably indicated distressed and non-di stressed states . The four behaviours of tail
shaking, head shaking, ear flicking and rumination satisfied the criteria required to use
behaviour as evidence of pain-induced distress (Stamp-Dawkins, 1 980; Ewbank, 1 985 ;
Melior et al., 2000). Whilst there was agreement in the behaviour and cortisol studies, i t
was not possible to determine the exact magnitude or duration of the responses from the
behaviour data . This is a problem of how to compare, or give weight to, different
behaviours.
It i s apparent from the corti sol responses that there can be a h igh rate of local
anaesthesia fai lure (40%, Mori sse et al, 1995) . This may be caused by imprecis ion of
site due to operator fai lure or the struggling movements of the calf, variations of
innervation, or significant innervation from the medial or caudal aspect of the horn
(Weaver, 1 986) . In the study described in Chapter four there was an init ial 34%
anaesthesia fai l ure rate, and those calves were given an additional dose of local
anaesthetic . None-the-less 26% of calves which received l ocal anaesthetic , were
excluded from the study as outliers . It was apparent that in some cases there had been
insufficient anaesthesia, while in other cases there were bizarre cortisol responses which
may have been caused by inadvertent intra-venous application, idiosyncratic responses
or by factors not related to the treatment.
A criticism of the behaviour study is that the sampling scheme did not allow for the
identification of outliers . Anaesthesia fai lure rates of 34% would presumably mask the
benefit of local anaesthetic. Whilst this may reflect the si tuation in the field, we are
none-the-less obliged to amel iorate this . It was obvious that those calves that were
dehorned with local anaesthetic exhibited less escape behaviours than those calves
dehorned without local anaesthetic . Unfortunately , we did not score the behaviour
during the dehorning procedure. Had we scored the responses during the dehorning
procedure, the therapeutic effect of local anaesthetic would have been more apparent. I t
i s possible that better quality information may have been gathered had period sampling
of individual calf behaviour in the field been conducted. However, i t is unlikely that the
pattern of response would differ. Both the physiological study (Chapter four) and the

Chapter 6: General Discussion 140
behaviour study (Chapter five) suggest that dehorning is a painful experience that lasts
about six hours and that the application of local anaesthetic alleviates that pain for about
the first two to three hours . It is recommended that local anaesthetic be administered
when conducting amputation dehorning.
There was l i ttle evidence to suggest that the experimental design affected the cortisol
responses. The Control and LA-Control procedures elicited small cortisol responses
which were over by 1 .5 hours . The similarity of the Control and LA-Control responses
supports the finding that the admini stration of local anaesthetic per se causes minimal
distress (Petrie et al. , 1 996a,b; McMeekan et al. , 1 998a,b; Sutherland, 1 999; Graf and
Senn, 1 999) . In addition, the simi l ar corti sol concentrations in LA-Control and
LA-Scoop calves between 0 and 3h indicates that the increase in cortisol concentrations
in LA-Scoop calves after three hours was caused by the appearance of pain-induced
di stress with the return of sensation, and not hemorrhage or the local anaesthetic
wearing off per se.
6.1 .3 Local anaesthesia and cautery of the wounds
The combination of local anaesthetic and cauterizing the scoop wound virtual l y
abolished the cortisol response to amputation dehorning. This result was surprising,
especially in view of the marginal reduction from cauterizing the scoop wounds without
local anaesthetic . On the one hand, we anticipated some reduction in the cortisol
response with cautery as indicated from previous studies (Lester et al. , 1 99 1 a) and from
the fact that third degree burns are analgesic compared to second or first degree burns.
On the other hand, i t was possible that wound cautery could increase the cortisol
response because it was an additional insult to the dehorning, and not the means by
which the tissue was removed. Furthermore, the behaviour of the calves during the
cauterizing without local anaesthetic indicated that this was a noxious experience.
The increase in cortisol concentrations after the local anaesthetic wore off in LA-Scoop
calves demonstrates that there is sufficient pain during this period to el icit a delayed
cortisol ri se. Somehow the additional effect of cauterizing the wound prevented the
delayed ri se in cortisol concentrations when the local anaesthetic wore off. It has been
suggested that cautery destroys nociceptors in the wound and thereby decreases
nociception (Lester et al. , 1 99 1 a) . The magnitude of the benefit of local anaesthetic plus
wound cautery was striking. By contrast, the marginal decrease in the cortisol response
from cauterizing the wounds alone suggests that if the n umber of functioning
nocireceptors has decreased, then those that are functioning have had their threshold
decreased ( i .e . are sensitized) by the afferent barrage from dehorning. The synergistic
effect of the combined regime of local anaesthetic plus cautery is reminiscent of pre
emptive analgesia (see section 6.3) .

6.1 .4 Recommendations
Chapter 6: General Discussion 141
Both the cortisol and behavioural data indicate the benefit of giving local anaesthetic
when dehoming. The combination of local anaesthetic prior to, and cauterizing the
wound after scoop dehoming, is recommended provided that the additional handling
and great care required for this procedure, can be managed. If a scoop dehomer which
incorporated the cauterizing effect were to be developed then this would be a high ly
recommended technique.
6.2 SUBSEQUENT WORK
Since this study was conducted a series of studies were undertaken to examine the
distress of amputation dehoming (Cooper et al. , 1 995 ; Petrie et al. , 1 996b; McMeekan
et al. , 1 997, 1998a,b, 1 999; Sutherland, 1999; S tafford et al. , 2000; Sutherland et al. ,
2002a,b; Melior et al. , 2002) and cautery disbudding (Taschke and Folsch, 1 993, 1 995;
Wohlt et al. , 1 994; Mori sse et al. , 1 995; Petrie et al. , 1 996b; Grondahl-Nielsen et al. ,
1 999; Graf and Senn, 1 999; Faulkner and Weary, 2000).
6.2.1 Amputation dehorning
Subsequent studies confirmed that the cortisol response after scoop dehoming lasted six
to seven hours, was marked and biphasic (Petrie et al., 1 996b; McMeekan et al. , 1997,
1 998a,b, 1 999; Sutherland, 1999) . Further, as a result of the present finding regarding
the simi larity of cortisol responses for different dehoming methods, in subsequent
amputation dehoming studies by our team, the scoop was used because of its ease of
operation. The findings in this thesis regarding the depth of wound led to a specific
study of shallow versus deep scoop dehoming, which subsequently demonstrated no
effect from scoop wound depth (McMeekan et al. , 1 997).
Subsequent work showed that local anaesthetic el iminated the cortisol response to
dehoming during i ts period of action, but once the anaesthesia wore off cortisol
concentrations rose irrespective of whether the duration of anaesthesia was 2, 4, 5, or 8
hours, such that the integrated cortisol responses with and without local anaesthetic
were s imi lar (Petrie et al. , 1 996b; McMeekan et al. , 1 998a; S utherland, 1 999 ;
Sutherland et al. , 2002a,b) . The nature and magnitude of the delayed rise in cortisol
concentrations after dehoming with local anaesthesia is different from that after
dehoming alone. Whereas the response to dehoming i s biphasic, the delayed cortisol
response to dehoming with local anaesthesia has one phase and concentrations do not
attain maximal values. McMeekan et al. ( 1 998b) proposed that the lack of apparent
benefit of local anaesthetic on the cortisol response overall may be due to a delay in the
resolution of inflammation because of the l ack of the i nitial maximal cortisol surge,
since cortisol has potent anti-inflammatory actions (Goldstein et al. , 1 992; Buckwalter,

Chapter 6: General Discussion 142
1 995) . The apparent l ack of benefit of local anaesthesia on the cortisol response overall
is in contrast to the findings of the current study and other studies where behavioural
and/or physiological indices indicate that local anaesthesia reduces the responses during
and/or after cautery dehorning (Morisse et al. , 1 995 ; Graf and Senn, 1 999; Grondahl
Nielsen et al. , 1 999). Indeed, because of such observations i t i s usuall y recommended
that local anaesthesia be given. Perhaps the reasons for the differences in the effect of
local anaesthetic are age related. In the current study the calves were six months old,
whereas the calves in the subsequent studies were 3-4 months (McMeekan et al. , 1 998a;
Sutherland, 1 999; Sutherland et al. , 2002a,b) and 6-8 weeks old (Petrie et al. , 1 996b) .
Understanding the physiological basi s of the di stress response is i mportant as i t may
provide insight for al leviation of that di stress . The biphasic shape of the cortisol
response after dehorning suggested that there may be two phases of response, the first
caused by the nociceptor barrage from the amputation itself, and the second reflecting
nociception from inflammation. The cortisol response after dehorning was subsequently
investigated to see if it was possible to distinguish the presumed phases of pain elicited
from the afferent barrage versus pain el icited by inflammation (McMeekan et al. ,
1 998b).
The combined regime of local anaesthetic plus the non-steroidal anti-inflammatory drug
(NSAID) ketoprofen virtually abolished the cortisol response to dehorning (McMeekan
et al. , 1998b ). Ketoprofen alone effected a marginal reduction in the cortisol response in
the first two hours after dehorning and abolished the response thereafter. This suggested
that a major component of the dehorned response after two hours was due to
inflammation . The therapeutic effect of local anaesthetic and the NSAID ketoprofen
was confirmed (Sutherland, 1 999; Sutherland et al. , 2000b) , but in that study there was
a decrease of small magnitude as opposed to el imination of the cortisol response. It was
suggested that the difference in the magnitude of the effect could be due to the
differences of duration of action of local anaesthetic per se, of five hours (Sutherland,
1 999; Sutherland et al. , 2002b) compared to two hours (McMeekan et al. , 1 998b), or
indirectly in that by the time the 5 h local anaesthetic has worn-off, the ketoprofen
concentration is so low that the occurrence of inflammatory pain elicits a small second
cortisol rise. Local anaesthetic l asting 5 h combined with e levated cortisol
concentrations (induced by ACTH administration) effected a small reduction in the
delayed cortisol response once the local anaesthetic wore off. Local anaesthetic (5 h)
p lus the NSAID phenylbutazone was not effective i n reducing that delayed cortisol
response (Sutherland et al. , 2002b ) . The lack of effect of phenylbutazone was attributed
to it being less potent in its anti-inflammatory (Kantor, 1986) or anti-nociceptive action.
The significant decrease in the cortisol response to dehorning by the combined regime

Chapter 6: General Discussion 143
of local anaesthetic plus cauterizing the scoop wound was confirmed (Sutherland et al. ,
2002a), however, the magnitude of the decrease was less than that reported by Sylvester
et al. ( 1998a).
6.2.2 Disbudding
A series of studies have been conducted on the effects of cautery disbudding. To date
Petrie et al. ( 1 996b) is the only study where the physiologic al responses to cautery
disbudding and amputation dehorning were compared. In s ix-week-old calves the
cortisol response to amputation dehorning is marked, biphasic and lasts about 6.5 hours,
whereas the response to cautery disbudding is monophasic and lasts about 1 .5 hours .
Other studies have shown that the cortisol response to cautery disbudding lasts about
1 -2 hours (Laden et al. , 1 985 ; Taschke and Folsch, 1 993, 1 995 ; Wohlt et al. , 1 994;
Petrie et al. , 1 996b; Graf and Senn, 1 999; Faulkner and Weary, 2000) or less than 4
hours (Mori sse et al., 1 995 ; Grondahl-Niel sen et al. , 1 999) . In some studies the
application of local anaesthetic has decreased the corti sol and behavioural responses to
di sbudding (Graf and Senn, 1 999) and in other studies there has been no apparent
overall effect of local anaesthetic (Petrie et al. , 1 996b ) . In the l atter case it would appear
that the overall effect of local anaesthetic was obscured by the fact that the responses to
cautery dehorning and to control handling and sampling are similar. The effects of
sedation (xylazine), local anaesthetic (2 h) (lidocaine or l ignocaine) plus an analgesic
(either butorphanol or ketoprofen) have been investigated (Grondahl-Nielsen et al. ,
1 999; Faulkner and Weary, 2000) . I n one study the xylazine caused such deep sedation
that the behaviour and heart rate data were equivocal (Grondahl-Nielsen et al. , 1999), in
another xylazine and local anaesthetic resulted in peak distress behaviours at six hours
after disbudding which were eliminated with the addition of ketoprofen (Faulkner and
Weary, 2000). Whilst these results may indicate the benefit of ketoprofen when
disbudding, they also suggest that sedation per se might be distressing. Disbudding by
caustic chemical i s more di stressing than by cautery, and this greater response is
reduced by the application of local anaesthetic (Morisse et al. , 1 995) .
6.3 PAIN-INDUCED DISTRESS - INSIGHTS
Understanding the physiological basis of the di stress response IS important as i t
provides ins ight for avenues of al leviation of that distress . This has benefi t for
husbandry and scientific procedures . In the l ast ten years the pain-induced distress
response el ic i ted by various husbandry practices including dehorning, disbudding,
castration and tail ing, and the strategies for its al leviation, have been extensively
inve stigated. The distress response appears to h ave various components including
handling and acute and chronic phases . These components may be affected by age ,
method and pharmacological and/or physical alleviation strategies.

Chapter 6: General Discussion 144
The mustering and restraint required to carry out husbandry or scientific procedures
usuall y evoke a distress response, the magnitude and duration of which wi l l depend on
the temperament of the animal and whether i t is fami l iar with the handlers and/or
conditions. Taming and training animals before an experiment reduces the behavioural
and physiological responses to the experimental situation (Mellor, 2000), however, such
training is problematic as it may alter the animal's responses to the treatment or not be
representative of their response in their natural environment, which may be what i s of
interest . For ins tance , the corti sol response in l ambs subj ected to handling plus
venipuncture is simil ar to that when ring tail -docked (Lester et al. , 1 99 1 a) , but if l ambs
are familiar with the experimental conditions the response to handling plus venipuncture
is less than the response to ring tai l-docking (Melior and Murray, 1 989a). This raises the
issue of the extent to which the stress response to the experimental paradigm
complicates interpretation of the results (Mason , 1968 ; Melior, 2000). On the one hand,
where the response to the noxious procedure is marked, as in the case of surgical
castration in lambs, the response does not appear to be affected by the repeated handling
and venipuncture (Lester et al. , 1 99 1 b) . On the other hand, when blood samples are
taken remotely via indwelling catheters, the 'Dracpac' or via transcutaneous biosensors
the physiological responses are lower (Cook et al. , 2000) .
There appears to be no convincing evidence that age affects distress; indeed there are
interpretative problems comparing such responses because of age-related differences in
the pharmacokinetics of the HPA-axis (Melior and Murray, 1 989b; Sapolsky , 1 992;
Melior and Stafford, 1 999a). Where there is more than one method avai lable to achieve
the same husbandry goal, there i s a need for rigourous scientific evaluation in order to
choose a method which causes the least distress. For i nstance, castration and/or tai ling
of l ambs using rings or the docking iron is less di stressing than surgical removal (for
review see Melior and Stafford, 1999a, 2000) , and in calves, whilst there are no major
differences in the distress responses when different methods of amputating the horn are
used (Sylvester et al., 1 998b ) , cautery disbudding elicits significantly less distress than
amputation dehoming (Petrie et al. , 1996b) .
Any surgical intrusion causes tissue damage with attendant acute pain and distress . This
is usually a self l imi ting experience due to the progress of the healing processes . Recent
advances in our knowledge of the physiology of pain have driven changes in pain
management strategies . When the noxious sensory barrage of surgery is blocked by the
use of local or regional anaesthesia there is a reduced intensity and delayed onset in the
appearance of post-operative pain. This has been termed pre-emptive analgesia (Woolf
and Chong, 1 993). The suggested mechanism for thi s phenomenon i s that the surgery
i nduced sensory b arrage decreases the pain threshold result ing in an increased
Chapter 6: General Discussion 145
sensitivity to stimuli including pain (Wall , 1 988 ; Katz et al. , 1 992; Woolf and Chong,
1993). If thi s afferent barrage can be prevented, through the use of local anaesthetic,
then, when the local anaesthetic wears off the experience of pain i s reduced, because
there has been no reduction in the pain threshold.
Pre-emptive analgesia may be achieved by pharmacological or physical means. For
example , when the pain-producing stimuli outlast the duration of analgesia resulting in a
significant distress response thereafter, as in the case of amputation dehorning, a
combination of local anaesthetic plus the NSAID ketoprofen (McMeekan et al. , 1 998b)
is effective; or, the effective duration of local anaesthetic can be increased as in the case
of castration and/or tai ling when rings are used. The ring, by obstructing b lood flow,
prevents the c learance of local anaesthetic from tissues distal to the ring (Melior and
Stafford, 1 999a; 2000) . It is also possible to decrease the transmission of nerve impulses
through physical means. This may be direct or indirect. Examples of direct methods are
procedures which incorporate cautery such as tail -docking with a docking iron (Lester
et al. , 1 99 1 b) or cauterizing dehorning wounds (Sylvester et al. , 1 998a) , or procedures
which crush nerves such as the castration clamp (Melior and Stafford, 1 999a, 2000). In
the former two, cautery appears to decrease the number of functional nocireceptors, and
in the latter one the transmission of impulses in the nociceptors is inexorably disabled
(Melior and Stafford, 1999a, 2000) . Examples of indirect methods are procedures where
the rings are used. The rings decrease blood flow which causes anoxia of tissues and
eventually disables pain reception (Melior and Stafford, 1 999a, 2000) .
The chroni c welfare aspects of such husbandry procedures have not been wel l
researched and may include infection and morbidity, and chronic pain ari sing from
infection , hyperalgesia, phantom pain or neuropathies, or indeed social problems for
instance, the tai l docking of cattle, in addition to removing their fly swats, may remove
a means to communicate (Melior and Stafford, 2000).
6.4 Future directions and Critique of the experimental design
I t i s now widely accepted that in order to understand the response of an animal to stress
it i s necessary to measure several variables. These variables may range from subtle
changes at the level of the central nervous system to systemic responses, and include
neurohumoral , hormonal and behavioural indices (for review see Melior et al. , 2000).
Recent advances in biomedical technology provide the opportunity for sophisticated
assessment of the stress responses of animals . Such technology includes the use of
telemetry and remote (i .e . hands-off) samplers including remote catheter systems
(Ingram et al. , 1 994) , portabl e devices such as the 'DracPac' and free-range
physiological monitors , and the use of electrodes to measure neural-evoked responses,
biosensors and microdialysis techniques (for review see Cook et al. , 2000) . This remote

Chapter 6: General Discussion 146
sampling approach would allow the measurement of baseline levels for a ful l 24 hours
before and after treatment, the merit of which was pointed out in Chapter two. In
addition, the use of more sophisticated behavioural assessments such as preference
testing, aversive tests or behavioural demand function may tell us more about what the
animal i s feeling than examining simple changes i n behaviour (for review see Cook
et al., 2000).
In the present study, changes in plasma cortisol concentrations and behaviour were used
to assess the pain-induced distress elicited by dehorning. It is possible that the response
time of the HPA-axis makes it insensitive as a means of distinguishing between
different levels of stress elicited within the first few minutes after a noxious insult, and
for this reason changes in the sympathetic nervous system or central nervous system
may be more useful during this period (Melior and Stafford, 1999a). The act of studying
an animal affects the response and may confound interpretation of results, and for this
reason there is merit in conducting hands-off assessment of stress responses. In chapter
two, however, it was shown that the experimental design used here was sufficiently
robust to account for fluctuations in the pretreatment state (Chapter two). Future
research should exploit advances i n technology. With regard to more direct
measurement of pain, perhaps measurement of nerve impulse traffic in nociceptors or
samples from the region of trauma may provide extra information about pain, although
pain is not nociception but rather a subjective experience. With respect to animal stress
and animal welfare, incremental improvements in husbandry practices may be most
practicable (Mel ior and Stafford, 1 999b, 200 1 ). There are obvious benefits from
continued research in the area of pain physiology as demonstrated by such surpri sing
discoveries as pre-emptive analgesia and the striking benefits of local anaesthetic plus
wound cautery.
En fin
It has been said that a society can be judged on how civi l ized i t i s by how i t treats its
prisoners (Dostoevsky 1 82 1 - 1 88 1 ), but it may be just as meaningful to see how society
cares for its other disenfranchised members including animals . It is our ethical duty to
not j ust reduce the pain and stress that animals experience under our auspices, but i n
fact strive to ameliorate their condition. In addition to intrinsic reasons, we should be
kind because i t i s good to do so (Proverbs 1 2 : 1 0) . Furthermore , i t has been
demonstrated that it pays to be kind (Sigmund, 2002).
fin

Bibliography 147
BIBLIOGRAPHY
Adeyemo 0 and Heath A. Social behaviour and adrenal cortical activity m heifers.
Applied Animal Ethology 1 982; 8 p99.
Alam MGS and Dobson H. Effect of various veterinary procedures on plasma
concentrations of cortisol , luteinising hormone and prostaglandin F2a metabolite
in the cow. Veterinary Record 1 986; 1 1 8 p7 .
Allyn ME. Use of a buddex dehomer versus an electrical dehomer as a means of reducing
stress when dehoming Holstein heifer calves Honors thesis, The State
University of New Brunswick, NJ, 1 99 1 .
Animal Welfare Advisory Committee. Code of recommendations and minimum standards
for the welfare of animals transported within New Zealand. Code of animal
welfare No 15. Ministry of Agriculture and Fisheries, Wellington, New Zealand,
Nov 1 994; ISBN 0-478-07372-0.
Anon. Beef cattle don't need horns. Queensland Agricultural Journal 1974; 100 p66.
Anon. Definition of animal welfare by the American Veterinary Medical Association. In:
Veterinary Report 199 1 ; 4 ( 1 ) .
Anon. FA WC updates the five freedoms. The Veterinary Record 1 992; 1 3 1 ( 1 6) p357.
Bamett JL and Hemsworth PH. The validity of physiological and behavioural measures
of animal welfare. Applied Animal Behaviour Science 1 990; 25 p77.
Battye J. Ethics and animal welfare - where do we go to from here? In: Animal Welfare in
the Twenty-first Century Ethical educational and Scientific Challenges.
Conference proceedings Apr 1994. Christchurch, New Zealand. ANZCCART,
Glen Osmond 1 995. p 15 .
Bayvel ACD. Implications of new animal welfare legislation. In: Animal Welfare in New
Zealand. June 1 992. Rotorua, NZ. Veterinary Continuing Education, Massey
Uni versity, NZ. p69 .
Boandle KE, Wohlt JE, Carsia RV. Effects of handling, administration of a local
anaesthetic and electrical dehoming on plasma cortisol in Holstein calves.
Journal of Dairy Science 1 989; 72.
Bonica JJ. Ed. The Management of Pain. 2nd ed. Lea and Febiger, Philadelphia, 1 990a.

Bibliography 148
Bonica JJ. Postoperative pain. In: The Management of Pain. 2nd ed. Ed. Bonica JJ. Lea
and Febiger, Phi ladelphia, 1990b; Chapter 25 .
Bonica JJ. Anatomic and physiologic basis of nociception and pain . In : The Management
of Pain. 2nd ed. Ed. Bonica JJ. Lea and Febiger, Philadelphia, 1 990c;
Chapter 3 .
Bonica JJ and Buckley FP. Regional analgesia with local anaesthetics. In: The
Management of Pain. 2nd ed. Ed. Bonica JJ. Lea and Febiger, Phi ladelphia,
1990; Chapter 94.
Bradshaw RH. The science of animal welfare and the subjective experience of animals.
Applied Animal Behaviour Science 1 990; 25 p 1 9 1 .
Brambell FWR. Report of the technical committee to enquire into the welfare of animals
kept under intensive l ivestock husbandry systems. Her majesty's stationery
office, London, 1 965 . Cited by: Ewbank R . Behavioural responses to stress in
farm Animals. In: Animal Stress. Ed. Moberg GP. American physiological
society, Bethesda, 1 985; Chapter 5 .
Broom DM. Indicators of poor welfare. British Veterinary Journal 1986; 142 p524 .
Broom DM. The scientific assessment of animal welfare. Applied Animal Behaviour
Science 1 988 ; 20 p5.
Buckwalter JA. Pharmacological treatment of soft-tissue injuries. Journal of Bone and
Joint Surgery 1 995 ; 77 p 1 902.
Cannon W. Stresses and strains of homeostasis American Journal of Medical Science
1935 . Cited by: Reite M. Implantable biotelemetry and social separation in
monkeys . In : Animal stress. Ed. Moberg GP. American physiological society,
Bethesda 1 985; Chapter 9.
Carmody J. Stress-induced analgesia: Is it a protective phenomena? In: Animal Pain
Ethical and Scientific Perspectives. Ed. Kuchel TR, Rose M, Burrel l J . Apr
1990. Adelaide, Australia. ACCART, Glen Osmond, 1 992; p26.
Carter PD, Johnston NE, Corner LA, Jarrett RG. Observations on the effect of electro
immobilisation on the dehoming of cattle. Australian Veterinary Journal 1 983;
60.

Bibliography 149
Chapman CR. Suffering in animals towards comprehensive definition and measurement
for animals care. In: Animal Pain Ethical and Scientific Perspectives. Ed. Kuchel
TR, Rose M, Burrel l J. Apr 1 990. Adelaide, Australia. ACCART, Glen Osmond
1 992; p 1 9 .
Colbum DR, Thompson DL, Roth TL, Capehart JS , White KL. Responses of cortisol
and prolactin to sexual excitement and stress in stallions and geldings. Journal of
Animal Science 1 99 1 ; 69 p2556.
Cooper C, Evans ACO, Cook S, Rawlings NC. Cortisol , progesterone and B-endorphin
response to stress in Calves . Canadian Journal of Animal Science 1995; 9 5
p 1 97.
Council of Europe. European convention for the protection of animals kept for farming
purposes. S trasbourg, France. 1 976. Cited by: Ewbank R. Behavioural
responses to stress in farm animals . In: Animal Stress. Ed. Moberg G P .
American Physiological Society, Bethesda, 1 985; Chapter 5 .
Cook CJ , Melior DJ, Harris PJ, Ingram JR, Matthews LR. Hands-on and hands-off
measurement of stress . In : The Biology of Animal Stress. Ed. Moberg GP and
Mench JA. CABI publishing, New York, 2000; Chapter 6 .
Craig JV and Swanson JC. Review: Welfare perspectives on hens kept for egg
production . Poultry Science 1994; 73 p92 1 .
Curtis SE. What constitutes animal well-being? In: The Biology of Animal Stress. Ed.
Moberg GP and Mench JA. CABI publishing, New York, 2000; Chapter 1 .
Dantzer R and Mormede P . Stress in farm animals: A need for reevaluation. Journal of
Animal Science 1 983 ; 57 p6.
Dart CM. Mechanisms of pain. In : Animal Pain and its Control. Proceedings 226. Post
Graduate Committee in Veterinary Science, University of Sydney, Apr 1 994a;
p333 .
Dart CM. The basis for the use of steroids/nonsteroidal anti-inflammatory drugs (NSAID)
for pain control in c linical practice. In: Animal Pain and its Control. Proceedings
226. Post Graduate Committee in Veterinary Science, University of Sydney, Apr
1 994a; p35 1 .

Bibliography 150
DiGiacomo RF, Hopkins SG, Darlington RL, Evermann JF. Control of bovine leukosis
in a dairy herd by a change in dehorning. Canadian Journal of Veterinary
Research 1 987; 5 1 .
Dinniss AS, Stafford KJ, Melior DJ, Bruce RA, Ward RN. The behaviour pattern of
lambs after castration using a rubber ring and! or castrating clamp with or without
local anaesthetic. New Zealand Veterinary Journal 1 999 ; 47 p 198.
Dostoevsky Fyodor [ 1 82 1 - 1 8 8 1 ] . Variations of this quote are commonly attributed to
him. See www.chosunjournal. com 3 1/3/02 - a watchdog journal of human
rights violations in North Korea.
Duncan IJH. Some studies on heart-rate and behaviour in the domestic fowl . Applied
Animal Ethology 1 979; 5 p295 .
Eckles CH and Anthony EL. Dairy Cattle and Milk Production. 5th ed MacMillan Co,
New York, 1 956. Cited by: Laden SA, Wohlt JE, Zajac PK, Carsia RV. Effects
of stress from electrical dehorning on feed intake, growth and blood constituents
of Holstein heifer calves. Journal of Dairy Science 1 985 ; 68 p3062 .
Endrenyi L. Pharmacokinetics. In: Principles of Medical Pharmacology. Ed. Kalant H
and Roschlau WHE. BC Decker Inc. Toronto, 1 989; Chapter 5 .
Ernst AJ. Some observations on behaviour of beef cattle at urea-molasses lick feeders.
Journal of the Australian Institute of Agricultural Science 1973; 39 p266.
Evans PC. The effect of ethanol on cortisol metabolism in man . MSc Thesis, Massey
University, New Zealand, 1979; p7 .
Ewbank R. The use and abuse of the term "stress" in husbandry and welfare. Veterinary
Record 1 973; 92 p709.
Ewbank R. Behavioural responses to stress in farm animals. In: Animal Stress. Ed.
Moberg GP. American Physiological Society, Bethesda, 1985; Chapter 5 .
Ewbank R. S tress : A general overview. In : Farm Animals and the Environment. Ed.
Phillips C and Piggins D. CAB International, Wal l ingford, Oxon, 1 992; p255 .
Faulkner PM and Weary DM. Reducing pain after dehorning in dairy calves. Journal of
Dairy Science 2000; 83 p2037.
Fell LR and Shut DA. Behavioural and hormonal responses to acute surgical stress in
sheep. Applied Animal Behaviour Science 1 989; 22 p283.

Bibliography 151
Fowler J and Cohen L. Practical Statistics for Field Biology. Open University Press ,
England, 1 990.
Fox S . Changes in plasma cortisol concentrations and behaviour before, during and after
ovariohysterectomy in bitches. PhD Thesis, Massey University, New Zealand,
1 994.
Fraser AF and Broom DM. Farm Animal Behaviour and Welfare. 3rd ed. Bailliere
Tindall , London, 1 990.
Fraser D, Ritchie JSD, Fraser AF. The term "stress" in the veterinary context. British
Veterinary Journal 1 975; 131 p653 .
Freund PR and Marvin JA. Postburn pain . In: The Management of Pain. 2nd ed. Ed.
Bonica JJ. Lea and Febiger, Phi ladelphia, 1 990; Chapter 26.
Garcia A, Mart 0, Valles A, Dal-Zotto S. Recovery of the hypothalarnic-pituitary-adrenal
response to stress. Neuroendocrinology 2000; 72 p 1 1 4.
Gee RW. Animal welfare - the real issues for urban and rural Australia. Australian
Veterinary Journal 1986; 63 p82.
Goldstein RA, Bowen DL, Fauci AS. Adrenal corticosteroids. In : Inflammation: Basic
principles and clinical correlates. 2nd ed. Ed. Gallin JI, Goldstein IM,
Synderman R . Raven Press, New York, 1992; Chapter 55 .
Goonewardene LA and Hand RK. Studies on dehorning steers m Alberta feedlots.
Canadian Journal of Animal Science 199 1 ; 71 p 1 249.
Graf B and Senn M. Behavioural and physiological responses of calves to dehorning by
heat cauterization with or without local anaesthesia. Applied Animal Behaviour
Science 1999; 62 p 153 .
Grondahl-Nielsen C , Simonsen HB, Darnkjer Lund J, Hesselholt H. Behavioural
endocrine and cardiac responses in young calves undergoing dehorning without
and with use of sedation and analgesia. The Veterinary Journal 1 999; 158 p 14.
Guyton AC. Textbook of Medical Physiology. 8th ed. WB Saunders co, Philadelphia,
1 992.
Gwazdauskas FC, Paape MJ, Peery DA, McGilliard Ml. Plasma glucocorticoid and
circulating blood leukocyte responses in cattle after sequential intramuscular
injections of ACTH. American Journal of Veterinary Research 1 980; 41 p 1 052.

Bibliography 152
Harrison R. Animal Machines: The new factory farming industry. Vincent S tuart l td,
London, 1 964.
Hemsworth PH, Bamett JL, Coleman GJ. Animal-human interactions in the promotion of
animal well-being handling and animal production. In: Improving the Well-being
of Animals in the Research Environment. Conference proceedings, Oct 1 993 .
Sydney, Australia. ANZCCART, 1 994; p87 .
Herd RM. Serum cortisol and stress in calves. Australian Veterinary Journal 1 989; 6 6
p34 1 .
Hinch GN. The behavioural and physiological assessment of well-being pain and distress
in sheep and cattle. In: Improving the well-being of animals in the research
environment. Conference proceedings, Oct 1993. Sydney, Australia.
ANZCCART, 1994; p35 .
Hudson S , Mullord M , Whittlestone WG, Payne E. Diurnal variations i n blood cortisol in
the dairy cow. Journal of Dairy Science 1975; 58 p30.
Humik JF. Welfare of farm animals . Applied Animal Behaviour Science 1988 ; 20 p 105 .
Ingram JR, Matthews LR, McDonald RM. A stress free blood sampling technique for
free ranging animals . In : Proceedings of the New Zealand Society of Animal
Production. Feb, 1994. Massey University, Palmerston North, New Zealand.
Jaffe J H and Martin W R. Opioid analgesics and antagonists. In: Goodman and Gilman's
The pharmacological Basis of Therapeutics. 8th ed. Ed. Goodman AG, Rail
TW, Nies AS, Taylor P. Pergamon Press Inc , New York, 1 990; Chapter 2 1 .
Johnson CB and Taylor PM. The importance of post-operative analgesia. Guest editorial .
British Veterinary Journal 1993 ; 149 p505 .
Johnston J D and Buckland R B. Response of male Holstein calves from seven sires to
four management stresses as measured by plasma corticoid levels . Canadian
Journal of Animal Science 1 976; 56 p727 .
Kantor TG. Ketoprophen : A review of it pharmacological and clinical properties .
Pharmacotherapy 1 986; 6 p93. Cited by: Sutherland M A Alleviation of the
distress caused by ring castration plus tailing of l ambs and dehoming of calves
MSc thesis Massey University New Zealand 1 999.

Bibliography 153
Katz J, Kavanagh BP, Sandler AN, Nierenberg H, Boylan JF, Freidlander M, Shaw BF .
Preemptive analgesia: Clinical evidence of neural plasticity contributing to
postoperative pain . Anaesthesiology 1 992; 77 p439.
Keller-Wood ME, Shinsako J, Dallman MF. Feedback inhibition of adrenocorticotropic
hormone by physiological increases in plasma corticosteroids in conscious dogs.
Journal of Clinical Investigation 1 983 ; 71 p859. Cited by: Sapolsky RM. Stress
the aging brain and the mechanisms of neuron death. MIT press, 1992.
Kehlet H. The stress response to surgery: Release mechanisms and the modifying effect
of pain relief. Acta Chir Scand Suppl 1988 ; SSO p22.
Keith et al. 1986. Cited by: Sapolsky RM. Stress the aging brain and the mechanisms of
neuron death. MIT press, 1 992.
Kent JE, Molony V, Robertson IS. Changes in plasma cortisol concentration in lambs of
three ages after three methods of castration and tail docking. Research in
Veterinary Science 1993 ; SS p246.
Kihurani DO, Mbiuki SM, Ngatia TA. Healing of dehoming wounds. British Veterinary
Journal 1989; 14S p580.
Kilgour R and Dalton C . Livestock Behaviour: A Practical Guide. Granada, London,
1 984.
King BD, Cohen RDH, Guenther CL, Janzen ED. The effect of age and method of
castration on plasma cortisol in beef calves. Canadian Journal of Animal Science
199 1 ; 7 1 p 257 .
Kitchell RL and Johnson RD. Assessment of pain in animals . In: Animal Stress. Ed.
Moberg GP. American Physiological Society, Bethesda, 1 985 ; Chapter 8.
Koger LM. Dehoming by injection of calcium chloride. Veterinary Medicine Small
Animal Clinician 1 976.
Kuchel TR, Rose M, Burrell J. Animal Pain: Ethical and scientific perspectives 1990 Apr
Barossa Valley Adelaide Australia Australian council on the care of animals in
research and teaching (ACCART) 1992.
Laden SA, Wohlt JE, Zajac PK, Carsia RV. Effects of stress from electrical dehoming on
feed intake, growth and blood Constituents of Holstein heifer calves. Journal of
Dairy Science 1985 ; 68 p3062.

Bibliography 154
Laedwig J. Development of the concept of stress and its application to farm animal
behaviour research. In: Applied Animal Behaviour: Past, Present and Future.
Ed. Appleby MC, Horrel l RI, Petherick JC, Hunter SM. Universities Federation
for Animal Welfare, Potters Bar, 1 99 1 . Cited by: Manteca X and Deag J M .
Individual differences i n temperament o f domestic animals: A review of
methodology. Animal Welfare 1993 ; 2 p247.
Lay Jr DC, Friend TH, Bowers CL, Grissom KK, Jenkins OCA. Comparative
physiological and behavioural study of freeze and hot-iron branding using dairy
cows. Journal of Animal Science 1992a; 70 p l l2 1 .
Lay Jr DC, Friend TH, Grissom KK, Bowers CL, Mal ME. Effects of freeze or hot-iron
branding of Angus calves on some physiological and behavioural indicators of
stress. Applied Animal Behaviour Science 1 992b; 33 p 1 37 .
Lehner PN. Sampling methods in behaviour research. In: Symposium Quantifying the
Behaviour of Poultry 1 992; p643 .
Lester SJ, Melior DJ, Holmes RJ, Ward RN, Stafford KJ. Behavioural and cortisol
responses of lambs to castration and tailing usmg different methods. New
Zealand Veterinary Joumal l996; 44 p45 .
Lester SJ, Melior DJ, Ward RN, Holmes RJ. Cortisol responses of young lambs to
castration and tailing using different methods. New Zealand Veterinary Journal
1 99 1 a; 39 p l 34.
Lester SJ, Melior DJ, Ward RN. Effects of repeated handling on the cortisol responses of
young lambs castrated and tailed surgical ly . New Zealand Veterinary Journal
1 991b ; 39 p 147.
Levine S. A definition of stress? In : Animal Stress. Ed. Moberg GP. American
Physiological Society, Bethesda, 1985 ; Chapter 4.
Loxton ID, Toleman MA, Holmes AE. The effect of dehoming Brahman crossbred
animals of four age groups on subsequent bodyweight gain . Australian
Veterinary Joumal 1 982; 58 p19 1 .
Lyons DM, Price EO, Moberg GP. Social grouping tendencies and separation-induced
distress in juvenile sheep and goats. Developmental Psychobiology 1 993; 2 6
p25 1 .

Bibliography 155
MacAdam WR and Eberhart RJ. Diurnal variation in plasma corticosteroid concentration
in dairy cattle. Journal of Dairy Science 1972; 55 p 1792.
MacDiarmid SC. The induction of calving using betamethasone and the pharmacological
activity of selected formulations having different rates of absorption. PhD thesis,
Massey University, NZ 1982; p48 .
Manteca X and Deag JM. Individual differences in temperament of domestic animals: A
review of methodology. Animal Welfare 1 993 ; 2 p247.
Martin P and Bateson P. Measuring Behaviour: An Introductory Guide. Cambridge
University Press, Cambridge, 1986.
Mason JW. A review of psychoendocrine research on the pituitary-adrenal cortical
system. Psychosom Med 1 968; 30 p576-607 . Cited by: Levine S . A definition
of stress? In: Animal Stress. Ed. Moberg GP. American Physiological Society,
Bethesda, 1985; Chapter 4.
Mason JW. A historical view of the stress field. J Hum Stress 1 975a; 1 p6. Cited by:
Levine S. A definition of stress? In: Animal Stress. Ed. Moberg GP. American
Physiological Society, Bethesda, 1985; Chapter 4.
Mason JW. A historical view of the stress field. J Hum Stress 1 975b; 1 p22. Cited by:
Levine S . A definition of stress? In: Animal Stress. Ed. Moberg GP. American
Physiological Society, Bethesda, 1985; Chapter 4.
Matteri RL, Carroll JA, Dyer CJ. Neuroendocrine responses to stress. In: The Biology of
Animal Stress. Ed. Moberg GP and Mench JA. CABI publ ishing, New York,
2000; Chapter 6.
Matthews LR. Behavioural measures of animal welfare. In: Animal Welfare in New
Zealand. June 1992. Rotorua, NZ. Veterinary Continuing Education, Massey
University, NZ. Publication #144. p37.
McMeekan, CM. Evaluation of strategies for alleviating dehoming distress in calves. MSc
thesis . Massey University, New Zealand, 1997.
McMeekan CM, Melior DJ, Stafford KJ, Bruce RA, Ward RN, Gregory NG. Effects of
shallow scoop and deep scoop dehoming on plasma cortisol concentrations in
calves. New Zealand Veterinary Joumal 1 997 ; 45 p72 .

Bibliography 156
McMeekan CM, Melior DJ, Stafford KJ, Bruce RA, Ward RN, Gregory NG. Effects of
local anaesthesia of 4 or 8 hours' duration on the acute cortisol response to scoop
dehoming i n calves. Australian Veterinary Journal 1998a; 76 p28 1 .
McMeekan CM, Stafford KJ, Melior DJ, Bruce RA, Ward RN, Gregory NG. Effects of
a regional anaesthesia and/or non-steroidal anti-inflammatory analgesic on the
acute cortisol response to dehoming in calves. Research in : Veterinary Science
1 998b; 64 p 1 47 .
McMeekan CM, Stafford KJ, Melior DJ, Bruce RA, Ward RN, Gregory NG. Effects of
a local anaesthetic and a non-steroidal anti-inflammatory analgesic on the
behavioural responses of calves to dehoming. New Zealand Veterinary Journal
1999; 47 p92.
Meischke HRC, Ramsay WR, Shaw FD. The effect of horns on bruising m cattle.
Australian Veterinary Journal 1974; SO p432.
Melior DJ, Molony V, Robertson IS . . Effects of castration on behaviour and plasma
cortisol concentrations in young lambs, kids and calves. Research in Veterinary
Science 199 1 ; 51 p 149.
Melior DJ. Physiological measurements of animal welfare. In : Animal Welfare in New
Zealand. June, 1992. Rotorua, NZ. Veterinary Continuing Education, Massey
University, NZ Publication #144. p25.
Melior DJ. Learning from refinement strategies applied at low and high levels of
noxiousness. Progress in the reduction, refinement and replacement of animal
experimentation 2000; p 65.
Mel ior DJ, Cook CJ, S tafford KJ. Quantifying some responses to pain as a stressor. In:
The Biology of Animal Stress. Ed. Moberg GP and Mench JA. CABI
publ ishing, New York, 2000; Chapter 9.
Melior DJ and Holmes RJ. Ring versus knife for docking and castration of lambs.
Australian Veterinary Journal 1 988 ; 65 p403 .
Melior DJ and Molony V. Castration and/or tail docking of lambs. The Veterinary Record
1 995; 1 37 p227.
Melior DJ and Murray L. Effects of tail docking and castration on behaviour and plasma
cortisol concentrations in young lambs. Research in Veterinary Science 1 989a;
46 p387 .

Bibliography 157
Melior DJ and Murray L. Changes in the cortisol responses of lambs to tail docking
castration and ACTH injection during the first seven days after birth. Research in
Veterinary Science 1 989b; 46 p392 .
Melior DJ and Reid CSW. Concepts of animal well-being and predicting the impact of
procedures on experimental animals. In: Improving the Well-being of Animals in
the Research Environment. Conference proceedings, Oct 1 993 . Sydney,
Australia. ANZCCART, 1994.
Melior DJ and Stafford KJ. Acute castration and/or tailing distress and its alleviation in
lambs . New Zealand Veterinary Joumal 2000; 48 p33 .
Melior DJ and Stafford KJ. Assessing and minimizing the distress caused by painful
husbandry procedures in ruminants. In practice 1999a; p436.
Melior DJ and Stafford KJ. A "gold standard" or "incremental improvement" as ethical
strategies for enhancing animal welfare. Proceedings of the 16th annual seminar
of the Society of Dairy Cattle Veterinarians of the NZVA, 1 999b.
Melior DJ and Stafford KJ. Interpretation of cortisol responses in calf disbudding studies .
New Zealand Veterinary Joumal 1 997 ; 45 p 1 26 .
Melior DJ and Stafford KJ. Integrating practical regulatory and ethical strategies for
enhancing farm animal welfare . Australian Veterinary Joumal 200 1 ; 79 p762 .
Melior DJ, Stafford KJ, Todd SE, Lowe TE, Ward RN, Gregory NG, Bruce RA.
Comparison of cortisol and catecholamine responses to ring castration and tailing
of lambs and amputation dehorning of calves. Australian Veterinary Journal In
press.
Melzack R and Casey KL. Sensory motivational and control determinants of pain a new
conceptual model . In: The Skin Senses. Ed. Kenshalo D and Springfield T .
1 968 . Cited by: Bateson P . Do animals feels pain? New Scientist 1992; 1 3 4
p30.
Merskey H. Pain terms: A l is t with definitions and notes on usage. Pain 1979; 6. Cited
by: Melior DJ, Cook CJ, Stafford KJ. Quantifying some responses to pain as a
stressor. In: The Biology of Animal Stress . Ed. Moberg GP and Mench JA.
CABI publishing, New York, 2000; Chapter 9.
Ministry of Agriculture and Fisheries. Code of animal welfare No 4 . Code of
recommendations and minimum standards for the welfare of dairy cattle.

Bibliography 158
Ministry of Agriculture and Fisheries 1 992. Wel lington, New Zealand. ISBN 0-
477-0856 1 -X.
Ministry of Agriculture and Fisheries. Summary of the law relating to farm animal
operations. Ministry of Agriculture and Fisheries. Wellington, New Zealand.
ISBN 0-478-0740 1 -8 .
Moberg GP. Biological response to stress: Key assessment of animal well-being? In :
Animal Stress. Ed. Moberg GP. American Physiological Society, Bethesda,
1985; Chapter 3 .
Moberg G P and Mench J A Editors The Biology of Animal Stress. Ed. Moberg GP and
Mench JA. CABI publishing, New York, 2000.
Molony V, Kent JE, Robertson IS . Behavioural responses of lambs of three ages in the
first three hours after three methods of castration and tail docking. Research in
Veterinary Science 1 993; 55 p236.
Morisse JP, Cotte JP, Huonnic D . Effect of dehoming on behaviour and plasma cortisol
responses in young calves. Applied Animal Behaviour Science 1 995; 43 p239.
Morton DM and Griffiths PHM. Guidelines on the recognition of pain distress and
discomfort in experimental animals and an hypothesis for assessment. Veterinary
record 1 16 ; p43 1 .
Morton DB. Challenges for animal welfare. RCVS Charter (Royal College of Veterinary
Surgeons) symposium #150. Chal lenges for change. 1995 ; p6 1 .
Munck A Naray-Fejes-Toth A . Physiological functions of glucocorticoids in stress and
their relation to pharmacological actions. Endocrine Reviews 1 984; 5 p25 . Cited
by: Sapolsky RM. Stress the Aging Brain and the Mechanisms of Neuron Death.
MIT press, 1 992.
Murphy C. The "new genetics" and the welfare of animals . New Scientist 1 988 .
Lord Nelson 1 8 1 0. Noted in: Hibbert C . Nelson: A Personal History. Penguin books ltd,
London, 1 994.
Oehme FW. The Integumentary System In: Textbook of Large Animal Surgery. Ed.
Oehme FW and Prier JE. The Williams and Wilkins company, Baltimore, 1 974;
p 1 99 .

Bibliography 159
O'Hara PJ. The MAF role in animal welfare. In: Animal Welfare in New Zealand. June
1 992, Rotorua, NZ. Veterinary Continuing Education, Massey University , NZ;
p 1 05 .
Owen E. Cattle calf dehoming methods and equipment. Farm Production and Practice.
MAF Information Services, 1984.
Petrie NJ. Assessment of tail docking and disbudding distress and its alleviation m
calves. MSc Thesis, Massey University, New Zealand, 1 994.
Petrie NJ, Melior DJ, Stafford KJ, Bruce R, Ward RN. Cortisol responses of calves to
tail docking using rubber rings or a docking iron with or without local
anaesthetic in 3-4 month old calves. In: Proceedings of the 20th annual meeting
of the Physiological society of New Zealand. May 1 993 , Massey University,
Palmerston North, New Zealand; p22.
Petrie NJ, Melior DJ, Stafford KJ, Bruce R, Ward RN. Cortisol responses of calves to
two methods of tail docking used with or without local anaesthetic . New Zealand
Veterinary Journal 1996a; 44 p4 .
Petrie NJ, Melior DJ, Stafford KJ, Bruce RA, Ward RN. Cortisol responses of calves to
two methods of disbudding used with or without local anaesthetic. New Zealand
Veterinary Journal 1996b; 44 p9 .
Petrie NJ, Stafford KJ, Melior DJ, Bruce RA, Ward RN. The behaviour of calves tail
docked with a rubber ring used with or without local anaesthesia. Proceedings of
the New Zealand Society for Animal Production 1 995 ; 55 p55.
Pollard JC, Littlejohn RP, Johnstone P, Laas FJ, Corson ID, Suttie JM. Behavioural and
heart rate responses to velvet antler removal in Red deer. New Zealand
Veterinary Journal 1992; 40 p56 .
Regan T. The Case for Animal Rights. University of California Press, Berkeley, LA,
1 983 .
Reite M . Implantable biotelemetry and social separation in monkeys . In: Animal Stress .
Ed. Moberg GP. American Physiological Society, Bethesda, 1985; Chapter 9.
Ritchie JM and Greene NM. Local anaesthetics. In: Goodman and Gilman 's The
pharmacological Basis of Therapeutics. Ed. Goodman AG Rail , TW Nies, AS
Taylor P. Pergamon Press Inc, New York, 1990. 8th ed. Chapter 1 5 .

Bibliography 160
Robertson IS, Kent JE, Molony V. Effect of different methods of castration on behaviour
and plasma cortisol i n calves of three ages. Research in Veterinary Science 1 994;
56 p8 .
Rollin BE. Animal Rights and Human Morality. Prometheus Books, Buffalo, 1 98 1 .
Roosevelt F D. "The four Human Freedoms" speech . Address to congress, 6 Jan 1 94 1 .
Public papers ( 1 94 1 ) vol 9 . In : The Concise Oxford Dictionary of Quotations.
3rd ed. Oxford University Press, Oxford, 1 993; p262.
Rose M and Adams D. Evidence for pain and suffering m animals In: Animal
Experimentation: The consensus changes. Ed. Langley G. MacMillan Press
Scientific and Medical, London, 1989.
Rosner W. The functions of corticosteroid-binding globulin and sex hormone-binding
globulin : Recent advances. Endocrine Reviews 1 990; 11 p80.
Ruder HJ, Guy RL, Lipsett MB. A radioimmunoassay for cortisol in plasma and urine.
Journal of Clinical Endocrinology and Metabolism 1972; 35 p2 1 9.
Rushen J. Problems associated with the interpretation of physiological data in the
assessment of animal welfare . Applied Animal Behaviour Science 199 1 ; 2 8
p38 1 .
Rushen J. Some problems with the physiological concept of "stress" Australian
Veterinary Joumal 1 986; 63 p359.
Sapolsky RM. Stress in the Wild. Scientific American 1 990; 262 p 1 06 .
Sapolsky RM. Stress the Aging Brain and the Mechanisms of Neuron Death. MIT press ,
1 992.
Schalk AF and Amadon KS. Physiology of the ruminant stomach. Bulletin of North
Dakota Agricultural Experimental Station 1 928; 216 p l .
Seidel Jr GF. Basic principles of experimental design . In : The experimental animal in
biomedical research. Chapter 6, p 8 1 -93.
Seyle HA. A syndrome produced by diverse nocuous agents. Nature London 1 936; 1 3 8
Cited by: Levine S . A definition of stress? In: Animal Stress. Ed. Moberg GP .
American Physiological Society, Bethesda, 1985; Chapter 4.

Bibliography 161
Seyle HA. The general adaptation syndrome and the disease of adaptation. J Clin
Endocrinol 1 946. Cited by: Reite M. Implantable biotelemetry and social
separation in monkeys. In: Animal Stress. Ed. Moberg GP. American
Physiological Society, Bethesda, 1 985; Chapter 9.
Seyle HA. What i s stress? Metabolism 1 956. Cited by: Reite M. lmplantable biotelemetry
and social separation in monkeys In: Animal Stress. Ed. Moberg GP. American
Physiological Society, Bethesda, 1 985; Chapter 9.
Seyle H. Stress without Distress. Lippincott, Philadelphia, 1974.
Shaw FD, Baxter RI, Ramsay WR. The contribution of horned cattle to carcase bruising.
The Veterinary Record 1 976; 98 p255.
Shott S. Nonparametric statistics. Journal of the American Veterinary Medical Association
1 99 1 ; 1 98 p 1 1 26.
Shott S. Statistics for Health Professionals. WB Saunders co, London, 1 990.
Shutt DA, Fel l LR, Connell R, Bell AK, Wallace CA, Smith AI. Stress-induced changes
in plasma concentrations of immunoreactive b-endorphin and cortisol in response
to routine surgical procedures in lambs. Australian Journal of Biological Science
1 987; 40 p97 .
Shutt DA, Fel l LR, Connell R, Bell AK. Stress responses in lambs docked and castrated
surgically or by the application of rubber rings. Australian Veterinary Journal
1 988 ; 65 p5 .
Sigmund K, Sehr E, Nowak MA. The economics of fair play. Scientific American 2002;
286 p 8 2 .
Singer P . Studies i n Bioethics. In : Rollin B . The unheeded cry: Animal consciousness
animal pain and science. Oxford University Press, 1989
Singer P. Animal Liberation: Towards an End to Man 's Inhumanity to Animals. Jonathan
Cape, London , 1 975.
Slater JS and Mellor DJ. Within-day variations in the composition of maternal and foetal
plasma from catheterised ewes fed once daily or at hourly intervals during late
pregnancy . Research in Veterinary Science 1 98 1 ; 31 p224.

Bibliography 162
Stafford KJ, Melior DJ, Ward RN, Cann B . Behavioural response of calves to
amputation dehoming with or without local anaesthesia. Proceedings of the New
Zealand Society of Animal Production 2000; 60 p234.
Stafford KJ and Melior DJ. Castration, tail docking and dehoming - What are the
constraints? Proceedings of the New Zealand Society of Animal Production
1993 ; 53 p 1 89.
Stamp-Dawkins M. Animal Suffering: The Science of Animal Welfare. Chapman and
Hall , London, 1980.
Sutherland MA. Alleviation of the distress caused by ring castration plus tailing of lambs
and dehoming of calves. MSc thesis, Massey University , New Zealand, 1999.
Sutherland MA, Melior DJ, Stafford KJ, Gregory NG, Bruce RA, Ward RN. Effect of
local anaesthetic combined with wound cauterisation on the cortisol response to
dehoming in calves. Australian Veterinary Journal In press (2002a).
Sutherland M A, Mellor D J, Stafford K J, Gregory N G, Bruce R A, Ward R N .
Modification of cortisol responses to dehoming in calves using a 5-hour local
anaesthetic regimen plus phenylbutazone ketoprofen or adrenocorticotropic
hormone injected prior to dehoming. Research in Veterinary Science In press
(2002b).
Sylvester SP, Mellor DJ, Stafford KJ, Bruce R, Ward RN. Cortisol responses to
different methods of dehoming in six-month old calves. Proceedings of the 20th
Annual Meeting of the Physiological Society of New Zealand May 1 993, Massey
University, Palmerston North, New Zealand, p 2 1 . ISSN 1 17 1 -80 1 3 .
Sylvester SP, Melior DJ, Stafford KJ, Bruce RA, Ward RN. Acute cortisol responses of
calves to scoop dehoming using local anaesthesia and/or cautery of the wound.
Australian Veterinary Joumal 1998a; 76 p 1 18 .
Sylvester S P , S tafford K J , Mel ior D J, Bruce R A, Ward R N. Acute cortisol responses
of calves fol lowing four methods of dehoming by amputation. Australian
Veterinary Joumal 1998b; 76 p 1 23 .
Taschke A and Folsch D . Effects of stress from electrical dehoming of calves on cortisol
in saliva and on behaviour. Landwirtschaft Schweiz Band 1 993 ; 6 p340.
Taschke AC and Folsch DW. Effects of electrical dehoming on behaviour and on salivary
cortisol in calves. Proceedings of the International Congress of Applied

Bibliography 163
Ethology. 3rd joint meeting, Berlin . Ed. Nichelmann M, Nierenga HK, Braun S
1 995 .
Taylor GB . Prevention of unnecessary mutilation of farm l ivestock. The Veterinary
Record 1 974; 95 p369.
Tinbergen. On aims and methods of ethology. Zeitschrift fur Tierpsychologie 1963 ; 2 0
p4 10-43 3 . Cited by: Martin P and Bateson P. Measuring Behaviour: An
Introductory Guide. Cambridge University Press, Cambridge, 1 986.
Van Rooijen J. The value of a phi losophical fundament for animal welfare research.
Applied Animal Behaviour Science 199 1 ; 28 p387.
Van Rooijen J. The value of philosophical discussion for the clarification of the position
of applied animal behaviour science. Applied Animal Behaviour Science 1 992;
33 p289.
Verkerk GA, MacMillan KL, McLeay LM. Adrenal cortex response to
adrenocorticotropic hormone in dairy cattle in New Zealand. Domestic Animal
Endocrinology 1993.
Wall PD. The prevention of postoperative pain. Editorial . Pain 1 988 ; 33 p289.
Watson . Psychology from the standpoint of a behaviourist. 2nd ed. 1 924. Lippincott,
Phi ladelphia. Cited by: Stamp-Dawkins M. Animal Suffering: The Science of
Animal Welfare. Chapman and Hall , London, 1 980; p 1 1 .
Weaver AD. Library of Veterinary Practice: Bovine Surgery and Lameness. Blackwell
Scientific Publications, 1 986.
Wiepkema PR and Koolhaas JM. Stress and Animal Welfare. Animal Welfare 1 993; 2
p 1 95 .
Wiepkema PR, Van Hellemaond KK, Roessingh P , Romberg H. Behaviour and
abomasal damage in individual veal calves. Applied Animal Ethology 1987; 1 0
p287.
Winks L, Holmes AE, O'Rourke PK. Effect of dehoming and tipping on liveweight gain
of mature Brahman crossbred steers. Australian Journal of Experimental
Agriculture and Animal Husbandry 1977; 17 p 16.

Bibliography 164
Wohlt JE, Allyn ME, Zajac PK, Katz LS. Cortisol increases in plasma of Holstein heifer
calves from handling and method of electrical dehoming. Journal of Dairy
Science 1 994; 77 p3725 .
Wood ON, Molony V, Fleetwood-Walker SM, Melior DJ. Effects of local anaesthesia
and intravenous naloxone on the changes in behaviour and plasma concentrations
of cortisol produced by castration and tail docking with tight rubber rings m
young lambs. Research in Veterinary Science 199 1 ; 51 p 1 93 .
Woolf CJ and Chong MS. Preemptive analgesia - Treating postoperative pam by
preventing the establishment of central sensitization. Anaesthesia and Analgesia
1 993 ; 77 p362.
Zavy MT, Juniewicz PE, Phi llips WA, Von Tungeln DL. Effect of initial restraint,
weaning and transport stress on baseline and ACTH-stimulated cortisol
responses in beef calves of different genotypes. American Journal of Veterinary
Research 1 992; 53 p55 1 .
Zhang S , Hennessy DP, Cranwell PD. Pituitary and adrenocortical responses to
corticotropin-releasing factor in pigs. American Journal of Veterinary Research
1 990; 5 1 p 102

Appendix A 165
APPENDIX A : PRESENTATIONS AND PUBLICATIONS OF THIS
WORK
Oral presentations
May 1 993 Sylvester SP, Mel lor DJ, Stafford KJ, Bruce RA, Ward RN. " Cortisol
responses to dehorning in six-month-old calves" . Proceedings of the
twentieth annual New Zealand Physiological Society Conference . Vol . ,
13 . May 1993. Abstracts published. ISSN 1 17 1 -801 3
June 1 993
Dec 1 993
"Assessment and alleviation of dehorning distress zn calves" .Closed animal welfare workshop at Massey University.
"Assessment and alleviation of de homing distress in calves " . MAF Policy meeting. Paraparaumu, Wellington.
Publ ications
Sylvester SP, Melior DJ, Stafford KJ, Bruce RA and Ward RN. " Cortisol responses to
dehorning in six-month-old calves" . Proceedings of the twentieth annual
New Zealand Physiological Society Conference. Vol . , 1 3 . May 1 993 .
Abstracts published. ISSN 1 1 7 1 -80 1 3
Petrie NJ, Sylvester SP, Dinniss A. Animal Welfare in the twenty-first century: Ethical
and Educational Challenges. Australian and New Zealand Council for the
Care of Animals in Research and Teaching (ANZCCART) Conference.
April 1 994. Christchurch Medical School , Christchurch, New Zealand.
Sylvester SP, Mellor DJ, Stafford KJ, Bruce RA, Ward RN. Acute cortisol responses of
calves to scoop dehoming using local anaesthesia and/or cautery of the
wound. Australian Veterinary Joumal 1998; 76 p 1 1 8- 1 22.
Sylvester SP, Stafford KJ, Melior DJ, Bruce RA,Ward RN. Acute cortisol responses of
ca lves to four methods of dehoming by amputation . Australian
Veterinary Journal 1 998; 76 p 1 23- 126 .

Appendix A 166
Sylvester SP, Melior DJ, Stafford KJ, Bruce RA and Ward RN. " Cortisol responses to
de homing in six-month-old calves" . Proceedings of the twentieth annual
New Zealand Physiological Society Conference. Vol . , 1 3 . May 1 993 .
Abstracts published. ISSN 1 17 1 -801 3
CORTISOL RESPONSES TO D IFFER ENT M ETHODS O F DEHORN I N G I N 6 M O NTH OLD CALVE S . Shauna. P.Sylvester1, D.J. Mellor1, K.J.Stafford2, RA Bruce2, & R.N.Wardl Departments of 1 !'hysiology and Anatomy, and 2 Veterinary Clinical Sciences, Massey University, Palmerston North.
Dehoming is a routine husbandry practise designed to decrease injury to cattle a�d stock handlers. It is presumed to be a noxious experience, but the levels of distress caused by different methods and efficacy of alleviation h ave not been assessed. The present study is an early phase of such an investigation. The objectives were to compare cortisol responses t o d eh orning by scoop a n d gui l lotine shears i n order t o m a ke recommendations about the least distressful treatment whilst taking into account practical considerations. There were three treatments (9 calves in each): Control handling. dehoming by scoop and dehoming by guillotine shears. All treatments were bled before treatment and regularly thereafter for nine hours. Plasma cortisol concentrations were determined by radioimmunoassay. Cortisol concentrations above pretreatment concentrations were calculated. Control handling. dehoming by scoop and dehoming by guillotine shears caused mean ± SEM maximum rises of 23 ± 0.7 ng/ ml . 45 ± 2.6 ng/ ml , 40 ± 2.2ng/ ml ng/ml respectively; cortisol concentrations returned to pretreatment values at about,.Khr, 7 hr and 5.5 hr respectively. It is concluded that dehoming caused markedly greater cortisol responses than control handling. The significance of the differences between the responses using the two dehoming methods has yet to be determined.

Acute cortisol responses of calves to four methods of dehorning by amputation
SP SYLVESTER•, K] STAFFORDbc, DJ MELLOR•, RA BRUCEb and RN WARD•
Objective To measure the plasma cortisol response in calves dehorned by four different methods (scoop, guillotine shears, saw, embryotomy wire) for 9 h after dehorning.
Design A physiological study with controls.
Procedure Horn amputation was carried out on calves restrained manually in a race.
Results The four methods of dehorning provoked similarly increased cortisol responses which lasted for 6 h. During the first hour after dehorning the plasma cortisol concentrations were similar to those following ACTH injection. The overall cortisol response to control handling was about 30% of the responses to dehorning.
Conclusions The simi larity of the cortisol responses produced by the four methods of dehorning suggests that the distress experienced by calves following dehorning by amputation is similar regardless of method used. Aust Vet J 1 998;76:123·126
Key words: Calf. dehorning, scoop, embryotomy wire. saw, shears, cortisol.
ACTH Adrenocorticotropic hormone
D ehorning of cattle is a routine husbandry practise which improves the safery of stockhandlers and reduces injury, bruising of carcasses and damage to hides.
Caustic chemicals or cautery are used to disbud younger calves and amputation is used to dehorn older animals. All methods of dehorning are probably painful. Animals experiencing pain exhibit increased activiry of the hypothalamic-pituitary-adrenal axis as indicated by an increase in plasma cortisol concentration.
The changes in plasma cortisol concentration have been used as one index for assessing the distress caused by cattle husbandry practices1•2 including cautery disbudding3.4 and scoop amputation dehorning. 5 However no comparison has been made of the cortisol response to different methods of amputation dehorning and by inference the distress caused by these amputation techniques. Consequently the cortisol responses to amputation dehorning by scoop, saw, guillotine shears and embryotomy wire are reported here.
Materials and methods Animals
Fifty-seven male Friesian calves aged 5 to 6 months and weighing 99 to 1 59 kg (mean 130 kg) scheduled for dehorning
80epartment of Physiology and Anatomy, Massey University, Palmerston North, New Zealand boepartment of Veterinary Clinical Sciences, Massey University, Palmerston North, New Zealand c Author for correspondence
Aust Vet J Vol 76, No 2, February 1998
according to usual farm practise were used in this study. They were divided into five groups and the study was carried out over 3 days (Table 1) . On the evenings before each experiment day, calves were randomly selected from the herd, identification numbers were painted on their backs, and they were penned overnight in outside cattle yards (1 0 x 1 0 m) with access to water but not to food. The following morning one group was moved into a small pen (3 x 4 m) at 0700 h and a pretreatment blood sample was taken. At 1 1 00 h when these animals had been moved out of the sampling pen, the second group was placed in it. All blood samples were taken in that pen because its small size facilitated sampling by restricting movement of the calves. Fifteen minutes later the calves were moved into an adjacent race where they were restrained and dehorned. Immediately after dehorning the calves were returned to the small pen where blood samples were taken with decreasing frequency throughout the subsequent 9 h. Between 3 and 9 h after treatment, when sampling was at hourly intervals, the calves were let into an adjacent larger yard (1 0 x 10 m) where water was available. When required for sampling they were moved back to the smaller pen slowly and without undue interference. The duration of blood sampling was about 1 2 min for each group.
At the end of each 9 h sampling period the calves were returned to pasture. The following day calves were mustered into the yards and left to settle for 3 h, after which a blood sample was-(_.aken about 36 h after treatment.
Blood sampling Blood samples (1 0 mL) were taken by venipuncture from
either jugular vein 0.25 h before treatment (pretreatment), and at 0.25, 0.5, 1 , 1 .5, 2, 2.5, 3, 4, 5, 6, 7, 8, 9 and 36 h after treatment. Blood sampl�s were taken by one person whilst the calf was restrained by two or three other people. Calves were bled in the same order each time to test for possible effects of the blood sampling order on plasma cortisol concentrations.
Table 1. The number of animals reosiving the different treatments in
each group during the 3 days of the experimenL
Day 1 Day 2 Day 3 group group group
Treatment Total t 2 3 4 5
Control 1 0 2 2 2 3
Scoop 1 0 2 2 3 2
Guillotine shears 1 0 2 2 2 2 2
Saw 1 0 2 2 2 2 2
Embryotomy wire 1 0 2 2 2 2 2
ACTH 7 2 2
123
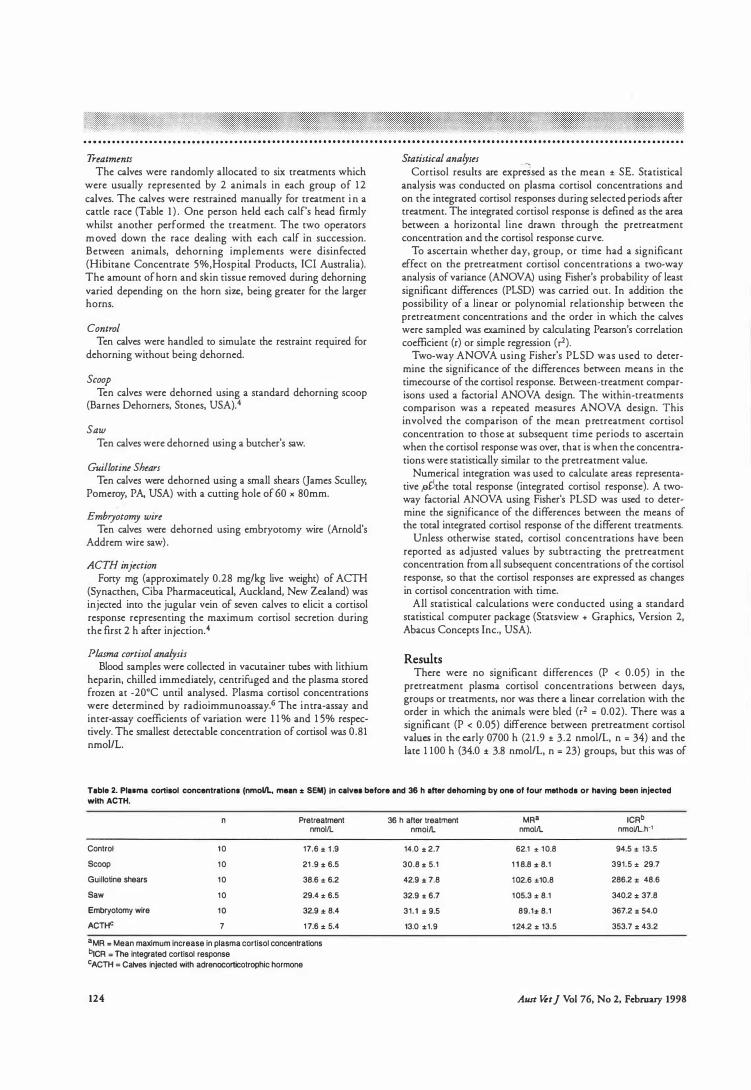
Treatments The calves were randomly allocated to six treatments which
were usually represented by 2 animals in each group of 1 2 calves. The calves were restrained manually for treatment i n a cattle race (Table 1 ) . One person held each calf's head firmly whilst another performed the treatment. The two operators moved down the race dealing with each calf in succession. Between animals, dehorning implements were disinfected (Hibitane Concentrate 5%,Hospital Products, !Cl Australia}. The amount of horn and skin tissue removed during dehorning varied depending on the horn size, being greater for the larger horns.
Control Ten calves were handled to simulate the restraint required for
dehorning without being dehorned.
Scoop Ten calves were dehorned using a standard dehorning scoop
(Barnes Dehorners, Stones, USA).4
Saw Ten calves were dehorned using a butcher's saw.
Guillotine Shears Ten calves were dehorned using a small shears Oames Sculley,
Pomeroy, PA, USA) with a cutting hole of 60 x 80mm.
Embryotomy wire Ten calves were dehorned using embryotomy wire (Arnold's
Addrem wire saw}.
ACTH injection Forty mg (approximately 0.28 mg/kg live weight) of ACTH
(Synacthen, Ciba Pharmaceutical, Auckland, New Zealand} was injected into the jugular vein of seven calves to elicit a cortisol response representing the maximum cortisol secretion during the first 2 h after injection. 4
Plasma cortisol analysis Blood samples were collected in vacutainer tubes with lithium
heparin, chilled immediately, centrifuged and the plasma stored frozen at -20"C until analysed. Plasma cortisol concentrations were determined by radioimmunoassay.6 The intra-assay and inter-assay coefficients of variation were 1 1 % and 1 5% respectively. The smallest detectable concentration of cortisol was 0.81 nmol/L.
Statistical analyses Cortisol results are expr�sed as the mean ± SE. Statistical
analysis was conducted on plasma cortisol concentrations and on the integrated cortisol responses during selected periods after treatment. The integrated cortisol response is defined as the area between a horizontal line drawn through the pretreatment concentration and the cortisol response curve.
To ascertain whether day, group, or time had a significant effect on the pretreatment cortisol concentrations a two-way analysis of variance (AN OVA) using Fisher's probability of least significant differences (PLSD) was carried out. In addition the possibility of a linear or polynomial relationship between the pretreatment concentrations and the order in which the calves were sampled was examined by calculating Pearson's correlation coefficient (r) or simple regression (rl).
Two-way AN OVA using Fisher's PLSD was used to determine the significance of the differences between means in the timecourse of the cortisol response. Between-treatment comparisons used a factorial ANOVA design. The within-treatments comparison was a repeated measures ANOVA design. This involved the comparison of the mean pretreatment cortisol concentration to those at subsequent time periods to ascertain when the cortisol response was over, that is when the concentrations were statistically similar to the pretreatment value.
Numerical integration was used to calculate areas representative ,oDthe total response (integrated cortisol response}. A twoway factorial ANOVA using Fisher's PLSD was used to determine the significance of the differences between the means of the total integrated cortisol response of the different treatments.
Unless otherwise stated, cortisol concentrations have been reported as adjusted values by subtracting the pretreatment concentration from all subsequent concentrations of the cortisol response, so that the cortisol responses are expressed as changes in cortisol concentration with time.
All statistical calculations were conducted using a standard statistical computer package (Statsview + Graphics, Version 2, Abacus Concepts Inc., USA).
Results There were no significant differences (P < 0.05} in the
pretreatment plasma cortisol concentrations between days, groups or treatments, nor was there a linear correlation with the order in which the animals were bled (r2 = 0.02}. There was a significant (P < 0.05) difference between pretreatment cortisol values in the early 0700 h (2 1 .9 ± 3.2 nmol/L, n = 34) and the late 1 100 h (34.0 ± 3.8 nmol/L, n = 23) groups, but this was of
Table 2. Plaoma cortisol concentration• (nmoVL, mean "' SEM) In calves before and 36 h after dehomlng by one of four methods or having been injected with ACTH.
Pretreatment nmolll.
Control 1 0 17.6 z 1 .9
Scoop 1 0 21 .9 "' 6.5
Guillotine shears 1 0 38.6 "' 6.2
Saw 1 0 29.4 "' 6.5
Embryotomy wire 1 0 32.9 ± 8.4
ACTH0 7 1 7.6 ± 5.4
8MR = Mean maximum increase in plasma cortisol concentrations biCR z The Integrated cortisol response cACTH = Calves injected wtth adrenocorticotrophic hormone
124
36 h after treatment MR8 ICRb nmoi/L nmoi/L nmolll..h·'
14.0 z 2.7 62.1 "' 1 0.8 94.5 "' 13.5
30.8 z 5.1 1 1 8.8 z 8.1 391.5 "' 29.7
42.9 "' 7.8 1 02.6 z10.8 286.2 "' 48.6
32.9 "' 6.7 1 05.3 "' 8.1 340.2 ± 37.8
31.1 ± 9.5 89.1= 8.1 367.2 ± 54.0
13.0 ±1.9 1 24.2 ± 13.5 353.7 ± 43.2
Aust Vet] Vol 76, No 2, February 1998

little consequence when compared to the plasma cortisol response to dehorning. Therefore the results from all groups were pooled and used to calculate the mean cortisol response to each treatment. The overall mean pretreatment concentration was 27.3 ± 2.4 nmol/L (n = 57). The pretreatment concentrations for each treatment are shown in Table 2.
After treatment, all calves showed transient increases in plasma cortisol concentration (P < 0.05), the magnitudes and durations of which varied according to the treatment.
Control Restraint and blood sampling resulted in a small transient rise
in plasma cortisol concentrations (P < 0.05). The maximum increment of 62 nmol/L occurred 1 5 minutes after treatment, after which the cortisol concentrations decreased and returned to pretreatment values by 1 h (Figure 1 ) .
D�horn�d treatment All four amputation dehorning methods (scoop, saw, guillo
tine shears and embryotomy wire), resulted in similar cortisol responses (Figure 2) , with no significant differences in the maximum rise in cortisol concentrations (89 to 1 1 9 nmol/L) or in the duration of increased cortisol concentrations. The maximum plasma cortisol concentrations occurred 0.5 to 1 .0 h after treatment. The mean cortisol concentrations then declined rapidly to plateau values which were maintained between 1 .5 and 3 h. The values at 2 and 2 .5 h in the calves which were dehorned by guillotine shears were smaller (P < 0.05) than those of the other groups of dehorned calves (Figure 2). Thereafter, from 3 h, cortisol secretion continued to decrease and the plasma cortisol concentration returned to pretreatment values by 6 h (Figure 2).
ACTH ACTH administration resulted in marked increases in
plasma cortisol concentrations, with a mean peak rise of 1 24 nmol/L 1 h after treatment. Large values were sustained for about 2.5 h, after which concentrations decreased and returned to pretreatment values by 4 h. Thereafter the concentrations declined further and remained smaller than pretreatment concentrations between 4 and 9 h (Figure 1). Between 6 and 9 h the cortisol concentrations in ACTH calves were significantly smaller than those of control calves, which exhibited a nonsignificant increase in concentrations during this period.
Integrated cortisol responses There were no significant differences (P < 0.05) between the
mean integrated cortisol responses of calves dehorned by any method, nor between the responses of dehorned and ACTH calves (Table 2) . The integrated responses (nmol/L.h-1) of dehorned and ACTH calves were between 3 to 3.9 times greater (P < 0.05) than the control response (Table 2).
Discussion In 5 to 6-month-old calves the four methods of dehorning
provoked similar marked cortisol responses which lasted for about 6 h. The cortisol responses in the first hour after dehorning were similar to those following the ACTH injection, indicating that dehorning caused maximum cortisol secretion during this period. The cortisol responses of the control calves were significantly smaller than those of dehorned calves. The difference in the pretreatment cortisol values between the early
Aust �t] Vo1 76, No 2, February 1998
-5 ISO b . . c E s. ;zo -• " to E " .. " .5 60
1 JO :e c u
(10) I I (I) l s 7 ) 6
Timt (hours)
Figure 1. The mean cortisol responses of calves to scoop
dehorning (circles), ACTH injection (squares) and control
handling (broken line). a = significantly different (P < 0.05) from
control values; b = ACTH calves are significantly (P < 0.05) different from scoop calves
-� c E .s. 120 -• " E 10 t " .5 60
1 :e lO
c u � ·
(10) (I) 3 4 s 6
Timt (hours) )6
Figure 2. The mean cortisol responses of calves to four methods
of dehorning; scoop (circles), guillotine shears (diamond), saw
(square) and embryotomy wire (broken line). b, c and d = responses in scoop, saw and embryotomy wire groups, respec
tively, are significantly different (P < 0.05) from those in calves
dehorned by the guillotine shears.
(0700 h) and late ( 1 1 00 h) groups was considered to be of no biological significance in relation to the magnitude of the subsequent cortisol responses.
It is not surprising that there were no significant differences in the peak magnitudes, durations, patterns or integrated cortisol responses between these four dehorning treatments, because they all involved surgical amputation of the horn, which presumably would result in similar trauma. The only differences were in the tools used to achieve this. Two observations suggest that the depth of wound or the different nature of the wound may have affected the cortisol response. First, scoop dehorning
125

which caused the deepest wounds, often perforating the frontal sinus of the skull, elicited cortisol responses which had the biggest (nonsignificantly) integrated cortisol response and peak magnitude. Secondly, dehorning with the guillotine shears caused quite superficial wounds and elicited cortisol responses which at 2 and 2.5 h after treatment were significantly less than those for all other dehorned calves. The shears also elicited the smallest (nonsignificant) integrated cortisol response. However this difference is not likely to have been due to wound depth because similar cortisol responses occurred in calves dehorned with scoops, which caused shallow or deep wounds.5
The pattern of cortisol concentrations seen after amputation dehorning in this study in 5 to 6-month-old calves was similar to the patterns seen in
. 6-week-old4 and 14-week-old5 calves
after scoop dehorning. The initial increase to peak concentrations after scoop dehorning apparently represents maximal cortisol secretion because a similar rate and peak concentration occurred after injection of ACTH in a quantity sufficient to maintain the peak concentration for 2 h after injection (Figure 1) . The cortisol response to dehorning appears to be divisible into three components: the initial increase to peak values and subsequent rapid decrease (the first 1 . 5 h), the plateau stage and then a decline to preyeatment values between 3 and 6 h after dehorning. The possibility of an exaggerated effect upon the cortisol response of sampling animals in pain, either as a result of increased pain from the sampling procedure, or an increase in the negative psychological component because of the association of that pain with the operators, has been examined in lambs7 by commencing blood sampling at different times after surgical castration and tailing of lambs. As no effects on the cortisol response were detected, Lester et aF suggested that this may be because either resampling itself was a benign procedure, or because the most noxious stimulus (in their case castration and docking) tended to dominate lesser noxious inputs (that is, sampling) from elsewhere. The effect of repeated sampling in the present study is unknown but the cortisol responses found here would represent at least the maximum expected under field conditions, when repeated handling and blood sampling does not occur after dehorning.
The duration of the cortisol response after control handling and sampling was 1 . 5 h, which is similar to that reported in other studies on calves.3·5 That the integrated cortisol response
126
of control calves was one third to a quarter of that after dehorning and was resolved 5 h earlier, suggests that the combination of handling and blood sampling was a benign procedure in comparison with dehorning, and that the predominant component of the response was the novelty of the situation. This is consistent with other studies in lambs8 and calves.4 It is possible that using an indwelling catheter rather than repeat venpuncture might have produced a smaller cortisol response. The absence of any effect on cortisol concentration at 36 h indicates that chronic distress may be minimal.
On the basis of this study there appears to be little difference in the cortisol response and by inference the distress experienced by calves with any one method of amputating horns. However, the rate of wound healing was not investigated.
Acknowledgments We thank Mr Dave Grant and Mr Gerard Poff the manager
of Keebles Farm. The Massey University Research Fund and MAFQuality Management provided financial support which is gratefully acknowledged. We also thank Ms Jane Candy and Associate Professor Keith Lapwood for advice on the cortisol assay.
References 1. Crookshank HR, Elissade MH, White RG, Clanton DC, Smalley HE. Effects of transportation and handling of calves upon blood serum composition. J Anim Sci 1 979;48:430-483.
2. Robertson IS, Kent JE, Molony V. Effects of different methods of castration on behaviour and plasma cortisol in calves of three ages. Res Vet Sci 1 994;56.1!-17.
3. Laden SA, Wohit JE, Zajac PK, Carsia RV. Effects of stress from electrical dehorning on feed intake, growth and blood constituents of Holstein heifer calves. J Dai Sci 1 985;68:3062-3066.
4. Petrie NJ, Melior DJ, Stafford KJ, Bruce RA, Ward RN. Cortisol responses of calves to two methods of disbudding used with or without local anaesthetic. NZ Vet J 1 996;44:9-14.
5. McMeekan CM, Melior DJ, Stafford KJ et al. Effects of shallow and deep sccoop dehorning on plasma cortisol concentrations in calves. NZ Vet J 1 997;
45:72-74.
6. Ruder HJ, Guy RL, Lipsett MB. A radioimmunoassay for cortisol in plasma urine. Enclocrin 1 972;35:219-24.
7. Lester SJ, Melior DJ, Ward RN, Holmes RJ. Effects of repeated handling on the cortisol responses of young lambs castrated and tailed surgically. NZ Vet J 1 991 ;39;147-149.
8. Melior DJ, Murry ·L. Effects of tail docking and castration on behaviour and plasma cortisol concentrations in young lambs. Res Vet Sci 1 986;46:387-391 .
(.Ai:ctpt<d for publication 6 January 1 998)
Aust Vet] Vo1 76, No 2, February 1998

Appendix B
APPENDIX B: DATA EXCLUDED FROM THE ANALYSES
1 76
As judged by their cortisol responses calves that were abnormally or excessively
distressed prior to and throughout the study were excluded from the results as outliers.
The determination of an outlier was made by satisfying two criteria: 1 ) if examination of
the cortisol timecourse showed a unique and aberrant pattern, and 2) where statistical
analysis of the cortisol response showed that the pretreatment and/or the integrated
cortisol response were greater than those encompassed by two standard deviations from
the mean for that treatment. The individual cortisol responses of the calves which were
excluded as outliers are shown in Fig B . 1 , Fig B .2, Fig B . 3 .
Two calves exhibited aberrant responses prior to and during the study: For both calf # 105
(LA -Scoop) and calf #8 1 (LA -Scoop+Cautery) the pretreatment cortisol concentrations
and the integrated cortisol responses (unadjusted areas) were greater than those
encompassed by two standard deviations from the mean response (see Fig B . 1 ) . Both
calves had a cortisol timecourse pattern which was unique and aberrant, such that, for calf
# 105 cortisol concentrations increased throughout the study period, and for calf #8 1
cortisol concentrations oscillated from high to low throughout (see Fig B . 1 ) . In addition,
calf #105 had an haematocrit estimated at about half that of other calves (20% compared to
the usual 40% ), and it subsequently died on day two of the study. It was therefore
concluded that both animals were suffering from a previous distress prior to and during
the study, and thus were excluded so as not to distort the mean cortisol responses of each
treatment.
In two cases the local anaesthetic did not work: The pretreatment cortisol concentrations
of calf #79 (LA-Scoop) and calf #69 (LA-Scoop+Cautery) were not statistical outliers.
However, their post-treatment cortisol responses were unlike that of any other individual
in their respective treatments, and were in fact similar to those found in the Scoop and
Scoop+Cautery treatments respectively. The integrated responses (unadjusted data) for
both were greater than those encompassed by two standard deviations from the mean for
their treatment group. It was concluded that the local anaesthetic had not worked in
decreasing the initial distress of dehoming, therefore these calves' responses were
excluded from the calculation of the respective mean response (see Fig B .2).
Three calves exhibited a pre-existing stress: Calves #70 (Control) , #90 (LA-Control) ,
and #66 (LA-Control) all had pretreatment cortisol concentrations and integrated cortisol
responses (unadjusted data) which were greater than those encompassed by two standard
deviations from the mean of their respective treatment group. In addition, at about four
hours after treatment, all three calves exhibited a drop in cortisol concentrations which
was substantially below pretreatment levels and levels remained there. This suggests that

Appendix B 1 77
there may have been an unknown stressor that in its own right or combined with the
treatment maintained a stress which masked the effect of the treatment alone for the first
four hours . Presumably after four hours the stressors were absent, because cortisol
concentrations fel l to levels substantially below pretreatment values . The low values after
four hours suggest that the baseline i n these calves if unstressed would have been
similarly low (see Fig B .3) .

40
30
! 5 c 20 ., E � u .:: 0 10 "' 't 0 u
Appendix B
; I Aberrant responses ! i
! i ! i
i ./
� ... .d·
I • -+-- �c o,p
f #I os\ LA-Scoop • I l',_ - - - o- · - 1 #81 lAS+Ct
... : . .a � ..... D,r-�- \ \a--.· ! \
t \ ' I
.' ; .' \
.' ; .' i
\ / ; . ,
( 1 0) +-r-""T-..,.---,,--r-..---,--r-,---.-DU'IT-r----; ( I ) 4 5 6
Time (hours) 36
F' ig 8 . 1 Comparison of changes in plasma cortisol concentrations o f calves #81
(LAS+Ct) and # l OS (LA-Scoop) to the mean (± SEMI Scoop response. For both these calves their cortisol responses were aberrant.
40
30
E Oo 20 5 c ., E � u 10
.:: 0 "' 't 0 u
(10)
(20) ( I )
/1 LA did not work
\ . ' • b
4 5 6 Time (hours)
-+-- S c o o p
L A - S c o o p
· - · • - - · # 6 9 LAS+Ct
' ' , . 0
#79 LA-Scoop
o .. ... ... .. .. .. .. o
3 6
Fig 8.2 Comparison of changes in plasma cortisol concentrations of calves #69
(LAS+Ct) and # 79 (LAS) to the mean (± SEMI Scoop and LA-Scoop response. For both these calves it appeared that the local anaesthetic did not work.
40
30
e bb 20 5 c "' E � 10
.5 Si 't 0 u
(10)
Pre-existing stress
LA-Control
#70 Control
#90 LA-Control
- · -- · - #66 LA-Control
4 5 6 Time (hours)
9 3 6
Fig B.3 Comparison of changes in plasma cortisol concentrations of calves #70
(Control) and #90 and #66 (LA-Control) to the mean (± SEMI LA-Control response. For these three calves their cortisol responses indicated that they were experiencing a stress prior eo the pre-treatment sample.
1 78

Appendix C
APPENDIX C: THE CORTISOL RADIOIMMUNOASSAY
Plasma Cortisol Analysis
1 79
Blood samples were collected in vacutainer tubes containing l i thium heparin, chi lled
immediately , centrifuged and the p lasma was stored at -20°C until analysed. Plasma
corti so l concentrat ions were determined by radioimmunoassay . The cort isol
radioimmunoassay technique was that of Ruder et al. ( 1 972) as modified by Evans
( 1979) [see Mac Diarrnid ( 1982) ] .
Radioimmunoassay theory
The radioimmunoassay (RIA) takes advantage of the competitive binding of unlabelled
antigen (C) and radioactively-labelled antigen (C*) to the antibody (Ab-C). In this RIA
the antigen is corti sol (C or C*) , the unlabel led-antigen is our sample (C) and the
antibody is anti serum to cortisol (Ab-C) . The amount of radioactively-label led antigen
and the amount of antibody is fixed and known, and to this is added an unknown
amount of unlabel led antigen (i .e . our sample) . The greater the amount of unlabelled
corti sol the more it competes with and the smaller the amount of radioactive corti sol
that can bind to the cortisol antibody . After incubation of the C, C* , and Ab-C, the
cortisol that is bound as the antigen-antibody complex is separated from the unbound
antigen , and the radioactivity of the bound phase is measured. The unlabelled antigen
wi l l e ither be a series of samples of known concentration, called standards, or the
unknown sample. A standard curve of concentration versus radioactivity is constructed
using the known standards , and by reference to thi s the amount of cortisol in the
unknown sample i s calculated.
Materials
The assay buffer was 0.0 1 M phosphate-buffered saline pH 7 .3 , containing 0. 1 % (W/V)
gelatin and 0.0 1 % sodium merthiolate.
Bovine gamma globulin (BgG) (Sigma Chemical Co. , St Louis, USA) was di ssolved in
assay buffer to give a 1 .5 % (Wiv) working solution of non-specific protein .
Polyethylene glycol 4000 (BDH Chemicals ltd. , Poole, UK) was dissolved in disti l led
water to give a 1 6. 2 % (W/V) solution which was used to separate bound from unbound
tritiated cortisol (3H-C).
The sc in t i l la t ion fluid w as to luen e : tr i ton x - 1 00 (2: 1 ) contammg 3 g of
2, 5 diphenyloxazole (PPO) (sigma chemical Co. , St Louis , USA) and 100 mg of 1 , 4-
bis (2-(5-phenyloxazolyl)) benzene phenyloxazolyphenyl-oxazolyl-phenyl) (POPOP)
(Sigma Chemical Co., St Louis , USA) per litre.

Appendix C 180
The cortisol antiserum (cortisol-3-oxime-bovine serum albumin . F3-3 14 . Endocrine
Sciences Products, Tarzana, CA. , USA) was stored frozen at a 1 :200 dilution i n assay
buffer. Immediatel y before use it was further di luted in assay buffer to a 1 :2000
dilution.
The tracer used was tritiated cortisol ( [ 1 ,2,6,7-3H] cortisol . Amersham, Life Sciences)
with a speci fi c activity of 2 .33 TBq/nmol , and a radioactive concentration of
63 Ci/mmol .
Dichloromethane
Ethanol
The Radioimmunoassay procedure
The corti sol in the plasma samples (0 .5 m l a liquots) was extracted by overnight
incubation in 5 ml of dichloromethane. The solvent was transferred to test tubes and
evaporated under a stream of air, and then the samples were resuspended in 0.5 ml of
ethanol to make up to the original sample volume.
Aliquots (0 . 1 ml ) of the samples, or the series of standard cortisol solutions (made-up
in ethanol) or the plasma "pools" were added to assay test tubes. This was done in
duplicate. The solution was evaporated under a stream of warm air . To each tube was
added 0. 1 ml of cortisol antiserum, 0. 1 ml of bovine-gamma-globulin, and 0. 1 ml of
tracer (3H-Cortisol) . The appropriate controls for the radioimmunoassay were made up
as shown in Table C. l . The tubes were vortexed and incubated overnight at 4 °C to allow
for equilibrium between the free and bound phase of the reagents.
Separation of the free and bound corti sol was achieved by the addition of 1 ml of
polyethylene glycol to each tube, which was then vortexed and incubated for 10 minutes
at 4°C. The bound phase (the precipitate) was collected by centrifuging the solution at
2 ,000 rpm for 20 minutes and aspirating off the supernatant . The precipitate was
redissolved in 1 ml of water. This solution was decanted into scinti l lation vials to which
6 ml of scintil lation fluid was added. The radioactivity in each vial was measured using
a Beckman LS 8000 scinti l lation counter. A standard curve was constructed using the
data from the series of standard cortisol solutions. The concentrations of the unknown
samples were calculated from thi s by extrapolation (Industry standard computer
package, Animal Science Dept . , Massey University, New Zealand). Each assay run took
around 3 days .

Appendix C 181
The intra-assay and inter-assay coefficients of variation were calculated using the three
sets of plasma pools and were about 1 0% and 1 4% respectively. The lowest detectable
concentration of cortisol was 0.3 ng/ml .
Table C. 1 The setting up of the radioimmunoassay and the appropriate controls.
cocktail Total B lank
tracer ( 3H-C) 0 . 1 ml 0. 1 ml
B gG 0. 1 ml
buffer 0. 1 ml
antiserum (Ab-C)
H20 0.9 ml
Samples
0. 1 m l
0. 1 m l
0. 1 m l