Copyright By Randall Kevin Stephenson 2013 datable material and inconsistencies in proxy data values...
55
Copyright By Randall Kevin Stephenson 2013
Transcript of Copyright By Randall Kevin Stephenson 2013 datable material and inconsistencies in proxy data values...
Copyright
By
Randall Kevin Stephenson
2013
LITHOSTRATIGRAPHIC RECORD OF NORTH SODA LAKE,
CARRIZO PLAIN, SAN LUIS OBISPO COUNTY, CALIFORNIA:
IMPLICATIONS FOR LATE PLEISTOCENE PALEOCLIMATE IN A CLOSED
HYPERSALINE LAKE BASIN
By
Randall Kevin Stephenson
A Thesis Submitted to the Department of Geological Sciences
California State University, Bakersfield
In Partial Fulfillment of the Requirements for the Degree of
Master of Science
In Geology
November, 2013
ii
ACKNOWLEDGEMENTS
I sincerely appreciate my advisor, Dr. Robert Negrini, for his patience and perseverance in my
education and encouragement as I prepared this thesis, and to Dr. Dirk Baron and Dr. Peter
Wigand for their continued support and input. To Eric Glauser, Tyler Nelson and Racqul
Ramirez for the much appreciated lab work you performed. To numerous colleagues that
provided that nudge when needed, your input is appreciated. To my parents, brothers and other
family members who offered great encouragement, thank you very much. And, to my wife
Brenda, I sincerely say thank you for enduring this arduous process and supporting my time
away that was needed to complete this project.
iii
ABSTRACT
Analyses of recently collected geochemical and petrophysical proxy data derived from
18.5 meters of core material obtained from the North Soda Lake of Carrizo Plain, California
have allowed for the extension of the paleoclimate record for Carrizo Plain beyond previously
published information to at least 80 ky bp, and possibly to 150 ky bp.
Radiocarbon dates of 23.2-22.3 and 22.1-20.3 cal kyr B.P. collected from shallow samples
were used to provide age control for reduced sediments found in the upper 4.5 meters of core
material collected from the North Soda Lake basin. This information, combined with visual
evidence, pollen grain analysis, and other proxy data, was used to establish relative lake levels
(shallow vs. deep) over time and confirm that the upper 6 m of core correlate to MIS2 pluvial
event that was responsible for pluvial lake highstands in the western US. Correlation of the
North Soda Lake core to the reference data below 6 m presents a challenge due to the absence
of datable material and inconsistencies in proxy data values obtained from XRD, SGR and
magnetic susceptibility analysis. However, by extrapolating an implied sedimentation rate,
derived from the radiocarbon dates for the upper 6 meters, across the entire 18 meters of core
material evaluated, and comparing this information with a previously published sedimentation
rate for core collected from South Soda Lake, two climate models were defined as plausible,
but differing climate histories with relative lake levels. The first model presents a climate
record that extends to late MIS 6, or approximately 150 ky bp. The overall average implied
sedimentation rate for this model of 0.13 mm per year is much slower than the rate of 0.3-0.4
mm per year established for the South Soda Lake core. For the second model the climate
record extends to early MIS 4, or approximately 80 ky bp and presents an overall average
sedimentation rate of 0.24 mm per year. While this rate is still lower than that of the Holocene-
iv
aged South Soda Lake core, it is closer by a factor of 2 and is therefore favored as the
paleoclimate record of Carrizo Plain region from Late Pleistocene time through the Holocene.

v
Table of Contents
Approvals i
Acknowledgments ii
Abstract iii
Table of Contents v
List of Figures vi
List of Tables vii
Introduction 1
Purpose 1
Location 1
Geologic and Physiographic Setting 3
Study Area 3
Basin Tectonic History 3
Basin Hydrology 5
Previous Work 6
Regional Work 6
Carrizo Plain 9
Methods and Results 15
Introduction 15
Core Collection 16
Analyses and Results 17
Physical Core Description 17
Magnetic Susceptibility 19
Whole Core Susceptibility (w) 20
Box Sample Susceptibility (d) 21
Spectral Gamma Ray (SGR) 22
X-ray Diffraction (XRD) 25
Discussion and Conclusions 27

vi
References 34
Appendix A1
List or Figures
Figure 1a 2
Research Area Location Map
Figure 1b 2
Drill Site Location Map for North Soda Lake
Figure 2 4
Regional Feature Map of Carrizo Plain
Figure 3 8
Pleistocene River System Map of Eastern California
Figure 4 14
Juniper/Pine ratio vs. Sagebrush % Pollen Graphs
Figure 5 21
Whole Core Magnetic Susceptibility (w) Graph
Figure 6 22
Box Samples Magnetic Susceptibility (d) Graph
Figure 7 24
Uranium gamma ray (API ppm) Graph

vii
Figure 8 25
Uranium-free gamma ray () Graph
Figure 9 25
Total gamma ray (/ Graph
Figure 10 26
Halite XRD Graph
Figure 11 29
Paleoclimate Model 1
Figure 12 33
Paleoclimate Model 2
List of Tables
Table 1 17
Summary of Analyses Performed on the North Soda Lake Core
Table 2 20
Whole Core Magnetic Susceptibility (w) Values
Table 3 21
Box Samples Magnetic Susceptibility (d) Values
Table 4 24
Whole Core Uranium Gamma (API ppm) Values

viii
Table 5 25
Whole Core Uranium-free Gamma ( Values
Table 6 25
Whole Core Total Gamma (/ Values
Table 7 26
Halite XRD Values

1
Lithostratigraphic record of North Soda Lake, Carrizo Plain, San
Luis Obispo County, California: Implications for Late Pleistocene
paleoclimate in a closed hypersaline lake basin
Randall K. Stephenson
Department of Geological Sciences, California State University, Bakersfield, 9001 Stockdale
Highway, Bakersfield, CA 93311
Introduction
Purpose
The purpose of this research is to establish an improved understanding of the
paleoclimate record of the Carrizo Plain region through the study of sediments deposited in
Soda Lake. This research involved a lithologic study and associated quantitative analyses of
cored sediments obtained from North Soda Lake (NSL) within the Carrizo Plain.
Location
The Soda Lake region of Carrizo Plain is located in eastern San Luis Obispo County,
California (35°13'20"N, -119°52'50"W) (Figure 1a). Soda Lake is comprised of a larger NSL
basin and a smaller South Soda Lake (SSL) basin, the latter of which is occupied by
numerous smaller lakes. A set of accretionary aeolian clay dunes separate and surround the
two lake basins (Rhodes, et al., 1998).
The Soda Lake basin is approximately 75 km (47 miles) west of Bakersfield,
California, and comprises an area of approximate 23 km2 (9 miles2) within the central portion
of the Carrizo Plain. The area includes grass covered plains and low rolling hills, and is

2
dominated by the saline lakes that compose the entire Soda Lake. The lake beds are typically
covered with an efflorescent crust comprised of various salt minerals (Eigenbrode, 1999).
The focus of this study is the top 18.5 m of a 40 m sediment core. This core was
obtained in September, 2006, from a drill site (35°13'22.95"N, -119°52'32.85"W) near the
south end of the larger NSL basin (Figure 1b).
Figures 1a and 1b. North Soda Lake, located approximately 75 km (47 miles) west of Bakersfield, California, occupies Carrizo Plain basin
and is bounded on the northwest by Seven Mile Road (SMR), Soda Lake Road (SLR) on the southwest and the San Andreas Fault (SAF) on the east. South Soda Lake (SSL) is located to the southeast and is separated from NSL by a large clay dune (cd). Core site locations for
NSL and SSL are noted as NSLcs and SSLcs
This drill site was chosen due to its location near the center of NSL and because it
was the most accessible area for the drill rig, without venturing onto the active lake bed. In
Bakersfield
North Soda
Lake
N
0 50 100
Miles
California
Figure 1b
Searles Lake
SMR
SLR
NSL
NSLP
NSLcs
SSLcs
cd
SAF
SSL
Miles
0 1

3
addition, the drill site is located within an emergent lake plain that has formed along the
eastern edge of NSL. The drill site location is at the terminus of a road that was once used
during short-lived sodium sulfate mining operations conducted on NSL in the early 1900’s
(Arnold et al., 1908; Gale, 1914).
Geologic and Physiographic Setting
Study Area
The Carrizo Plain is a tectonically closed basin bounded by the Temblor Range on the
east and the La Panza and Caliente ranges on the west and southwest respectively (Figure 2).
Elevation of NSL is approximately 580 m (1895 ft) above sea level near the drill site. The
maximum elevation of the Temblor Range is approximately 1310 m (4,300t ft), the La Panza
Range is approximately 1070 m (3,500 ft), and the Caliente Range is approximately 1520 m
(5,000 ft).
Basin Tectonic History
The Carrizo Plain occupies a tectonically active basin that is bounded on the east side
by the SAF. For the most part, this segment of the SAF adjacent to the Carrizo Plain
historically has had minor fault movement coupled with tectonic strain that has been
distributed normal to the fault resulting in the formation of numerous geomorphic features
such as sag basins, offset stream beds, and pressure ridges (Vedder et al., 1970). Coupled
with the fault creep have been several events resulting in significant structural offset within
the past 13,250 yr. B.P. (Sieh et al., 1984; Ludwig et al., 2010). The latest of these events is

4
Figure 2. Regional map of Carrizo Plain depicting the major boundary features including the La Panza Range, Caliente Range, and the
Temblor Range. NSL) North Soda Lake, SSL) South Soda Lake, NSLP) North Soda Lake Plain, NSLc) North Soda Lake core location, SSLc) South Soda Lake core location, cd) Clay Dune, SLR) Soda Lake Road, SAF) San Andres Fault
the 1857 Tejon earthquake that created 9.5m of right lateral offset at Wallace Creek, which is
located approximately 4 km northeast of NSL.
Starting in the Mesozoic, the Farallon plate was subducted beneath the North
American plate resulting in a classic arc system including an igneous arc, a fore-arc basin and
an accretionary prism (Cooper, 1990). About 30 Mya, the transition to a transform boundary

5
resulted in the dissection of this continental arc into several isolated basins that allowed the
deposition of thick stratigraphic marine formations consisting of pelagic sediments
dominated by diatomite, and punctuated with clastic sediments derived during sporadic uplift
of the surrounding mountain ranges (Bartow, 1988). These formations are now exposed in
the mountains surrounding the Carrizo Plain and supply much of the sediments filling Soda
Lake. By the late Pliocene, southwest-directed tectonic tilting and uplift of the Carrizo Plain
basin likely severed its connection to the Pacific Ocean (Cooper, 1990; Galehouse, 1967)
resulting in internal drainage within the Carrizo Plain (Eigenbrode, 1999; Dibblee, 1962).
Basin Hydrology
The Carrizo Plain has a watershed that exceeds 1,230 km2 (750 mi2) (Eigenbrode,
1999), with NSL having a surface area of approximately 10 km2 (6.2 mi2). Because the basin
lacks inflow from perennial streams, runoff from the surrounding watershed is currently
limited to infrequent heavy rainstorms, most of which occur during the winter months.
Annual precipitation within the basin averages approximately 230 mm (9 in). Annual lake
level fluctuations are usually less than 1 m. However, during extreme wet seasons (e.g.,
1997-98 El Nino event), lake level may rise as much as 2 m in one year (Eigenbrode, 1999).
At the time of core collection (September 27 and 28, 2006), water was present near the drill
site immediately beneath the salt crust of NSL.
Although highly saline groundwater is found immediately at or below the surface of
NSL, potable water can be found in the sediments forming the elevated alluvial aprons to the
northeast and northwest of Soda Lake (Cooper, 1990). The latter is used by the few valley
residents for personal and/or for limited agricultural purposes.
6
Previous Work
Regional Work
Research for western North America, relevant to the Soda Lake study, includes
testing models linking Milankovitch scale cycles to local climate change, and millennial
scale hemispheric climate change to regional lake-level histories documented by proxy
indicators (e.g., Smith, 1987; Benson, 2004). Such studies are frequently based on data
obtained through the evaluation of climate proxy indicators found in lake sediment cores and
outcrops (Smith, 1987). These proxies may include evaporite mineral concentrations, pollen
counts, isotope compositions (Benson, 2004), and other data such as dated strandlines
(Lowenstein, 2002). Many of these studies have focused on hydrologically open basins that
have had thousands to millions of years of influx alternating with fluvial or aeolian removal
of climate record (Litwin et al., 1999, Smith, 2000). In these cases, influences from external
sources, e.g., overflow from other basins, can create an overprinting of paleoclimate
indicators (Litwin et al., 1999). In contrast, the Carrizo Plain has been a hydrologically
closed basin likely since the late Pliocene (Cooper, 1990), thus it may preserve a more
accurate paleoclimate record for the region possibly including the southern Coast Range of
California as well.
Relevant research on the pre-Holocene paleoclimate history of western North
America from the nearby region, includes the evaluation of sediment cores obtained from
Owens Lake and Searles Lake (Smith et al., 1999, Smith 1979, Litwin et al., 1999) in eastern
California, and the Santa Barbara basin south of Santa Barbara, California (Hendy et al.,
1999, 2002). At Searles Lake, Smith (1979) used the differing sediment types found in a

7
mud-layer dominated core as a means of defining dry vs. wet climates. Smith inferred that
salt-dominated mud layers represented either brackish periods of small, shallow hypersaline
lake conditions or dry lake conditions, while mud layers devoid of salt minerals represented
relatively wetter climate intervals with deeper fresh-water lake conditions. Wetter conditions
were interpreted as resulting from increased runoff from the eastern slope of the Sierra
Nevada draining into the Pleistocene river system that originated at Mono Lake and
terminated at Lake Manly in Death Valley (Figure 3).
Litwin et al., (1999) conclude that significant climate changes have occurred east of
the Sierra Nevada within the past 230 ka, with two major warm interglacial intervals between
approximately 220 ka to 180 ka and 130 ka to 50 ka, and two major glacial events, one
between these aforementioned interglacial periods and the second between 22 ka and
approximately 10 ka. Lin et al., (1998), Smith (1979), and Smith et al., (1983) further
correlated climatic changes in Owens Lake and Searles Lake region to marine isotope stages
and millennial-scale climate changes, the latter of which are observed in Greenland ice cores.
Climate proxies were based on pollen and sediment types. The evaluation of carbonate rich
muds vs. organic C, and age control was provided by 14C, 230Th and 36Cl analysis. Pollen
derived from the cores provided age/depth control of the cored sediments. The result Litwin
et al., (1999) established a 230,000 yr record for the region that provided time equivalent
lake episodes for marine isotope stages 1 through 9 for Owens Lake and 2 through 9 for
Searles Lake. These studies determined that marine isotope stage 1 is missing from Searles
Lake due to deflation, but that, otherwise, the lake responded directly to Milankovitch scale
climate drivers such as a migrating paleo jet stream (Negrini, 2002). Millennial-scale
variations were also noted and an attempt was made to correlate them to the Greenland ice
8
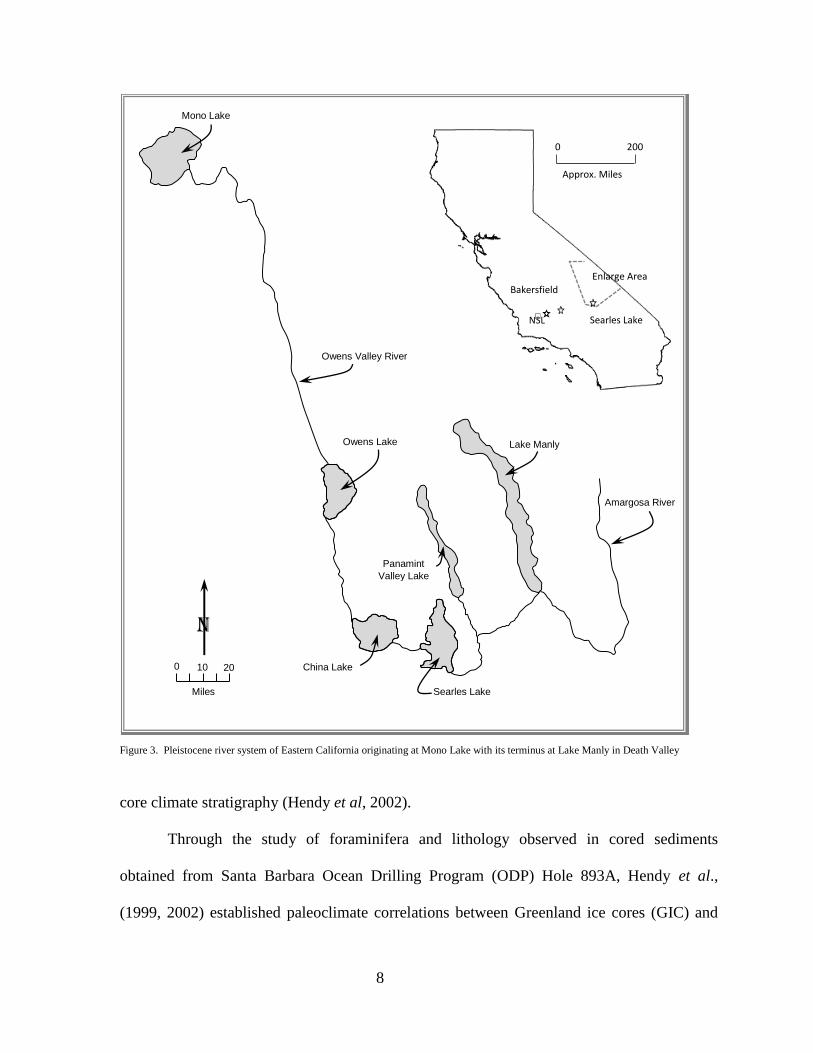
Figure 3. Pleistocene river system of Eastern California originating at Mono Lake with its terminus at Lake Manly in Death Valley
core climate stratigraphy (Hendy et al, 2002).
Through the study of foraminifera and lithology observed in cored sediments
obtained from Santa Barbara Ocean Drilling Program (ODP) Hole 893A, Hendy et al.,
(1999, 2002) established paleoclimate correlations between Greenland ice cores (GIC) and
N
0 10 20
Miles
Mono Lake
Owens Lake
China Lake
Searles Lake
Panamint
Valley Lake
Lake Manly
Amargosa River
Owens Valley River
NSL
0 200
Approx. Miles
Searles Lake
Bakersfield Enlarge Area
9
the sediment cores obtained from the Santa Barbara Channel. These assessments indicate
that abruptly concurrent millennial-scale climate changes occurred in the two regions. More
specifically, changes in air temperatures in the North Atlantic region, documented by oxygen
isotope variations in glacial ice were found to be of similar relative magnitude and to be
contemporaneous on a decadal scale with temperatures of surface waters of the Santa
Barbara basin, documented in foraminifera assemblages and their oxygen isotope
compositions obtained from ODP Hole 893A Hendy et al., (2002). Hendy et al., (2002) were
also able to correlate glacial and interglacial Milankovitch-scale events including MIS 2, 3,
and 4.
In other studies, Zic et al., (2002) postulated that high resolution climate-change
signals are captured in sediments found in the Summer Lake basin, Oregon. Using magnetite
concentration as a proxy indicator of deeper lake conditions, they compared the Summer
Lake record to GISP2 ice core proxies of North Atlantic region air temperature over the time
interval from approximately 45 ka to 20 ka. Their results strongly suggest that millennial-
scale climate change in the northwestern Great Basin can be correlated and thus is closely
related to (i.e., driven by) D-O oscillations and Heinrich events originating in the northern
Atlantic region of North America. The conclusions of these studies confirm that western
North America lake levels are sensitive to hemispheric and perhaps global climate drivers
both at Milankovitch- and millennial-time scales.
Carrizo Plain
Jennifer Eigenbrode conducted a paleoclimate study of Soda Lake under the direction
of Dr. Lisa Pratt of the University of Indiana (Eigenbrode, 1999; Rhodes et al., 2005). For
this study, Eigenbrode collected and evaluated two 2-inch diameter cores with lengths of 170
10
cm (67 inches) and 139 cm (55 inches) from South Soda Lake (Figure 1b). Upon collection,
a detailed lithologic description of the cores was performed on site. The descriptions
identified a thin salt crust overlying clay sediments that varied in color from olive gray and
brown, to greenish gray and yellowish brown, to black. The upper portion of the core, down
to approximately 97 cm, was found to contain pore-filling and “displacive” salt crystals, with
microcrystalline salt from 97 cm to 132 cm. However, the lower portion of the core, down to
170 cm, was found to contain abundant gypsum nodules with no observed salt crystals. This
cored interval also contained an abrupt change from yellowish brown silty clay loam to
brown to dark-green/gray silty clay above 150 cm. This color change suggests a shift from
drier to a wetter climate resulting in oxidized and reduced sediment, respectively. Coupled
with lithologic evaluation of the cores, Eigenbrode employed carbon/sulfur combustion
analysis to test for the presence of organic carbon (Corg), total inorganic carbon (TIC), and
molecular hydrocarbon alkanes as tools for establishing historical climate aridity, soil
salinity, and lake level changes. The Corg was concluded to be indicative of wet vs. dry
climate, where lower Corg values would indicate a drier climate.
Eigenbrode inferred the presence of three distinct facies; a saline lake facies, a
mudflat facies (transition), and a dune facies. The saline lake facies is characterized by dark
colored sediments with higher Corg indicating a reducing environment. The dune facies is
characterized by oxidized aeolian sediments with very low Corg. The mudflat facies is
interpreted as a transitional phase between the saline and dune facies where gradual changes
in Corg are observed. Eigenbrode also noted that abrupt changes in color and Corg defined the
upper limit of the mudflat facies indicating a rapid environmental change or an erosional
surface. Furthermore, Eigenbrode established the age for carbon samples collected at 101 cm

11
and 75 cm, at 2750 ± 60 14C years before present (2850 ± 70 cal yr BP) and 2230 ± 60 14C
years before present (2240 ± 90 cal yr BP) respectively. From these data points a
sedimentation rate of 0.3 mm/yr to 0.4 mm/yr was established for the sediment core,
suggesting the 170 cm core represents a time span of approximately 4500 years.
Combining the radiocarbon dates and lithologic observation of sediment transition
from dune to mudflat to saline conditions, Eigenbrode concluded that long-term expansion of
Soda Lake occurred prior to 3500 ybp (sample depth >105 cm), and using observations of
geomorphic features related to these sediments Rhodes et al., (1998) suggested that the lake
level was 3 to 4 meters in depth at approximately 2900-2600 ybp. It was noted, soon
thereafter, displacive salts crystals appeared suggesting that halite crystallization occurred at
a diminished lake level. Eigenbrode also concluded that this high lake level persisted until
approximately 2250 ybp (78 – 74 cm sample depth) by which time Corg concentrations had
dropped coinciding with a significant rise in 13Corg implying the onset of an arid climate.
Oxidized sediments and high 13Corg observed across sample depths 74 – 56 cm and 46 – 32
cm indicates two major desiccation events had occurred at 2000-1500 ybp and 1200-800 ybp,
respectively. Eigenbrode noted that a minor lake-level rise at approximately 1350 ybp
separated these desiccation events, with the latter event continuing into the present.
Eigenbrode further concluded that paleoclimate events captured in the SSL core correlate
well with other paleoclimate records of the Holocene Epoch for California and the Great
Basin as documented in reports on the Great Salt Lake, Mono Lake, and Walker Lake
(Benson, 2004). Eigenbrode’s study establishes the feasibility of recovering meaningful lake
level records from sediments within the Carrizo Plain basin that represent regional climate
variations.

12
In an attempt to establish age control on the shallowest sediments found in NSL,
Owen Davis (1990) collected a 96 cm sediment core from this area and analyzed it for
pollen. The sediment core was collected on February 10, 1989 near the southwestern
shoreline of NSL. The exact location and sample method are not documented in Davis’
report. However, Davis references the sample location to be 50 m from the western lake
shore near an east-west trending fence that terminates in the lake. This location can be found
at approximately 35°13'10.56"N, -119°53'44.81"W, which is 1.9 km WSW from the core site
used for this thesis project. Davis described his core as being “homogenous clay” with color
grading from light yellowish brown near the bottom to grayish brown near the top. He
concluded that pollen found at the 14 cm core-depth represents an age of approximately 100
ybp, based on the introduction of European species. More specifically, above 14 cm depth
Davis notes the increasing presence of pollen from non-native plants including Salsola
(tumble weed), Ulmus (elm) and Eucalyptus (Australian gum) and a declining pollen count of
vegetation native to the Carrizo Plain, such as Poaceae (grass) and Pinus (pine). From this
data, Davis concludes that the decline of native vegetation and the introduction of the non-
native plants could be related to human settlement of the area.
Davis suggests that below 14 cm depth increased pollen abundance of Alnus (alder)
and Cyperaceae (sedge) indicates a relatively wetter environment existed when compared to
the upper 14 cm, that is dominated by pollen from Chenopodiaceae-Amaranthus (saltbush
and pigweed). The latter, according to Davis, is indicative of a drier climate which would be
consistent with a lower lake level and an increase in lake salinity.
Under the direction of Dr. Peter Wigand (Research Associate, Department of
Geology, CSU Bakersfield), pollen analysis was performed by students and teachers from

13
local Bakersfield high schools as part of the 2009 Summer Research STEM Program
conducted at California State University Bakersfield and sponsored by Chevron, USA
(Wigand, personal communication, 2009).
Forty-eight samples obtained from whole segment NSL1A-3 (3.0 to 4.5 mbgs) were
selected for this research. Samples were processed to separate and concentrate pollen grains.
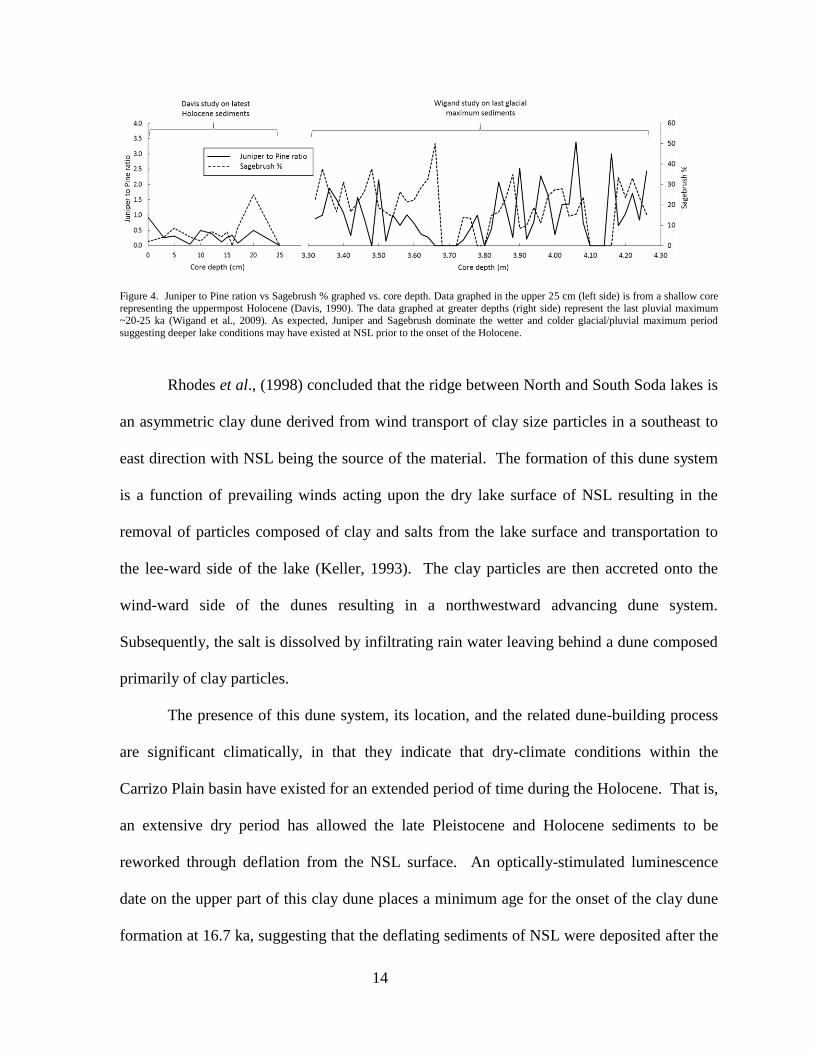
Using a pollen count method, similarly employed by Davis (1990) for the late Holocene, it
was found that the reduced sediments of NSL-1A-3 were deposited during a time interval
significantly wetter and colder than that of the late Holocene (Figure 4). Radiocarbon dates
were obtained for two samples of charcoal and plant material from depths corresponding to
1.97 m and 3.34 m that place the age of these sediments between 20-25 cal kyr B.P., which is
correlative to MIS2 (Rhodes et al., 2005; Negrini, et al., 2009). These results suggest that
Eigenbrode’s (1999) conclusion that reduced sediments deposited during the Holocene
equate to relatively deeper lake conditions, indicating a wetter (or colder) climate can be
extrapolated to the much wetter, colder climates expected during the late Pleistocene.
Indeed, Wigand's data, as presented in Figure 4, confirms a late Pleistocene pollen
assemblage much more mesic than the most mesic conditions found in the Holocene as noted
by Davis’ (1990) juniper/pine ratio and sagebrush % graphs (Figure 4), suggest that deeper
lake conditions may have existed during the late Pleistocene prior to the onset of the
Holocene.
14
Figure 4. Juniper to Pine ration vs Sagebrush % graphed vs. core depth. Data graphed in the upper 25 cm (left side) is from a shallow core
representing the uppermpost Holocene (Davis, 1990). The data graphed at greater depths (right side) represent the last pluvial maximum ~20-25 ka (Wigand et al., 2009). As expected, Juniper and Sagebrush dominate the wetter and colder glacial/pluvial maximum period
suggesting deeper lake conditions may have existed at NSL prior to the onset of the Holocene.
Rhodes et al., (1998) concluded that the ridge between North and South Soda lakes is
an asymmetric clay dune derived from wind transport of clay size particles in a southeast to
east direction with NSL being the source of the material. The formation of this dune system
is a function of prevailing winds acting upon the dry lake surface of NSL resulting in the
removal of particles composed of clay and salts from the lake surface and transportation to
the lee-ward side of the lake (Keller, 1993). The clay particles are then accreted onto the
wind-ward side of the dunes resulting in a northwestward advancing dune system.
Subsequently, the salt is dissolved by infiltrating rain water leaving behind a dune composed
primarily of clay particles.
The presence of this dune system, its location, and the related dune-building process
are significant climatically, in that they indicate that dry-climate conditions within the
Carrizo Plain basin have existed for an extended period of time during the Holocene. That is,
an extensive dry period has allowed the late Pleistocene and Holocene sediments to be
reworked through deflation from the NSL surface. An optically-stimulated luminescence
date on the upper part of this clay dune places a minimum age for the onset of the clay dune
formation at 16.7 ka, suggesting that the deflating sediments of NSL were deposited after the
15
most recent highstand, a date consistent with highstands in lake basins around the American
West associated with the most recent MIS2 glacial maximum. Furthermore, the absence of
Holocene-related sediments in the NSL core, is consistent with the findings observed at
Searles Lake by Litwin et al., (1999), providing additional support of an extended Holocene
dry period for the western North America.
Using information contained in the studies referenced above as a foundation, the
goals of this study will be to focus on building a lake-level record for the Carrizo Plain basin
from which the Late Pleistocene through the Holocene climate of the region can be inferred.
Methods and Results
Introduction
The work on NSL, documented herein, builds upon other paleoclimate studies that
have been conducted throughout the Western United States, and will further test the working
hypotheses of how Milankovitch and millennial-scale climate change affect lakes in western
North America.
A cm-scale lithologic description of the NSL core included sediment composition,
sedimentary structure, color, and grain size. This was followed by measurements of whole-
core and discrete sample magnetic susceptibility (k), and whole-core spectral gamma
radiation (sg), the latter of which was performed at the Department of Geology, University of
Cincinnati by T. Algeo. X-ray diffraction (XRD) analysis of selected core plugs was also
performed to measure the relative percent of evaporite minerals halite, gypsum and
thenardite.

16
Core Collection
Fieldwork was conducted over a two-day period from September 27 to 28, 2006. An
auger-type drill rig provided by Gregg Drilling of Long Beach, California, was employed for
the purpose of collecting a continuous deep core. The core collection site (35°13'22.95"N,
119°52'32.69"W, 593 masl) is on a slightly elevated peninsula projecting southwestward into
southern portion of NSL (Figure 1b).
Hollow-stem auger flights of ≈1.5 m each (5 ft) were advanced by the drill rig to a
total depth of ≈40 m (132 ft) from surface. Whole cores were collected via a polycarbonate
core sleeve that was inserted into a stainless steel, split core barrel with a core-barrel shoe.
This core barrel was then installed inside the leading auger flight during each 1.5 m advance.
As the auger string was advanced, the lead auger and core barrel penetrated undisturbed
sediment. Following advancement of each auger flight, the core barrel was retrieved,
dismantled and the inner sleeve removed. A cursory visual inspection was conducted in the
field to determine the length of core obtained and sediment type. The sleeve ends were
capped and taped, to prevent desiccation and oxidation of the core, and labels including
sample name and up position were applied along the sleeve and on the bottom end cap. The
labels also included the drill location (“NSL-1”), core-hole identifier (e.g.: “A” or “B”), and
finally the auger flight (e.g.: NSL-1B-1). Each core-barrel shoe sample was extruded, sealed
in an airtight container and retained for analysis by collaborative researchers. Upon
completion of each day’s fieldwork, the cores were transported to the Geology Department of
California State University, Bakersfield, and placed in cold storage.
Two borings were required to retrieve the desired total core length. The first core
location (NSL-1A) was abandoned at approximately 6 m (20 ft), after retrieval of core
17
segment NSL-1A-4, when the weight from the depth tag line was inadvertently dropped
down the core hole creating an obstruction and preventing further sediment collection. The
auger flights were pulled from this hole, and the drill rig was repositioned approximately
0.6m (2 ft) to the southwest from location NSL-1A. Drilling of core hole NSL-1B was
commenced at the new location and sampling began with the top of core segment NSL-1B-2
at 6 m (20) below ground surface.
Analyses and Results
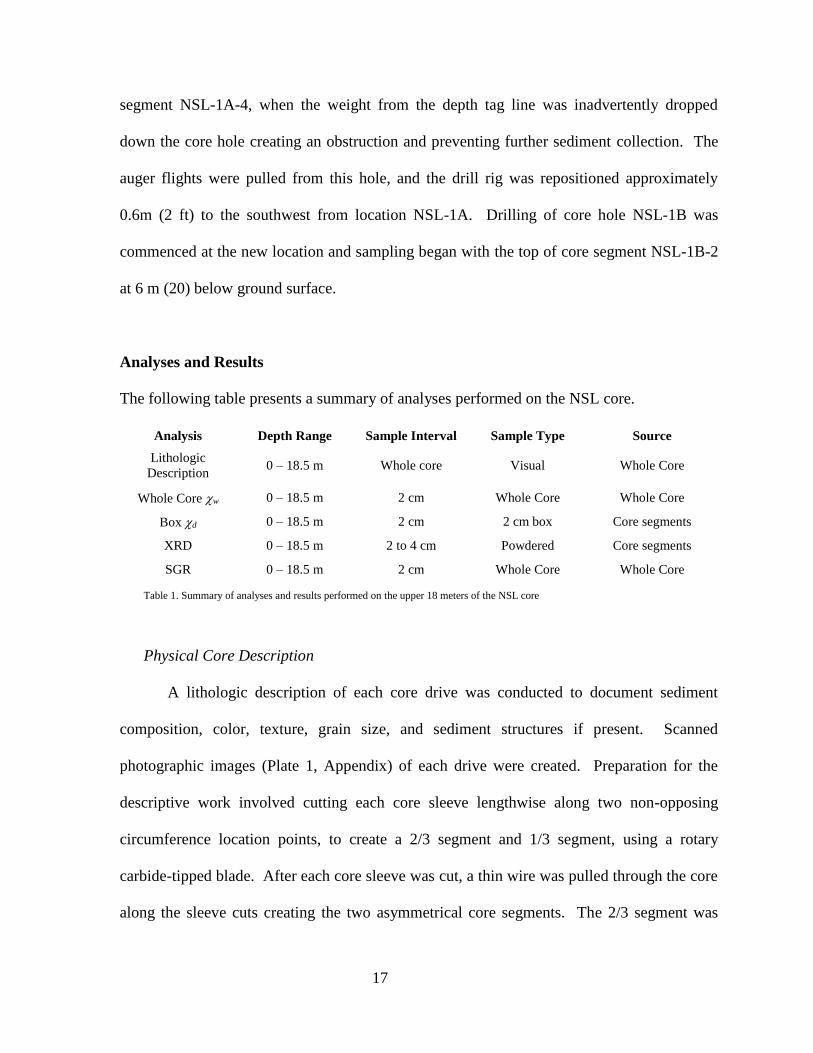
The following table presents a summary of analyses performed on the NSL core.
Analysis Depth Range Sample Interval Sample Type Source
Lithologic
Description 0 – 18.5 m Whole core Visual Whole Core
Whole Core w 0 – 18.5 m 2 cm Whole Core Whole Core
Box d 0 – 18.5 m 2 cm 2 cm box Core segments
XRD 0 – 18.5 m 2 to 4 cm Powdered Core segments
SGR 0 – 18.5 m 2 cm Whole Core Whole Core
Table 1. Summary of analyses and results performed on the upper 18 meters of the NSL core
Physical Core Description
A lithologic description of each core drive was conducted to document sediment
composition, color, texture, grain size, and sediment structures if present. Scanned
photographic images (Plate 1, Appendix) of each drive were created. Preparation for the
descriptive work involved cutting each core sleeve lengthwise along two non-opposing
circumference location points, to create a 2/3 segment and 1/3 segment, using a rotary
carbide-tipped blade. After each core sleeve was cut, a thin wire was pulled through the core
along the sleeve cuts creating the two asymmetrical core segments. The 2/3 segment was

18
used to obtain samples for box kx, XRD, and pollen analysis, while the 1/3 segment was
retained as an archive. Following the lithologic description of each core segment, the
segments were individually wrapped with clear plastic film, taped together, capped, and
returned to cold storage awaiting further study.
The studied portion of the core used for this project includes the interval from the
surface to a depth of 18.5 m, and is dominated by clay-size material. All color descriptors
are according to the Munsell color system. Color variations include tones of olive to olive
gray, bluish gray and dark gray, and olive brown to light olive brown. With the exception of
some mottling observed in the upper portion of the core segments, and rare lenses of gypsum
crystals, the core is featureless and devoid of any visible sedimentary, biological, tectonic or
desiccation structures.
At the time of initial examination, the cores were damp to the touch, but lacked any
free water. Much of the sediment was very plastic, and could be easily rolled into small
pellets or ribbons. However, at depths of 13.2 to 13.5 m the sediment was less plastic and
exhibited a drier texture then material above and below, while core interval 13.5 to 15.0 m
was dominated by very stiff clay.
Occasional coarse grains, up to 3 mm in diameter, of evaporite minerals were
observed throughout the core. In some segments of the core, these grains were in sufficient
quantity to impart a granular texture to the clay. This was observed in core segments NSL-
1B6 and NSL-1B7. Also, the entire core was found to be devoid of any sand or sandy
intervals.
The interval from 18.5 m to approximately 16.5 m is dominated by light gray clays
that transition abruptly within a few centimeters at 16.5 m to light olive brown. From this
19
depth upward, the core color exhibits a less abrupt upward transition from olive brown to
olive to olive gray over a span of approximately half a meter across the 12.5 m depth. From
this depth, the olive gray color persists to a depth of approximately 5 m, at which point the
color transitions to a very noticeable bluish green gray to bluish green followed by dark gray
to olive gray to 1.44 m.
Magnetic Susceptibility
Magnetic susceptibility (k) is the ratio of acquired magnetism in sediments to an
inducing field, often resulting solely from the concentration of magnetite (Cohen, 2003),
where high k values can be attributed to elevated levels of magnetite in the sediments.
Magnetite concentrations can very sensitive to changing lake conditions through a variety of
processes including dissolution by bacteria in reducing environments. This is usually
associated with deeper lakes (Cohen, 2003). This allows k values to be used in predicting
relative lake levels, although the magnitude of change (i.e., deeper vs. shallower) varies from
lake system to lake system and must be calibrated for any given lake with other lake-level
indicators.
Susceptibility was measured both on the entire core (whole core) and on individual
plugs (boxed samples). For the initial evaluation, whole-core magnetic susceptibility (kw)
was conducted on each core drive, while still encased in the liners, prior to preparing the core
for a lithologic description. Whole-core magnetic susceptibility values were obtained using a
Bartington MS2-B ring sensor which involved passing each core segment through the ring
and observing digital readouts from an attached MS2 meter. Each kw data point is a weighted
average of several cm of sediment stratigraphically above and below the sensor location

20
(Bartington Instruments LTD, 1989). Susceptibility, k, is dimensionless in the cgs system of
units (Evans, et al., 2003), but when normalized by density to correct for compaction or
deformation that may have occurred during coring, it is often reported as , in units of
cm3/gm.
Discrete magnetic susceptibility (kd) values were collected from 5.1 cm3 boxed
samples obtained from each core drive at 2 cm to 4 cm intervals and measured in a
Bartington MS2 bottle sensor. These discrete measurements were made to reveal high wave
number/frequency changes not recovered by whole core measurements due to the smoothing
effects of the ring sensor. The mass of each discrete sample was measured and, hence, d
(mass-normalized susceptibility) was calculated by dividing kd by the sample density.
Whole Core Susceptibility (w)
Analysis of the whole core segments determined that w values range from 5.2E-05 to
111.1E-05. The reduced sediments, exhibiting tones of olive gray to bluish green, had
overall lower average kw values, while the oxidized sediments, exhibiting tones of olive
brown, had overall higher average values of w. Whole-core kw values for minimum,
maximum, median and average are presented in Table 2. Figure 4 presents a graph of the w
values determined during analysis of the core interval.
Whole Core (w) Values
Core interval
(m)
Sediment
Characteristic
Minimum
Value
cm3/gm
Maximum
Value
cm3/gm
Median Value
cm3/gm
Average Value
cm3/gm
0 – 12.5 Reduced 0.000008 0.000111 0.000024 0.000024
12.5 – 16.5 Oxidized 0.000022 0.000052 0.000043 0.000042
16.5 – 18.5 Reduced 0.000011 0.000043 0.000013 0.000018
Table 2. Summary of whole core (w) values obtained for the upper 18.5 meters of the NSL core

21
Figure 5. Whole core (w) magnetic susceptibility plot for the upper 18.5 meters of the NSL core indicating a noticeable climate change captured at 17 mbgs represented as the rapid excursion of the magnetic susceptibility values, general overall cooling trend from
approximately 13 mbgs to approximately 2 mbgs at which point the latest warming trend began.
Box Sample Susceptibility (d)
Discrete values for the mass-normalized box (d) samples range from 1.1 to 25.4
cm3/gm. Similar to evaluation of the whole-core values, the discrete values were also
correlative to oxidized and reduced sediments. And as determined by the w values, the
reduced sediments correlated to the lower averaged kd values while the oxidized sediments
correlated to the higher averaged d values. Table 3 presents the breakdown of the various
the discrete d values by sediment type. Figure 5 presents a graph of the d values
determined during analysis of the related discrete values.
Box Sample (d) Values
Core interval
m
Sediment
Characteristic
Minimum
Value
cm3/gm
Maximum
Value
cm3/gm
Median
Value
cm3/gm
Average
Value
cm3/gm
0 – 12.5 Reduced 0.0000002 0.0000380 0.0000179 0.0000160
12.5 – 16.5 Oxidized 0.0000129 0.0000457 0.0000345 0.0000332
16.5 – 18.5 Reduced 0.0000041 0.0000341 0.0000083 0.0000132
Table 3. Summary of box core (d) values obtained for the upper 18.0 meters of the NSL core

22
Figure 6. Box sample (d) magnetic susceptibility plot for the upper 18.5 meters of the NSL core presenting climate trends that mimic
characteristics found in the Whole core (w) magnetic susceptibility values where the rapid excursion of the magnetic susceptibility values
at 17 mbgs capture the noticeable climate change from cooler to warmer, and the general overall cooling trend from approximately 13 mbgs
to approximately 2 mbgs at which point the latest warming trend began.
Spectral Gamma Ray
The spectral gamma ray (SGR) log is a passive method of evaluating the core for
naturally occurring radioactive material by sensing gamma ray energy from radioactive
isotopes of potassium (K), thorium (Th), and uranium (U), (Schlumberger, 1998). The SGR
tool uses a detection device that captures bursts of high-energy gamma radiation emitted by
the source isotopes. During the capture process, the detector emits a pulse of light when
struck by a gamma radiation burst. The light pulse is then converted into an electrical signal
that is measured and recorded as electron volts (eV), where eV is the kinetic energy gained
by an electron when it is accelerated through a potential of one volt. A scintillation-type
detector was incorporated for this purpose, which allows for the detection of discrete gamma
ray energy levels according to the source. As a result, individual gamma ray counts for K,
Th and U were obtained. From this data, API gamma values were obtained using the
following simple calculations.
API U = (U SGR value in ppm) x 8
API Th = (Th SGR value in ppm) x 4
API K = (K SGR value in %)

23
A whole-core SGR log was performed by the University of Cincinnati in Cincinnati,
Ohio on each NSL core segment evaluated using a Core Lab spectral gamma logger core
analyzer (Algeo, 2013). The activity of x-rays specific to the elements K, Th, and U was
measured, as was total gamma ray emission.
Spectral-gamma ray logs, like magnetic susceptibility, can be valuable
sedimentological tools because they are easy to acquire and can be very sensitive to changes
in sediment lithology that reflect environments of deposition such as lake-level. However, in
both cases the origin of the signal is complex enough that their responses to a given
environmental change (e.g., lake-level) can be dramatically different depending on the
depositional system. For example, uranium can have an affinity for organic matter in
reduced geochemical systems. This can be due to preservation of organics in deeper anoxic
lakes or anoxic marine sediments (e.g., Dickinson, 1991; Schwalbach and Bohacs, 1996;
Halliburton, 2001). On the other hand, uranium is also present in heavy minerals (e.g.,
zircons) and oxides (e.g., carnotite and autunite) found in coarser-grained detrital sediments
and gypsum-rich evaporites which can indicate shallower lake level (e.g., Dickinson, 1991;
Fabricius, et al., 2003). Finally, tephra-rich sediments can carry relatively high
concentrations of uranium (Dickinson, 1991) and the depositional environment of tephra is
relatively independent of lake level. Environmental events external to the lake system have
also been inferred from spectral gamma data. For example, the concentration of Th, which is
insoluble and adheres to clay surfaces in soils, increases in soils during weathering unlike
soluble K and U ions, which are transported away in solution. Thus, relatively high Th has
been interpreted to be evidence for extreme weathering events presuming that the soil clay
enrichment is unaltered after the clays have been eroded and transported into the terminal

24
depositional system that is then examined with spectral gamma ray logging (Osmond and
Ivanovich, 1992; Ruffell and Worden, 2000; Gashemi-Nejad et al., 2010). Accordingly, the
interpretation of geophysical proxies in lake sediments must always be calibrated with
independent indicators of lake level.
Whole-core SGR values of minimum, maximum, average and median for uranium
(API ppm), uranium-free (), and total gamma (/ are presented in tables 4, 5 and 6
respectively. Figure 7 and 8 presents the results of the spectral gamma log, specifically for
uranium (API ppm), uranium-free (), respectively (contribution to the signal of all other
gamma rays other than those produced by uranium), and total / as Figure 9 (total gamma
ray symbol normalized by the density of the sediments). Individual records for the Th and K
gamma signals were omitted because of acquisition problems due to low signal to noise ratio
and instrument drift (T. Algeo, 2013).
Uranium values (API ppm)
Minimum Maximum Average Median
0.01 7.92 1.99 1.89
Table 4. Summary of Uranium SGR values for the upper 18.5 meters of the NSL core.
Figure 7. Uranium SGR signature for the upper 18.5 meter of the NSL core indicating higher % values for the bottom 6 meters of the core, with values decreasing up core. Overall curve signature indicates that sustained higher values (12.5 m to 17 m) are associated with warmer
climate event.

25
Uranium-free values ()
Minimum Maximum Average Median
0.85 137.25 72.00 74.75
Table 5. Summary of Uranium-free SGR values for the upper 18.5 meters of the NSL core.
Figure 8. Uranium-free SGR signature for the upper 18.5 meters of the NSL core showing consistent average values across the bottom 9 meters of the core, with overall average values decreasing from 8.5 meters to 3.5 meters, followed by a slight increase at 2.5 meters.
Elevated values between 12.5 meters and 17 meters are associated with a warmer climate event, while a cooler climate event is indicated
above 7 mbgs.
Total /
Minimum Maximum Average Median
48.78 173.63 109.35 108.36
Table 6. Summary of total SGR values for the upper 18.5 meters of the NSL core.
Figure 9. Total gamma ray signature for the upper 18.5 meters of the NSL core showing the pronounced elevated values between 12.5 meters and 17 meters that are associated with a warmer climate whereas a cooler climate event is noted in the upper 7 meters of the core.
X-Ray Diffraction
X-Ray Diffraction (XRD) analysis was performed on 354 individual samples
obtained from the top 18 m of the NSL core for the detection of evaporite and detrital
minerals. This analysis was performed using a Rigaku Automated X-Ray Diffractometer.
These samples represent a sampling interval of 2 to 4 cm for the studied portion of the core.

26
Table 6 presents the minimum, maximum and average values of the halite XRD analysis.
Figure 10 presents a graph of the values for the halite samples.
Halite XRD values
Minimum Maximum Average Median
0.0 27.57 15.69 15.77
Table 7. Summary of XRD halite values for the upper 18.5 meters of the NSL core.
Figure 10. Halite was observed in the XRD core samples analyzed from 1.82 mbgs to 18.35 mbgs. Overall the curve indicates lower values
during warmer events suggesting possible removal of halite by aeolian processes.
Each sample was prepared by drying a minimum of 10 g of material for a minimum
of 12 hours at 100˚C. The dried samples were then powdered using a mortar and pestle. A
quantity of powdered material was placed into an aluminum mount and inserted into the
diffraction chamber for analysis. Analysis involved scanning each sample through an angle
of 10° to 60° at a rate of 0.5° per second. Peak areas were converted to a percent based on
comparison with similar analyses on a control sample of halite, thenardite, and gypsum.
Halite (Figure 10) is present throughout the core segments with detectable values
ranging from 5.04% to 27.57%. Examination of all the XRD analyses indicates the presence
of a significant quartz peak at approximately 26.6° on each scan, suggesting an abundance of
clay-sized quartz particles throughout the core (Plate 2, Appendix).
A comparison of the XRD sample analyses to the control sample indicated that the
detection of gypsum and thernardite in the XRD samples was impossible due to the lack of

27
exact peak matching for these minerals. As a result, the presence of gypsum and thenardite
were not considered in the evaluation phase of this project.
Discussion and Conclusions
This study provides the means of establishing relative lake level (shallower lake vs.
deeper lake) over time using a combination of sediment color, pollen assemblages, magnetic
susceptibility, evaporite mineralogy, and spectral gamma ray data. The most significant
result of this research was the identification of a ~6-m thick zone of sediments near the top of
the core that was deposited in a deep lake during a colder, wetter climate interval coeval with
the MIS 2 full glacial event, an event responsible for pluvial lake highstands around the
western US (e.g., Bacon et al, 2006). The following section summarizes the observations
upon which this result is based and, further, attempts to extend a paleo-lake level record
deeper into the NSL core based on lake-level proxies and correlations to regional and global
climate records.
The evidence for the MIS2 pluvial event preserved in the upper 6 m of core is
primarily based on the presence of reduced sediments (Figure 11 and Plate 1), a mesic pollen
assemblage, and anomalously low magnetic susceptibility, itself evidence of magnetite
dissolution in a reduced environment. Evidence for the age control of this event comes from
two 14C dates (23.2-22.3 and 22.1-20.3 cal kyr B.P.) within these deep lake sediments (Figure
11) and an OSL date on the main clay dune that documented a minimum age for the start of
the recession of this last highstand (16.7 ka). A correlation of the discrete (i.e., box)
magnetic susceptibility data with the marine SPECMAP glacial volume proxy places the
MIS3/2 boundary (~25 ka) at approximately 6 m of depth in the NSL core. The fact that

28
reduced sediments persist downcore until ~12 m suggests that relatively deep lake conditions
persisted through the late Pleistocene starting at perhaps the MIS 5/4 boundary at 75 ka (NSL
core depth = 11-12 m) until the onset of development of the large clay dune at ~16-17 ka.
The XRD signature prior to the uppermost pluvial event suggests that halite values
within the near-surface lake sediments were actually lower when the lake level was shallow
during dryer climates possibly due to deflation of the salt crystals that had formed on the lake
surface. This observation may suggest that as evaporation of the lake water occurred during
dryer events, that surface-forming halite crystals and associated clay particles were
transported by wind to the clay dune areas south and east of the lake thereby depleting the
lake sediments of halite (verbal communication, D. Rhodes, 2013).
29
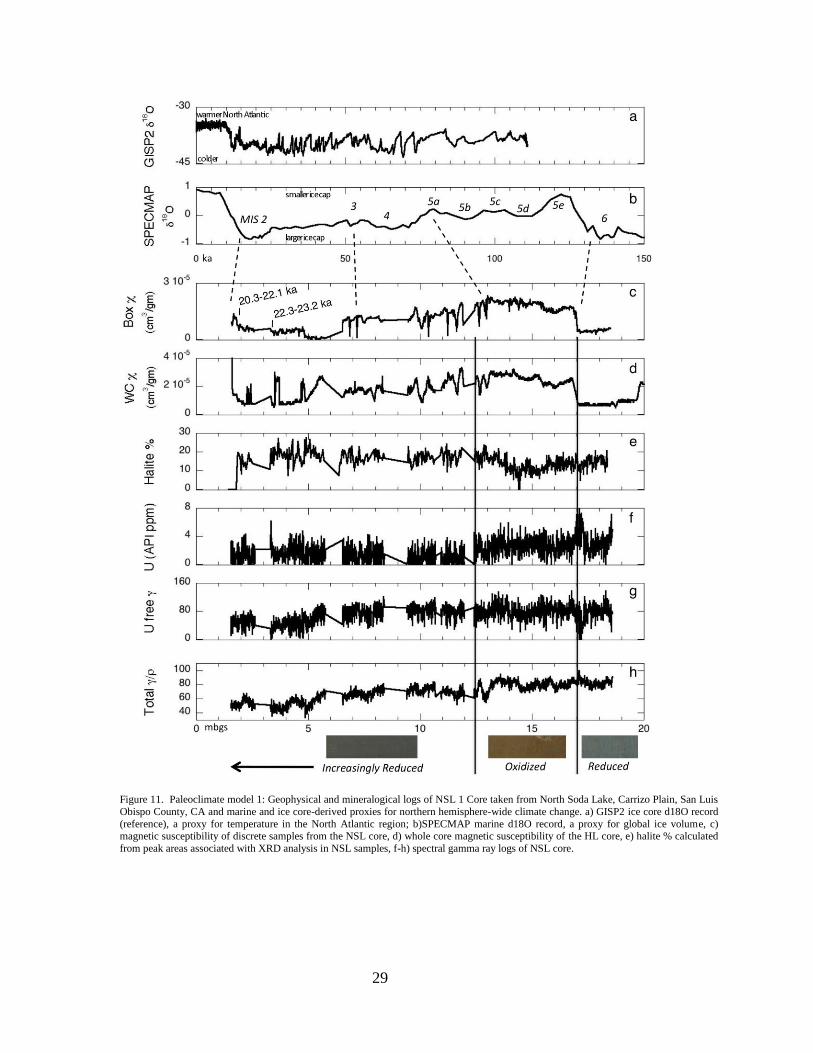
Figure 11. Paleoclimate model 1: Geophysical and mineralogical logs of NSL 1 Core taken from North Soda Lake, Carrizo Plain, San Luis
Obispo County, CA and marine and ice core-derived proxies for northern hemisphere-wide climate change. a) GISP2 ice core d18O record
(reference), a proxy for temperature in the North Atlantic region; b)SPECMAP marine d18O record, a proxy for global ice volume, c) magnetic susceptibility of discrete samples from the NSL core, d) whole core magnetic susceptibility of the HL core, e) halite % calculated
from peak areas associated with XRD analysis in NSL samples, f-h) spectral gamma ray logs of NSL core.

30
The spectral gamma ray signature for uranium concentrations exhibits low
concentrations during the uppermost pluvial event. This suggests that uranium is not
enhanced during reducing geochemical conditions by the expected increased preservation of
organic matter but, rather its concentration is more dependent on processes that are more
prevalent during warmer and drier climates such as increased charcoal influx and/or airborne
dust containing minerals rich in uranium (Page et al, 1956).
To summarize, the deep lake event coeval with MIS2 is characterized by reduced
sediments, a mesic pollen assemblage, low magnetic susceptibility, relatively high halite
content, and low gamma radiation including that sourced from uranium. Of these data, the
magnetic susceptibility (box ) and total are the most complete datasets with the highest
signal to noise ratio (Figure 11c and 11h). Because of this they were used in an attempt to
extrapolate a lake-level proxy record down-core. This extrapolation further presumes that
pluvial conditions would occur during times of more global ice volume, much like they did
for many other lakes around the western U.S., i.e., deep lake conditions would also prevail
during MIS 6 and perhaps during the more subdued MIS 4 glacial event (e.g., Smith et al,
1997; Negrini, 2002).
A second zone of sediments is found from 18.5-17 mbgs that is similar to the MIS2-
correlated interval. These sediments are reduced as evidenced by their color, and exhibit a
magnetic susceptibility signature that is extremely low. There is no pollen record for this
interval. Halite percentages are not anomalously high. In fact they are low in the uppermost
part of this interval. The spectral gamma signal is also quite different from that of the upper
reduced zone as it is moderately high throughout this interval and even attains the highest
observed values toward the upper end of this zone. The total values are likewise opposite
31
in character (i.e., relatively high) than they are for the upper reduced zone. It's presently not
known why the lower (18.5-17 mbgs) reduced zone has different halite and gamma ray
signals than the upper zone. The lower zone is also different in that pollen preservation is
extremely poor whereas the upper zone produced abundant pollen (P. Wigand, personal
communication, 2012). The dramatically different pollen preservations may imply depth-
and/or age-dependent diagenetic reactions in the sediments of Soda Lake that also dissolve
halite and increase the concentration of gamma ray emitting elements.
If the presumption is made that the lower reduced zone, regardless of its different
halite and gamma ray character, is also deposited in a deep lake setting, then this sediment
interval may be an expression of a pluvial lake during either the MIS 6 or MIS 4 glacial
events. The former is presented in Figure 11 as climate model 1; the latter is presented in
Figure 12 as climate model 2.
These two models predict dramatically different sedimentation rates. That of Figure
11 predicts an age of ~125 ka at a depth of ~16.5 mbgs. This corresponds to an averaged
sedimentation rate of 0.13 mm per year, or 13 cm/kyr. More locally in the section, the
overall sedimentation rates corresponding to MIS 2-5 are 0.3, 0.11, 0.2, and 0.09 mm/yr,
respectively. Notably, sedimentation rates are slightly higher during the deeper water pluvial
stages than during the interpluvial warm, dry, shallow periods.
Climate model 2 (Figure 12) predicts an averaged sedimentation rate of 0.24 mm/yr,
almost twice that of climate model 1 (Figure 11). Although there are only two radiocarbon
dates in each case, one can compare the above sedimentation rates with those calculated for
the MIS 1 (i.e., Holocene) interpluvial using the dates of Eigenbrode (1999) and the MIS 2
pluvial using the dates presented herein. The former sedimentation rate is 0.3-0.4 mm/yr and

32
the latter is 0.8 mm/yr. Again, the pluvial interval has a higher sedimentation rate. However,
the overall sedimentation rates based on the two pairs of radiocarbon dates are much higher,
for both interpluvial and pluvial events than the predictions of the correlation model
presented in Figure 11. They are also slightly higher than those predicted by the correlation
model in Figure 12, but are closer by a factor of 2, especially when considering that, allowing
for compaction, the apparent sedimentation rate downcore decreases by as much as 30%. For
this reason, the correlation model of Figure 12 is favored as it provides the best explanation
of the paleoclimate record of the Carrizo Plain region.
While the data and results presented herein provide the evidence for establishing a
plausible Pleistocene paleoclimate record for Carrizo Plain, additional studies of the existing
NSL core are encouraged to further evaluate the core material below the 18.5 m depth
evaluated for this study. In addition, collection and analysis of deeper core material, possibly
including dateable material and/or bedrock, can provide additional means of age control on
the sediments which would enhance the process of defining an accurate and complete
paleoclimate record for the Carrizo Plain basin and Soda Lake.

33
Figure 12. Paleoclimate model 2: Modification of Figure 11 highlighting the temporal scale change for 5a and 5b to emphasize the alternate
model 2 scenario where the lower reduced zone correlates to MIS 4 rather than MIS 6.
34
References
Algeo, T. (2013), Spectral gamma core analysis, Verbal communication, University of
Cincinnati, Department of Geology.
Arnold, R. and H. R. Johnson, 1909, Salines: Sodium Sulphate in Soda Lake, Carrizo Plain,
San Luis Obispo County, California, Economic Geology, 1908, part I, USGS Bulletin
308, 1909.
Bacon, S.N., R. M. Burke, S. K. Pezzopane and A.S. Jayko, 2006, Last glacial maximum
and Holocene lake levels of Owens Lake, Eastern California, USA, Quaternary
Science Reviews, v. 25, p. 1264-1282.
Bartington Instruments LTD, 1989, Operation Manual for MS2 Magnetic Susceptibility
System, OM0408
Bartow, J. A., 1988, The Cenozoic Evolution of the San Joaquin Valley, California,
Geology, p. 1–40.
Benson, L., 2004, Western Lakes. The Quaternary Period in the United States,
Developments in Quaternary Science, v. 1, p. 185–203
Cohen, A. S., 2003, Paleolimnology; the History and Evolution of Lake Systems, Oxford
University Press
Cooper, J. W., 1990, A geophysical study of the hydrogeology of the Carrizo Plain area, San
Luis Obispo County, California, M. S. Geology, California State University, San
Jose, 77 p.

35
Davis, O. K., 1990, Pollen analysis of Soda Lake, Carrizo Plain, California, Report to:
Charles Warner and Richard Reiner, The Nature Conservancy, 785 Market Street,
San Francisco, CA 94103.
Dickinson, K. A., 1991. Uranium and Diagenesis in Evaporitic Lacustrine Mudstone of the
Oligocene White River Group, Dawes County, Nebraska, U.S. Geological Survey
Bulletin, v. 1956, 25 p.
Dibblee, T. W., Jr., 1962, Guidebook: Geology of the Carrizo Plain and San Andreas Fault,
San Joaquin Geologic Society.
Eigenbrode, J. L., 1999, Sedimentological, carbon-isotopic, and molecular records of Late
Holocene climate in the sediments of Soda Lake, Carrizo Plain, California, M. S.
Geology, Department of Geosciences, Indiana University 75 p.
Evans, M. E, and F. Heller, 2003, Environmental Magnetism; Principles and Applications of
Environmagnetics, Academic Press.
Fabricius, I. L., L. D. Fazladic, A. Steinholm, U. Korsbech, 2003. The use of spectral
natural gamma-ray analysis in reservoir evaluation of siliciclastic sediments: a case
study from the Middle Jurassic of the Harald Field, Danish Central Graben, Geol.
Surv. Denmark Greenland Bull., v. 1, 349-366
Gale, H. S., 1914, Sodium Sulphate in the Carrizo Plain, San Luis Obispo County,
California. Contribution to Economic Geology, part I, USGS Bulletin 540, p. 428-
433.

36
Galehouse, K. S., 1967, Provenance and paleocurrents of the Paso Robles Formation,
California, Geological Society of America Bulletin, v. 78, p. 951-978.
Ghasemi-Nejad, E. Ardakani, A. Ruffell, 2010, Palaeoclimate change recorded in Upper
Cretaceous (Albian–Cenomanian) Kazhdumi Formation Borehole SPECTRAL
Gamma-Ray Logs, South Pars Gas field, Persian Gulf, Palaeogeog. Palaeoclim.
Palaeoecol. v. 291, 338-347.
Halliburton Energy Services, 2001, Logging Services Training Manual, Section 4: Gamma
Ray, p. 1 – 38.
Hendy, I. L. and J. P. Kennett, 1999, Latest Quaternary North Pacific surface-water
responses imply atmosphere-driven climate instability, Geology, v. 27, no. 4, p. 291–
294.
Hendy, I. L., J. P. Kennett, E. B. Roark and B. L. Ingram, 2002, Apparent synchroneity of
submillennial scale climate events between Greenland and Santa Barbara basin,
California From 30-10ka, Quaternary Science Reviews, no. 21, p. 1167-1184.
Keller, A., 1993, The geomorphology of Soda Lake, San Luis Obispo County, California.
Lin, J. C., W. S. Broecker and S. R. Hemming, 1998, A reassessment of the U-Th and 14C
ages for late-glacial high-frequency hydrological events at Searles Lake, California,
Quaternary Research, no. 49, p. 11-23.

37
Litwin, Ronald J., Joseph P. Smoot, Nancy J. Durika, and G. I. Smith, 1999, Calibrating
Late Quaternary terrestrial climate signals: Radiometrically Dated Pollen Evidence
from the Southern Sierra Nevada, USA, Quaternary Science Reviews, no. 18, p.
1151-1171.
Lowenstein, T. K., 2002, Pleistocene Lakes and Paleoclimates (0 to 200 Ka) in Death
Valley, California. Great Basin Aquatic Systems History, Smithsonian Contributions
to the Earth Sciences, no. 33, p. 109-120.
Ludwig, L. G., S.O. Akçiz, G. R. Noriega, O. Zielke, and J. R. Arrowsmith, 2010, Climate-
modulated channel incision and rupture history of the San Andreas Fault in the
Carrizo Plain. Science, v. 327, p. 1117-1119.
Miller, T., 2009, Charcoal analysis of North Soda Lake core, Carrizo Plain, California,
California State University, Bakersfield, Unpublished data.
Martinson, D. G., N. G. Pisias, J. D. Hays, J. Imbrie, T. C. Moore, Jr., and N. J. Shackleton,
1987, Age Dating and the Orbital Theory of the Ice Ages: Development of a High-
Resolution 0 to 300,000-Year chronostratigraphy. Quaternary Research, no. 27, p. 1-
29.
Negrini, R. M., 2002, Pluvial Lake Sizes in the Northwestern Great Basin throughout the
Quaternary Period, Great Basin Aquatic Systems History, Smithsonian Contributions
to the Earth Sciences, no. 33, p. 11-52.
38
Negrini, R, P. Wigand, M. Palacios-Fest, D. Baron, S. Loewy, P. Mickler, D. Rhodes, 2009,
Initial Results of Paleoenvironmental Studies on Soda Lake Cores, Carrizo Plain: An
Interim Report to the BLM (Incomplete Draft), unpublished.
Osmond, J. K., and M. Ivanovich, 1992, Uranium-series mobilization and surface
hydrology. In: Ivanovich, M., Harmon, R.S. (Eds.), Uranium-series Disequilibrium:
Applications to Earth, Marine and Environmental Sciences, 2nd Ed., Clarendon Press,
Oxford, pp. 259–289.
Page, L. R., Stocking, H. E., and H. B. Smith, 1956. Contributions to the Geology of
Uranium and Thorium by the United States Geological Survey and Atomic Energy
Commission for the United Nations International Conference on Peaceful Uses of
Atomi Energy, Geneva, Switserland. Geological Survey Professional Paper 300
Rhodes, D., R. Arrowsmith, J. Kilpatrick, and J. Egenbrode, 1998, Clay dunes at Soda Lake,
Carrizo Plain, California, Geological Society of America Abstract with Programs, A-
140.
Rhodes, D., R. Negrini, R. Arrowsmith, G. Noriega, 2005, New evidence for the age and
extent of lake deposits and the role of tectonic warping in late Pleistocene drainage
reorganization, Carrizo Plain, California, Geological Society of America Abstracts
with Programs, v. 37, p. 225.
Rigaku Corporation, 1986, Instruction manual for High Resolution Goniometer, PMG-VH,
Manual No. ME210KT2
39
Ruffell, A., and R. Worden, 2000, Palaeoclimate analysis using spectral gamma-ray data
from the Aptian (Cretaceous) of southern England and southern France, Palaeogeog.
Palaeoclim. Palaeoecol. v. 155, 265-283.
Schlumberger, 1998, Log Interpretations, Principles and Application, p. 3-7 – 3-11.
Schwalbach, J., and K. Bohacs, 1996, Stratigraphic Sections and Gamma-Ray Spectrometry
from Five Outcrops of the Monterey Formation in Southwestern California: Naples
Beach, Point Pedernales, Lion's Head, Shell Beach and Point Buchon, U.S.
Geological Survey Bulletin, v. 1995, 39 p.
Smith, G.I., 1987, Searles Valley, California: Outcrop evidence of a Pleistocene lake and its
fluctuations, limnology, and climate significance. Geological Society of America
Centennial Field Guide – Cordilleran Section.
Smith, G.I., J. L. Bischoff, and J. P. Bradbury, 1997, Synthesis of the paleoclimatic record
from Owens Lake core OL-92. In: Smith, G.I., Bischoff, J.L. (Eds.), An 800,000-
Year Paleoclimatic Record from Core OL-92, Owens Lake, California. Geological
Society of America Special Paper 317, pp. 143–160.
Wigand, P., T. Nelson, K. Beecher, D. Hanel, J. Marin, A. Mathur, M. Minner, N. Nguyen,
2009, Glacial maximum climates of Soda Lake, Carrizo Plain: Use of fossil pollen to
reveal ice age vegetation and climates, CSUB-Chevron REVS-UP summer science
program poster session, August, 2009, California State University Bakersfield.

40
Zic, M., R. Negrini, and P. Wigand, 2002, Evidence of synchronous climate change across
the Northern Hemisphere between the North Atlantic and the northwestern Great
Basin, United States, Geological Society of America, Geology, v. 30, no. 7, p. 635-
638.
A1
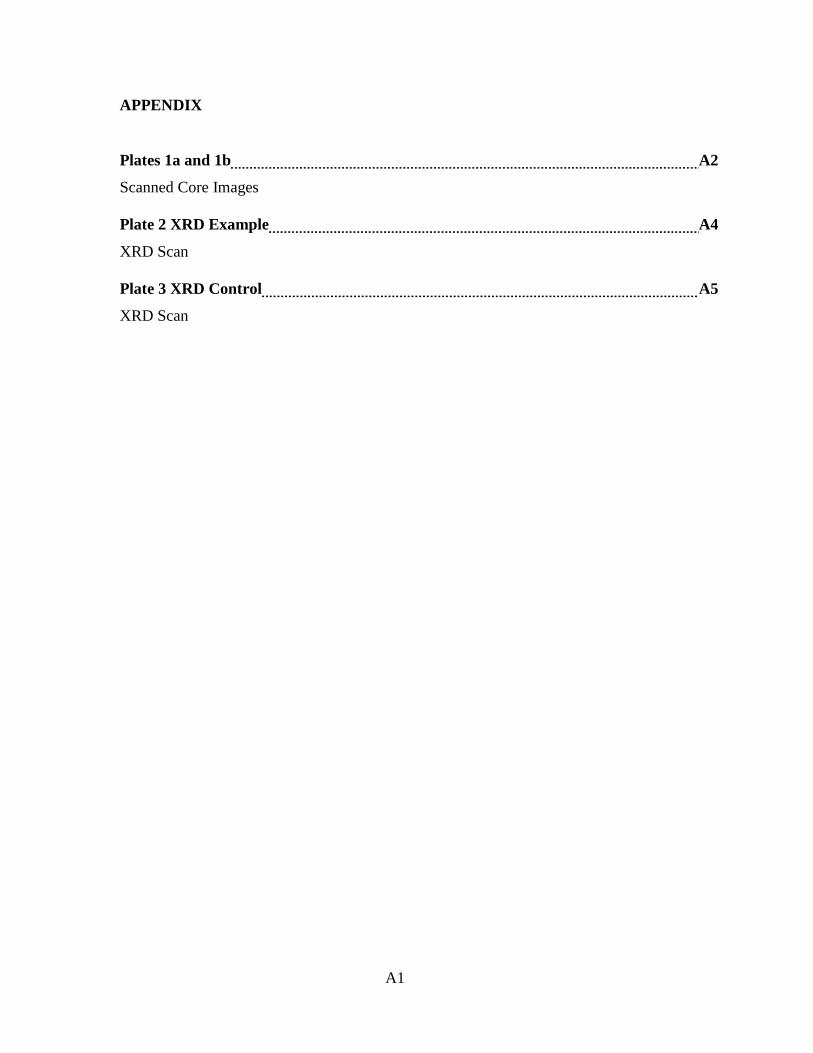
APPENDIX
Plates 1a and 1b A2
Scanned Core Images
Plate 2 XRD Example A4
XRD Scan
Plate 3 XRD Control A5
XRD Scan
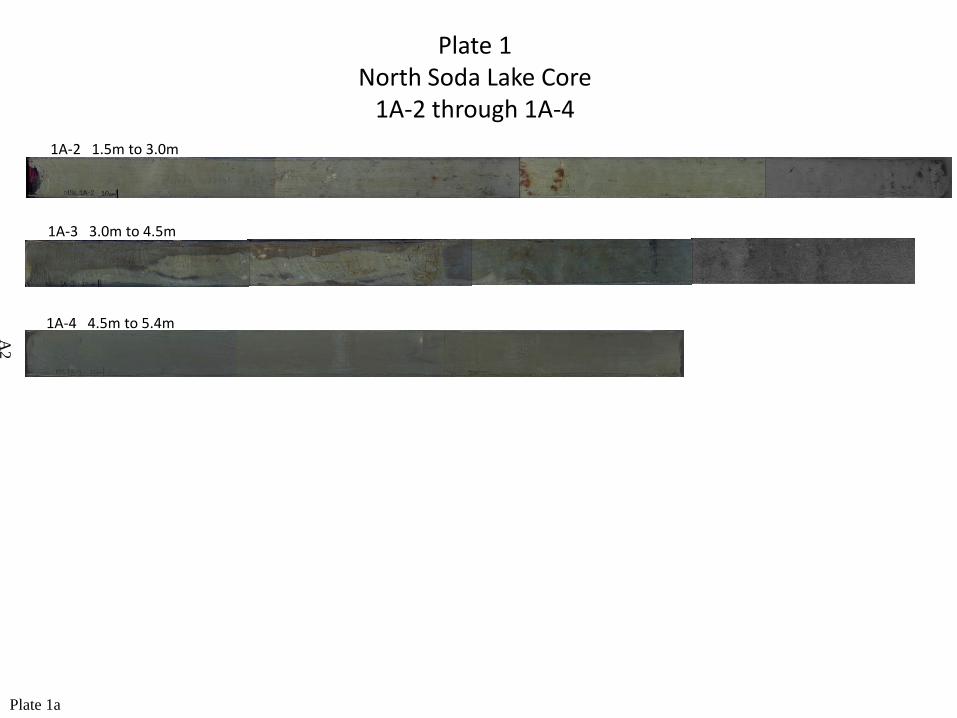
Plate 1North Soda Lake Core
1A-2 through 1A-4
1A-2 1.5m to 3.0m
1A-3 3.0m to 4.5m
1A-4 4.5m to 5.4m
Plate 1a
A2

1B-2 6.0m to 7.3m
1B-3 7.5m to 8.0m
1B-4 9.0m to 10.3m
1B-5 10.5m to 11.5m
1B-6 12.0m to 13.5m
1B-7 13.5m to 15.0m
1B-8 15.0m to 16.5m
1B-9 16.5m to 18.0m
Plate 1North Soda Lake Core
1B-2 through 1B-9
Plate 1b
A3
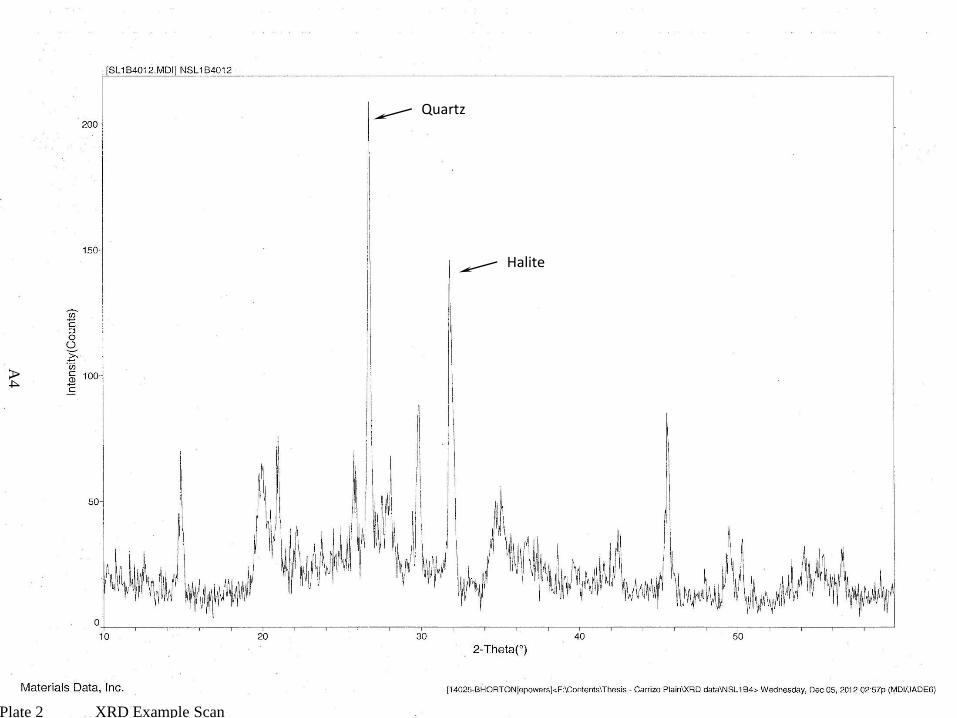
Plate 2 XRD Example Scan
Halite
Quartz
A4

Halite
Thenardite
Gypsum
A5
Plate 3 XRD Control Sample Scan