Copyright by Nancee Jane Sorenson 2010
92
© Copyright by Nancee Jane Sorenson 2010
Transcript of Copyright by Nancee Jane Sorenson 2010

© Copyright
by
Nancee Jane Sorenson
2010

The Treatise Committee for Nancee Jane Sorenson certifies that this is the
approved version of the following treatise:
A PROFILE OF MINORITY MALE ACHIEVEMENT:
A QUANTITATIVE CASE STUDY OF DATA
FROM ACADEMIC YEARS 2008-09 AND 2009-10
AT PIMA COMMUNITY COLLEGE
Treatise Committee: _______________________________________ Walter G. Bumphus, Supervisor
_______________________________________ John E. Roueche
_______________________________________ Louis Albert __________________________________________ Marilyn Kameen
_______________________________________ Louis Harrison
_______________________________________ Norvell W. Northcutt _______________________________________ Shelley Fortin

A PROFILE OF MINORITY MALE ACHIEVEMENT:
A QUANTITATIVE CASE STUDY OF DATA
FROM ACADEMIC YEARS 2008-09 AND 2009-10
AT PIMA COMMUNITY COLLEGE
by
Nancee Jane Sorenson, B.S.; M.S.
Treatise
Presented to the Faculty of the Graduate School of
The University of Texas at Austin
in Partial Fulfillment
of the Requirements
for the Degree of
Doctor of Education
The University of Texas at Austin
December 2010
Dedication
This work is dedicated to the students who are the subject of this study.
It is submitted with hope of improving their academic achievement; with passion as an
advocate of student success; and with purpose, knowledge, and accountability. Such are
the enduring gifts of the Community College Leadership Program, given with generosity
to all who have had the privilege to study with John E. and Suanne D. Roueche.
v
Acknowledgments
When one has been a part of the best, it is a defining experience. No longer
willing to accept anything less than the highest quality in effort, integrity, compassion,
and knowledge, it is with a reluctant heart that “Blockers” steel themselves to reintegrate
into the confines of regular life as an employee, family member, and citizen.
However, without the support of those in “regular” life, it is highly unlikely that
participation in the CCLP would have been possible. To that end, I owe my deepest and
heartfelt appreciation to my family (Ben, Sarah Jane, Eric, and parents Art and Carolyn
Sweeting), friends, and colleagues, who supported me with good cheer, while I had the
extraordinary fortune to be a member of Block 63 in the Community College Leadership
Program. I would like to thank Pima Community College, Chancellor Roy Flores, and
President Lou Albert who supported and approved the administrative leave that allowed
me to be in residence at the University of Texas at Austin.
To Drs. John E. and Suanne D. Roueche, and Dr. Walter G. Bumphus, I have
been graced to be a member of Block 63. The daily exposure to your leadership,
teaching, and mentoring has been an academic and professional experience of
unsurpassed quality and value. I cannot thank you enough for the generous scholarship
support that has been afforded to me. My tenure as Graduate Teaching Assistant to Dr.
Bumphus, Department Chair of Educational Administration was an honor. Special
thanks and fond regards to Sarah Cale-Henson, Executive Assistant to Dr. Bumphus.
To Block 63, our enduring graduate student family and part of the CCLP legacy,
each of you has a special place in my heart. I am so proud of your accomplishments.

vi
Thank you for your humor, support, and camaraderie!

vii
A PROFILE OF MINORITY MALE ACHIEVEMENT:
A QUANTITATIVE CASE STUDY OF DATA
FROM ACADEMIC YEARS 2008-09 AND 2009-10
AT PIMA COMMUNITY COLLEGE
Nancee Jane Sorenson, Ed.D.
The University of Texas at Austin, 2010
Supervisor: Walter G. Bumphus
The purpose of this study was to provide a descriptive case study of the academic
achievement of minority male students over a 2-year period. It was conducted at an
urban community college district, which is a Hispanic Serving Institution. Utilizing
institutional data, the research examined 3,825 male and female students divided into a
total of ten cohorts by gender and ethnicity. All students were 18 to 24 years of age,
new-to-higher education and enrolled full time. Key findings show significant results
for enrollment, departure rates and academic performance for all groups. Male students
demonstrated lower rates of enrollment, higher rates of attrition, and lower academic
achievement that females students. Significant results were demonstrated among male
and female student performance within their own gender group and by comparison to the
opposite gender of the same ethnicity. The high departure rate and achievement gaps by
students who were enrolled full time, strongly suggests that student engagement, is a

viii
profound concern. This study was conducted to identify potential disparities in
achievement by gender and ethnicity to provide detailed information to inform the
public and promote institutional change.

ix
Table of Contents
List of Tables.....................................................................................................................xi
List of Figures ................................................................................................................ xiii
Chapter One: Introduction.................................................................................................1 Background.....................................................................................................................5 Statement of the Problem ...............................................................................................8 Purpose of the Study.......................................................................................................9 Research Questions ......................................................................................................10 Definition of Key Terms ..............................................................................................11 Limitations of the Study ...............................................................................................13 Chapter Summary.........................................................................................................13
Chapter Two: Review of the Literature ..........................................................................15 Persistence and Retention Models: Moving from Dominant Culture to Student Engagement....................................................................................16 Gender and Ethnicity Differences in Academic Achievement.....................................19
Academic Achievement and Gender Gap.................................................................20 Frameworks of Accountability in Student Achievement .............................................27 Chapter Summary.........................................................................................................30
Chapter Three: Research Methodology and Design .......................................................32 Introduction ..................................................................................................................32 Purpose of the Study.....................................................................................................32 Quantitative Case Study Methodology.........................................................................34
Dependent and independent variables ......................................................................36 Validity .....................................................................................................................37 Data analysis.............................................................................................................38
Chapter Summary.........................................................................................................38
Chapter Four: Results.......................................................................................................39 Introduction ..................................................................................................................39 Research Questions and Analysis.................................................................................40
Research Question 1 .................................................................................................40 Research Question 2 .................................................................................................44 Research Question 3 .................................................................................................52 Research Question 4 .................................................................................................56
Chapter Summary.........................................................................................................61
Chapter Five: Discussion and Recommendations...........................................................63

x
Introduction ..................................................................................................................63 Enrollment Loss and Enrollment Gap ..........................................................................64 Enrollment by Ethnicity and Gender ............................................................................65 Choice of Academic Programs.....................................................................................65 Grade Point Average ....................................................................................................65 Recommendations For Application to Current Practice...............................................66 Recommendations for Further Study............................................................................67 Final Conclusion...........................................................................................................68
Appendix A ......................................................................................................................71
References ........................................................................................................................72
Vita ...................................................................................................................................79
xi
List of Tables
Table 1. Description of Student Sample, N = 3825 ........................................................36
Table 2. Enrollment Pattern for Spring 2009 by Gender .................................................40
Table 3. Persistence Enrollment Pattern for Spring 2009 for Male Cohorts ...................41
Table 4. Retention Enrollment Pattern for Fall 2009 by Gender ....................................42
Table 5. Persistence Enrollment Pattern for Spring 2010 by Gender .............................43
Table 6. Persistence Enrollment Pattern for Spring 2010 for Male Cohorts ...................44
Table 7. Average Grade Point Average (GPA) by Gender for Fall 2008 For Hispanic Students .....................................................................................................45 Table 8. Average Grade Point Average (GPA) by Gender for Spring 2009 for Hispanic Students .....................................................................................................45
Table 9. Average Grade Point Average (GPA) by Gender for Fall 2009 for Hispanic Students .......................................................................................................46
Table 10. Average Grade Point Average (GPA) by Gender for Spring 2010 for Hispanic Students .......................................................................................................46 Table 11. Average Grade Point Average (GPA) by Gender for Fall 2008 for White Students...........................................................................................................46
Table 12. Average Grade Point Average (GPA) by Gender for Spring 2009 for White Students...........................................................................................................47
Table 13. Average Grade Point Average (GPA) by Gender for Fall 2009 for White Students............................................................................................................47
Table 14. Average Grade Point Average (GPA) by Gender for Spring 2010 for White Students...........................................................................................................47
Table 15. Average Grade Point Average (GPA) by Gender for Fall 2008 for African American Students ........................................................................................48
Table 16. Average Grade Point Average (GPA) by Gender for Spring 2009 for African American Students ........................................................................................48
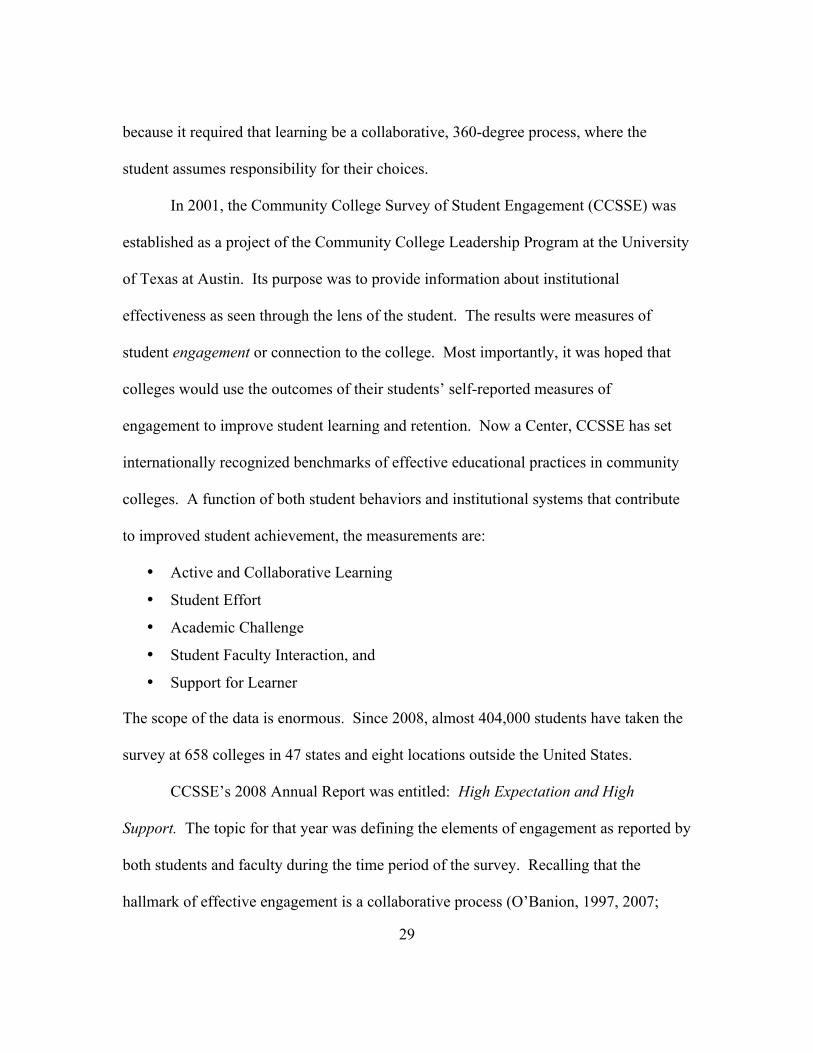
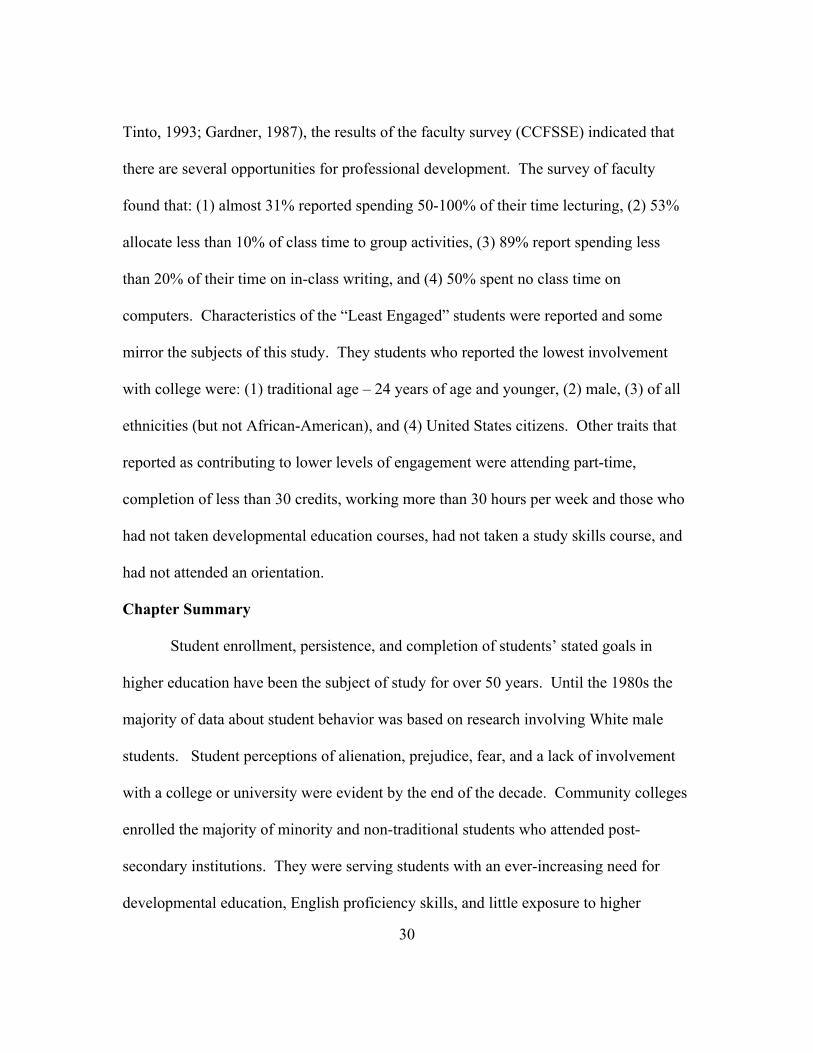
Table 17. Average Grade Point Average (GPA) by Gender for Fall 2009 for African American Students ........................................................................................49
Table 18. Average Grade Point Average (GPA) by Gender for Spring 2010 for African American Students ........................................................................................49
Table 19. Average Grade Point Average (GPA) by Gender for Fall 2008 for Native American Students .........................................................................................50
Table 20. Average Grade Point Average (GPA) by Gender for Spring 2009 for Native American Students .........................................................................................50

xii
Table 21. Average Grade Point Average (GPA) by Gender for Fall 2009 for Native American Students .........................................................................................50
Table 22. Average Grade Point Average (GPA) by Gender for Spring 2010 for Native American Students ..........................................................................................51
Table 23. Average Grade Point Average (GPA) by Gender for Fall 2008 for Asian Students ............................................................................................................51
Table 24. Average Grade Point Average (GPA) by Gender for Spring 2009 for Asian Students ............................................................................................................52
Table 25. Average Grade Point Average (GPA) by Gender for Fall 2009 for Asian Students ...........................................................................................................52
Table 26. Average Grade Point Average (GPA) by Gender for Spring 2010 for Asian Students ...........................................................................................................52
Table 27. Top Ranked Programs Selected In First Term Enrolled – Rank and (Number Selecting) ..........................................................................................54
Table 28. Cross-tabulation: Enrollment Pattern for Spring 2009 for Male Cohorts ........56
Table 29. Cross-tabulation: Enrollment Pattern for Fall 2009 for Male Cohorts ............57
Table 30. Cross-tabulation Enrollment Pattern for Spring 2010 for Male Cohort...........57
Table 31. Oneway Analysis of Variance (ANOVA): Average Grade Point Average (GPA) for Fall 2008 for Male Cohorts.............................................................................59
Table 32. Oneway Analysis of Variance (ANOVA): Average Grade Point Average (GPA) for Spring 2009 for Male Cohorts ........................................................................60
Table 33. Oneway Analysis of Variance (ANOVA): Average Grade Point Average (GPA) for Fall 2009 for Male Cohorts.............................................................................60
Table 34. Oneway Analysis of Variance (ANOVA): Average Grade Point Average (GPA) for Spring 2010 for Male Cohorts ........................................................................61

xiii
List of Figures
Figure 1. Proportion of students entering 9th grade and those persisting to college graduation............................................................................................................7
Figure 2. Male to Female Enrollment ................................................................................8
Figure 3. Kolb’s Learning Styles .....................................................................................25
Figure 4. Research Question One: Enrollment of each Cohort, Fall 2008 ......................39

1
Chapter One: Introduction
For every 100 girls enrolled in kindergarten, there are 116 boys. For every 100 girls enrolled in high school are 100 boys.
For every 100 women enrolled in college, there are just 77 men.
-Victor Saenz, “The ‘Disappearing Latino Male: Setting the Stage.” (Preface, The Educational Crisis Facing Young Men of Color, College Board, 2010)
The state of minority male enrollment, retention, and completion in institutions
of higher education is a concern that impacts families, communities, states, and the
nation. The academic achievement of Hispanic, African American, and Native American
students has been in stagnation or a downward trend over the past three decades. In the
post-Vietnam War era a fourth group, that of Asian American and Pacific Islander
immigrant populations, has risen to a recognized level of national consciousness.
Challenging the commonly held notion that students of these origins are almost always
the “model” minorities, data illuminates a population represented by at least 48 ethnic
categories, speaking over 100 languages. The commonality shared with other groups is
that of lowered socio-economic status and educational attainment. (CARE, 2008).
This issue is at critical proportions throughout the United States and the
probability of a multi-generational negative impact on the future of millions of families
across the country cannot be overstated. (Tienda, 2009; Kirsch, Braun, Yamamoto, &
Sum, 2007). The College Board (2010) published, The Educational Crisis Facing
Young Men of Color, and it revealed the results of the four days of meetings held in
2008. Each gathering, called a “Dialogue Day” (p. 2) was exclusively devoted to one of

2
the four ethnic/minority groups. The forum included scholars, community and
government leaders, activists, and citizens to address the increasing disparity in
economic and education achievement for young men of color. Seven common themes
emerged consistently across all assemblies. They were:
1. A profound crisis exists in the American education of minority males,
overlooked by mainstream society and leaders.
2. “Destructive community pressures” are at work, which undermine minority
male aspirations and expectations for success.
3. Lack of male role models leads to a search for respect outside educational
institutions.
4. Cultural and historic memory is “deeply important” to minority male identity
and pride.
5. Poverty, community problems and language serve as major barriers to
college access and success.
6. Schools and colleges are “failing” young men of color across multiple areas
and levels.
7. Society and communities must “work together to make a difference” for
these young men. (p. 10)
From these four days, a portrait of a “Third America” emerged. Expanding on
the theme of “Two Americas,” (Washington Post, 2004), it is a metaphor for a United
States divided in two by wide economic and social factors. The “Third America”
identified by the report, is populated by citizens who “…are primarily men, and mostly
men of color. They live outside the margins of our economic, social, and cultural
systems. They are the byproduct of many societal failures – including the failing of our
nation’s schools” (p. 2). The report further maintains that mainstream societal leaders

3
largely ignore the condition of men in the Third America. After the release of the report,
US Congressman Raul Grijalva, D-Arizona, a native of Tucson and former Tucson
Unified School District Board Member stated,
It’s gotten to the point where we’re talking about, almost, a permanent underclass in this country, and that is a very, very dangerous development. And it comes at time…when the hues and the tones and the colors of this nation’s face are changing. That population merits more attention now because of that demographic shift that is happening across this nation. (Education Week, August 7, 2010) The “hues and tones and colors” so aptly expressed by Grijalva, have been the
subject of intense discussion in Arizona and the nation. A judicial injunction was placed
on Senate Bill 1070, the “Support our Law Enforcement and Safe Neighborhoods Act”
on July 28, 2010. The court found that requiring Arizona officers of the law to “make a
reasonable attempt to determine immigration status” of any person stopped for any
reason; or, make it a crime for failing to carry alien registration papers; or, make it a
crime for an unauthorized alien to attempt to find or perform work; or, to allow the
“warrantless arrest of a person” on the suspicion of an offense that would make that
person “removable from the United States” would cause “irreparable harm” to the
citizens of Arizona (Bolton, 2010, pp. 33-36). Following this ruling, the United States
Senate began discussion on a proposed hearing on the 14th Amendment. If convened,
the hearing will attempt to discern if the original intent of the amendment was to allow
any person born in the country to have citizenship, without regard to the lawful
citizenship status of the parents (MSN, 2010).

4
Sunnyside Unified School District (SUSD), in Tucson, Arizona enrolls 17,000
students with 94.4% of students identified as a minority. Specifically, the ethnic make-
up of the student body is 87.7% Hispanic, 5.6% Anglo, 4.1% Native American, 2.1%
African American, and 0.5% Asian American. Approximately 86% of SUSD students
are eligible for free or reduced-price meals. About one-third of students are classified as
English language learners (ELL). In 2007, Sunnyside launched its nationally recognized
Project Graduation: The Digital Advantage (SUSD, 2010). Project Graduation has
raised attendance, freshman promotion, and high school graduation rates to previously
unachievable rates. The original goal was to ensure that 556 students graduated in May
2008. Expectations were exceeded when 598 seniors received their diplomas. In 2009,
715 students graduated, setting a district record. In 2010, the record was reset when 821
students received their diploma. In three years, the district has realized a 67% increase
in high school graduation. It has been estimated that 50% of the children attending the
district may be undocumented residents or the children of undocumented residents
(SUSD Administrator, 2009).
The largest school district in Pima County is the Tucson Unified School District
(TUSD)–a majority minority district. TUSD enrolls almost 56,000 students. The
demographic profile is 56.2% Hispanic, 29% Anglo, 7.6% African-American, 4.5%
Native American, and 2.8% Asian American. Nine percent of TUSD students are
classified as ELL and over 58% qualify for free or reduced lunch (TUSD, 2010). The
Mexican-American studies program has been the subject of investigation by the State

5
Superintendent of Schools for over three years. This year the Arizona legislature passed
State Bill (SB) 2281. It,
prohibits courses that promote the overthrow of the US government, promote resentment toward a race or class of people, are designed primarily for pupils of a particular ethnic group, and advocate ethnic solidarity instead of the treatment of pupils as individuals. (Arizona Daily Star, August 4, 2010)
The Superintendent’s latest demand is that TUSD videotape these courses to
prove they are not in violation of SB 2281. School officials will not comply. “I think the
voters will see past the ruse and see that No. 1, we have not done anything wrong and
that we continue to ask for the conservative value of local control” (TUSD Board
Member, 2010). The evidence that “destructive community pressures” exist in Arizona
that could undermine the “aspirations and expectations for success” of male students in
Pima County will become difficult to challenge.
In March, President Obama in a weekly video address warned, Unless we take action – unless we step up – there are countless children who will never realize their full talent and potential. I don’t accept that future for them. And I don’t accept that future for the United States of America.
Background
Located in Tucson, Arizona, Pima County Community College District
(PCCCD) is an urban multi-campus district with a Fall 2010 enrollment of 35,272 credit
students. A designated Hispanic Serving Institution (HSI), the college offers over 144
transfer and occupational certificates, workforce skills center training, adult basic
education and family literacy courses, GED preparation, and community education to a

6
population center of over 1 million residents in Pima County and southern Arizona. It is
governed by an elected five member Board of Governors that serves six-year terms.
Consistently listed as one of the “120 largest degree granting colleges and
universities” (NCES 1994 to 2007), regular quality and performance measurements had
been a challenge for the institution. Rapid enrollment growth and expansion, from the
mid 1970s to the late 80s, allowed the college to grow from one to four campus
locations, add education centers, and offer classes at hundreds of sites across Tucson and
in Santa Cruz County, bordering Mexico. Like many colleges, growth superseded
accountability. Not until the late 1990s would college-wide conversations take place
regarding developmental education, student persistence, retention, and other aspects of
student success not enrollment driven.
Roy Flores began his tenure as the leader of the District in 2003. Chancellor
Flores has placed student learning and success as the foundation of operational planning
and delivery since his arrival. He led the institution in the simplification of the mission
statement to read “To Develop Our Community through Learning” (College Plan, 2004).
In 2009, Flores outlined his growing alarm over the declining rates of
educational attainment of United States citizens, ages 18 to 24. Compared to attainment
achieved by residents of 11other countries, the US ranks 12th. In a presentation at the
National Conference on Race and Ethnicity (NCORE) he revealed that Arizona
residents, ages 25-to-34, are eight percentage points lower in baccalaureate degree
completion than Arizona residents ages 55-to-64. Thus, the best educated Arizonans are
in the oldest age category rather than the younger. This is the reverse of trends in the

7
United States as a whole, and far below the attainment being achieved by the same age
group in other countries (Flores & Miles, 2009). Citing the data from the 2006 National
Center for Higher Education Management Systems (NCHEMS) study to discern the
need for additional baccalaureate education in Arizona, the results for the state are a
source of growing unease. For every 100 students in the ninth grade, 63 graduate from
high school, 30 enter college directly after graduation, approximately 18 are enrolled in
the second year of college, and 15 graduate within 150% of the total time of the program
(NCHEMS, 2006). This trend, illustrated in Figure 1, is in direct contrast to another
major finding that demonstrates high technology jobs requiring the minimum of an
Associate Degree will be the fasting growing sector of employment in Pima County in
the foreseeable future (p. 7).
Figure 1. Proportion of students entering 9th grade and those persisting to college graduation
In addition, the report demonstrates that educational deficits are the largest in
Arizona’s minority and immigrant populations with males exhibiting the most need for
improvement in levels of educational attainment.
The college office of Planning and Institutional Research published a report
called “Environmental Scan Update: March 2008.” It noted the existing 13% gender
gap in male-to-female enrollment at Pima Community College as an institutional
9th grade
• 100 students
12th grade
• 63 graduate
1st yr college
• 30 enroll
2nd yr
college • 18 enrolled
Graduate
• 15 complete in 150%
8
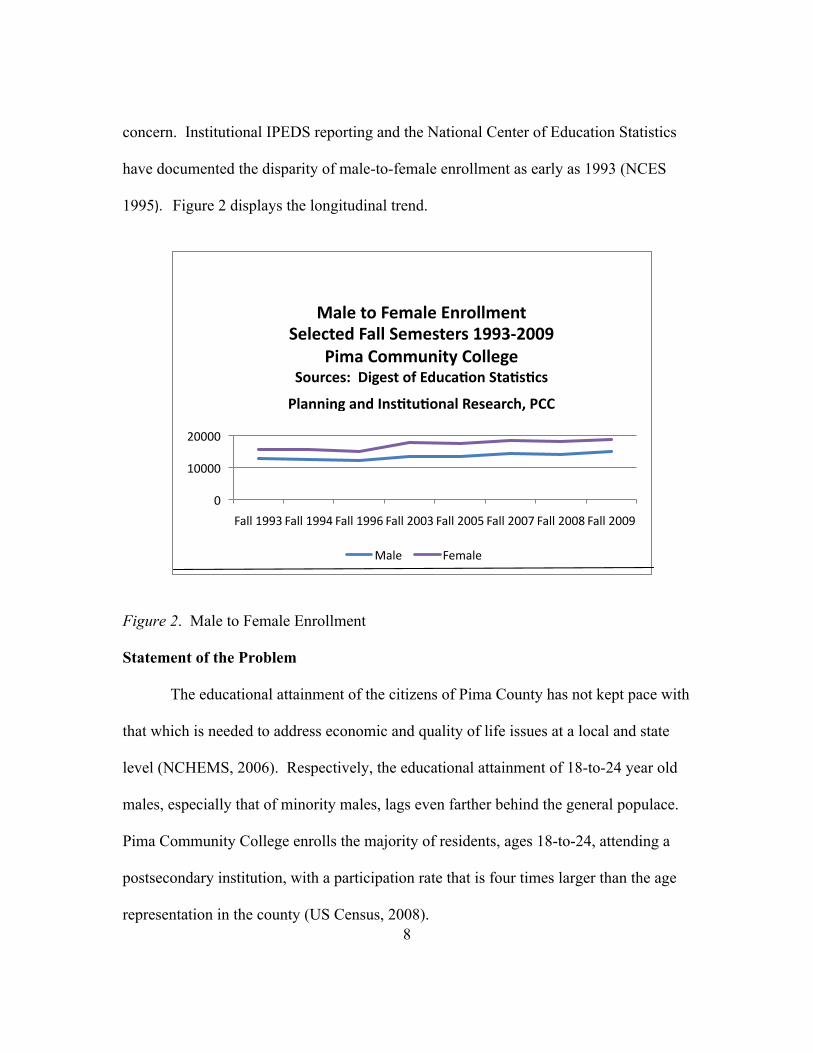
concern. Institutional IPEDS reporting and the National Center of Education Statistics
have documented the disparity of male-to-female enrollment as early as 1993 (NCES
1995). Figure 2 displays the longitudinal trend.
Figure 2. Male to Female Enrollment
Statement of the Problem
The educational attainment of the citizens of Pima County has not kept pace with
that which is needed to address economic and quality of life issues at a local and state
level (NCHEMS, 2006). Respectively, the educational attainment of 18-to-24 year old
males, especially that of minority males, lags even farther behind the general populace.
Pima Community College enrolls the majority of residents, ages 18-to-24, attending a
postsecondary institution, with a participation rate that is four times larger than the age
representation in the county (US Census, 2008).
0
10000
20000
Fall 1993 Fall 1994 Fall 1996 Fall 2003 Fall 2005 Fall 2007 Fall 2008 Fall 2009
Male to Female Enrollment Selected Fall Semesters 1993-‐2009
Pima Community College Sources: Digest of EducaGon StaGsGcs
Planning and InsGtuGonal Research, PCC
Male Female

9
While participation rates by ethnicity somewhat mirror the county population,
male participation rates are lower than female participation rates by over 10% for the
college district. The disparity is even higher at one PCCD campus, located in the
southwestern part of the county. A majority minority campus, Hispanic students
comprise 57.2% of the student population with female enrollment at 62.9%, and male
enrollment is 37.1%, reflecting a gender gap of 25.8%. Other college evidence indicates
that across every campus, male achievement is lower than female achievement in Grade
Point Average (GPA), rates of persistence, completion, and transfer. While institutional
data exists by gender and ethnicity overall, there is no profile of male-to-female
achievement by ethnicity that provides direct comparison on student performance.
Purpose of the Study
The purpose of the study will be to provide a profile of minority male
achievement for the academic years 2008-09 and 2009-10 at PCC. It will include an
analysis and comparison of quantitative data available through the college department of
Planning and Institutional Research; census, economic, and educational data from
Pima County and Arizona; and that from sources such as the American Association of
Community Colleges (AACC), Achieving the Dream (AtD), the National Center for
Education Statistic (NCES), and the Center for Community College Survey of Student
Engagement (CCSSE). The overall goal of the study will be to provide a quantitative
summary of the enrollment and academic achievement of minority male students. The
results of the study may aid PCCCD by presenting, (1) a comparison of academic
achievement within ethnicity; and, (2) demarcate trends regarding the perceived

10
disparity of performance indicators associated with gender and/or ethnicity.
Research Questions
The study examines the enrollment and academic achievement of 10 student
groups, ages 18-to-24, who were new to higher education and enrolled as full time
students in the Fall 2008 (Academic Year 2008-09/AY 08-09) and tracks progress using
a specified set of performance indicators through the Spring 2010 (Academic Year
2009-10/AY 09-10). For the purpose of the study, each group is designated as a cohort.
They are:
Cohort A Hispanic male students
Cohort A(1) Hispanic female students
Cohort B White male students
Cohort B(1) White female students
Cohort C African-American male students
Cohort C(1) African-America female students
Cohort D Native American/Alaskan Native male students
Cohort D(1) Native American/Alaskan native female students
Cohort E: Asian/Pacific Islander male students
Cohort E(1) Asian/Pacific Islander female students
It is guided by four primary research questions that define the purpose of the
inquiry. The questions are as follows:
Research Question 1: Beginning in the Fall 2008 semester, and each subsequent
term defined in the study, what was the enrollment for each cohort?
Part A: For each cohort, what percentage persisted in the Spring 2009
semester?
11
Part B: For each cohort, what percentage were enrolled in the Fall 2009
semester?
Part C: For each cohort, what percentage persisted in the Spring 2010
semester?
Research Question 2: What was the cumulative Grade Point Average (GPA) of
each cohort by term during the time period of the study?
Research Question 3: What are the “top ten” programs of enrollment for each
cohort during the time period of the study?
Research Question 4: What are the statistical comparisons within all male
cohorts for the following performance indicators?
a. Enrollment and participation rate
b. Persistence (semester-to semester)
c. Retention (Fall 08 to Fall 09)
d. Grade Point Average
by first semester (Fall 08)
by cumulative (Spring 10)
Definition of Key Terms
Academic Year - as defined by PCCD, it is the period from July 1st to June 30.
Fall semester - a 16-week term beginning late August and concluding in the third
week of December. Within the full semester, shorter terms of enrollment occur. For
this study, all terms are included in the semester.
Spring semester - a 16-week term beginning in the third week of January and
concluding in the third week of May. Within the full semester, shorter terms of
enrollment occur. For this study, all terms are included in the semester.

12
African American – a person having origins in any of the black racial groups of Africa.1
Asian/Pacific Islander – a person having origins in any of the original peoples of
the Far East, Southeast Asia, or the Indian subcontinent, including, for example:
Cambodia, China, India, Japan, Korea, Malaysia, Pakistan, the Philippine Islands,
Thailand, and Vietnam, or a person having origins in any of the original peoples of
Hawaii, Guam, Samoa, or other Pacific Islands.
Hispanic – a person of Mexican, Puerto Rican, Cuban, South or Central
American, or other Spanish culture or origin, regardless of race.
Native American/Alaskan Native – a person having origins in any of the original peoples
of North and South America (including Central America) and who maintains tribal
affiliation or community attachment.
White - a person having origins in any of the original peoples of Europe, the
Middle East, or North Africa.
Enrollment - the total number of students enrolled in a defined term.
Persistence - used to describe student enrollment behavior, it is defined as those
students who enroll in a semester and return for the next consecutive semester.
Retention - used to describe student enrollment behavior, it is defined by those
students who enroll in the fall semester of an academic year and return in the fall
semester of the consecutive academic year 1 Ethnicity definitions are those used by the Department of Education in Status and Trends in the Education of Racial and Ethnic Groups (July, 2010)

13
Completion - the term used to define the successful completion of a student’s
stated intent or goal.
Transfer - term used to define students that leave PCCD to enroll at a four-year
college or university.
“Top Ten” Programs or Certificates - the terms used to describe the 10
programs or certificates with the highest number of students enrolled.
Limitations of the Study
The research is based on aggregate, quantitative data from a single institution. It
does not include classification of any student group by placement into developmental
education courses or college level courses. It does not track the utilization of financial
aid by students in the cohorts. The goal is to gain an intensive quantitative understanding
of minority male academic achievement. From this, the institution may choose to
embark on further study that will encourage actions and strategies by the College, and
the community, to address improving levels of educational attainment.
Chapter Summary
Changing demographics and the decline in educational attainment for the United
States and the residents of Arizona, especially that of immigrant and minority male
populations, is a key issue concern. If unanswered, the impact on the economic future of
its citizens will be devastating. Pima County Community College District has a
challenging role ahead to ensure residents can meet the educational requirements for
jobs that demand the minimum completion of the Associate Degree. In Pima County,
Hispanic males earned only 7% of the total number of Associate Degrees awarded in

14
2007-08. At PCCD, there is an achievement gap for male students, especially minority
male students when compared to female students. It is the intent of this research to more
clearly identify the academic performance of male students by ethnicity, and as
compared to female students.

15
Chapter Two: Review of the Literature
While studies on student persistence and retention have been ongoing for almost
50 years (Harvey-Smith, 2003), the research on minority students is substantially
younger. In the 1970s, studies that focused on non-white students were limited (i.e.
Valentine, 1971; Gurin, Epps, 1975; Olivas, 1979). The majority of work began in the
1980s (Allen, 1984; Fleming, 1984; Thomas, 1984; Nettles, Gosman, Thoeny, &
Dandridge, 1985; Weis, 1985; London 1979, 1989; Nora & Rendon, 1988, 1990;
Attinasi, 1989). This surge of investigative work changed the knowledge base. It
advanced policy and practices that questioned traditional ways of structuring academic
and student services based on research with inconsequential numbers of minority
students. New studies with substantive data regarding women and students of color
(Rendon, 1982; Nora, 1987; Cabrera, Nora, & Castenda, 1992; Cabrera & Nora, 1994)
improved the work of Tinto’s (1975, 1983, 1993) model of social and academic
integration and Astin’s (1985) theory of student involvement. With this information,
student perceptions of prejudice, discrimination, and alienation were included as barriers
to persistence and retention. Academic readiness, a key component limiting access to
and success in higher education, was brought into view in 1971, by Roueche and Kirk.
Roueche and Comstock (1981), McCabe (1982-83), and Boylan and White (1987),
identified the importance of literacy development and developmental education as
crucial to the success of minority and non-traditional student populations. Later, the
inequities of access to finances to participate in postsecondary education began to
emerge as a topic of investigation (Cabrera, Nora, & Castenda, 1992).

16
The review of literature for this study focused on three areas:
1. The evolving nature of persistence and retention models in higher education;
2. Gender and ethnicity differences in achievement and learning style; and,
3. The framework for accountability and data-driven decisions in prioritizing
institutional goals around student achievement.
Persistence and Retention Models: Moving from Dominant Culture to Student Engagement Pascarella’s (1980) model of student-faculty informal contact described how
both the frequency and quality of informal contact with faculty can shape student
persistence and academic achievement. Just as importantly, it was the students’
characteristics such as aspirations, attitudes toward college, academic achievement, and
personal and intellectual development that were a powerful influence in the ease with
which such informal contacts were developed (pp. 545-595). Not surprisingly, less
traditional student populations reported higher levels of difficulty establishing these
critical informal relationships. In a 1993 study, Love examined problems associated with
the retention of African American students and found interaction with faculty as one of
seven categories of non-cognitive variables that were most frequently named as
negatively impacting retention.
In a 1995 study of Latino students experience in the first year of community
college, Jalomo documented several characteristics that were barriers for students in
becoming connected to their new environment. Among those were:
• Feeling afraid or out of place in mainstream college culture.
• Had experienced negative interactions with college faculty or administrative
staff.

17
• Had a hard time adjusting to the fast pace of college.
• Were single parents or were married with family obligations.
• Lacked financial resources to take additional courses or participate in campus
activities.
• Were first in the family to attend college.
• Did not have positive academic or social experiences in high school.
Numerous other studies (Kuh & Witt, 1988; Zambrana, 1988, Townsend 1994,
Ramirez, 1996; Nora, Kraemer, & Itzen, 1997) confirmed that minority students in
traditional institutions, including community colleges, were confronted by environments
that were often apathetic and mono-cultural. Staff, faculty, or other students could be
hostile and/or display overtly racist views of students’ academic ability to succeed.
Many colleges and universities were entrenched in the notion acculturation into the
academic environment was a student responsibility, not theirs.
Community colleges were enrolling the majority of ethnic minority and non-
traditional students by the 1980s. Those known for excellence in teaching instruction,
innovation, and student success were recognized by Roueche and Baker in Access &
Excellence: The Open-Door College (1987). Miami-Dade Community College was the
focus of an intensive study by the authors who found that Miami Dade’s commitment to
teaching, climate, systems of organization, and data allowed a multicultural student
population, with vast differences in academic preparation, to achieve unprecedented
success. Examples of other community colleges dedicated to student success were
Cuyahoga Community College, studied by Ellison (1987); Brookhaven College of the
Dallas County Community College District; and the Community College of Denver

18
(CCD). In 1986, institutional priorities at CCD were rearranged to meet the needs of an
increasing student population of ethnic minority origin, a declining economy, increasing
high school dropout rates, and a high need for literacy and developmental education
(Roueche, Taber, & Roueche, 1995; Roueche, Ely, & Roueche, 2001). The critical
difference exhibited by these colleges was the willingness and ability to transform the
institution to meet the needs of students.
Over this same period, Tinto began adjusting his model to link institutional
factors to student persistence. By 1993, Tinto explained that student success involved,
“the critical importance of student engagement in the learning communities of the
college” (p. 132). Alexander Astin’s (1985) theory of student involvement was key to
the concept of student engagement. Astin defined involvement as “the amount of energy
that the student devotes to the academic experience (1984, p. 27). Research has
supported this as vital to student persistence and achievement (Pascarella & Terenzini,
1991; Tinto, 1987). Absent in Tinto’s earlier models was the recognition that minority
students experienced more difficulty in initiating involvement and may have
experienced higher levels of apathy or hostility in the campus environment (Jalomo,
1995; Hurtado, 1997; Saenz, 2004). A much-needed improvement began when
facilitating and increasing student engagement started to be seen as an institutional
imperative. Community colleges that employed such strategies were in the forefront in
acknowledging that placing the learner at the core of its mission, values, and belief’s
was paramount (O’Banion, 1997).

19
Gender and Ethnicity Differences in Academic Achievement
The United States has long recognized the role sustained lower socio-economic
status has played in educational equity and achievement. Following the Civil Rights Act
of 1964, the Johnson administration’s vision of a Great Society included a War On
Poverty. As such, Title I of the Elementary and Secondary Education Act was
authorized in 1965. Named “Improving the Academic Achievement of the
Disadvantaged,” its purpose was to equalize funding in schools located in low-income
neighborhoods, cities and counties, and to raise the academic achievement of children
attending those schools. College age disadvantaged students were assisted in accessing
higher education via the Upward Bound, Talent Search, and Student Support Services
programs that began in 1965 from the Economic Opportunity Act of 1964. Since that
time, billions of dollars have been allocated to improve the educational attainment of
minority and other disadvantaged populations. The Feminist Movement, at a zenith in
the late 1960s through the late 1970s, sought to equalize and advance opportunities for
women and girls in all aspects of American life to include health, education, and
employment. Women, along with members of ethnic minorities, became part of the
“protected” classes under the Equal Employment Opportunity Act of 1972, or Title VII
of the Civil Rights Act of 1964. This barred discriminatory practices in employment
based on gender, age or ethnic origin (Ed.Gov, 2010).
A significant call for additional educational reform was published in 1983 with A
Nation at Risk. This treatise proclaimed that education was “drowning in a rising tide of
mediocrity” at the primary, secondary, and postsecondary levels. During this same

20
period, the increasing need for developmental and remedial education was being noted
by community colleges all across the country. The Secretary’s Commission on
Achieving Necessary Skills (SCANS): What Work Requires from Schools Report was
produced in 1990. Documenting the need by employers for improved math, critical
thinking, communication, and technology skills in high school graduates, it projected
that by year 2000, the majority of jobs in the United States would require a minimum of
the Associate’s Degree. In 2002, Congress passed the No Child Left Behind legislation,
which mandated more rigorous reporting and performance requirements for elementary
and secondary public education with harsh sanctions to be applied if standards were not
met. Kirsch, Braun, Yamamoto, and Sum (2007) stunned the educational and business
communities with its dire prediction of the outcome of “the confluence of three powerful
forces” that could end the “American dream of prosperity” (p. 3). Through benign
indifference or abject neglect the “rising tide of mediocrity” has become America’s
Perfect Storm, a tsunami of potentially damaging proportions never experienced in the
United States. The three forces are:
• Divergent skill distributions of literacy and numeracy among school-age and
adult populations (Force One),
• Profound restructuring of the US workplace (Force Two), and
• Sweeping demographic changes (Force Three) (p. 4).
Academic Achievement and Gender Gap. “Boys at risk: The gender
achievement gap” appeared in the American School Board Journal in April 2006.
Noting that boys were now the largest “subgroup” (p. 1) of disadvantaged students in a
Boulder Colorado school district, it confirms that educational research has known about

21
the decline in male achievement for the last 20 years. Lowered achievement in
elementary schools is believed to be fostered by the system’s inability to recognize and
value the learning style differences that originate in brain chemistry and male sex
hormones. These differences are responsible for the development of the physical and
mental abilities in boys. Younger boys would benefit by four to five recesses a day,
according to William Pollack, Harvard psychologist and author of Real Boys (1998).
Boys need to perform more and sit less (p. 2). Traditional classrooms, focused on
sitting, listening, reading, and writing for concentrated periods of time are not “boy
friendly” (Gurian, 2010). Likening it to an “industrial schooling system” he stated, “it’s
not the way boys learn best, and their grades show it.”
Smart Boys, Bad Grades, (Coates & Draves, 2006) a report sponsored by the
Learning Resources Network, confirmed that the traditional teaching methods and
system requirements found in the majority of K-12 schools, ignore the basic learning
needs and styles of boys.
Overnight school boards – without any cost involved – could put more than a million boys into college, simply by not penalizing them for late homework. As long as you continue to punish boys for late homework, they’re not going to get into college. They may learn. They may increase their knowledge. But they won’t have the grades. (p. 5) Pollack created a curriculum that was tested in 27 public and private schools in
the San Francisco Bay area. It includes educational video games and computers as
learning tools. It was designed to “create classrooms that are more comfortable to boys”
(p. 5). In classrooms that have replaced lectures with lessons that are taught in shorter
time periods, utilize small groups, and give boys opportunities to demonstrate mastery in
22
ways through performance; reading and writing skills have been shown to increase to
achieve levels even with, or surpassing that, of girls (p. 6). School officials stated that it
was imperative to recognize the learning style differences and create avenues of
excellence for both girls and boys. Adjustments were made to the method and style of
instruction that allowed each group to achieve.
Even though gender and cultural differences in college student persistence have
been studied in relationship to the quality and frequency of interaction with faculty,
there are fewer indicators that college and university faculty are adjusting instructional
methodologies to accommodate learner needs. The majority of instruction continues to
occur in a lecture format, although it is now enhanced by the addition of instructional
technologies that provide software, are more web-based, and utilize on-line forms of
collaboration and discussion. The traits of millennial, “gen-x” and “gen-y” student
populations are a much-studied topic. However, their presumed efficacy and use of
technology does not directly translate to the skill needed for academic achievement. At
Pima Community College, basic computer literacy and academic computing workshops
were added in January 2010 to meet the widespread disconnect reported by faculty
(Appendix A).
Learning style research has revealed the correlation of improving academic
success by matching style to the instructional environment. O’Banion’s (1997) A
Learning College for the 21st Century emphasized the need for faculty to be in a
continuous assessment process in evaluating student characteristics and abilities in order
to improve student learning outcomes. Writing about the multiple intelligences that

23
students bring to the classroom, (i.e., cultural, emotional, and preference in learning
styles) he cited the work of Guild (1994). Guild found that ethnicity and gender are
associated with the approach students take to understanding the environment in the
following ways:
• Students of Mexican-American origin have high regard for family and personal
relationships and a preference for cognitive generalizations and patterns. In the
classroom, they are more likely to seek personal relationships with faculty and
tend to perform better with broad concepts, rather than specific facts and
components.
• African-American students tend to more highly value oral experiences, physical
activity, and loyalty in interpersonal relationships. Students prefer instructional
activities such as discussion, active projects, and collaborative work.
• Native American students value and develop stronger visual discrimination
abilities and skills in the use of imagery, perceive globally, and demonstrate
reflective thinking patterns. Students need time for quiet thinking and benefit
from visual stimuli.
• White Americans tend to value independence, analytic thinking, objectivity, and
accuracy. In the classroom, this indicates a preference for competition,
information, tests, grades, and linear logic. These patterns were identified as
those most prevalent in American schools. (p. 88)
• Women tend to value collaborative learning, cooperative problem solving and
socially based knowledge. Students may prefer practical application and “hands
on” experiences.
In O’Banion’s vision of a 21st century community college, faculty and students
would be engaged in a complete collaborative process, wherein all participants would be
provided the resources needed to achieve the mission of learning. Jones and Mokhtari
24
(2003) looked at the effectiveness of instruction grappling with the multiple traits of a
widely diverse student population such as age, ethnicity, English proficiency, income,
and readiness for college level instruction. Concerned about the 40% student attrition
rate reported as a national average for community colleges (AACC, 2010) the
researchers were looking at more effective strategies to empower students by teaching
them “how to learn” (p. 364). Jones and Mokhtari recognized that the probability of the
rapid implementation of easily adaptable teaching styles and modes of instructional
delivery, could not realistically keep pace with the needs of emerging student
populations. The question they sought to answer centered on students’ ability to
recognize their learning style and adapt it to the learning demanded by the discipline.
The basis of the research utilized Kolb’s 1984 model of learning styles and
learners who demonstrate a preference for one of four modes of learning. These modes
of learning, identified by Kolb (1984), were based on his synthesis of Carl Jung’s work
that dealt with the varying approaches that people use in perceiving and processing
information. The four modes of learning are: (1) Concrete Experience, (2) Abstract
Conceptualization, (3) Active Experimentation, and (4) Reflective Orientation. The
model emphasizes that all information is perceived along a processing continuum.
Learners have a preference in the processing of information. As a result, students place
into a type that is dependent on the dominant mode of learning that is most often used to
understand information. The types of learners are: (1) Divergers, who learn by
combining Concrete Experience with Reflective Observation to create a learning style
that can view concrete situations from various viewpoints, (2) Assimilators, who learn

25
by reflecting on abstract concepts and putting the information in logical form, (3)
Convergers, who learn by taking abstract ideas and actively experiment to find practical
uses for the information by finding solutions to problems, and (4) Accommodators, who
learn by taking concrete experiences mixed with active experimentation with a hands-on
experiences ( pp. 365-366). ). Figure 3 illustrates Kolb’s learning styles and the
interaction of modes and types along a processing and perception continuum.
Figure 3. Kolb’s Learning Styles
The study determined that students do adapt or “style flex” depending on the
subject matter that is being learned. It also established a connection between learner
type and GPA. Interestingly, the study did not produce differences among gender. The
Assimilators (3.40) achieved the highest GPA among all students in the study, followed
by Convergers (3.21), Divergers (2.94), and Accommodators (2.67) (p. 367). Levels of
Accommodators Divergers
Assimilators Convergers
Reflective
Observation
Abstract Conceptualization
Active
Experimentation
Concrete Experience

26
significance were established for GPA by type. Assimilators had significantly higher
GPA’s than Divergers or Accommodators, and Convergers were significantly higher in
GPA over Accommodators. In discussing the non-significant results in learning style
mode preference by gender, the authors noted that more males than females have
traditionally occupied the Assimilator category. In the bulk of most learning style
research, males tend to prefer traditional analytical learning and classroom environments
(Philibin, Meier, Huffman, & Boverie, 1995, as cited in Jones & Mokharti, 2003) and
females tend to prefer more “nontraditional learning and classroom environments in the
concrete experience learning mode” (p. 373) and are more likely to be in the diverger or
accommodator learning style quadrants.
Jones and Mokharti concluded that the GPA achieved by the Assimilator group
was a match to the traditional lecture teaching style, which they believe is the most
predominant mode of instruction offered by community colleges. Three
recommendations that came from the study were; (1) colleges should include
assessments that evaluate learning styles to increase student awareness of their preferred
style and give them the ability to have more control of their learning habits and
strategies, (2) college faculty and staff “can and should” accommodate the diversity of
“personal experiences, knowledge bases and learning styles” by adapting teaching and
advising strategies. A range of strategies are needed for effective teaching rather than a
single, inflexible approach, and (3) productive professional development with the
necessary resources that include time, incentives and other tools, should be a part of a
commitment by leadership.
27
Frameworks of Accountability in Student Achievement
Effecting changes in student achievement requires, as stated above, a
commitment by leadership. More than resources, it requires a fundamental dedication to
accountability, evidence, and data. The American Association of Community Colleges
(AACC), in partnership with the College Board and the American Association of
Community College Trustees (ACCT), launched the Voluntary Framework of
Accountability (VFA) initiative in 2009. With funding from the Lumina and the Bill
and Melinda Gates Foundations, the initiative’s purpose is to be a multi-phase model of
effectiveness that will allow community colleges to demonstrate measures of student
progress and completion. It will serve as a national platform to provide constituencies
vital information about community colleges and their ability to meet workforce,
economic, and community needs. The AACC states,
The VFA initiative comes at a critical moment for community colleges. As a nation we have focused on increasing access to higher education but have neglected completion and success rates. Among community college leaders there is a growing concern that providing access to students is not enough and that colleges must also assume responsibility for increasing the success rates for students. (2010)
Roueche, Baker, and Brownell (1971) spoke to the concept of college leadership
assuming responsibility for results almost 40 years ago. They stated, “Accountability is
far more than a glib term or ‘in’ word. It is an operational concept…accountability is a
privilege – not a burden” (Roueche et al., 1971, p. 8). According to Roueche et al.,
successful implementation of accountability must include four critical characteristics.

28
Those are:
1) Accountability is focused on results that are made up of the outcomes of the
system, rather than enumerating what it is composed of. “…Teaching causes
learning. If no learning occurs, then no teaching has taken place!” (pp. 6-7).
2) Accountability requires measurement rather than document volume or mass.
When “looking at how well students are being taught” (p. 7) use relative
criteria, objectives and measurement techniques.
3) Accountability assumes and shifts primary responsibility to learning from the
student to the college.
4) Accountability diffuses through the college community by starting at the top,
with the board and president. It sweeps down, over and through so that “the
administration, the students, the instructors…[so that all are] accountable to
the community served by the college” (p.8).
Accountability is not complete without using the results to implement change.
“Data should be used not only for accountability, but also for the explicit purpose of
improving student outcomes and institutional performance” (Morest & Jenkins, 2007, p.
4). When O’Banion wrote about the importance of the learning college in the 21st
century, he envisioned a place of continuous assessment, collaboration, and
improvement, where the needs of the learner (student) would be placed front and center
at all times. A learning college model is guided by six principles, the first of which is
the “creation of substantive change in individual learners” and the last is “the definition
of success is data-driven based on improved and expanded learning” (p. 47). Engaging
the students “as full partners in the learning process” was another substantive change,
29
because it required that learning be a collaborative, 360-degree process, where the
student assumes responsibility for their choices.
In 2001, the Community College Survey of Student Engagement (CCSSE) was
established as a project of the Community College Leadership Program at the University
of Texas at Austin. Its purpose was to provide information about institutional
effectiveness as seen through the lens of the student. The results were measures of
student engagement or connection to the college. Most importantly, it was hoped that
colleges would use the outcomes of their students’ self-reported measures of
engagement to improve student learning and retention. Now a Center, CCSSE has set
internationally recognized benchmarks of effective educational practices in community
colleges. A function of both student behaviors and institutional systems that contribute
to improved student achievement, the measurements are:
• Active and Collaborative Learning
• Student Effort
• Academic Challenge
• Student Faculty Interaction, and
• Support for Learner
The scope of the data is enormous. Since 2008, almost 404,000 students have taken the
survey at 658 colleges in 47 states and eight locations outside the United States.
CCSSE’s 2008 Annual Report was entitled: High Expectation and High
Support. The topic for that year was defining the elements of engagement as reported by
both students and faculty during the time period of the survey. Recalling that the
hallmark of effective engagement is a collaborative process (O’Banion, 1997, 2007;
30
Tinto, 1993; Gardner, 1987), the results of the faculty survey (CCFSSE) indicated that
there are several opportunities for professional development. The survey of faculty
found that: (1) almost 31% reported spending 50-100% of their time lecturing, (2) 53%
allocate less than 10% of class time to group activities, (3) 89% report spending less
than 20% of their time on in-class writing, and (4) 50% spent no class time on
computers. Characteristics of the “Least Engaged” students were reported and some
mirror the subjects of this study. They students who reported the lowest involvement
with college were: (1) traditional age – 24 years of age and younger, (2) male, (3) of all
ethnicities (but not African-American), and (4) United States citizens. Other traits that
reported as contributing to lower levels of engagement were attending part-time,
completion of less than 30 credits, working more than 30 hours per week and those who
had not taken developmental education courses, had not taken a study skills course, and
had not attended an orientation.
Chapter Summary
Student enrollment, persistence, and completion of students’ stated goals in
higher education have been the subject of study for over 50 years. Until the 1980s the
majority of data about student behavior was based on research involving White male
students. Student perceptions of alienation, prejudice, fear, and a lack of involvement
with a college or university were evident by the end of the decade. Community colleges
enrolled the majority of minority and non-traditional students who attended post-
secondary institutions. They were serving students with an ever-increasing need for
developmental education, English proficiency skills, and little exposure to higher

31
education. Even though access improved, other levels of student achievement were
declining. Tinto’s model of social and academic integration was bolstered by Astin’s
theory of student involvement – leading to the tenet of Student Engagement. Engaging
students, to increase improved levels of achievement and learning, is now a benchmark
of effective practice. Ironically, increasing and frequent reports of skills deficits,
declining mastery of mathematics and literacy and substandard levels of academic
preparation were being made about the performance of students at the primary,
secondary, and postsecondary levels. Policy makers and educational leaders will be hard
pressed to prove that it was not ignored. Male students have experienced the largest
percentage of lowered academic achievement and educational attainment in a 30-year
period. And, minority male students are the most negatively impacted of this group.
Measured achievement in mathematics and literacy are in decline, as are completion of
academic goals and credentials. Factors such as learning style differences, coupled with
the co-requisite to adapt instruction to teach students with a range of style preferences,
appears to be recognized, but widespread implementation is lacking. Accountability and
increased standards of performance are at an unprecedented high and educational
leadership must be focused on improving student performance and completion. The
American Association of Community Colleges has made this part of the national agenda.

32
Chapter Three: Research Methodology and Design
Introduction
A descriptive quantitative study based on the existing research about minority
male achievement, and the contextual backdrop of the heightened social and economic
need to improve the educational attainment of men, both in the Arizona and the United
States, is being used to direct this study. This chapter describes the relevance of the
design and methodology to meet the defined purpose of the study and research
questions.
Purpose of the Study
The purpose of the study is to provide a profile of minority male achievement for
academic years 2008-09 and 2009-10 at PCCCD. It includes an analysis and
comparison of quantitative data available through the college department of Planning
and Institutional Research; census, economic, and educational data from Pima County
and Arizona; and that from sources such as the American Association of Community
Colleges (AACC), Achieving the Dream (AtD), the National Center for Education
Statistic (NCES), and the Center for Community College Survey of Student Engagement
(CCSSE). The overall goal of the study is to provide a descriptive quantitative
summary and analysis of the enrollment and academic achievement of male students, by
ethnicity, and all female students by ethnicity. This information is not directly available
to policy makers, institutional leaders, or the community. The results may assist the
institution and others in providing a more detailed baseline from which to evaluate

33
student performance by gender, within ethnicity, and compared to female performance
within ethnicity.
The study examined the enrollment and academic achievement of 10 student
groups, ages 18-to-24, who were new-to-higher education, enrolled in 12 credit hours or
more in the Fall 2008 (Academic Year 2008-09/AY 08-09). It tracked their progress
using a specified set of performance indicators through the Spring 2010 (Academic Year
2009-10/AY 09-10). For the purpose of the study, each group is designated as a cohort.
They are:
Cohort A Hispanic male students
Cohort A(1) Hispanic female students
Cohort B White male students
Cohort B(1) White female students
Cohort C African-American male students
Cohort C(1) African-America female students
Cohort D Native American/Alaskan Native male students
Cohort D(1) Native American/Alaskan native female students
Cohort E: Asian/Pacific Islander male students
Cohort E(1) Asian/Pacific Islander female students
The study was guided by four primary research questions that define the purpose
of the inquiry. The questions were:
Research Question 1: Beginning in the Fall 2008 semester, and each subsequent
term defined in the study, what was the enrollment for each cohort?
Part A: For each cohort, what percentage persisted in the Spring 2009
semester?
Part B: For each cohort, what percentage were enrolled in the Fall 2009
semester?

34
Part C: For each cohort, what percentage persisted in the Spring 2010
semester?
Research Question 2: What was the cumulative Grade Point Average (GPA) of
each cohort by term during the time period of the study?
Research Question 3: What are the “top ten” programs of enrollment for each
cohort during the time period of the study?
Research Question 4: What are the statistical comparisons within all male
cohorts for the following performance indicators?
a. Enrollment and participation rate
b. Persistence (semester-to semester)
c. Retention (Fall 08 to Fall 09)
d. Grade Point Average
by first semester (Fall 08)
by cumulative (Spring 10)
Quantitative Case Study Methodology
This descriptive quantitative study uses the concepts descriptive design and ex-
post-facto data to assess the academic achievement of minority male students in
Academic Years 2008-09 and 2009-10 at Pima County Community College District. In
quantitative research the goal is to determine the relationship between an independent
variable and a dependent variable within a population (Salkind, 2008). This type of
study design is used to identify patterns or trends among variables, not the cause and
effect of variables. The primary reasons this was designed as a descriptive study was:
(1) identify enrollment behavior and academic achievement of male students by
ethnicity, (2) identify enrollment behavior and academic achievement of male students
within ethnicity, (3) identify enrollment behavior and academic achievement of female

35
students within ethnicity, and compare to male students within ethnicity, and (4) identify
areas for further research.
The College and the researcher agreed on the scope of the study. The researcher
met with the Executive Vice Chancellor and Provost to determine the feasibility of the
study and request for data. The study was approved and the researcher was given access
to ex-post-facto aggregate data for students who entered in the Fall Semester of 2008.
This semester was selected because: (1) it provided recent data regarding the selected
student populations, (2) the period of the study was long enough to establish
performance indicators that may be more likely to demonstrate stability of a pattern or
trend, and (3) student data aggregated by gender within ethnicity was not available.
The first task was to identify all students, entering PCC in the Fall Semester of
2008, who were eligible to be included as cohorts for this study. Using the selection
criteria of age, gender, ethnicity, new-to-higher education and full time enrollment
status, 3,825 students, from the total enrollment of 32,605 (PCCCD, 2009) comprised
the sample. The sample was calculated from institutional data of all students who were
enrolled at the semester census date (the 45th day of the semester) and were counted in
the end-of-term data. Table 1 describes the student sample utilized in the study.

36
Table 1.
Description of Student Sample, N = 3825
Student Cohorts Ages 18-24, enrolled full time (12+ credit
hours)
Number Enrolled Fall 2008
Percent Enrolled Fall 2008
(of N=3825)
A0. Hispanic Male 690 18.04
A1. Hispanic Female 697 18.22
B0. White Male 881 23.03
B1. White Female 932 24.37
C0. African American Male 106 2.77
C1. African American Female 75 1.97
D0. Native American/Alaskan Native Male 55 1.44
D1. Native American/Ak Native Female 72 1.88
E0. Asian/Pacific Islander Male 76 1.99
E1. Asian/Pacific Islander Female 59 1.54
F0. Other/multi-racial Male
F1. Other/multi-racial Female
92
90
2.41
2.35
TOTAL 3825
During the initial data analysis and selection, it was discovered that 92 males,
self-identified as “other/multi-racial” as did 90 females. This group is included for
informational purposes only and were not included the study. Other groups excluded
were all students who met the initial selection criteria, and were not coded (n = 611) and
not reported (n=13) for ethnicity.
Dependent and independent variables. The study is on two levels in terms of
the utilization of dependent variables.

37
Level One: The dependent variables are enrollment, persistence, and retention
beginning in Fall 2008, persistence from Fall 2008 to Spring 2009, and retention from
Fall 2008 to Fall 2009. The independent variables thought to influence the dependent
variables are race/ethnicity, and/or gender.
Level Two: The dependent variable is GPA. The independent variables thought
to influence the dependent variable are race/ethnicity and gender.
The data that comprise the variables were extracted from the College student
information system (Banner™, SCT). The database is managed and maintained by the
Office of the Registrar/Enrollment Services reporting to the Executive Vice
Chancellor/Provost for Academic and Student Services.
Student data that is self-reported and used in this study included: (1) gender, (2)
race/ethnicity, and (3) selection of the program or certificate of enrollment.
Validity. Validity determines whether an instrument measures what it intends to
measure and whether it measures it accurately (Dudley, 2005). While there is no
measure that is absolutely valid, utilizing a measure with the highest validity possible is
a standard of quality (Dudley, 2005). The module on the student information system
that records grades, calculates GPA, records and calculates enrollment, credit hours
attempted, enrolled and completed, is not self-reported data. Further, the data goes
through additional validation on a yearly basis by external audit. In the 2009-10
academic year the institution re-validated all race and ethnicity data for students and
employees through a survey on the college portal system. Data regarding student
enrollment into the selected program or certificate is verified at least once a semester by

38
students’ use of the on-line registration system. Students may submit additional
corrections to other self-reported data either online or in person. Certain types of
updates to self-reported data require documentation (i.e. change of name, residency,
citizenship)
Data analysis. Data analysis was conducted using the statistical software
package SPSS. Characteristics of the participants are described using the descriptive
statistics procedures in SPSS. Frequency and summary statistics are used to describe the
variables. The appropriate tests of Pearson Chi-Square, T-test, and Oneway Analysis of
Variance (ANOVA) were applied to the data used to derive the answers to the research
questions. When appropriate, Post-Hoc Mutiple Comparisons, or the Least Squared
Difference (LSD), were developed to test for significance among cohorts.
Chapter Summary
This chapter summarizes the methodology and research design that was used in
research. A quantitative descriptive study was selected as the appropriate method
because the goal of the research is to identify trends or patterns that may exist in the
academic achievement of minority male students. It does not seek to establish a causal
relationship between any variables.

39
Chapter Four: Results
Introduction
The sample size, or total number (N), for the study was comprised of 3,825
students. This number represents 11.73% of the total enrollment at PCC in the 2008 Fall
semester. Students were new-to-higher education, age range 18-to-24, and enrolled full-
time. One thousand nine hundred or 49.67% were male, and 1925 or 50.33% were
female. Figure 4 illustrates the demographic enrollment. Data were analyzed using the
Pearson Chi-Square for enrollment patterns, the T-test for analysis of GPA as well as the
Oneway Analysis of Variance (ANOVA) to test for any significance of differences in
GPA within the male cohorts.
Figure 4. Research Question One: Enrollment of each Cohort, Fall 2008
881 932
690 697
106 75 91 90 76 59 55 72
0
200
400
600
800
1000
Male Female
White Hispanic
African-‐American Other/MulL-‐Racial
Asian/Pacific Islander NaLve American/Alaskan NaLve

40
Research Questions and Analysis
Research Question 1. Beginning in the Fall 2008 semester, and each subsequent
term defined in the study, what was the enrollment for each cohort?
Part A: For each cohort, what percentage persisted in the Spring 2009 semester?
Part B: For each cohort, what percentage were enrolled in the Fall 2009
semester?
Part C: For each cohort, what percentage persisted in the Spring 2010 semester?
The enrollment for each student cohort in the Fall 2008 Semester was calculated and is
shown in Figure 4 above.
Part A: Persistence Fall 2008 to Spring 2009. Part A calculated the number and
percentage of each student cohort that began in Fall 2008 and continued enrollment in
the Spring 2009 semester. The total size of the sample decreased from 3825 to 2357,
and represented a loss of 1468 students or -38.4%. Persistence for the entire sample was
61.6%. The persistence rate by gender was differentiated by 1%, as shown in Table 2.
Table 2.
Enrollment Pattern for Spring 2009 by Gender
Gender Group
Enrolled Fall 2008 (Original
Cohort)
Number Not Enrolled
Spring 2009
Number Enrolled
Spring 2009
Percentage Not Enrolled
Spring 2009
Percentage Enrolled
Spring 2009
Female 1925 738 1187 38.3 61.7 Male 1900 730 1170 38.4 61.6 Total 3825 1468 2357 38.4 61.6 Pearson Chi-Square χ2 = .03, df=1, p= .958
Male students declined by 730 students or –38.4% for a persistence rate of 61.6% or
1170 enrolled.

41
Table 3 is a cross tabulation of the persistence enrollment patterns for male
cohort for the Spring 2009 semester. The instances of significance will be addressed in
Research Question 4. Of particular note is that enrollment decreased for every male
cohort by a range of 32.9% for Asian males to 47.3% for Native American males.
Table 3.
Persistence Enrollment Pattern for Spring 2009 for Male Cohorts
Male Cohort Group
Enrolled Fall 2008 (Original
Cohort)
Number Not Enrolled
Spring 2009
Number Enrolled
Spring 2009
Percentage Not Enrolled
Spring 2009
Percentage Enrolled
Spring 2009
Hispanic 690 239 451 34.6 65.4 White 881 368 513 41.8 58.2 African American 106 37 69 34.9 65.1 Native American 55 26 29 47.3 52.7 Asian 76 25 51 32.9 67.1 Total 1808 695 1113 38.4 61.6 Pearson Chi-Square χ2 = 11.706, df=4, p= .020
Female students declined by 738 students or -38.3%, for a persistence rate of
61.7% or 1187 enrolled. The persistence rate for each female cohort was: (1) Hispanic
females – 70%; (2) White females – 55%; (3) African American females - 54.7%; (4)
Native American/Alaskan Native females at 61.1%; (5) Asian American females –
76.3%. Overall the Asian American/Pacific Islander students had the highest rate of
persistence with an average of 71.1% enrolled in the Spring 2009 semester and White
students persisted in the next semester at the lowest rate of 56.6%.
Part B: Retention: Fall 2008 to Fall 2009. Retention was defined as the number of
students whose first term of enrollment was the Fall 2008 semester and who were
subsequently enrolled in the Fall 2009. From a starting sample size of N=3825, 1774
students remained enrolled in the Fall 2009 semester. This represents a loss of 2051

42
students (53.6%) from the beginning term of the study. Male students decreased by a
total of 54.4% (-1034) from Fall 2008 to 866 (45.6%). Female students declined by
1017 (-52.8%) to 908 students enrolled in the Fall 2009. Table 4 demonstrates
retention by gender.
Table 4.
Retention Enrollment Pattern for Fall 2009 by Gender
Gender Group
Enrolled Fall 2008 (Original
Cohort)
Number Not Enrolled Fall 2009
Number Enrolled Fall 2009
Percentage Not Enrolled
Fall 2009
Percentage Enrolled Fall 2009
Female 1925 1017 908 52.8 47.2 Male 1900 1034 866 54.4 45.6 Total 3825 2051 1774 53.6 46.4 Pearson Chi-Square χ2 = .972, df=1, p= .324
Female students were retained at 47.2%, representing a 52.8% decline from Fall
2008. In rank order from lowest to highest percentage of female students by ethnicity
remaining enrolled are: (5) African American – 38.7% (n=29); (4) White – 43.0%
(n=401); (3) Asian/Pacific Islander – 45.8% (n=27); (2) Native American – 51.4%
(n=37) and (1) Hispanic – 53.8% (n=375).
Part C: Persistence Fall 2008 to Spring 2010. Persistence by gender is
illustrated in Table 5. Both male and female groups continued to decline in numbers
from the Fall 2008.

43
Table 5.
Persistence Enrollment Pattern for Spring 2010 by Gender
Gender Group
Enrolled Fall 2008 (Original
Cohort)
Number Not Enrolled
Spring 2010
Number Enrolled
Spring 2010
Percentage Not Enrolled
Spring 2010
Percentage Enrolled
Spring 2010
Female 1925 1085 840 56.4 43.6 Male 1900 1145 755 60.3 39.7 Total 3825 2230 1595 58.3 41.7 Pearson Chi-Square χ2 = 5.981, df=1, p= .014
Both student groups continued to decline in numbers. From Fall 2008 to Spring 2010,
56.4% of females did not persist. From Fall 2008 to Spring 2010, 60.3% of males failed
to persist. This semester represents the first significant difference in enrollment by
gender (p = .014).
Male students experienced continuing significant declines in all groups.
Table 6 illustrates these decreases by ethnicity. Hispanic male students had the highest
rate of persistence to the Spring 2010 semester with a rate of 42.8%. The lowest rate of
persistence was exhibited by Native American males with a rate of 23.6% from Fall
2008 to Spring 2010. There was significance among the cohorts with a p value of .058.

44
Table 6.
Persistence Enrollment Pattern for Spring 2010 for Male Cohorts
Male Cohort Group
Enrolled Fall 2008 (Original
Cohort)
Number Not Enrolled
Spring 2010
Number Enrolled
Spring 2010
Percentage Not Enrolled
Spring 2010
Percentage Enrolled
Spring 2010
Hispanic 690 395 295 57.2 42.8 White 881 537 344 61.0 39.0 African American 106 67 39 63.2 36.8 Native American 55 42 13 76.4 23.6 Asian 76 45 31 59.2 40.8 Total 1808 1086 722 60.1 39.9 Pearson Chi-Square χ2 = 9.126, df=4, p= .058
The Spring 2010 semester demonstrated the same continued decline for all
female groups. Hispanic female enrollment concluded with 340 students, from
beginning enrollment of 697 in Fall 2008 semester, representing a 48.8% persistence
rate. White females had the second lowest persistence rate with 39.8% with 371
students remaining from a beginning n of 932. African American females had the
lowest persistence rate of 34.7% which translates into 26 students, from 75. Native
American females began with 72 students and ended with 33, reflecting persistence of
45.8%. Asian American females had the highest final persistence of 54.2% and 32
enrolled from a total of 59.
Research Question 2. What was the cumulative Grade Point Average (GPA) of
each cohort by term during the time-period of the study?
This question addresses the academic success of each cohort through the
performance measure of GPA. The data is presented for each ethnic group by gender.
The T-test was applied to compute standard deviation and standard error of the mean in

45
the average GPA calculated for male and female students. Overall, female students
achieved a higher GPA in every term than male students. For all groups, irrespective of
gender or ethnicity, the Fall 2008 semester produced the lowest GPA of any term. Each
successive term resulted in a higher GPA for all students that persisted through the
Spring 2010 semester.
Hispanic students. Tables 7, 8, 9, and 10 illustrate GPA by term for male and
female students in this group. Significance by gender was found for every term of the
study.
Table 7.
Average Grade Point Average (GPA) by Gender for Fall 2008 for Hispanic Students
Number Average GPA
Fall 2008 Standard Deviation
Standard Error of the Mean
Male 690 1.924 1.33 .05 Female 697 2.217 1.26 .04 t = -4.200, df = 1379.703, p = .000
Table 8.
Average Grade Point Average (GPA) by Gender for Spring 2009 for Hispanic Students
Number Average GPA
Fall 2008 Standard Deviation
Standard Error of the Mean
Male 451 2.163 1.06 .05 Female 488 2.408 .94 .04 t = -3.717, df = 901.728, p = .000

46
Table 9.
Average Grade Point Average (GPA) by Gender for Fall 2009 for Hispanic Students
Number Average GPA
Fall 2008 Standard Deviation
Standard Error of the Mean
Male 338 2.312 .89 .04 Female 375 2.573 .77 .04 t = -4.145, df = 671.300, p = .000
Table 10.
Average Grade Point Average (GPA) by Gender for Spring 2010 for Hispanic Students
Number Average GPA
Fall 2008 Standard Deviation
Standard Error of the Mean
Male 295 2.418 .77 .04 Female 340 2.569 .71 .03 t = -2.557, df = 633, p = .011
White students. Tables 11, 12, 13, and 14 illustrate the four semester GPA data.
Significance by gender was found for every term of enrollment for White students.
Table 11.
Average Grade Point Average (GPA) by Gender for Fall 2008 for White Students
Number Average GPA
Fall 2008 Standard Deviation
Standard Error of the Mean
Male 881 2.078 1.38 .04 Female 932 2.407 1.30 .04 t = -5.185, df = 1787.965, p = .000

47
Table 12.
Average Grade Point Average (GPA) by Gender for Spring 2009 for White Students
Number Average GPA
Fall 2008 Standard Deviation
Standard Error
of the Mean Male 513 2.454 .99 .04 Female 513 2.651 .99 .04 t = -3.168, df = 1024, p = .002
Table 13.
Average Grade Point Average (GPA) by Gender for Fall 2009 for White Students
Number Average GPA
Fall 2008 Standard Deviation
Standard Error
of the Mean Male 385 2.478 .88 .04 Female 401 2.692 .89 .04 t = -3.353, df = 784, p = .001
Table 14.
Average Grade Point Average (GPA) by Gender for Spring 2010 for White Students
Number Average GPA
Fall 2008 Standard Deviation
Standard Error
of the Mean Male 344 2.470 .88 .04 Female 371 2.737 .81 .04 t = -4.197, df = 713, p = .000
African American students. Tables 15, 16, 17, and 18 illustrate the GPA data for
this student group. The data for this student group is notable due to the much smaller N
for each gender, and in comparison to Hispanic and White students. Statistical

48
significance in GPA is not demonstrated by gender for the first three terms, but is
present in the fourth term. The lack of statistical significance is a function of the small
N by gender. However, the GPA for males students did not continue to increase in the
Spring 2010 semester. Despite the small number of students, statistical significance
returned in the last term, due to the larger achievement gap in GPA by gender.
Table 15.
Average Grade Point Average (GPA) by Gender for Fall 2008 for African American Students
Number Average GPA
Fall 2008 Standard Deviation
Standard Error of the Mean
Male 106 1.745 1.34 .13 Female 75 1.870 1.42 .16 t = -.604, df = 179, p = .547 (NS)
Table 16.
Average Grade Point Average (GPA) by Gender for Spring 2009 for African American Students
Number Average GPA
Fall 2008 Standard Deviation
Standard Error of the Mean
Male 69 2.039 .97 .11 Female 41 2.296 1.11 .17 t = -1.265, df = 108, p = .209 (NS)
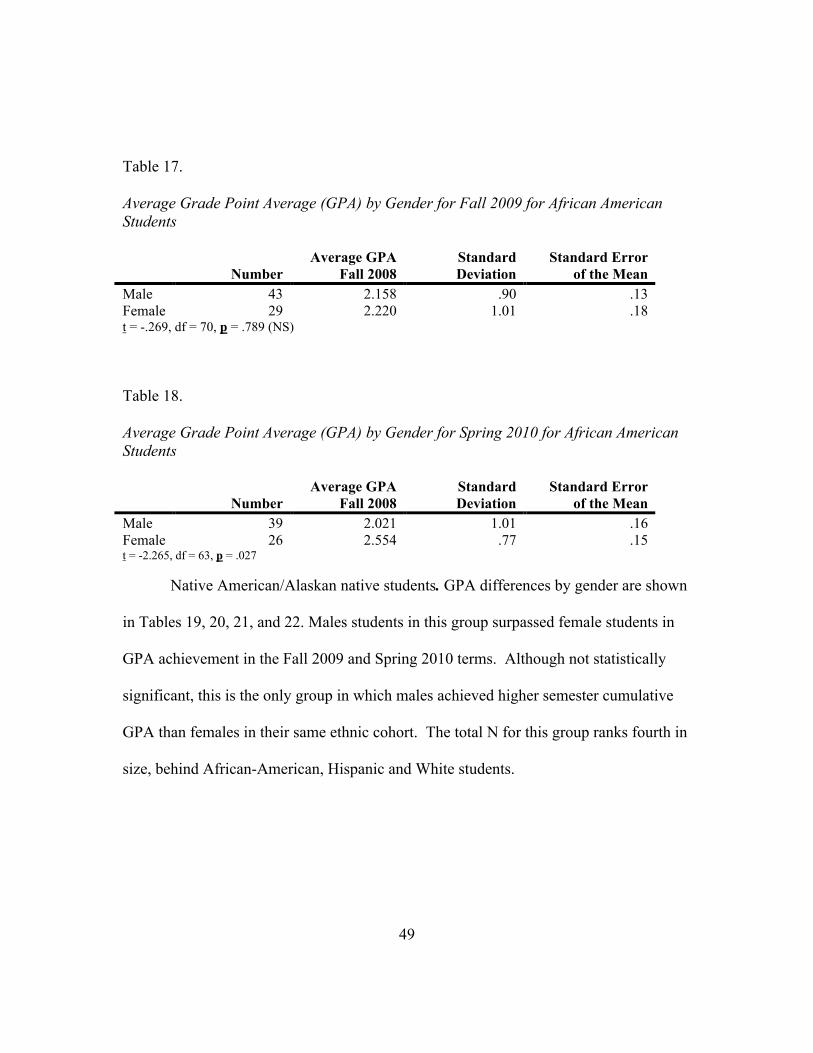
49
Table 17.
Average Grade Point Average (GPA) by Gender for Fall 2009 for African American Students
Number Average GPA
Fall 2008 Standard Deviation
Standard Error of the Mean
Male 43 2.158 .90 .13 Female 29 2.220 1.01 .18 t = -.269, df = 70, p = .789 (NS)
Table 18.
Average Grade Point Average (GPA) by Gender for Spring 2010 for African American Students
Number Average GPA
Fall 2008 Standard Deviation
Standard Error of the Mean
Male 39 2.021 1.01 .16 Female 26 2.554 .77 .15 t = -2.265, df = 63, p = .027
Native American/Alaskan native students. GPA differences by gender are shown
in Tables 19, 20, 21, and 22. Males students in this group surpassed female students in
GPA achievement in the Fall 2009 and Spring 2010 terms. Although not statistically
significant, this is the only group in which males achieved higher semester cumulative
GPA than females in their same ethnic cohort. The total N for this group ranks fourth in
size, behind African-American, Hispanic and White students.

50
Table 19.
Average Grade Point Average (GPA) by Gender for Fall 2008 for Native American Students
Number Average GPA
Fall 2008 Standard Deviation
Standard Error of the Mean
Male 55 1.745 1.30 .17 Female 72 2.200 1.28 .15 t = -1.966, df = 125, p = ..051 (NS)
Table 20.
Average Grade Point Average (GPA) by Gender for Spring 2009 for Native American Students
Number Average GPA
Fall 2008 Standard Deviation
Standard Error of the Mean
Male 29 2.140 .89 .16 Female 44 2.506 .88 .13 t = -1.729, df = 71, p = .088
Table 21.
Average Grade Point Average (GPA) by Gender for Fall 2009 for Native American Students
Number Average GPA
Fall 2008 Standard Deviation
Standard Error of the Mean
Male 21 2.406 .71 .15 Female 37 2.374 1.00 .16 t = .126, df = 56, p = .900

51
Table 22.
Average Grade Point Average (GPA) by Gender for Spring 2010 for Native American Students
Number Average GPA
Fall 2008 Standard Deviation
Standard Error of the Mean
Male 13 2.657 .39 .11 Female 33 2.510 .81 .14 t = .619, df = 44, p = .539
Asian American/Pacific Islander students. Students in this group demonstrated
the highest GPA in every term beginning in the Fall 2008 semester. Asian females were
the only group to achieve a semester GPA of 3.00 or higher. However, this was only
achieved for Spring 2009 term. Female GPA decreased in each consecutive term. Male
GPAs continued to improve through each successive term.
Table 23.
Average Grade Point Average (GPA) by Gender for Fall 2008 for Asian Students
Number Average GPA
Fall 2008 Standard Deviation
Standard Error of the Mean
Male 76 2.244 1.49 .17 Female 59 2.608 1.43 .18 t = -1.425, df = 133, p = .157 (NS)

52
Table 24.
Average Grade Point Average (GPA) by Gender for Spring 2009 for Asian Students
Number Average GPA
Fall 2008 Standard Deviation
Standard Error of the Mean
Male 51 2.548 1.14 .15 Female 45 3.022 .90 .13 t = -2.230, df = 94, p = ..028
Table 25.
Average Grade Point Average (GPA) by Gender for Fall 2009 for Asian Students
Number Average GPA
Fall 2008 Standard Deviation
Standard Error of the Mean
Male 39 2.647 .91 .14 Female 27 2.955 .91 .17 t = -1.341, df = 64, p = .185 (NS)
Table 26.
Average Grade Point Average (GPA) by Gender for Spring 2010 for Asian Students
Number Average GPA
Fall 2008 Standard Deviation
Standard Error of the Mean
Male 31 2.672 .92 .16 Female 32 2.889 .82 .14 t = -.984, df = 61, p = .330 (NS)
Research Question 3. What are the “top ten” programs of enrollment for each
cohort during the time period of the study?
This question was intended to elicit the most “popular” degree or certificate
programs of choice, as determined by the number of students selecting available
programs. The data demonstrates, by number and rank order, the majority of students,

53
both by gender and ethnicity who have selected Liberal Arts or General Studies as their
number one or two choice. The third most popular selection was Business
Administration, which is a transfer degree, “Courses for Transfer” was fourth, followed
by the Associate of Science, and the Associate of Arts in Education as sixth.
Gender differences existed within ethnicity. Hispanic and White females
demonstrated the greatest range of choices among females. White males exhibited the
greatest range of choices among males. Of note in all cohorts, is that “General Studies”
is often selected by students who are undecided but need a program that is eligible for
federal financial aid. Table 27 illustrates the top ranked programs.
54
Table 27.
Top Ranked Programs Selected In First Term Enrolled – Rank and (Number Selecting)
Program Code
Selected Fall 2008
Female African
American Female Asian
Female Hispanic
Female Native
American Female White
Male African
American Male Asian
Male Hispanic
Male Native
American Male White
Liberal Arts (Agec-A) AA
1 (24) 1 (24) 2 (214) 1 (26) 1 (263) 1 (33) 1 (19) 2 (166) 1 (18) 1 (238)
General Studies AGS
2 (20) 2 (14) 1 (221) 2 (23) 2 (261) 2 (30) 2 (18) 1 (207) 2 (12) 2 (179)
Courses For Transfer
3 (9) 5 (24) 3 (107) 4 (4) 3 (8) 3 (91)
Business Admin (ABUS) AB
4 (6) 3 (3) 3 (38) 4 (39) 3 (11) 4 (7) 3 (65) 4 (89)
Business Basic-Cert 9 (8) 5 (4) 6 (26)
Associate Of Science (AGEC-S) AS
4 (33) 6 (28) 5 (13) 5 (30)
(No Program) Courses for Personal Interest
8 (13)
Practical Nursing Certificate
6 (16) 8 (18)

55
Education AA 7 (14) 5 (37) 3 (3)
Veterinary Technician AAS
7 (19)
Forensic /Crime Scene Tech-Cert
10 (7) 3 (4)
Culinary Arts AAS 9 (10)
Admin Of Justice Studies AAS
4 (14)
Liberal Art AGEC-A) Certificate
Computer Systems Admin-AAS
7 (13)
Engineering AS
NOTE: Only Programs Selected by 3 or more cohort members are noted for each cohort group.

56
Research Question 4. What are the statistical comparisons within all male
cohorts for the following performance indicators?
a. Enrollment and participation rate
b. Persistence (semester-to semester)
c. Retention (Fall 08 to Fall 09)
d. Grade Point Average
by first semester (Fall 08)
by cumulative (Spring 10)
Enrollment and participation rate. The enrollment and participation rates for all
male cohorts for the length of the study are illustrated in Tables 28, 29, and 30 below.
Table 28
Cross-tabulation: Enrollment Pattern for Spring 2009 for Male Cohorts
Male Cohort Group
Enrolled Fall 2008 (Original
Cohort)
Number Not Enrolled
Spring 2009
Number Enrolled
Spring 2009
Percentage Not Enrolled
Spring 2009
Percentage Enrolled
Spring 2009
Hispanic 690 239 451 34.6 65.4 White 881 368 513 41.8 58.2 African American 106 37 69 34.9 65.1 Native American 55 26 29 47.3 52.7 Asian 76 25 51 32.9 67.1 Total 1808 695 1113 38.4 61.6 Pearson Chi-Square χ2 = 11.706, df=4, p= .020

57
Table 29
Cross-tabulation: Enrollment Pattern for Fall 2009 for Male Cohorts
Male Cohort Group
Enrolled Fall 2008 (Original
Cohort)
Number Not Enrolled
Spring 2009
Number Enrolled
Spring 2009
Percentage Not Enrolled
Spring 2009
Percentage Enrolled
Spring 2009
Hispanic 690 352 338 51.0 49.0 White 881 496 385 56.3 43.7 African American 106 63 43 59.4 40.6 Native American 55 34 21 61.8 38.2 Asian 76 37 39 48.7 51.3 Total 1808 982 826 54.3 45.7 Pearson Chi-Square χ2 = 9.126, df=4, p= .058
Table 30
Cross-tabulation Enrollment Pattern for Spring 2010 for Male Cohorts
Male Cohort Group
Enrolled Fall 2008 (Original
Cohort)
Number Not Enrolled
Spring 2010
Number Enrolled
Spring 2010
Percentage Not Enrolled
Spring 2010
Percentage Enrolled
Spring 2010
Hispanic 690 395 295 57.2 42.8 White 881 537 344 61.0 39.0 African American 106 67 39 63.2 36.8 Native American 55 42 13 76.4 23.6 Asian 76 45 31 59.2 40.8 Total 1808 1086 722 60.1 39.9 Pearson Chi-Square χ2 = 9.126, df=4, p= .058
The data reveal that the Fall 2008 to Spring 2009 semester enrollment pattern
exhibited significance in enrollment behavior among male cohorts. All groups
experienced enrollment declines ranging from 47.3% loss for Native American males, to
a 32.9% loss in Asian male enrollment. The significance is derived from the amount of
variation among groups. Table 27 also shows that, after Native American students, the

58
biggest declines in rank order were in White, African American, Hispanic, and Asian
male students. The Fall 2009 and Spring 2010 semesters represent continuing decline in
male enrollments in all cohorts. The total loss of students from Fall 2008 to Spring 2010
was 1086 students and is a 60.1% decline.
Persistence. Persistence rates for each male cohort was calculated based on
continuing enrollment from the Fall 2008 semester through the Spring 2010 semester.
From Fall 2008 to Spring 2009, Asian students persisted at the highest percentage
(although a much smaller N, than any other group). In rank order of persistence were:
Hispanic males (2); African American males (3); White males (4); and Native American
males (5). Persistence rates from Fall 2009 to Spring 2010 changed the rank order
(highest to lowest) to: Hispanic males (1), Asian males (2), White males (3), African
American males (4), and Native American males (5).
Retention from Fall 2008 to Fall 2009. Representing the number of students
who were enrolled in a Fall-to-Fall pattern, the decline from a beginning size of 1808
students to 826 students represented a loss of 982 or 54.3%.
In summary, the male cohort began with 1808 students and ended with 722
students, which is a total decline of 60%. In rank order from largest decline to smallest
decline were: (1) Native American males at -76.4%; (2) African American males at -
63.2%; (3) White males at -61%; (4) Asian males at -59.2% and Hispanic males at -
57.5%.
Grade Point Average (GPA). As an indicator of academic success, GPA was
selected as a data point and measure of comparison among groups. A Oneway

59
Analysis of Variance (ANOVA) was constructed for each semester among the male
cohorts. Average GPA was calculated for each group as well as the Standard
Deviation among groups. Significance was found for all semesters.
The Fall 2008 semester resulted in the lowest average GPA achieved for each
group. Table 31 describes this outcome. Only two groups, Asian males (2.244) and
White males, achieved an average GPA over 2.00.
Table 31
Oneway Analysis of Variance (ANOVA): Average Grade Point Average (GPA) for Fall 2008 for Male Cohorts
Male Cohort Group Number in Cohort
Average GPA Fall 2008 Standard Deviation Hispanic 690 1.924 1.33 White 881 2.078 1.38 African American 106 1.745 1.34 Native American 55 1.745 1.30 Asian 76 2.244 1.49 Total 1808 1.996 1.36 F (4,1803) =3.254, p = .011
Each following semester demonstrates an increasing GPA for all male groups.
Rank order of achievement varies by term for each group, except for African American
males who consistently achieved the lowest GPA for all semesters and Asian males who
consistently achieved the highest GPA for all semesters.
Tables 32, 33, and 34 complete the data sets for each semester. There is
significance in GPA among male cohorts in each term of the study.

60
Table 32
Oneway Analysis of Variance (ANOVA): Average Grade Point Average (GPA) for Spring 2009 for Male Cohorts
Male Cohort Group Number in Cohort
Average GPA Spring 2009 Standard Deviation
Hispanic 451 2.163 1.06 White 513 2.454 .99 African American 69 2.039 .97 Native American 29 2.140 .89 Asian 51 2.548 1.14 Total 1113 2.306 1.03 F (4,1108) = 6.940, p = .000
Table 33
Oneway Analysis of Variance (ANOVA): Average Grade Point Average (GPA) for Fall 2009 for Male Cohorts Male Cohort Group Number in Cohort Average GPA Fall 2009 Standard Deviation
Hispanic 338 2.312 .89 White 385 2.478 .88 African American 43 2.158 .90 Native American 21 2.406 .71 Asian 39 2.647 .91 Total 826 2.399 .89 F (4,821) = 3.127, p = .014

61
Table 34
Oneway Analysis of Variance (ANOVA): Average Grade Point Average (GPA) for Spring 2010 for Male Cohorts Male Cohort Group Number in Cohort Average GPA Spring 2010 Standard Deviation
Hispanic 295 2.418 .77 White 344 2.470 .88 African American 39 2.021 1.01 Native American 13 2.657 .39 Asian 31 2.672 .92 Total 722 2.436 .84 F (4,717) = 3.365, p = .010
Overall improvement of GPA for each group, from the Fall 2008 to the Spring 2010
semester, is presented in rank order of highest to lowest gains over the period of study:
(1) Native American males, GPA Fall 2008 at 1.745 and GPA Spring 2010 at 2.657
(2) Hispanic males, GPA Fall 2008 at 1.924 and GPA Spring 2010 at 2.418
(3) Asian males, GPA Fall 2008 at 2.244 and GPA Spring 2010 at 2.647
(4) White males, GPA Fall 2008 at 2.078 and GPA Spring 2010 at 2.470
(5) African American males, GPA Fall 2008 at 1.745 and GPA Spring 2010 at 2.021
Chapter Summary
This chapter described the results of the study to identify academic achievement
of minority males, White males, minority females, and White females from Fall 2008 to
Spring 2010. 1808 males and 1835 females students were stratified in 10 cohort groups
based on ethnicity. All students were in the 18-to-24 age group and were enrolled full
time in the Fall 2008 semester. Comparisons were made within ethnicity by gender for

62
enrollment, persistence, retention and GPA. The same comparisons were made by
gender. Analyses of the data demonstrated significant differences by gender, ethnicity
and by gender within ethnicity.

63
Chapter Five: Discussion and Recommendations
Introduction
Chapter One provided an introduction and the contextual backdrop to outline the
local and national concern regarding the academic achievement and educational
attainment gaps among citizens age 18-to-24 and 25-to-34 in the completion of
postsecondary education through the baccalaureate degree. Of growing unease is the
knowledge that males, especially minority males, remain increasingly unprepared with
the literacy, numeracy, and critical thinking skills required for college and workforce
demands. This is seen as a growing crisis in Arizona and throughout the United States.
Chapter Two was a review of current literature that focused on the 50 years of research
to improve student persistence and retention in higher education. It focused on efforts to
improve minority student achievement and access and the growing knowledge of gender
and cultural differences in learning styles. Finally, it describes the slow and incremental
efforts in institutional and national accountability for student achievement. Chapter
Three described the research methodology to study minority male achievement at
PCCCD from 2008 to 2010. Chapter Four presented the data from the research and
analyses. In this chapter, the results are discussed along with recommendations for
immediate application and for future study.
The purpose of the research was to profile minority male achievement for
academic years 2008-09 and 2009-10 at PCCCD. It was a descriptive quantitative
analysis of academic achievement by this group with specific performance indicators of

64
enrollment, persistence, retention, choice of academic program, and grade point average
over four semesters. The groups selected for the study were male and female students,
age 18-to-24, new-to-higher education, enrolled full time, and stratified into five groups
by ethnicity and gender for a total of 10 cohorts. The sample size was 3,825 students
and was approximately 50% male and 50% female. The significance of the study was to
provide a detailed analysis of student achievement by gender within ethnicity, rather
than by gender or ethnicity.
The results of the research demonstrated the following trends, for the 2-year
period of time that was studied.
Enrollment Loss and Enrollment Gap
• Both male and female groups experienced a 40% loss in enrollment from the Fall
2008 to Spring 2009 semester, representing the total departure of 1468 full time
students.
• Through the Fall of 2009, both groups continued to decline with an additional
14% loss in enrollment.
• By the Spring of 2010, females were still enrolled at a 4% higher rate than male
students, but the overall decline was 56.4% for females and 60% for males.
• By the end of the Spring 2010 semester the total enrollment lost for both groups
was 58.3%, or a total departure of 2230 full time students.

65
Enrollment by Ethnicity and Gender
• There were no significant differences by gender for White students.
• Hispanic females persisted at a 6% higher rate than Hispanic males.
• Hispanic males persisted at a higher rate than any other group of males by the
end of the study.
• There were no significant differences by gender for African American students.
• Native American females persisted at 22% higher rate than Native American
males.
• Native American males had the lowest rate of persistence.
• Asian females persisted at a 14% higher rate than Asian males.
Choice of Academic Programs
• For all students, the Liberal Arts, Associate of Arts and the General Studies
degree were the top two choices.
• The frequency of the choice of the General Studies degree may indicate a high
number of undecided students that would benefit from focused goal
identification and career planning.
• These degree choices are not consistent with the projected workforce demands
for higher skills in math, science, and technology.
Grade Point Average
• The Fall 2008 semester resulted in the lowest GPA for all student groups.
• Females had a significantly higher grade point average than males for every

66
semester.
• Asian females had the highest GPA for every semester among female students.
• Asian males had the highest GPA for every semester among males.
• White males had the second highest GPA, followed by Hispanic male students.
• Native American males demonstrated the greatest improvement in GPA over the
four semesters.
• African American students had the lowest GPAs for each semester, although
both males and females demonstrated improvement.
Recommendations for Application to Current Practice
Pima Community College students have access to a wide array of services that
include: newly renovated Student Service Centers at every campus based on a model of
teaching and learning; academic support services such as free tutoring and open access
to academic computing commons; online availability of all student processes from
admission through graduation; student success curriculum and targeted programs for
Hispanic males, single parents, first generation students, students with disabilities and
veterans. Despite these efforts, many of which are aimed at the students who were the
subject of this study, there remains much work to be done to improve educational
success and attainment of students age 18-to-24. Other areas of disconnect that were
found can be seen in the data about the Top Ten Academic Programs of selection for
these groups. The Associate of General Studies (AGS) degree is often the choice of
students who are undecided about their program or major. Students may well benefit
from focused goal development and targeted career planning services. Data from this

67
question also demonstrates that the number one choice of all groups is the Associate of
Liberal Arts. This is in direct contrast to the identified areas of growing workforce
demand in Pima County and Southern Arizona, which will be in technology and science
based economies. The recommendations to impact immediate practices are below:
• The College should implement efforts to increase student engagement.
• The 40% loss of enrollment, by the end of the first semester in this age group,
strongly suggests that the use of an instrument such as the Survey of Entering
Student Engagement (SENSE) would be of great value.
• The continued decline of enrollment, persistence, and retention by gender and
ethnicity strongly suggests that the use of an instrument such as Community
College Survey of Student Engagement (CCSSE) would enhance institutional
knowledge of (1) active and collaborative learning, (2) student effort, (3)
academic challenge, (4) student faculty interaction, and (5) support for the
learner.
Recommendations for Further Study
Community colleges would greatly benefit from further study of instructional
effectiveness. Recommendations are:
1. Design and implement a analysis of courses, by discipline and instructional
methodology, to determine success and failure rates.
2. Design and implement a study of preferred student learning styles and the
implications for changes in instructional methodology.
3. Design and implement a survey to be implemented with students who have left a

68
college to determine reasons for leaving.
Final Conclusion
This research presents an analysis of minority male academic achievement at
Pima County Community College District. It is the first presentation of data about
specific rates of persistence, retention and GPA by gender within ethnicity. The data
demonstrate that African American, Native American, and Asian American students are
participating at the lowest rates. Although partially driven by the population base, the
African American and Native American students appear to be the most academically at
risk. Hispanic and White students exchange rankings by semester for persistence,
retention, and GPA. Hispanic male GPA lags behind the GPA of Hispanic females,
White females, and White males.
What is particularly disturbing is the 60% loss of enrollment in both male and
female, new-to-higher education, full time students from the first semester of attendance.
Educational attainment and goals for completion will not be achieved with students
exiting the College these rates. In the two years covered in this study, male students,
enrolled full time, left the college after the mid-point of the semester at egregious rates.
By the completion of the Spring 2010 semester, the remaining numbers of male students
were:
1. Hispanic –295 of 610 (-57.2%)
2. White – 344 of 881 (-61%)
3. African American – 39 of 105 (-63.2%)
4. Native American – 13 of 55 (-76.4%)

69
5. Asian – 45 of 76 (-59.2%).
Tallies for female students, although they persisted at higher numbers as a group, were
not positive overall. They were:
1. Hispanic – 340 of 697 (-51.2%)
2. White – 371 of 932 (-70.2%)
3. African-American – 26 of 75 (-65.33%)
4. Native American – 33 of 72 (-54.17%)
This represents an enormous loss of effort and resources by students, faculty, and staff
as well that as of local, state, and federal funds.
In 2009, PCCCD became part of the original group of community colleges
participating in the Voluntary Framework of Accountability Initiative (VFA) in
partnership with AACC and ACCT. As a result of this commitment, the College has
completed additional analyses of instructional effectiveness and has discovered that ten
years of the delivery of developmental education has produced failing results for almost
all students in these classes. While students may pass these courses with grades of “C”
or better, less than 6% go on to successfully complete college level courses. At an
annual cost of $23 million to deliver these courses, there is no “lipstick” that can
disguise negative success rate of porcine proportion. This is paired with the recent
release of data from Planning and Institutional Research that online instruction has poor
academic success rates for the majority of student enrolled in these courses.
Roueche and Roueche (1999) spoke to the importance of knowing the student
when they stated, “As the French observe, ‘You cannot teach French to Johnny until first

70
you know Johnny’” (p. 18). While we are gaining understanding of what does not work,
we do not know Johnny. The time has come to know Johnny, Silvia, Constance,
Reynaldo, and Ahmad.

71
Appendix A

72
References
American Association of Community Colleges (2010). Voluntary framework of
accountability. Washington, DC: Retrieved from
http://www.nche.edu/Resources/aaccprograms/vfa/Pages/default.aspx
Asch, K. (1999, August 4). Girls overtake boys in school performance. The Washington
Times, p. 1. Retrieved October 22, 2010 from http://www.questia.com
Astin, A. (1984, July). Student involvement: A developmental theory for higher
education. Journal of College Student Personnel, pp. 297-338.
Attinasi, L. (1989). Getting in: Mexican-Americans’ perceptions of university
attendance and the implications for freshman year experience. Journal of Higher
Education, 60(3), 247-277.
Aud, S., Fox, M.A. & KewalRamani, A. (2010). Status and trends in the education of
racial and ethnic groups. National Center for Education Statistics. Washington,
DC: Department of Education.
Barton, P.E. & Coley, Richard J. (2010). The Black-white achievement gap: When
progress stopped. Princeton, NJ: Educational Testing Service.
Bolton, S. (2010). United States of America v. State of Arizona, and Janice K. Brewer,
governor of the State of Arizona, in her official capacity. United States District
Court for the District of Arizona. Case 2:10-cv-01413-SRB. Document 87. July
28, 2010. Phoenix, AZ.
Cabrera, A.F., Nora, A., Crissman, J. L. & Terenzini, P.T. (2002). Collaborative
learning: It’s impact on college students’ development and diversity. Journal of
College Student Development. 43 (1), p. 20+. Retrieved on October 22, 2010
from http://www.questia.com

73
Cabrera, A.F. & Nora, A. (1994). College student perceptions of prejudice and
discrimination and their feelings of alienation. Review of Education, Pedagogy
and Cultural Studies. 16. 387-409.
CARE. (2008). Asian Americans and Pacific Islanders – facts not fiction: Setting the
record straight. New York: National Commission on Asian American and
Pacific Islander Research in Education, The College Board and New York
University.
Columbia Broadcasting Station (2010). Obama vows sweeping education overhaul. CBS
News Interactive: Education in America. March 13, 2010. New York, NY.
Community College Survey of Student Engagement (CCSSE). (2008). High
expectations and high support. Austin, TX: The University of Texas at Austin,
Community College Leadership Program.
Cook, G. (2006, April). Boys at risk: The gender achievement gap. American School
Board Journal, (pp. 4-6). Alexandria, VA: National School Boards Association.
Dudley, J. (2005). Research methods. Boston: Pearson Foundation.
Flores, R. & Miles, S. (2009). America’s future: Bright or bleak. Presentation at the
National Conference on Race and Ethnicity, June 2009. San Diego, California.
Greene, T.G., Marti, C.N. & McClenney, K. (2008). The Effort-outcome gap:
Differences for African-American and Hispanic community college students in
student engagement and academic achievement. Journal of Higher Education,
79(5), 513.
Gurion, M. & Stevens, K. (1995). The minds of boys: Saving our sons from falling
behind in school and life. San Francisco: Jossey-Bass.

74
Huicochea, A. (2010, August 4). Horne: Videotape ethnic classes for the record. Arizona
Daily Star. Tucson, Arizona. Retrieved August 12,
http://azstarnet.com/news/local/education.
Jalomo, R. (1995). Latino students in transition: An analysis of the first-year experience
in community college. Unpublished dissertation, Arizona State University,
Tempe.
Jones, C. & Mokhtari, C. (2003). Are student’s learning styles, discipline specific?
Community College Journal of Research and Practice, 27: 363-375.
Justiz, M. & Rendon, L. (1989). Hispanic students. In M. L. Upcraft, J. N. Gardner &
Asociates (Eds). The freshman year experience (pp. 261-276). San Fransicso:
Jossey-Bass.
Kirsch, I., Braun, H., Yamamoto, K., & Sun, A. (2007, January). America’s perfect
storm: Three forces changing our nation’s future. Princeton, NJ: Educational
Testing Service.
Kolb, D. (1984. Experiential learning: Experience as the source of learning and
development. Englewood Cliffs, NJ: Prentice Hall
McCabe, R. H. (1982). Excellence is for everyone: Quality and the open-door
community college. Presentation at the annual meeting of the American
Association of Higher Education.
MSN. (2010). Senators call for hearings on 14th amendment citizenship clause. Posted
on MSN. Com. (August 03, 2010). Retrieved August 04, 2010 from
http://www.thenewamerican.com/index.php/usnews/constitution/4208-senators-
call-for-hearings-on-14th-amendment-citizenship-clause.
75
Morest, V., & Jenkins, D. (2007, April). Institutional research and the culture of
evidence at community colleges: Report no. 1 in the culture of evidence series.
Achieving the Dream™ and the Community College Research Center. New
York, NY: Columbia University.
National Council on Education Statistics. (1995).
National Council on Education Statistics. (2007).
National Council on Higher Education Management Systems (2006). The unmet need
for baccalaureate education in Pima County. Boulder, CO.
O’Banion, T. (1997). A learning college for the 21st century. American Council on
Education and The Oryx Press. Phoenix, AZ
O’Banion, T. (2007). Creating a new architecture for the learning college. Community
College Journal of Research and Practice, 31(9), 713-714. Retrieved on August
09, 2010 from http://dx.doi.org./10.1080.
Pascarella, E. T. (1980). Student-faculty informal contact and college outcomes. Review
of Educational Research. 50. 545-595.
Pollack, W. (1998). Real boys: Rescuing our sons from the myths of boyhood. New
York: Random House.
Quillen, I. (2010, February 3). Report examines obstacles for minority male students.
Education Week 29:20 (2010). Retrieved August 8, 2010 from Professional
Development Collection, EBSO database.
Pima County Community College District. (2010). The 2004-2006 college plan.
Retrieved on August 3, 2010 from http://www.pima.edu/plan.

76
Rendón, L., Jalomo, R., & Nora, A. (2000). Theoretical considerations in the study of
minority student retention in higher education. In J. M. Braxton (Ed.). (2000).
Reworking the student departure model. pp. 127-156. Nashville, TN: Vanderbilt
University Press.
Roueche, J.E. & Baker, G.A. III, & Brownell, R. (1971). Accountability and the
community college: Direction for the 70’s. Washington, DC: American
Association of Community and Junior Colleges.
Roueche, J.E., & Kirk, R.W. (1973). Catching up: Remedial education. San Francisco,
CA: Jossey-Bass.
Roueche, J. E., & Baker, G.A. III. (1987). Access & excellence: The open-door college.
Washington, DC: The Community College Press.
Roueche, J.E., Taber, L.S., & Roueche, S.D. (1995). The company we keep:
Collaboration in the community college. Washington, DC: The Community
College Press.Roueche, J.E. & Roueche, S.D. (1999) High stakes, high
performance: Making remedial education work. (p. 18) Washington, DC: The
Community College Press.
Roueche, J. E., Ely, & Roueche, S. D. (2001). In pursuit of excellence: The community
college of denver. Washington, DC: The Community College Press.
Saenz, V. (2004). Hispanic students and community colleges: A critical point for
intervention. Los Angeles, CA: Eric Clearinghouse for Community Colleges,
(Eric Identifier: ED4779080. Retrieved July 26, 2010 from
http://www.ericdigests org/2004-1/hispanic.htm.
Saenz, V. The ‘disappearing’ Latino male: setting the stage. Presentation at the College
Board Hispanic and Latino Dialogue Day, May 21, 2008. Chicago, Il.

77
Salkind, N.J. (2008). Statistics for people who hate statistics. Los Angeles: Sage
Publications.
Sunnyside Unified School District. (2009). Administrator, personal communication. July
20, 2009.
Sunnyside Unified School District. (2010). Project graduation: The digital advantage.
Tucson, Arizona.
Sunnyside Unified School District. (2010). Who we are. Tucson, Arizona.
Szelényi, K. (2001). Minority student retention and academic achievement in
community colleges. In S. R. Aragon (Ed.), Beyond access: Methods and models
for increasing retention and learning among minority students. New Directions
for Community Colleges, No. 112, Winter 2000. San Francisco, CA: Jossey-
Bass.
Text: Sen. John Edwards’ speech to DNC. (1994, July 28). The Washington Post.
Retrieved July 25, 2010. http://www.washingtonpost.com/wp-
dyn/articles/A22230-2004Jul28.html.
The College Board (2010, January). The educational crisis facing young men of color.
(College Board Rep. No 09b-963). Princeton, NJ: Educational Testing Service.
Tienda, M. (2009, March). Hispanicity and educational inequality: Risk, opportunities
and the nation’s future. Tomás Rivera Lecture Series American Association of
Hispanics in Higher Education (AAHCHE) San, Antonio, TX and Educational
Testing Services. Princeton, NJ.
Tinto, V. (1975). Dropouts from higher education: A theoretical synthesis of recent
research. Review of Education Research. 45. 89-125.

78
Tinto, V. (1987). Leaving college: Rethinking the causes and cures of student departure.
Chicago: University of Chicago Press.
Tinto, V. (1993). Leaving college: Rethinking the causes and cures of student departure.
Chicago: University of Chicago Press.
Tucson Unified School District. (2010). Enrollment: Statistics by gender and ethnicity.
Tucson, Arizona.
United States. (1983). A nation at risk: The imperative for educational reform. National
Commission on Excellence in Education. Washington, DC.
United States. (2002). No child left behind. Department of Education. Washington, DC
Retrieved on August 15, 2010, from http://www.2.ed/gov/nclb.
United States. (1990). Secretary’s commission on achieving necessary skills: What work
requires from schools. Department of Labor. Washington, DC.
Upcraft, M. L., Gardner, J.N., & Associates (1989). The freshman year experience. San
Francisco: Jossey-Bass.

79
Vita
Nancee Jane Sorenson completed the Bachelor of Science in Psychology at
Indiana State University in Terre Haute, Indiana. She began her career in higher
education as an adjunct faculty member at Indiana Vocational Technical Community
College in Terre Haute and later joined the staff as a counselor. While there, she filled
various positions in enrollment management, grant writing, and as a special assistant to
the Chancellor with responsibilities in K-12 and business partnerships. Nancee
completed the Master of Science in Agency Counseling while at IVTCC. Now at Pima
Community College in Tucson, Arizona she is a Vice President of Student Development
and has held administrative positions since 2002. Accomplishments have been
leadership in the development and implementation of student services center which
focuses on developing students through teaching and learning, leading services for
students with disabilities, grant writing, student success and retention efforts,
certification as Phi Theta Kappa faculty, and community and K-12 partnerships.
Nancee is actively involved in the community and is a member of several organizations
and boards at a local and national level. While at the University of Texas, at Austin, she
was a Graduate Teaching Assitant and was selected by the Community College
Leadership Program as a Colvert Scholar and Gleazer Scholar.
Manuscript typed by the author.
Permanent Address: 1727 East Buck Ridge Place Tucson, Arizona 85737