Copyright @ B&W TEK Overview of the NanoRam Handheld Raman for Rapid Material Identification B&W...
95
Copyright @ B&W TEK Overview of the NanoRam Handheld Raman for Rapid Material Identification B&W Tek, Inc Newark, DE USA September 2013
-
Upload
martin-chambers -
Category
Documents
-
view
217 -
download
0
Transcript of Copyright @ B&W TEK Overview of the NanoRam Handheld Raman for Rapid Material Identification B&W...

Copyright @ B&W TEK
Overview of the NanoRam Handheld Raman for
Rapid Material Identification
B&W Tek, IncNewark, DE
USASeptember 2013

www.bwtek.com 2Copyright @ B&W TEK

We are Your Spectroscopy PartnerGlobal leader with > 10,000 Portable and handheld Raman systems
B&W Tek, China
Ming Shen Commercial Plaza
400 CaoBao Rd., Suite 2206, Shanghai - 200233, China
Phone: +86 021-64515208
B&W Tek, Japan
2-3-2 7F, Kamiochiai, Chuo-ku, Saitama-city, Saitama - 338-0001, Japan
Phone: +81(0)48 851 3150
B&W Tek, Corporate Headquarters
19 Shea Way Newark, DE 19713, USA
Phone: +1-302-368-7824
Web: www.bwtek.com
B&W Tek, Europe
Seelandstraße 14-16, 23569 Lübeck, Germany
Phone: +49(0)45130803854
Over 15
years
www.bwtek.com 3Copyright 2013 B&W Tek, Inc.

Copyright @ B&W TEK www.bwtek.com 4

Country NanoRam Distributor Country NanoRam Distributor
Abu Dhabi LabGulf fzc Japan Sanyo Trading Company
Argentina Carpe Scheider Korea Sunil-Ina Instruments
Australia Scitech Pty Ltd. Malaysia, Singapore Lab Science Solution
Benelux Vadeno Mexico Perkin Elmer Mexico
Brazil Erwing Mondragon Pakistan Chemtech
Canada Betatek Inc. Peru Cientifica Andina
Chile Perkin Elmer Chile Poland Bioanalytic
Czech Republic Nicolet Portugal STEC Instruments-Sistemas Tecnicos
Dominican Republic Amco Instruments Romania Ronexprim
Egypt Cairo Scientific Russia, Belarus, Kazakstan Promenerdolab, LLC
Finland Lab-dig Oy Spain Microbeam
France Opton Switzerland IG Instrumenten (IGZ)
Germany, Austria, Switzerland
Polytec Taiwan
Schmidt Scientific
Hungary Metalon Thailand Pondpol Analytical
India Spinco Biotech PVT ltd. Turkey Tetra Teknolojik Sistemler
Indonesia Mensa Group Ukraine Medtechnika-Dent
Ireland Brennan & Company United Kingdom & Ireland Pacer
Israel Lahat Technologies USA SciMark International
Italy Madatec 5

What is the need?• Pharmaceutical companies must meet worldwide PIC/S
initiatives, local Pharmacopeia and the US Food and Drug Administration’s regulations on Good Manufacturing Practice (GMP)
• There has been a trend of increasing product contamination incidents, product recalls and facility shutdowns
• Companies must develop and implement improved analytics to check the identity, integrity and quality of ingredients and products
• Implementation of 100% testing of raw materials is coming!www.bwtek.com 6Copyright @ B&W TEK

Copyright 2013 B&W Tek, Inc. www.bwtek.com 72012: Japan and Korea applied for membership

Regulatory Standards Compliance
• 21 CFR Part 11 Electronic Records; Electronic Signatures
• 21 CFR Part 1040.10 Laser and Laser Systems
• US Pharmacopeia <1120> Raman Spectroscopy
• European Pharmacopeia Ch.2.2.48 guidelines for Raman Spectroscopy- includes information on spectral library validation
• ASTM 1840-96(2007) Standard Guide for Raman Shift Standards for Wavelength Calibration
www.bwtek.com 8Copyright 2013 B&W Tek, Inc.

Incremental Regulatory Control for Incoming Material Identification
•PIC/S recommendations on complete traceability of incoming materials•GMP is expanding to new products
Global Supply Chain•Companies are moving toward a more delocalized supply chain•Problems associated with supplier quality assurance and transportation
Quality Assurance and Cost Reduction•Increase analytical capabilities to assure material quality•Reduce operational cost•Optimize operational efficiencies
Industry Trends and Requirements

Copyright @ B&W TEK
100% Raw Material Inspection
Why do we need to perform 100% container identity testing?

GMP for Raw Material Identification
US FDA 21 CFR requires testing of raw materials: 21 CFR 211.84 (d)- “At least one test shall be conducted to
verify the identity of each component of a drug product. Specific identity tests, if they exist, shall be used.”
Raw materials are quarantined until identity is verified Raw materials must meet predetermined specifications US FDA Compliance Program Guidance Manual Program (Drug
Manufacturing Inspections-FDA CP7356.002) Material systems: at least one specific identity test is
conducted on each lot of each componentDietary Supplement GMPs US 21 CFR 11121 CFR 111.75(a)(1)(i)Conduct at least one appropriate test or examination to verify the identity of any component that is a dietary ingredient

GMP for Raw Material Identification
EU GMP and PIC/S GMP Guide
Chapter 5. Production
5.30 There should be appropriate procedures or measures to assure the identity of the contents of each container of starting material.
Annex 8 -Sampling of starting and packaging materials
2. Starting Materials
The identity of a complete batch of starting materials can normally only be ensured if individual samples are taken from all the containers and an identity test is performed on each sample.
This means: 100% container testing

US FDA Warning Letter Review- Identity Tests
• Xian Libang Pharmaceutical Co., Ltd., China. (Jan 28, 2010)1. Failure of your quality unit to ensure that materials are appropriately tested and the results are reported.
• Your firm used the IR spectra for one lot to approve and release two subsequent incoming lots. This practice is unacceptable and raises serious concerns regarding the integrity and reliability of the laboratory analyses conducted by your firm.
• It is essential that at least one test be conducted to verify the identity of each lot of incoming material.
• In addition, the laboratory control records should include complete documentation of all raw data generated during each test, including graphs, charts and spectra from laboratory instrumentation.
Requirement-development of methods/libraries with well-characterized materials
Requirement-development of methods/libraries with well-characterized materials

Copyright @ B&W TEK
Regulatory Expectations for Spectroscopic-based
Methods

Issues and Customer Concerns• Can Raman help my project?• What are the differences between Raman and NIR?• Should I really perform 100% container ID test? What are
my options? • Do I need to validate the Raman method? If yes, what are
the requirements for method validation?• What is next after the Raman ID becomes a routine
method?• Do I need to know the filing expectations from regulatory
agencies (JP/EMA/FDA..)?• Can vendors provide GMP support & related documents?
15

Applicability of Raman Spectroscopy
04/19/23 Confidential16

Raman Spectral Information• Raman spectroscopy is a form of
molecular spectroscopy based on the scattering of light by molecules.
• A Raman spectrum is a molecular ‘fingerprint’ that provides structural information– Can identify materials based on the
spectrum
• Changes in intensity, frequency and peak bandwidth provide valuable information for quantitative and qualitative analysis
www.bwtek.com 17
500 1000 1500 2000 2500 3000
Raman shift (cm-1)
(CH3)2C=O
CH3CH2OH
(CH3)2S=O
CH3CH2O2CCH3
C6H5CH3
C=O
C=O CH3
Ar-H
S=O
CH3CH2
C-O
CH3Aromatic

Raman Spectra Raman ShiftIndependent of laser outputExcitation wavelength is determined by analytical and sample needs (avoid fluorescence interference with longer wavelength)
Raman IntensityDepends on laser wavelength The longer the excitation wavelength the lower Raman peak counts (at same power output)
www.bwtek.com 18Copyright @ B&W TEK

Components of a Raman Spectrometer
Laser Narrow Line width Small form factor Low power consumption Extremely Stable Power Output
www.bwtek.com 19Copyright @ B&W TEK
SpectrometerHigh ResolutionLow Noise Small form factor Low power consumption
Probe Backscattered laser rejection filter
PC and analysis software

What can Raman do for you?
www.bwtek.com20
Strong Raman SignalActive Pharmaceutical IngredientsAlcohols AntibioticsAntioxidantsBuffersCoatingsDiluentsEmulsifiersExcipientsFlavorsFragrancesLubricantsMonomers and polymersPolyatomic inorganicsPreservativesSolventsVitamins
Weak Raman SignalMaterials that are dark in colorHighly fluorescing moleculesFillers/binding agentsGlassThin-walled plasticsWater
No Raman Signal•Black materials•Metals•Mono-atomic ions

Raman can measure through a broad class of packaging
Bottles Thickness
Amber Glass < 2 mm
Clear Glass < 3 mm
High Density Polyethylene (HDPE) < 1 mm
Teflon FEP < 1 mm
Polystyrene < 1 mm
Vials
Amber and Clear Glass < 1 mm
Bags
Polypropylene (PP) < 0.1mm
Polyethylene (PE), Low-Density Polyethylene (LDPE)
< 0.1mm
21

How does Raman compare?In comparison to other vibrational spectroscopy methods, such as FTIR and NIR, Raman has several major advantages
www.bwtek.com 22Copyright @ B&W TEK

23
The Measurement Challenges- Measure Through Plastic
PackagingImplementation advantages of spectroscopic methods•No cross-contamination (the material inside the bag)•Safe and easy to implement•Can be implemented in warehouse, docking area or lab
But…challenges exist if using NIR technique•Spectral profiles include packaging absorptions •Packaging interferences may reduce the specificity of the method when identify similar materials•The library requires assessment or change if the bag changes, i.e., not suitable for multiple suppliers of same materials•Packaging could have multiple layers, with different colors or materials

24
No PE bag (pure sample).4
.6
.8
1
1.2
1.4
1.6
1.8
8500 8000 7500 7000 6500 6000 5500 5000 4500
.4
.6
.8
1
1.2
1.4
1.6
1.8
8500 8000 7500 7000 6500 6000 5500 5000 4500Wavenumber (cm-1)
Two layer PE bagOne layer PE bag
NIR Spectra of material –with plastic bag
Required to evaluate the method specificity in the presence of bag!
NIR Spectra of API (Plastic bag contribution)

25
Raman Spectra of API (Plastic bag effect)
0200400600800100012001400160018002000220024000
900
1800
2700
3600
4500
5400
6300
7200
8100
9000
9900
Raman shift [cm-1]
Inte
nsity
No bag
One layer bag
Two layer bag
No significant spectral absorption from PE bag
No significant spectral absorption from PE bag

Raman has greater specificity than NIR: same
pharmaceutical tablet
04/19/23 www.bwtek.com 26
Wavenumber (cm-1)
7398. 7544. 7691. 7838. 7984. 8131. 8277. 8424. 8570. 8717. 8864. 9010. 9157. 9303. 9450. 9596. 9743. 9890. 10044 10206 10368
NIR
Re
flect
an
ce
0
0.5
1
1.5
NIR Spectrum of tablet
Raman shift (cm-1)
3200 3078 2954 2830 2706 2582 2458 2334 2210 2086 1962 1838 1714 1590 1466 1342 1218 1094 976. 864. 752. 639. 527. 415. 303.
Ra
ma
n in
ten
sity
20
40
60
80
Raman Spectrum of tablet

Benefits of NanoRam for ID Testing
• Reduced material movement – directly implement in warehouse, loading dock, fewer accidents/reduced manpower
• Easy and simple operations- simple training & improves manpower usage
• Reduce chemical exposure and contamination– scan through packaging materials & maximize personnel safety
• Fewer lab delays reduce cycle time – on-time production & higher throughput
• Free up laboratory instruments – increases lab capacity• Reduced transcription – fewer errors; lower personnel and equipment overhead; control costs
www.bwtek.com 27Copyright @ B&W TEK

Productivity (35-50% Up)
• 100% ID using HPLC or wet chemistry: 16.5 hrs
• Quarantine period 2 shifts or longer
• With NanoRam <1 minute per sample: 11 hrs total from receipt to acceptance
• Quarantine period within hours
www.bwtek.com 28Copyright @ B&W TEK

NanoRam• Incoming non-destructive
testing of Raw Materials• Reducing Waste in the
Dispensing Suite• Plastic Packaging
Identification• At line identification of
intermediates• Final product
identification• Substandard, Adulterants,
and Counterfeit Deterrent

NanoRam Handheld Innovations
www.bwtek.com 30Copyright @ B&W TEK
• Only handheld with high resolution touch screen interface
• Only handheld offering easy data management and reporting
• Best methodologies for robust analysis
• Fastest in adding Methods and Libraries
• Only handheld allowing editing Method
• Full method development and validation support

NanoRam ® specifications
www.bwtek.com 31Copyright @ B&W TEK
NanoRamBWS456
Detector TE Cooled linear CCD Array
Laser Excitation 785nm
Laser power tunable from 0 mW to 300 mW
Laser Power Control0 to 100% in 10% increments
Range / Resolution
176cm-1 to 2900cm-1
~ 9.0 cm-1 @ 785nm
Display High Visibility OLED touch screen, 3.7" size
Barcode Reader 1D and 2D barcodes
Data Formats .txt, .csv, .spc, .pdf
DC Power 12V DC at 6.6 Amps
Battery Rechargeable Li-ion Battery, > 5 hours operation
PC Software NanoRam ID
Computer InterfaceUSB to Ethernet, Wifi
IP ProtectionClass
IP64- Protection from infiltration of dust and splashing water

Features of NanoRam®
• 2D/1D Bar Code Reader• IP64 Dust/Splash Proof• Easy Battery Replacement• TCP/IP and WiFi Interfaces
www.bwtek.comCopyright @ B&W TEK

Easily changed accessories
www.bwtek.com 33Copyright @ B&W TEK
Push in
Liquid vial holder
Point & shoot adaptor

NanoRamInstrument Menu OperationTouch screen with on-screen keyboardLightweight: about 1 kg and able to be used with either handEasy to read screen for quick menu usageManagerial access levels allow for secure areas of the softwareUsers are designated with passwordsTraceability of all activity with the instrument and the users
www.bwtek.com 34Copyright @ B&W TEK

Clear Results
www.bwtek.com 35Copyright @ B&W TEK

User accounts
• ADMIN user can create other accounts
• Three levels of users:– Operator– Developer – Administrator
• Plus a Device Manager for administrative tasks
www.bwtek.com 36Copyright @ B&W TEK

Device Manager• Device manager for
administrative tasks• Sets overall system clock and
password expiration period (6 months default)
• Can create Calibration files (as can ADMIN)
• Cannot do any analysis or data transfer
• Unique password tied to unit serial number
www.bwtek.com 37Copyright @ B&W TEK

Operation Modes
• Identification method for statistical validation of incoming materials
• Investigation of unknown materials using correlation with a reference library
• Administrative functions such as operation presets, user accounts, calibration validation and data transfer setup
www.bwtek.com 38Copyright @ B&W TEK

Easy administration
Administration
www.bwtek.com 39Copyright @ B&W TEK

NanoRam: Operation Preset
www.bwtek.com 40Copyright @ B&W TEK
• Managerial level access to set Operation Preset
• ADMIN can also – create user accounts:
Developer and Operator level users
– Create calibration files

Self check: by performing calibration validation using ASTM 1840 ref material: Polystyrene
Calibration Validation: part of the PQ
41Copyright @ B&W TEK
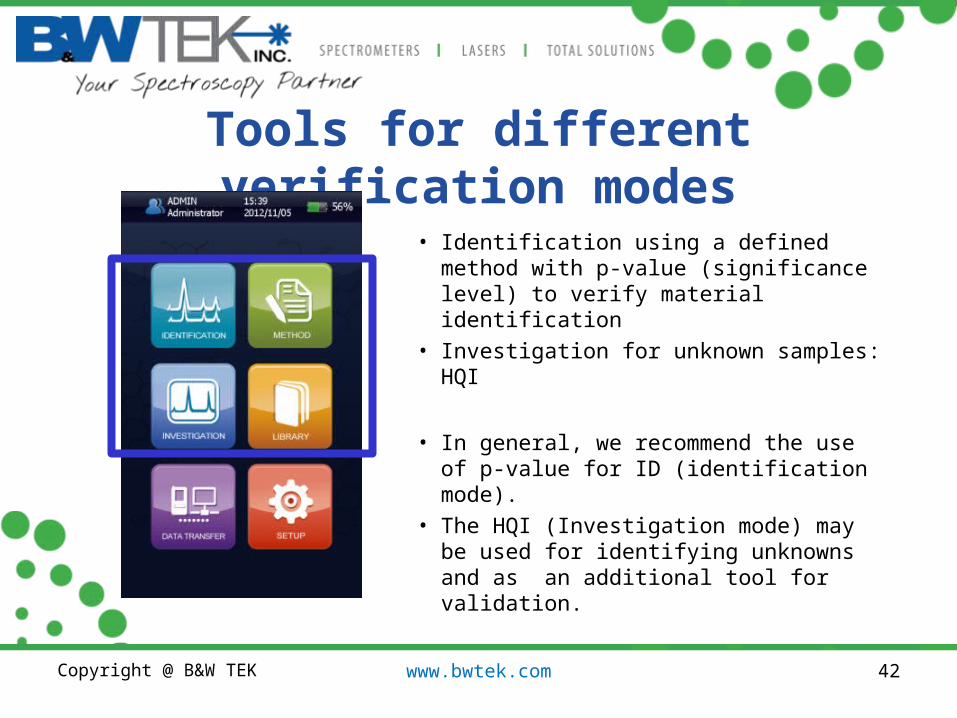
Tools for different verification modes
• Identification using a defined method with p-value (significance level) to verify material identification
• Investigation for unknown samples: HQI
• In general, we recommend the use of p-value for ID (identification mode).
• The HQI (Investigation mode) may be used for identifying unknowns and as an additional tool for validation.
www.bwtek.com 42Copyright @ B&W TEK

What to use?
p-value is ideal for verifying and/or qualifying the identity of a ‘known’ material. It provides more robust methodology and has can discriminate between molecules which have structural similarities.
HQI allows for the rapid comparison of a spectrum against a large library of spectra, making it ideal for analysis of unknown materials.
43
Built-in processing algorithms to automatically perform complex analysis, making these tools much more accessible to the general user. However, not clearly understanding the advantages and disadvantages of the various algorithms can lead to a misuse of the technology. Therefore, it is important to understand that both correlation and classification approaches have advantages and disadvantages depending on the goal of the measurement.
www.bwtek.com

Describe ID vs Investigation
www.bwtek.com 44Copyright @ B&W TEK

Creating a Method• Create method for each material• Use barcode or user-entered
name for Method name• Will collect 20 sample spectra
per method- preferably of different lots of material
www.bwtek.com 45Copyright @ B&W TEK
katherineb
add more screen shots

Developer/Admin can Create Method
• Easy steps to create methods
www.bwtek.com46

Method development: Data check
• Scan samples and view each scan as collected• Scans compared with previous ones, and if HQI < 85, it is shown in RED suggesting that may want to delete from method• Can view overlay of scans with average in method
www.bwtek.com 47Copyright @ B&W TEK

Methods can be updated
• More sample spectra can be added• p-value threshold (significance level) can be changed• Note must be added to make change: TRACEABILITY
www.bwtek.com 48Copyright @ B&W TEK

USING IDENTIFICATION MODE
www.bwtek.com 49Copyright @ B&W TEK

Identification• Measure in batch or single mode• Load method to use• Enter sample information• Scan sample and get Pass/Fail
result
www.bwtek.com 50Copyright @ B&W TEK

Identification• When running IDENTIFICATION get Pass or Fail.
www.bwtek.com 51Copyright @ B&W TEK
If an identification fails, the system will automatically run an investigation to suggest potential matches.

Batch Mode• Batch mode allows user to
run many samples without having to enter information for each sample
• Batch summary report available in NID
www.bwtek.com 52Copyright @ B&W TEK

Library Investigation approach• This mode allows the testing of unknowns• Will search libraries/methods selected in
Operation Presets• Number of matches (hits) and match threshold
also defined in presets• Gives Match/no Match result(s)
www.bwtek.com 53Copyright @ B&W TEK

US FDA Warning Letter Review- Identity Tests
• Xian Libang Pharmaceutical Co., Ltd., China. (Jan 28, 2010)1. Failure of your quality unit to ensure that materials are appropriately tested and the results are reported.
• Your firm used the IR spectra for one lot to approve and release two subsequent incoming lots. This practice is unacceptable and raises serious concerns regarding the integrity and reliability of the laboratory analyses conducted by your firm.
• It is essential that at least one test be conducted to verify the identity of each lot of incoming material.
• In addition, the laboratory control records should include complete documentation of all raw data generated during each test, including graphs, charts and spectra from laboratory instrumentation.
Requirement-development of methods/libraries with well-characterized materials
Requirement-development of methods/libraries with well-characterized materials

Adding samples to library• Create library : enter library name• Add New sample: scan sample• Enter sample details and Add to library
www.bwtek.com 55Copyright @ B&W TEK

Selecting libraries to use in Investigation
• The libraries against which the search and match is performed can be modified.
• Multiple libraries can be selected.
• The Methods also can be searched to establish a match of materials using an HQI against every Method.
www.bwtek.com 56Copyright @ B&W TEK

Results from NanoRam
www.bwtek.com 57Copyright @ B&W TEK
• Identification: Pass/Fail– sample identity verified by
comparison to defined method; p-value used as pass criterion
• Investigation: Match/No Match– sample matched by correlation
(HQI) to materials that are in the libraries available on the system

NANORAM EXAMPLES
www.bwtek.com 58Copyright @ B&W TEK

Identification of Amino Acids
– L-alanine
– L-aspartic acid
– L-cysteine hydrochloride
www.bwtek.com 59Copyright 2013 B&W Tek, Inc.

Identification of Amino Acids• Create methods on
NanoRam for the following materials:– L-alanine– L-aspartic acid– L-cysteine hydrochloride
• 20 scans per method• 90% laser power (270 mW)• Point and shoot adaptor to
measure sample in direct contact
aspartic acid alanine cysteine HCl
Raman shift (cm-1)
176 260 348 436 524 608 696 784 868 956 1056 1168 1280 1392 1504 1616 1728 1840 1952 2064 2176 2288 2400
Nor
ma
lized
Ra
man
inte
nsity
0
0.1
0.2
0.3
www.bwtek.com 60Copyright 2013 B&W Tek, Inc.

Using Investigation Mode and HQI
Library Spectrum
SampleL-Alanine L-Aspartic Acid
L-Cysteine Hydrochloride
L-Alanine HQI=100 HQI=1.63 HQI=0.66
L-Aspartic Acid HQI=1.63 HQI=98.88 HQI=1.71
L-Cysteine Hydrochloride HQI=0.52 HQI=2.22 HQI=99.19
www.bwtek.com 61Copyright 2013 B&W Tek, Inc.

Multivariate PCA Scores Plot of Spectra of All 3 Methods
aspartic acid alanine cysteine HCl
PC-1 (69%)
-0.1 0 0.1
PC
-2 (
30%
)
-0.04
-0.03
-0.02
-0.01
0
0.01
0.02
0.03
0.04
0.05
PCA Scores for Raman Method Data
www.bwtek.com 62Copyright 2013 B&W Tek, Inc.

Identification Mode: Project Sample on Method Model
• 95% Confidence Ellipse (5% significance) Defines Sample Identification
• Blue Samples –Define the Method (20 Scans)
• Green Samples- Test the Method Calibration Projection
-0.05 -0.04 -0.03 -0.02 -0.01 0 0.01
-0.01
0
0.01
0.02
Scores
cyst. HCl
cyst. HClcyst. HCl
cyst. HClcyst. HCl
cyst. HClcyst. HCl
cyst. HCl cyst. HCl
cyst. HClcyst. HCl
cyst. HCl
cyst. HCl
cyst. HClcyst. HCl
cyst. HCl
cyst. HCl cyst. HCl
cyst. HCl
cyst. HCl
cyst. HClcyst. HCl
cyst. HCl
alaninealaninealaninealanine
aspartic acidaspartic acidaspartic acid
PC-1 (74%, 31%)
PC
-2 (
20%
, 2%
)
www.bwtek.com 63Copyright 2013 B&W Tek, Inc.

Specificity (or Proximity) Matrix
Proximity Matrix: Testing of all the materials in Identification Mode using specific methods generated by each of the materials Method Materials
L-alanine L-aspartic acid L-cysteine HCl
L-alanine PASS
p=0.7945
Fail
p=7.772 x 10⁻¹⁶
Fail
p=1.776 x10⁻¹⁵
L-aspartic acid Fail
p=7.661 x 10-
15
PASS
p=0.8915
Fail
p=7.25 x10⁻¹⁴
L-cysteine HCl Fail
p=8.436 x 10-
11
Fail
p=2.26 x 10⁻¹¹
PASS
p=0.9995
p-value> 0.05
0.001 < p ≤ 0.05
10-6 < p ≤ 10-3 0 < p ≤ 10-6
www.bwtek.com 64Copyright 2013 B&W Tek, Inc.

Comparing Chemically Similar Materials
• Potassium Carbonate
• Potassium Carbonate Sesquihydrate
potassium carbonate sesquihydrate potassium carbonate
Raman shift (cm-1)
176. 276. 376. 476. 576. 676. 776. 876. 976. 1080 1192 1308 1420 1536 1652 1764 1880 1996 2108 2224 2340 2452
Nor
mal
ized
Ram
an in
tesi
ty
0
0.1
0.2
0.3
0.4
0.5
0.6
Raman spectra of potassium carbonate (red) and potassium carbonate sesquihydrate (blue).
www.bwtek.com 65Copyright 2013 B&W Tek, Inc.

HQI : Library Searching
Library Spectrum
SamplePotassium Carbonate
Potassium Carbonate Sesquihydrate
Potassium Carbonate HQI=99.5590 HQI=96.9013
Potassium Carbonate Sesquihydrate
HQI=97.5834 HQI=99.5908
Difficult to get unambiguous results as the HQI is >95 for both samples against library spectra
www.bwtek.com 66Copyright 2013 B&W Tek, Inc.

Identification Method Using p-value
Method
Sample
Potassium Carbonate
Potassium Carbonate
Sesquihydrate
Potassium Carbonate
p-value = 0.96390.97550.98250.99980.9262
p-value = 6.415 x 10⁻⁴
2.990 x 10⁻⁴
2.597 x 10⁻⁴
6.153 x 10⁻⁵
4.077 x 10⁻⁵
Potassium Carbonate
Sesquihydrate
p-value = 1.258 x 10⁻⁵
1.979 x 10⁻⁵
4.132 x 10⁻⁵
3.245 x 10⁻⁵
3.106 x 10⁻⁵
p-value = 0.99970.95340.99020.99190.9942p-value >
0.050.001 <p-
value≤ 0.0510-6 <p-
value≤ 10-3
0 <p-value≤ 10-6
www.bwtek.com 67Copyright 2013 B&W Tek, Inc.

NanoRam Flexible Sampling• Separate methods were created for
Ethanol with the vial holder, and with the immersion probe
• Test samples across these two and get passing results
• Can develop a single method including sampling variability to give more robustness
www.bwtek.com Slide 69

Testing with Different Accessories
www.bwtek.com Slide 70
Sample
Method
Ethanol via immersion
probe
Ethanol via vial holder
Ethanol via immersion
probe
0.94580.98510.9840.9790.9876
0.74260.71770.85880.81050.7318
Ethanol via vial holder
0.84570.77580.71750.63910.7317
0.53170.490.51910.620.6093
The ID test gives “Pass” result for samples in vial holders and samples directly measured using immersion probe

Sampling of solids• Solids can be measured with the point and shoot adaptor as
is directly or through transparent packaging.• Tablet holder has a larger beam size and samples a larger
area of a sample than does the point and shoot adaptor. It is recommended for use with tablets and samples that exhibit nonhomogeneity
• Right angle adaptor and immersion probe can also be used for solids
www.bwtek.com 71Copyright @ B&W TEK

Tylenol tablet testing with different accessories
Samples
Method
Tylenol in whirl pak
Tylenol in tablet holder
Tylenol with point & shoot
Tylenol in whirl pak
0.99900.99570.99650.99370.9304
0.89620.78330.74790.91100.6893
0.38660.42150.40780.49170.6353
Tylenol in tablet holder
0.86490.98300.75160.94060.9975
0.95900.98260.99660.96990.9984
0.97930.85440.82480.96760.8172
Tylenol with point & shoot
0.24210.23610.83610.61190.43500.6930
0.93070.73770.95430.83360.62090.8901
0.58280.76300.69810.52420.6488
Tylenol with all 3
accessories/packaging
0.99970.99810.98940.9966
0.98590.99670.99240.9958
0.99750.97040.99860.9846
www.bwtek.com 72Copyright @ B&W TEK

Data Management and reporting with NID
www.bwtek.com 73Copyright @ B&W TEK

NID Software interface• Synchronization with
up to 8 units• Data archival and
retrieval• Records reporting• Audit trail• Methods review• Calibration validation
reports• Account
management
www.bwtek.com 74Copyright @ B&W TEK

Data Synchronization with NID
www.bwtek.com 75Copyright @ B&W TEK

Method Management via NID
www.bwtek.com 76Copyright @ B&W TEK

Method information in NID
www.bwtek.com 77Copyright @ B&W TEK

Reports in NID
www.bwtek.com 78Copyright @ B&W TEK

Data exporting
www.bwtek.com 79Copyright @ B&W TEK

Library viewing
www.bwtek.com 80Copyright @ B&W TEK

Audit trail
www.bwtek.com 81Copyright @ B&W TEK

Calibration validation report
www.bwtek.com 82Copyright @ B&W TEK

How can we help?We can provide:• IQ & OQ• PQ and DQ• Method Validation Protocol• Method Development Guidelines • Libraries development service• Method development service• We can provide full validation
support • Certification of distributors for
IQ/OQ• Instrument Annual Certification
www.bwtek.com 83Copyright @ B&W TEK

Method Validation for Qualitative Analysis (ID)
• It is important to test methods to ensure correct PASS of known good materials and correct FAIL of materials known to not be what the method was developed for
• OQ/PQ procedures and Method Validation protocols include tests for this – ensuring that there are not false positives or false negatives from the methods with test cases of aspirin and tylenol
• Validation requires risk assessment and should be done at a level commensurate with the risk that an incorrect result carries– Focus on minimizing possible harm to patient.
www.bwtek.com 84Copyright @ B&W TEK

Documentation
• User Manual• Quick Start Manual – for Operator-
level users• DQ/IQ/OQ/PQ• Software release notes
• Identification Method Development Guidelines for the NanoRam
• Method Validation Report• SOP for Operation of NanoRam
www.bwtek.com | www.nanoram.com85

DQ/IQ/OQ and PQ Documents for NanoRam-
Copyright @ B&W TEK

Raman has proven to be a promising tool to increase operational capabilities and reduce cost while providing rapid material identification.
87
Summary

Copyright @ B&W TEK
Thank you for your attention
www.bwtek.com 88
B&W Tek, Inc.302-368-7824

BACK UP SLIDES
89

Spectroscopic-based Identity Method
Method development
www.bwtek.com 90
• The methods/libraries must be developed and can then be run on a routine basis
Developer/Administrator
Measure 20 representative spectra Build method based on PCA and establish threshold p-value (typically 0.05)
Test Method
500060007000800090001000011000
Wavenumber cm-1
0.2
0.3
0.4
0.5
0.6
0.7
0.8
0.9
Abs
orba
nce
Uni
ts
PC1
PC
2
PC1
PC
2

91
Spectroscopic-based Identity Method
Sample analysis
1. Access method 2. Scan sample 3. Identify material
Operator

Raman Related Documents (1)Pharmacopeia•United States Pharmacopeia (USP34/NF29) General Chapter <1120> Raman Spectroscopy•European Pharmacopeia (Ph Eur 7.0) 2.2.48 Raman Spectroscopy•Pharmacopeia of the People‘s Republic of China (2010)- Raman Spectroscopy 拉曼光谱法指导原则
EMA Guidance – effective Oct 1, 2012•EMA/CHMP/QWP/811210/2009-Final Guideline on Real Time Release Testing (formerly Guideline on Parametric Release) 2012- …may utilize process analytical technology (PAT) tools e.g. near infrared spectroscopy (NIR) and Raman spectroscopy

Raman Related Documents (2)• ASTM E1840 - 96(2007) Standard Guide for Raman Shift Standards
for Spectrometer Calibration• ASTM E1683 - 02(2007) Standard Practice for Testing the
Performance of Scanning Raman Spectrometers• ASTM E2529 - 06 Standard Guide for Testing the Resolution of a
Raman Spectrometer
• US FDA Advancing Regulatory Science at FDA: A Strategic Plan (August 2011): Section 2. Develop new analytical methods:a) Investigate feasibility and value of using emerging and improved analytical technologies like Nuclear Magnetic Resonance (NMR), mass spectrometry, or near infrared or Raman spectroscopy for evaluating product quality of pharmaceutical agents, and evaluate whether these technologies should replace existing methods;

Raman Applications in Pharma• ID
– Identification Verification of and Identification of unknown raw materials This is the application for NanoRam
• Quantitative analysis – Quantitative determination of active substances in different
formulations;
• Polymorphism – Supporting polymorphic screenings (polymorphs have different
solubility rates, thereby impacting the effective dosing);
• Process – Real time quantitative analysis for process analytical
technology (PAT) such as blending, titration, reaction monitoring and polymorphic transition monitoring.
www.bwtek.com94 Copyright @ B&W TEK

Analytical Instrument Qualification
USP <1058> Analytical Instrument QualificationCopyright @ B&W TEK

NanoRam User Levels
96Copyright @ B&W TEK
User Type User Type Symbol
User Privileges
Operator Select MethodPerform Material IdentificationSelect Operation PresetData Transfer
Developer All above, plus:Create /Edit MethodCreate/Modify Operation PresetCreate/Modify Data Library
Administrator All above, plus:Manage User Accounts Create calibration files
Device Manager Set system clockSet password expirationCreate calibration fileReset ADMIN password