Copyright © 2014 Pearson Education, Inc.12-1 SPSS Core Exam Guide for Spring 2014 The goal of this...
21
Copyright © 2014 Pearson Education, Inc. 12-1 SPSS Core Exam Guide for Spring 2014 The goal of this guide is to: Be a side companion to your study, exercise and exam completion – it is not a substitute for reading through your book chapters Chronologically shortlist different analyses by chapter and Display must have information needed for the running, reading and understanding of the generated outputs.
-
Upload
moris-alexander-gilbert -
Category
Documents
-
view
214 -
download
0
Transcript of Copyright © 2014 Pearson Education, Inc.12-1 SPSS Core Exam Guide for Spring 2014 The goal of this...

Copyright © 2014 Pearson Education, Inc. 12-1
SPSS Core Exam Guide for Spring 2014
The goal of this guide is to:Be a side companion to your study, exercise and exam
completion – it is not a substitute for reading through your book chapters
Chronologically shortlist different analyses by chapter andDisplay must have information needed for the running,
reading and understanding of the generated outputs.
Copyright © 2014 Pearson Education, Inc. 12-2
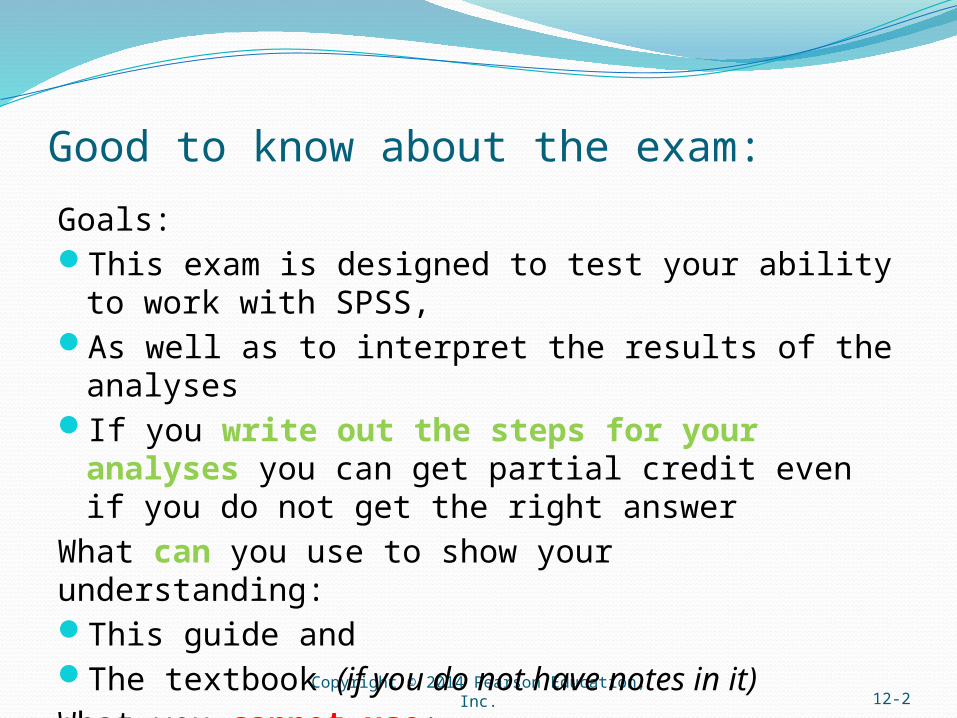
Good to know about the exam:
Goals:This exam is designed to test your ability to work with SPSS,As well as to interpret the results of the analysesIf you write out the steps for your analyses you can get partial
credit even if you do not get the right answerWhat can you use to show your understanding:This guide andThe textbook (if you do not have notes in it)What you cannot use:Smartphones, mail, internet or help from your peers

Chapter 12Using Descriptive Analysis
Performing Population Estimatesand Testing Hypotheses
Copyright © 2014 Pearson Education, Inc. 3
Copyright © 2014 Pearson Education, Inc. 12-4
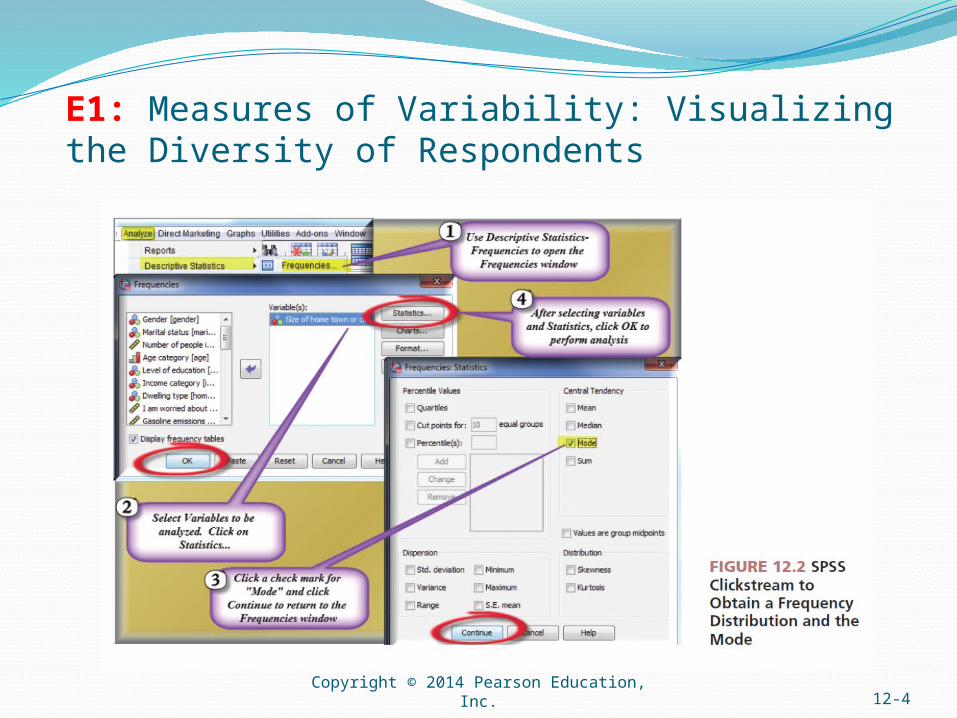
E1: Measures of Variability: Visualizing the Diversity of Respondents
Copyright © 2014 Pearson Education, Inc. 12-5
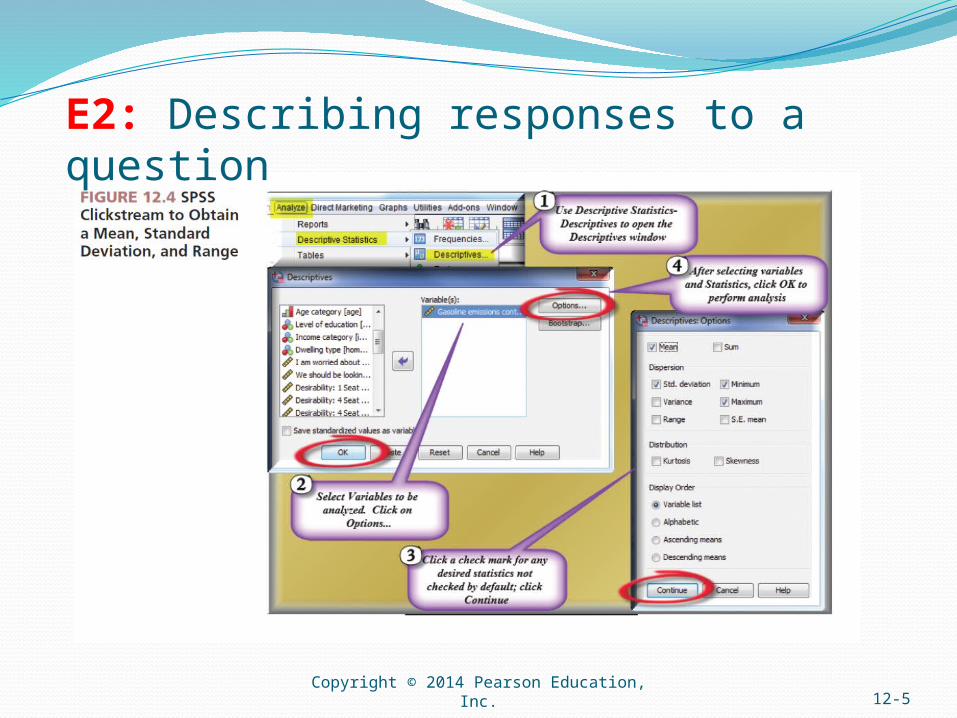
E2: Describing responses to a question

Copyright © 2014 Pearson Education, Inc. 12-6
Statistical Inference: Sample Statistics and Population ParametersStatistical inference is a set of procedures in which the sample
size and sample statistic are used to make an estimate of the corresponding population parameter.
Two types of statistical inferences:Parameter estimate is used to approximate the population
value (parameter) through the use of confidence intervals.Hypothesis testing is used to compare the sample statistic
with what is believed (hypothesized) to be the population value prior to undertaking the study.
Copyright © 2014 Pearson Education, Inc. 12-7
Statistical Inference: Sample Statistics and Population ParametersA sample statistic is usually a mean or percentage.Standard error is the measure of variability in the sampling
distribution.A confidence interval is the degree of accuracy desired by the
researcher stated in the form of a range with an upper and lower boundary.90% - lie within +/- 1.64 standard deviations95% - lie within +/- 1.96 standard deviations99% - lie within +/- 2.58 standard deviations
Copyright © 2014 Pearson Education, Inc. 12-8
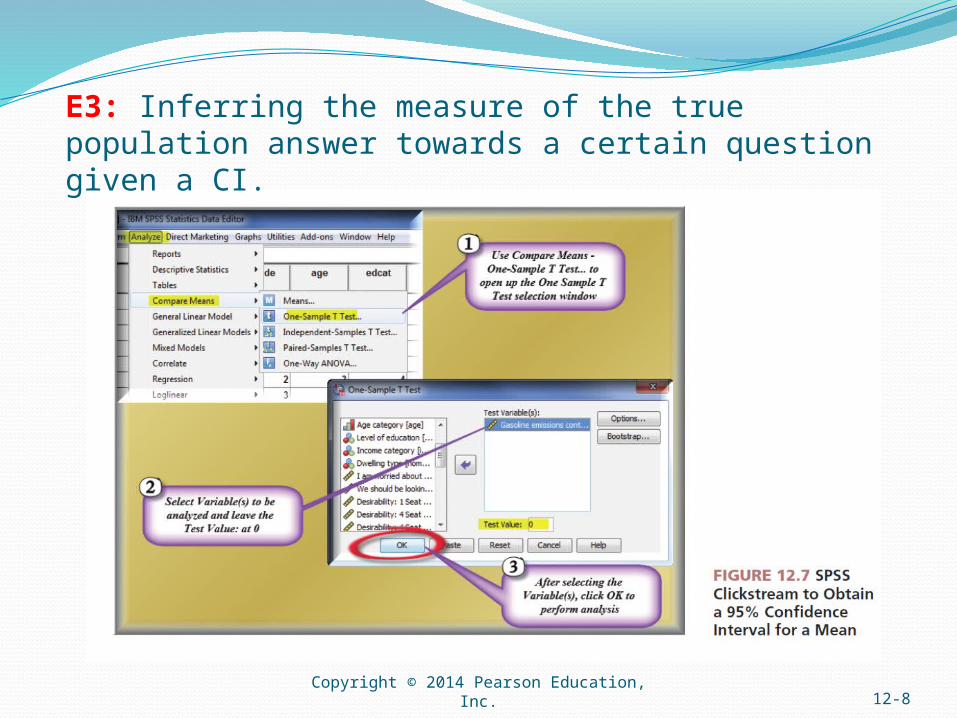
E3: Inferring the measure of the true population answer towards a certain question given a CI.
Copyright © 2014 Pearson Education, Inc. 12-9
Hypothesis TestsTests of an hypothesized population parameter value:
Test of an hypothesis about a percent or a meanThe crux of statistical hypothesis testing is the sampling
distribution concept.In statistics, the t-statistic is a ratio of the departure of an
estimated parameter from its notional value and its standard error.Does not hold if2-tailed significance < 0.05 and outside +/- 1.96 St.DHolds if2-tailed significance >/= 0.05 and within +/- 1.96 St.D
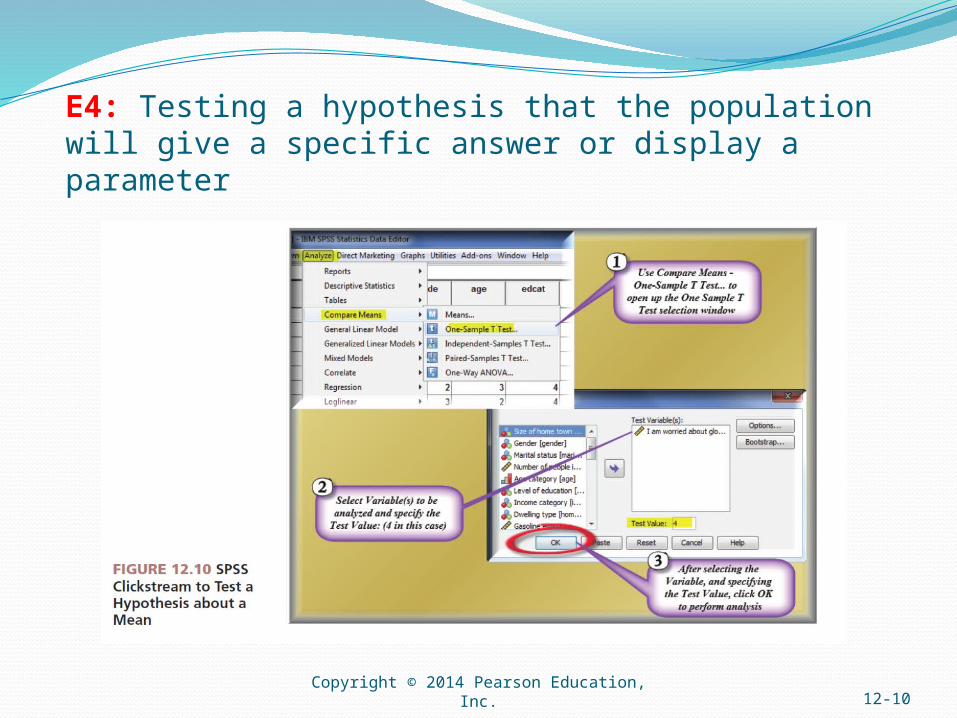
Copyright © 2014 Pearson Education, Inc. 12-10
E4: Testing a hypothesis that the population will give a specific answer or display a parameter

Chapter 13Implementing Basic Differences Tests

Copyright © 2014 Pearson Education, Inc. 12-12
Differences Between Percentages with Two Groups (Independent Samples)
Independent samples are treated as representing two potentially different populations.
Null hypothesis: the hypothesis that the difference in the population parameters is equal to zero
With a differences test, the null hypothesis states that there is no difference between the percentages (or means) being compared.
Significance of differences between two percentages - alternative to the null hypothesis is that there is a true difference between the population parameters.
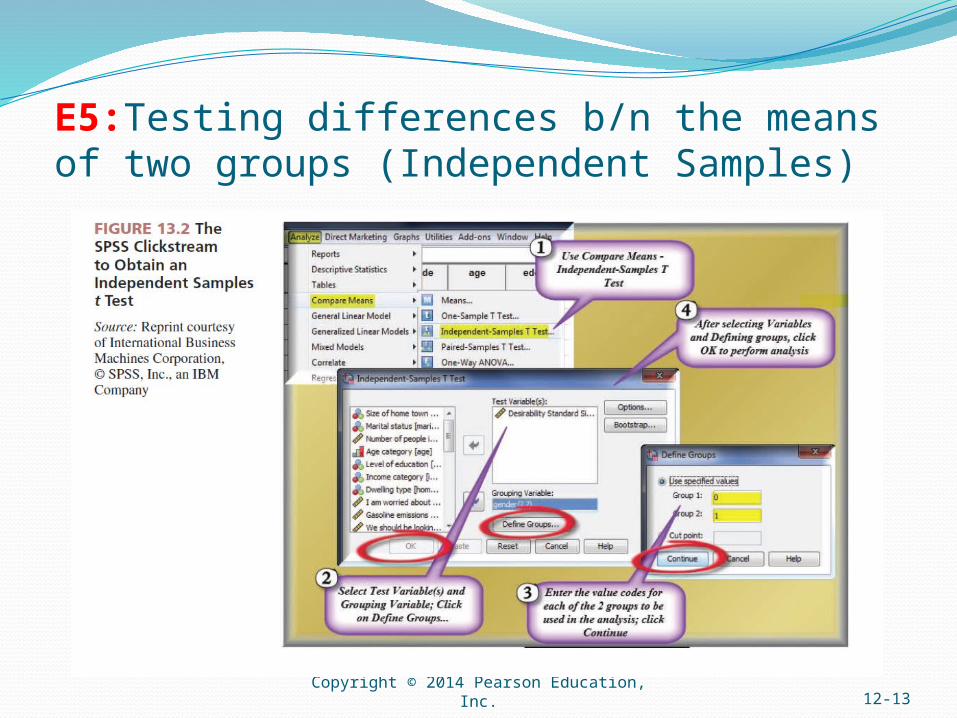
Copyright © 2014 Pearson Education, Inc. 12-13
E5:Testing differences b/n the means of two groups (Independent Samples)

Copyright © 2014 Pearson Education, Inc. 12-14
ANOVA & Post Hoc Tests: Detect Statistically Significant Differences Among Group MeansAnalysis of variance (ANOVA): used when comparing the means
of three or more groups
Post hoc tests: options that are available to determine where the pair(s) of statistically significant differences between the means exist(s)Duncan’s multiple range test: provides output that is mostly
a “picture” of what means are significantly differentThe Duncan multiple range test’s output is much less
statistical than most other post hoc tests and is easy to interpret.
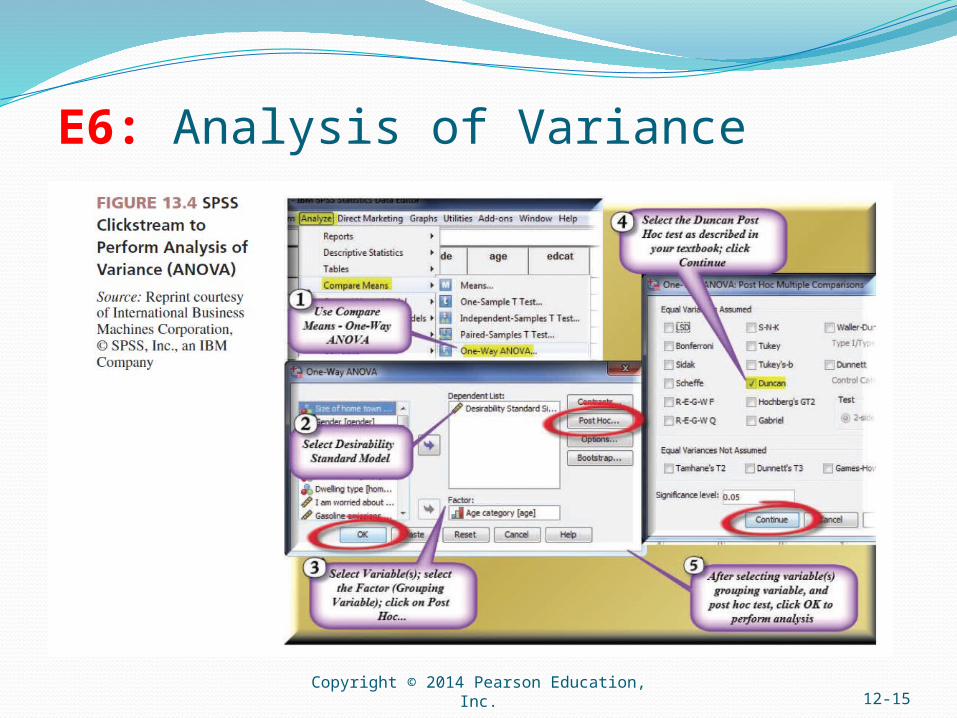
Copyright © 2014 Pearson Education, Inc. 12-15
E6: Analysis of Variance
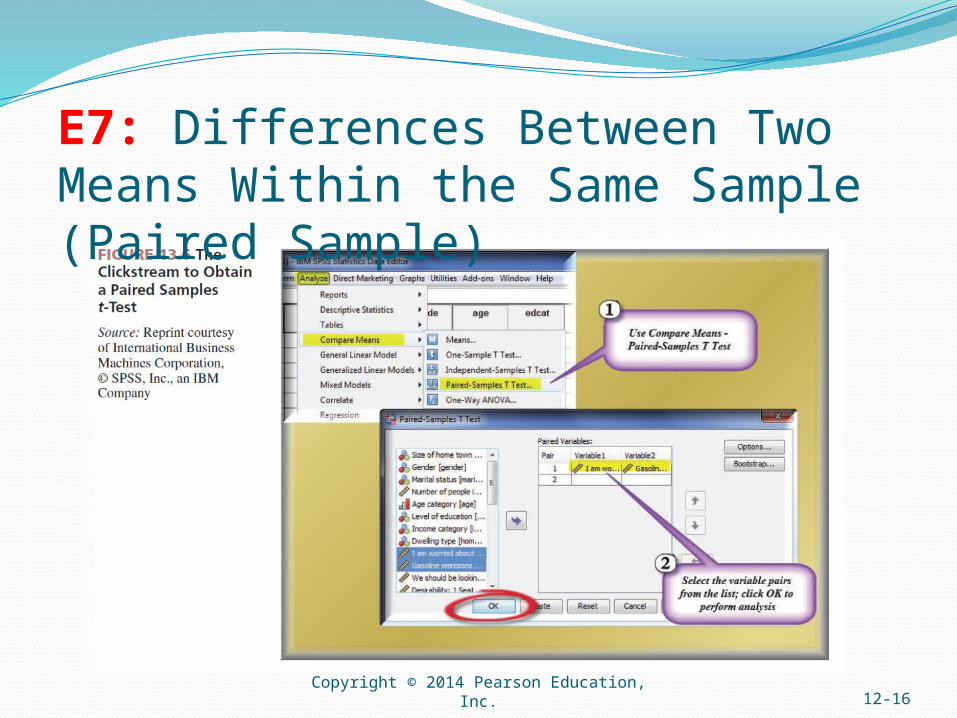
Copyright © 2014 Pearson Education, Inc. 12-16
E7: Differences Between Two Means Within the Same Sample (Paired Sample)
Chapter 14Making Use of Associations Tests
Copyright © 2014 Pearson Education, Inc. 17
Copyright © 2014 Pearson Education, Inc. 12-18
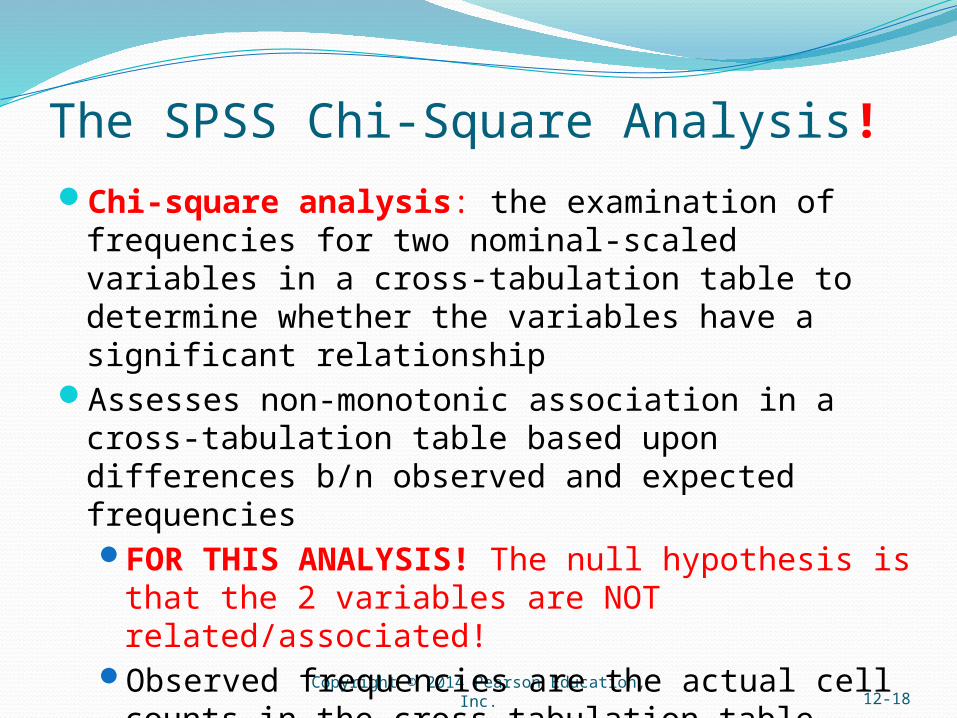
The SPSS Chi-Square Analysis!Chi-square analysis: the examination of frequencies for two
nominal-scaled variables in a cross-tabulation table to determine whether the variables have a significant relationship
Assesses non-monotonic association in a cross-tabulation table based upon differences b/n observed and expected frequenciesFOR THIS ANALYSIS! The null hypothesis is that the 2
variables are NOT related/associated!Observed frequencies are the actual cell counts in the cross-
tabulation table.FOR THIS ANALYSIS! In order for the Hypothesis to hold we
are looking for a P value that is > to 0.05 (it means no association), if it is ≤ to 0.05 it means that there is association
Copyright © 2014 Pearson Education, Inc. 12-19
E8: Chi-Square Analysis
Copyright © 2014 Pearson Education, Inc. 12-20
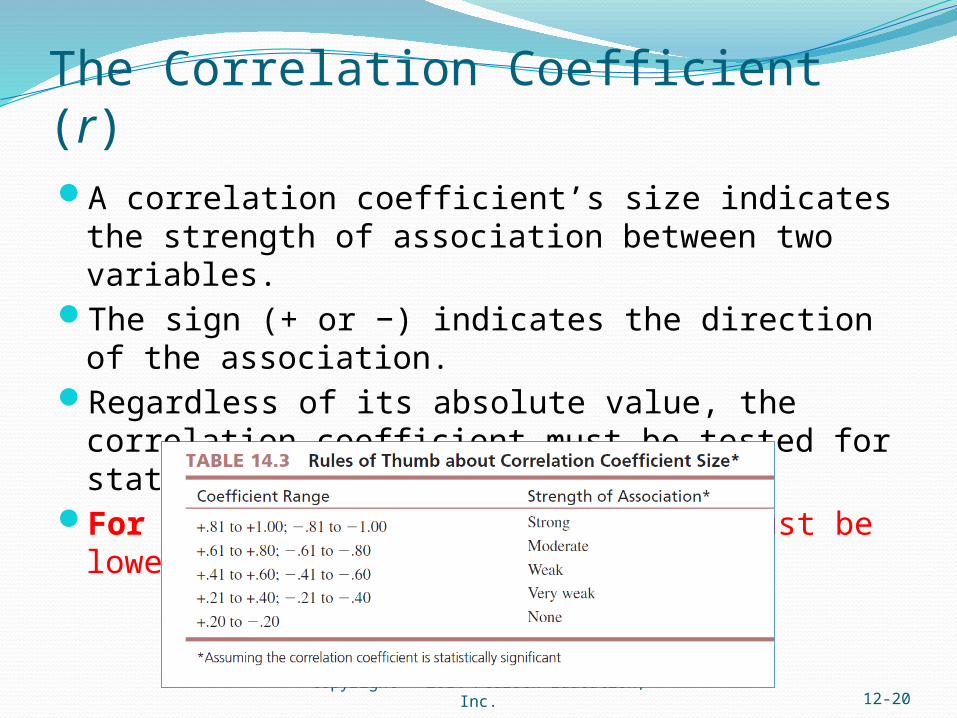
The Correlation Coefficient (r)A correlation coefficient’s size indicates the strength of
association between two variables.The sign (+ or −) indicates the direction of the association.Regardless of its absolute value, the correlation coefficient
must be tested for statistical significance.For this test! the Sig. (2-tailed must be lower than 0.05)
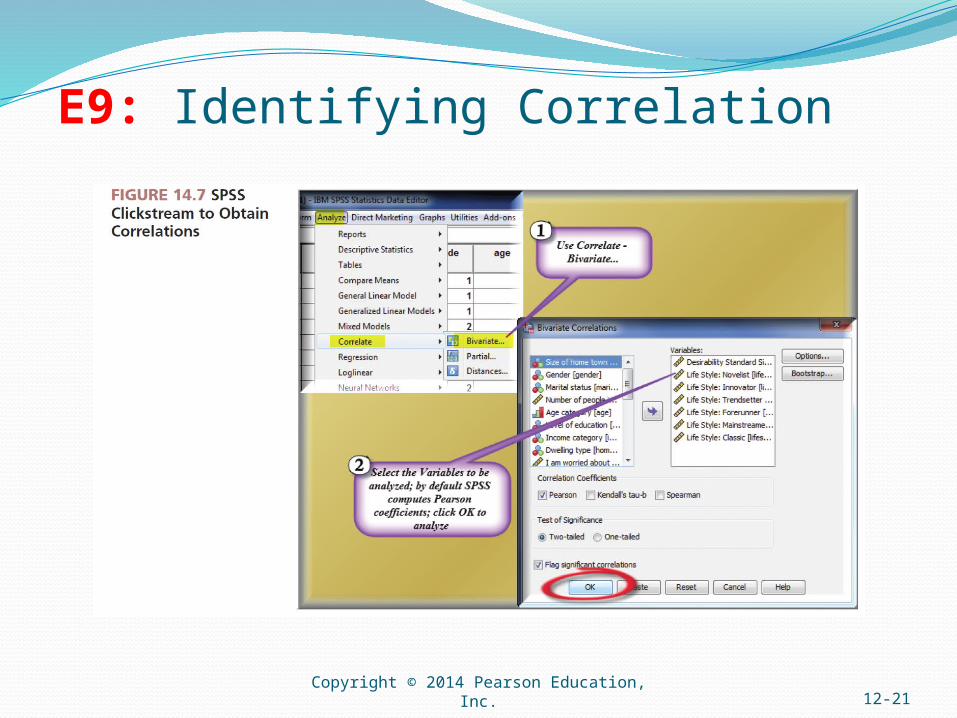
Copyright © 2014 Pearson Education, Inc. 12-21
E9: Identifying Correlation