Copyright © 2010 Pearson Education, Inc. Publishing as Prentice Hall.
Upload
marjorie-smallCategory
view
213download
0
Copyright © 2014 Pearson Education, Inc. publishing as Prentice Hall 13 - 1

Copyright © 2014 Pearson Education, Inc. publishing as Prentice Hall 13 - 2
Chapter 13
Accounting for Overhead Costs

Copyright © 2014 Pearson Education, Inc. publishing as Prentice Hall 13 - 3
Chapter 13 Learning Objectives
1. Compute budgeted factory-overhead rates and apply factory overhead to production.
2. Determine and use appropriate cost-allocation bases for overhead application to products and services.
3. Use normalized variable- and fixed-overhead application rates and explain the disposition
of overhead variances.

Copyright © 2014 Pearson Education, Inc. publishing as Prentice Hall 13 - 4
4. Compare variable- and absorption-costing systems.
5. Construct an income statement using the variable-costing approach.
6. Construct an income statement using the absorption-costing approach.
Chapter 13 Learning Objectives
Copyright © 2014 Pearson Education, Inc. publishing as Prentice Hall 13 - 5
7. Distinguish between product-costing and planning-and-control purposes in accounting for variable and fixed costs.
8. Compute the production-volume variance and show how it should appear in the income statement.
9. Reconcile variable- and absorption-costing operating income and explain why a company
might prefer to use a variable-costing approach.
Chapter 13 Learning Objectives

Copyright © 2014 Pearson Education, Inc. publishing as Prentice Hall 13 - 6
Accounting for Factory Overhead
Methods for assigning overhead coststo the products are an important part of
accurately measuring product costs.
LearningObjective 1
Years ago, direct materials and direct labor were the largest costs for most
companies. Today, automated companies have lower direct labor costs but much
larger overhead costs.

Copyright © 2014 Pearson Education, Inc. publishing as Prentice Hall 13 - 7
Budgeted Overhead Application Rates
1. Select one or more cost-allocation bases.2. Prepare a factory overhead budget.3. Compute the factory overhead rate.4. Obtain actual cost-allocation base data.5.Apply the budgeted overhead to the
products or services.6. Account for any differences between the amount of overhead actually incurred and overhead applied.

Copyright © 2014 Pearson Education, Inc. publishing as Prentice Hall 13 - 8
Total budgeted Amount of cost driver
Budgeted Overhead Application Rates
Overhead rates are budgeted; they are estimates. The budgeted rates are used to apply overhead based on actual events.
Total budgeted Factory overhead
Budgeted overhead
application rate
=

Copyright © 2014 Pearson Education, Inc. publishing as Prentice Hall 13 - 9
Illustration of Overhead Application
Enriquez Machine Parts Company selects a single cost-allocation in each department for applying overhead, machine hours in machining and direct-labor in assembly.

Copyright © 2014 Pearson Education, Inc. publishing as Prentice Hall 13 - 10
Illustration of Overhead Application
Thus, we would apply $44 of overhead to aproduct that uses 6 MH in machining and incurs direct-labor cost of $40 in assembly.
Machining: 6 actual MH X $4 per MH= $24Assembly: $40 of DL cost X 50% = 20Total overhead $44
Total overhead applied to a particular product equals budgeted overhead rates multiplied by actual machine hours (MH) or labor cost (LC) used by that product.

Copyright © 2014 Pearson Education, Inc. publishing as Prentice Hall 13 - 11
Illustration of Overhead Application
Suppose that at the end of the year Enriquezhad used 70,000 machine hours in Machining.
How much overhead was applied to Machining?
Copyright © 2014 Pearson Education, Inc. publishing as Prentice Hall 13 - 12
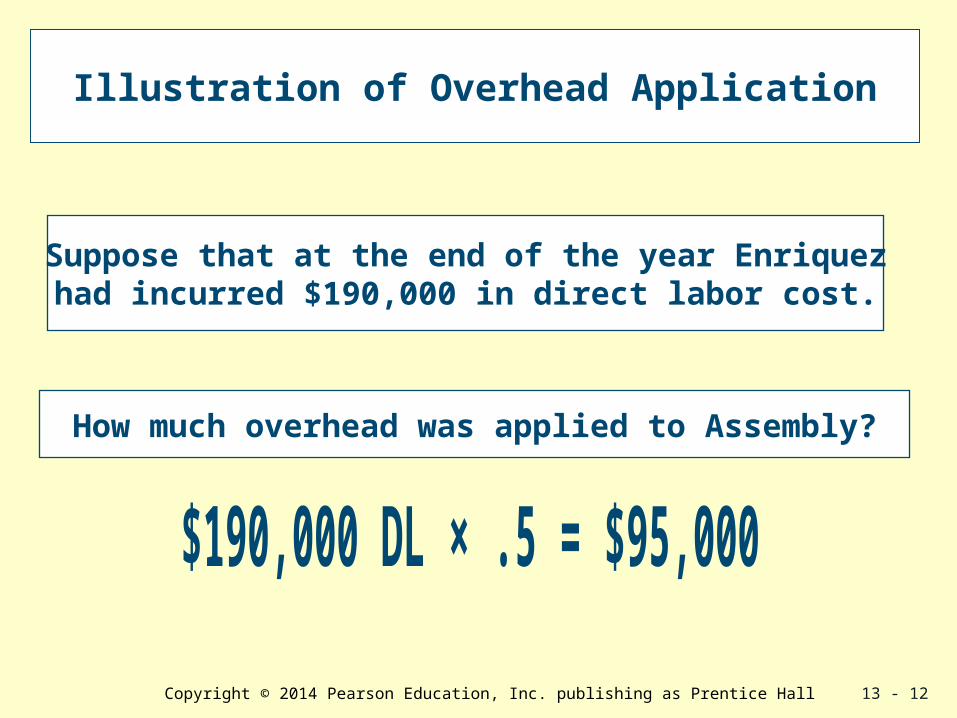
Illustration of Overhead Application
Suppose that at the end of the year Enriquezhad incurred $190,000 in direct labor cost.
How much overhead was applied to Assembly?

Copyright © 2014 Pearson Education, Inc. publishing as Prentice Hall 13 - 13
Illustration of Overhead Application
Total factory overhead applied: Machining: $280,000
Assembly: 95,000Total Factory Overhead Applied $375,000
The $375,000 is an estimate of Enriquez’s overhead for the year, and it will become part of the cost of goods sold expense on Enriquez’s income statement when the units produced are subsequently sold.

Copyright © 2014 Pearson Education, Inc. publishing as Prentice Hall 13 - 14
Choice of Cost-Allocation Bases
No one cost-allocation base is right for all situations. A separate cost pool should be
identified for each cost-allocation base.
The accountant’s goal is to find the cost-allocation base that best links cause and effect.
LearningObjective 2
Base 1 Pool 1
Base 2 Pool 2

Copyright © 2014 Pearson Education, Inc. publishing as Prentice Hall 13 - 15
Normalized Overhead Rates
“Normal” product costs includean average or normalized
chunk of overhead.
Actual direct material+ Actual direct labor+ Normal applied overhead= Cost of manufactured product
LearningObjective 3

Copyright © 2014 Pearson Education, Inc. publishing as Prentice Hall 13 - 16
Disposing of Underapplied or Overapplied Overhead
Recall that Enriquez applied$375,000 to its products, but . . .
it incurred $392,000 of actual manufacturing overhead during the year.
$392,000 actual overhead–375,000 applied overhead $ 17,000 underapplied overhead
The $375,000 becomes part of Cost of Goods Sold when the product is sold, however . . .

Copyright © 2014 Pearson Education, Inc. publishing as Prentice Hall 13 - 17
Disposing of Underapplied or Overapplied Overhead
The applied overhead is $17,000 less than the amount incurred. It is:
Overapplied overhead occurs when the amount applied exceeds the amount incurred.
A company must report actual costs incurred in its financial statements.

Copyright © 2014 Pearson Education, Inc. publishing as Prentice Hall 13 - 18
Disposing of Underapplied or Overapplied Overhead
1) Write-off to cost of goods sold
2) Proration, apportioning over- or underapplied overhead to cost of goods sold, work-in-process inventory, and finished-goods inventory in proportion to the ending balances of each account.
Accountants uses two methods for the adjustment:

Copyright © 2014 Pearson Education, Inc. publishing as Prentice Hall 13 - 19
Immediate Write-Off
Cost of Goods Sold
Incurred Overhead (Actual)
Applied Overhead
(Budgeted)
This method regards the $17,000 as a reduction in current income and adds it to Cost of Goods Sold.

Copyright © 2014 Pearson Education, Inc. publishing as Prentice Hall 13 - 20
Prorating Among Inventories
This method prorates the $17,000 of underapplied overhead to Work-In-Process (WIP),Finished Goods, and Cost of Goods Sold accounts.
Companies generally prorate overhead variances only when material.

Copyright © 2014 Pearson Education, Inc. publishing as Prentice Hall 13 - 21
Variable and Fixed Application Rates
The presence of fixed costs is amajor reason of costing difficulties.
Some companies distinguish betweenvariable overhead and fixed
overhead for product costing.

Copyright © 2014 Pearson Education, Inc. publishing as Prentice Hall 13 - 22
Variable Versus Absorption Costing
Variable costing excludes fixed manufacturing overhead from the cost of products.
Absorption costing includes fixed manufacturing overhead in the cost of products.
Variablecosting
Absorptioncosting
LearningObjective 4

Copyright © 2014 Pearson Education, Inc. publishing as Prentice Hall 13 - 23
Variable Versus Absorption Costing

Copyright © 2014 Pearson Education, Inc. publishing as Prentice Hall 13 - 24
Facts for Illustration
Direct material $205Direct labor 75Variable manufacturing overhead 20Standard variable costs per unit $300
Basic Production Data at Standard Cost

Copyright © 2014 Pearson Education, Inc. publishing as Prentice Hall 13 - 25
Facts for Illustration
The annual budget for fixed manufacturing overhead is $1,500,000
Budgeted production is 15,000 computers.
Sales price = $500 per unit
$20 per computer is variable overhead.
Sales commissions = 5% of dollar sales
Fixed S&A expenses = $650,000

Copyright © 2014 Pearson Education, Inc. publishing as Prentice Hall 13 - 26
Facts for Illustration
There are no variances from the standard variable manufacturing or selling and administrative costs, the actual fixed manufacturing overhead incurred is $1,500,000 each year, and the actual fixed selling and administrative cost is $650,000 each year.
Actual product quantities are:

Copyright © 2014 Pearson Education, Inc. publishing as Prentice Hall 13 - 27
Comparative Income Statement Using Variable-Costing
LearningObjective 5
Desk PC Division: Comparative Income Statements

Copyright © 2014 Pearson Education, Inc. publishing as Prentice Hall 13 - 28
Fixed-Overhead Rate
The fixed-overhead rate is theamount of fixed manufacturing
overhead applied to eachunit of production.
$1,500,000 ÷ 15,000 = $100
budgeted fixed manufacturing overhead expected volume of production
Fixed overhead rate =

Copyright © 2014 Pearson Education, Inc. publishing as Prentice Hall 13 - 29
Absorption-Costing Method Comparative Income Statement
Desk PC Division: Comparative Income Statements
LearningObjective 6

Copyright © 2014 Pearson Education, Inc. publishing as Prentice Hall 13 - 30
Variable Costing vs. Absorption Costing
On a variable-costing income statement, costs Are separated into the
Major categories of fixed and variable.
Revenue less all variable costs (both manufacturing and non-manufacturing) is the contribution margin.

Copyright © 2014 Pearson Education, Inc. publishing as Prentice Hall 13 - 31
Variable Costing and Absorption Costing
On an absorption-costing income statement, costs are separated into
the major categories of manufacturing and non-manufacturing.
Revenue less manufacturing costs (both fixed and variable) is gross
profit or gross margin.

Copyright © 2014 Pearson Education, Inc. publishing as Prentice Hall 13 - 32
Product-costing and planning-and-control purposes in accounting for
variable and fixed costs.
Variable and Fixed Unit Costs:To stress the basic assumptions behind absorption costing, split manufacturing
overhead into variable and fixed components.
LearningObjective 7
The differences between variable- and absorption-costing formats arise because the two formats treat fixed manufacturing
overhead differently.

Copyright © 2014 Pearson Education, Inc. publishing as Prentice Hall 13 - 33
Fixed Overhead and Absorption Costs of Product
(2) the manufacturing overhead costs applied to products under an
absorption-costing system
(1) the manufacturing overhead costs in theflexible budget used for departmental
budgeting and control purposes
Compare
With

Copyright © 2014 Pearson Education, Inc. publishing as Prentice Hall 13 - 34
Variable Overhead Costs
The expected variable-overhead costs from the flexible budget are the same as the variable-overhead costs applied to the products.

Copyright © 2014 Pearson Education, Inc. publishing as Prentice Hall 13 - 35
Fixed Overhead Costs
The graph for applied fixed-overhead costs differs from that for the flexible budget.

Copyright © 2014 Pearson Education, Inc. publishing as Prentice Hall 13 - 36
Production-Volume Variance
Production-volume variance =(actual volume – expected volume) X fixed overhead rate
In practice, accountants often call the production-volume variance
simply the volume variance.
The difference between applied and budgeted fixed overhead is the production-volume variance.
Learning Objective 8

Copyright © 2014 Pearson Education, Inc. publishing as Prentice Hall 13 - 37
Production-Volume Variance
2. When actual volume is less than expected volume, the production-volume variance is unfavorable because usage of facilities is less than expected and fixed overhead is underapplied.
1. When expected production volume and actual production volume are identical, there is no production-volume variance.
A production-volume variance arises when the actual production volume achieved does not
coincide with the expected volume of production used as a denominator for computing the fixed-
overhead rate for product-costing purposes:

Copyright © 2014 Pearson Education, Inc. publishing as Prentice Hall 13 - 38
Reconciliation of Absorption-Costing and Variable-Costing
The difference in variable-costing and absorption-costing operating income can be explained by multiplying the fixed-overhead
product-costing rate by the change in the total units in the beginning and ending inventories.
Consider 20X1: The change in inventory was 2,000 units, so the difference in net income
would be 2,000 units × $100 = $200,000.
Learning Objective 9

Copyright © 2014 Pearson Education, Inc. publishing as Prentice Hall 13 - 39
Effects of Sales and Productionon Reported Income
The relationship between sales and production determines the difference between
variable-costing and absorption-costing income.
Whenever units sold are greater than (less than) units produced, variable-costing income is greater than (less than) absorption costing income.
This means that when inventories decrease (increase), variable-costing income is greater than (less than) absorption-costing income.

Copyright © 2014 Pearson Education, Inc. publishing as Prentice Hall 13 - 40
All rights reserved. No part of this publication may be reproduced, stored in a retrieval system, or transmitted, in any form or by any means, electronic, mechanical, photocopying, recording, or otherwise, without the prior written permission of the publisher. Printed in the United States of America.