Copyright © 2012 Pearson Education, Inc. Publishing as Addison Wesley 1.3 Linear Functions, Slope,...
24
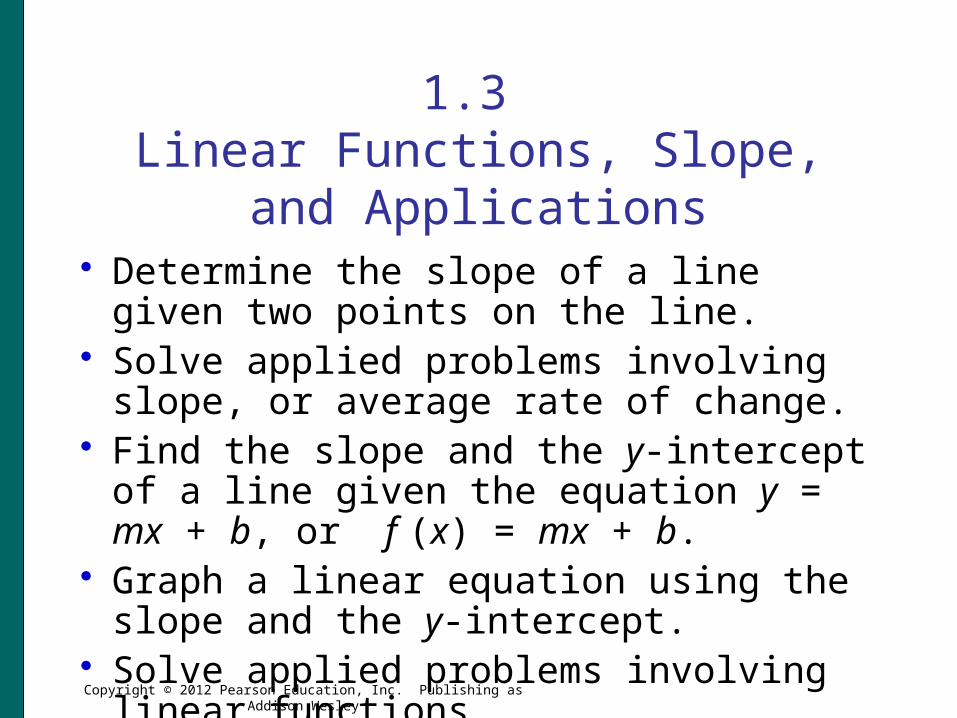
Copyright © 2012 Pearson Education, Inc. Publishing as Addison Wesley 1.3 Linear Functions, Slope, and Applications Determine the slope of a line given two points on the line. Solve applied problems involving slope, or average rate of change. Find the slope and the y-intercept of a line given the equation y = mx + b, or f (x) = mx + b. Graph a linear equation using the slope and the y-intercept. Solve applied problems involving linear functions.
-
Upload
daniella-shepherd -
Category
Documents
-
view
215 -
download
2
Transcript of Copyright © 2012 Pearson Education, Inc. Publishing as Addison Wesley 1.3 Linear Functions, Slope,...
Copyright © 2012 Pearson Education, Inc. Publishing as Addison Wesley
1.3 Linear Functions, Slope, and
Applications Determine the slope of a line given two points on
the line. Solve applied problems involving slope, or average
rate of change. Find the slope and the y-intercept of a line given the
equation y = mx + b, or f (x) = mx + b. Graph a linear equation using the slope and the y-
intercept. Solve applied problems involving linear functions.
Slide 1.3 - 2Copyright © 2012 Pearson Education, Inc. Publishing as Addison Wesley
Linear Functions
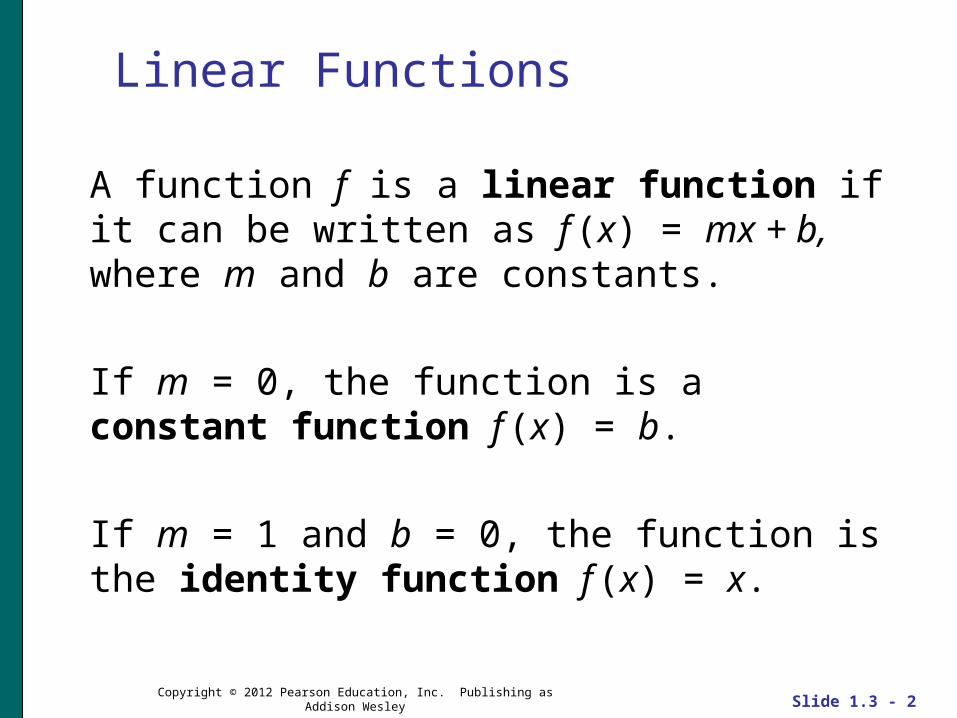
A function f is a linear function if it can be written as f (x) = mx + b, where m and b are constants.
If m = 0, the function is a constant function f (x) = b.
If m = 1 and b = 0, the function is the identity function f (x) = x.

Slide 1.3 - 3Copyright © 2012 Pearson Education, Inc. Publishing as Addison Wesley
Examples
Linear Function
y = mx + b
Identity Function
y = 1•x + 0 or y = x1 25
y x
Slide 1.3 - 4Copyright © 2012 Pearson Education, Inc. Publishing as Addison Wesley
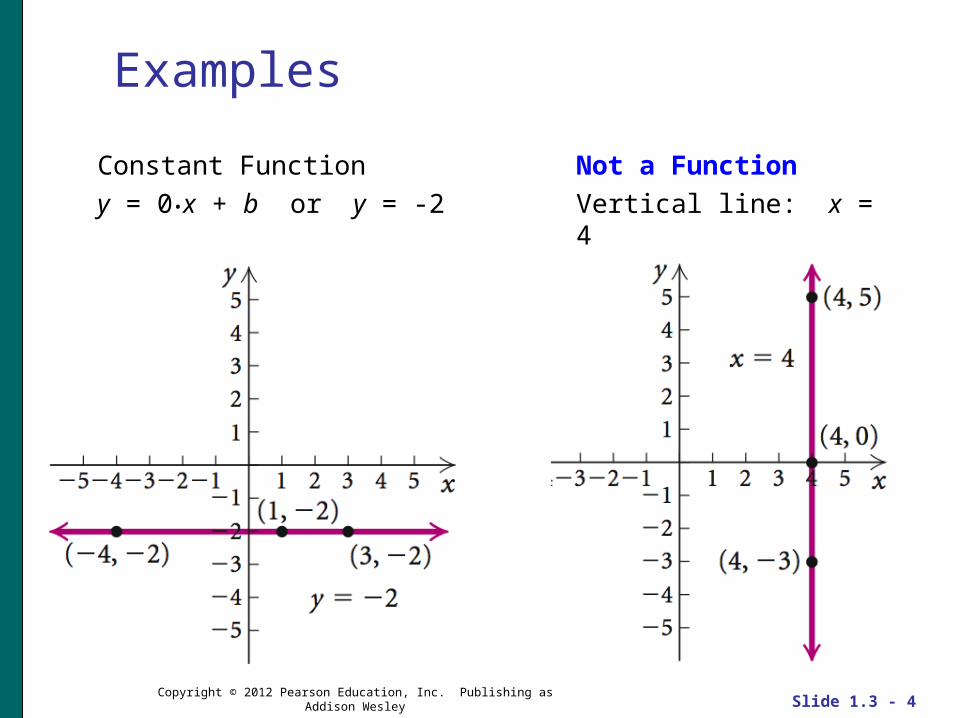
Examples
Constant Function
y = 0•x + b or y = -2
Not a Function
Vertical line: x = 4
Slide 1.3 - 5Copyright © 2012 Pearson Education, Inc. Publishing as Addison Wesley
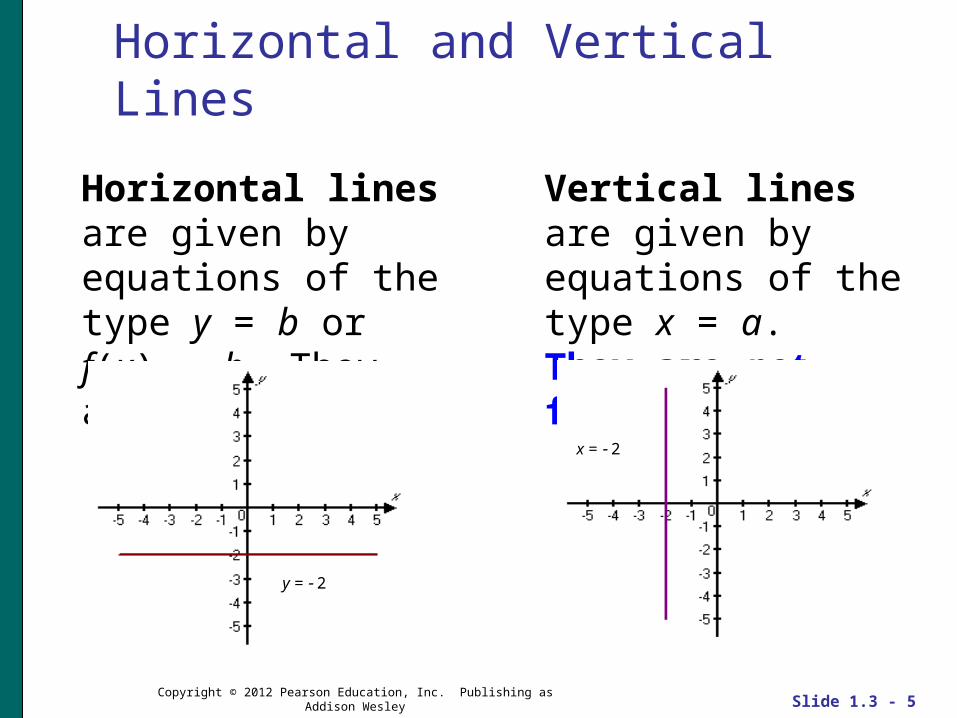
Horizontal and Vertical Lines
Horizontal lines are given by equations of the type y = b or f(x) = b. They are functions.
Vertical lines are given by equations of the type x = a. They are not functions.
y = 2
x = 2

Slide 1.3 - 6Copyright © 2012 Pearson Education, Inc. Publishing as Addison Wesley
Slope
The slope m of a line containing the points (x1, y1) and (x2, y2) is given by
m rise
run
the change in y
the change in x
y2 y1
x2 x1
y1 y2
x1 x2

Slide 1.3 - 7Copyright © 2012 Pearson Education, Inc. Publishing as Addison Wesley
ExampleGraph the function and determine its slope.
2( ) 3 3
3 3 6 3
1; (3,
3
1)
y
y
y
2 3 3x y
Solution: Calculate two ordered pairs, plot the points, graph the function, and determine its slope.
2( ) 3 3
3 3 18
9
15
5; (9, 5)
y
y
y
3:x
9 :x
Slide 1.3 - 8Copyright © 2012 Pearson Education, Inc. Publishing as Addison Wesley
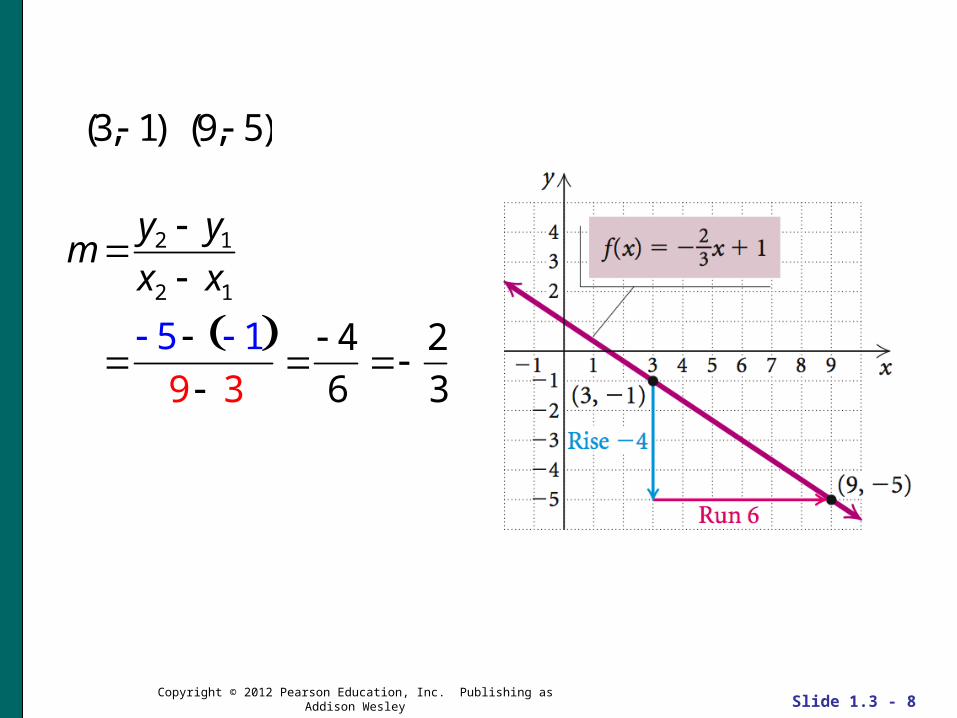
m y2 y1
x2 x1
5 1
9 3
4
6
2
3
(3, 1) (9, 5)
Slide 1.3 - 9Copyright © 2012 Pearson Education, Inc. Publishing as Addison Wesley
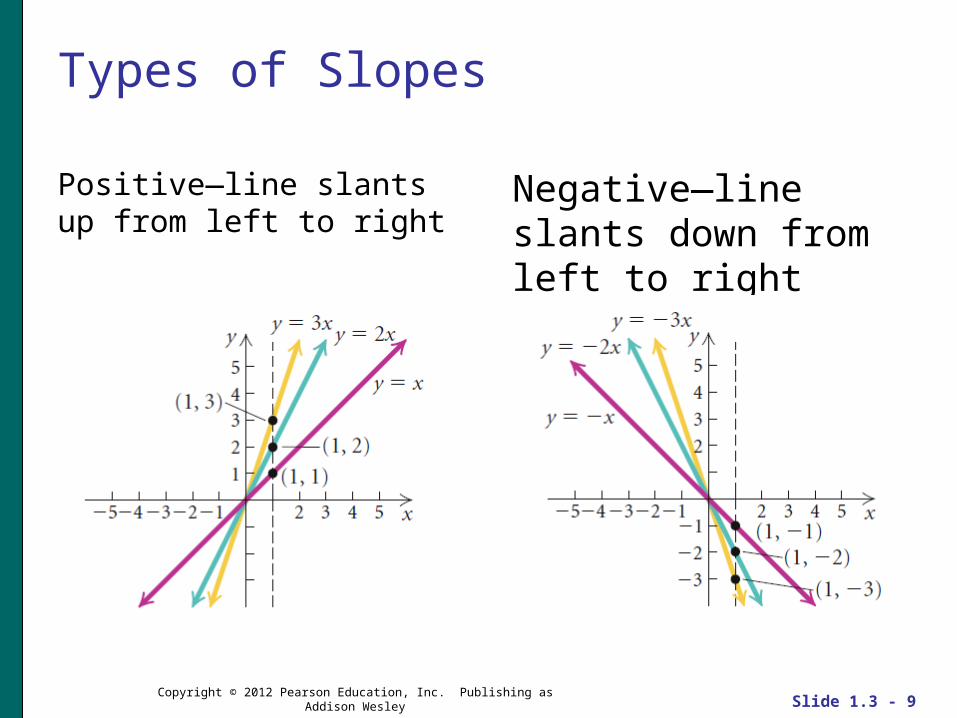
Types of Slopes
Positive—line slants up from left to right
Negative—line slants down from left to right

Slide 1.3 - 10Copyright © 2012 Pearson Education, Inc. Publishing as Addison Wesley
Horizontal Lines
If a line is horizontal, the change in y for any two points is 0 and the change in x is nonzero. Thus a horizontal line has slope 0.
Slide 1.3 - 11Copyright © 2012 Pearson Education, Inc. Publishing as Addison Wesley
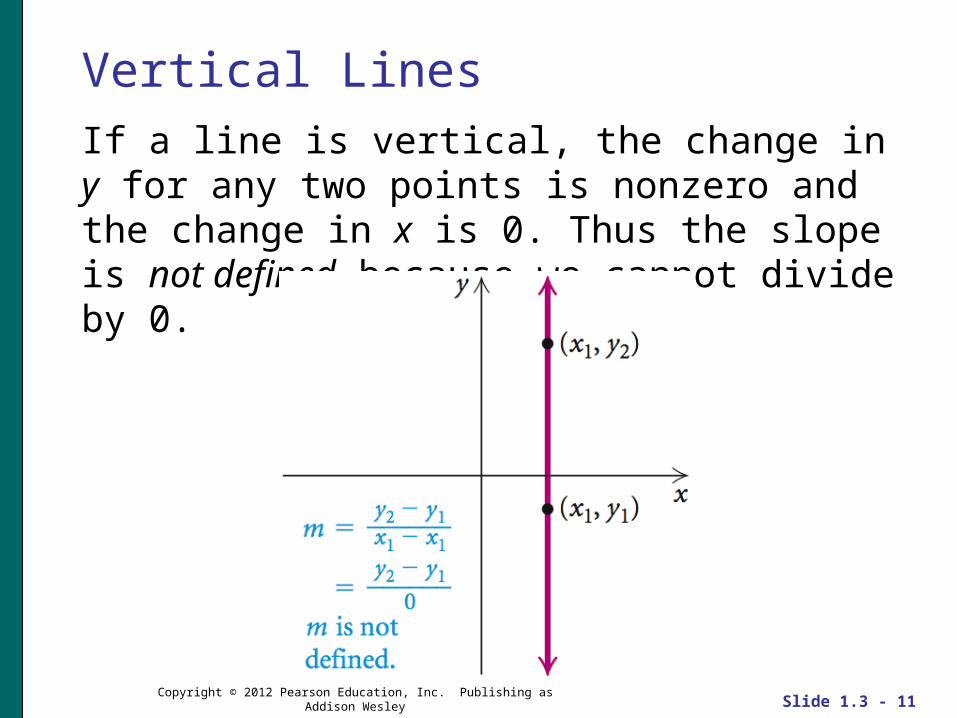
Vertical Lines
If a line is vertical, the change in y for any two points is nonzero and the change in x is 0. Thus the slope is not defined because we cannot divide by 0.
Slide 1.3 - 12Copyright © 2012 Pearson Education, Inc. Publishing as
Addison Wesley
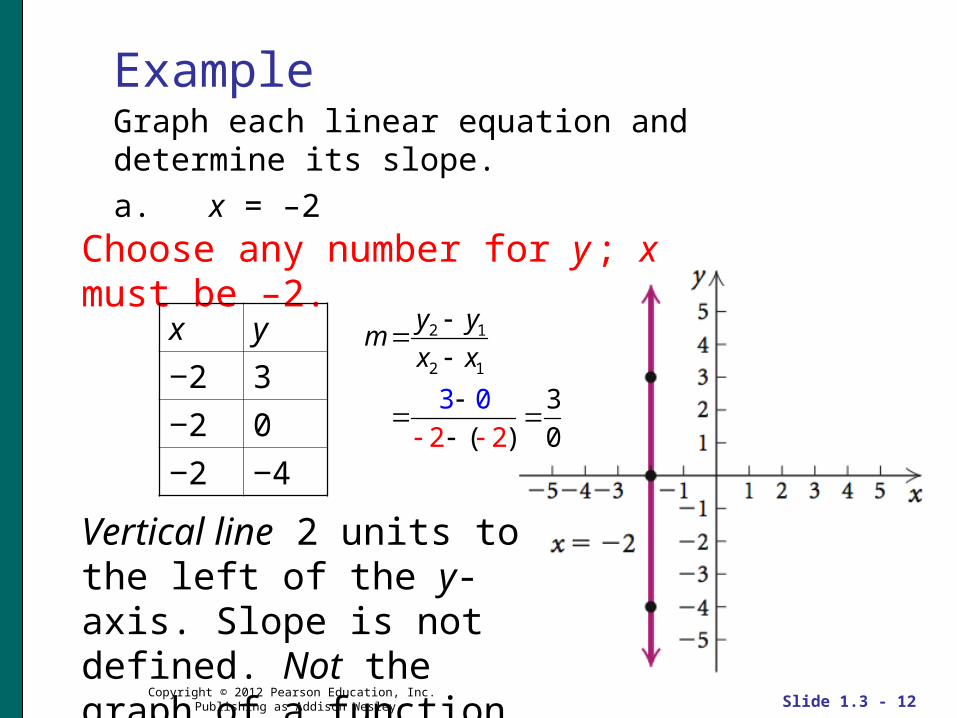
ExampleGraph each linear equation and determine its slope.
a. x = –2
Choose any number for y ; x must be –2.
Vertical line 2 units to the left of the y-axis. Slope is not defined. Not the graph of a function.
x y
‒2 3
‒2 0
‒2 ‒4
2 1
2 1
3 0 3
( ) 02 2
y ym
x x

Slide 1.3 - 13Copyright © 2012 Pearson Education, Inc. Publishing as Addison Wesley
Example (continued)
Graph each linear equation and determine its slope.
b.
Horizontal line 5/2 units above the x-axis. Slope 0. The graph is that of a constant function.
y 5
2Choose any number for x ; y must be
5
2.
x 0 –3 1
5 25 25 2
y 2 1
2 1
5 52 2
00
3
0
3
y ym
x x
Slide 1.3 - 14Copyright © 2012 Pearson Education, Inc. Publishing as Addison Wesley
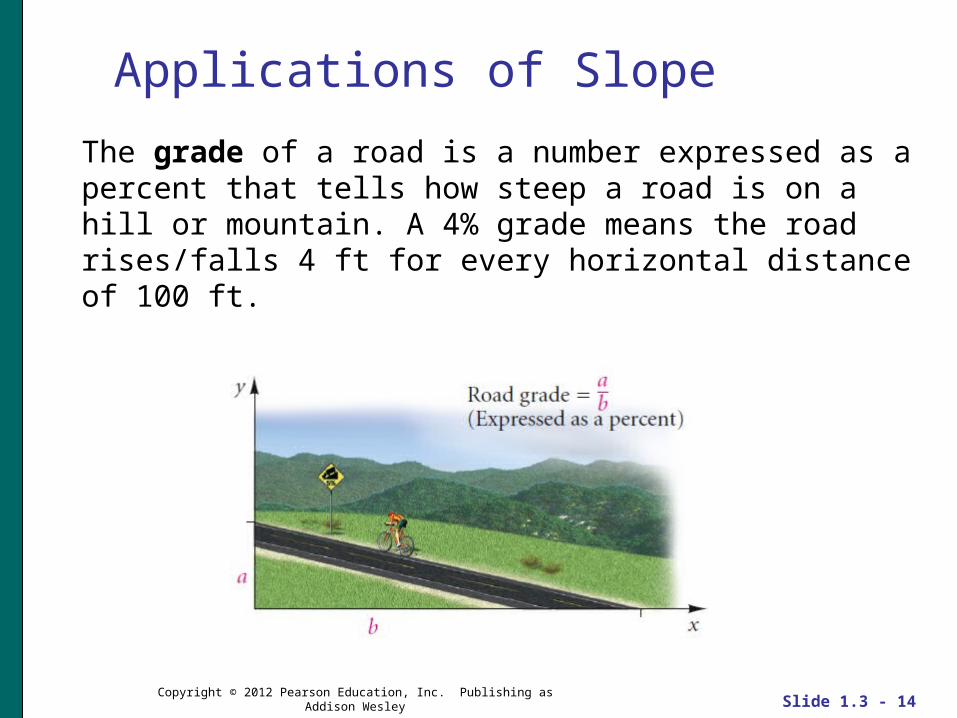
Applications of Slope
The grade of a road is a number expressed as a percent that tells how steep a road is on a hill or mountain. A 4% grade means the road rises/falls 4 ft for every horizontal distance of 100 ft.
Slide 1.3 - 15Copyright © 2012 Pearson Education, Inc. Publishing as Addison Wesley
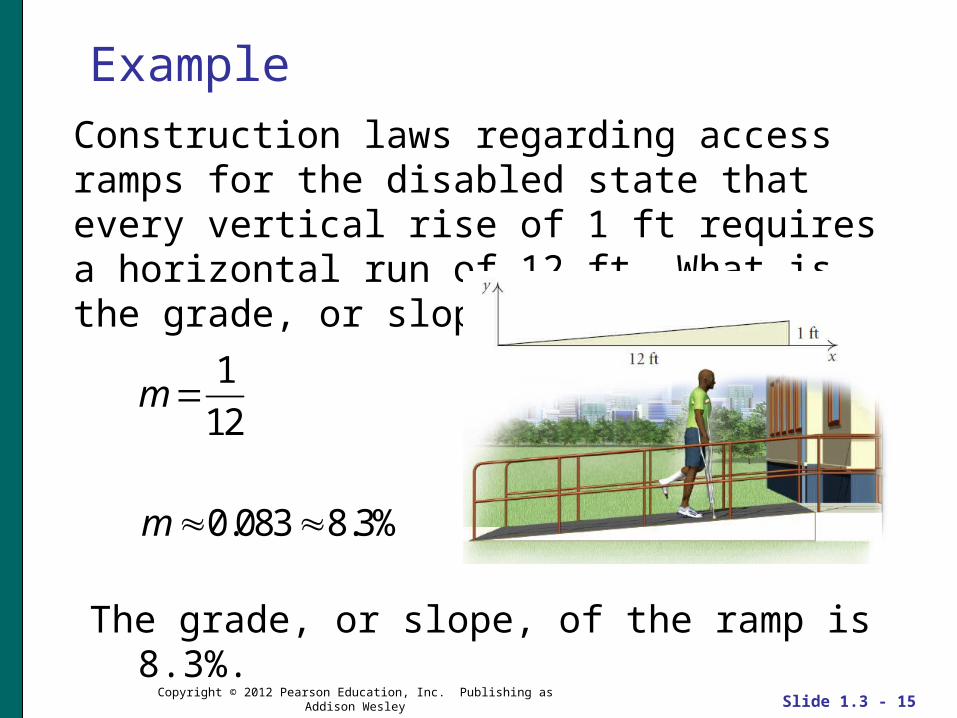
Example
The grade, or slope, of the ramp is 8.3%.
Construction laws regarding access ramps for the disabled state that every vertical rise of 1 ft requires a horizontal run of 12 ft. What is the grade, or slope, of such a ramp?
m 1
12
m 0.083 8.3%

Slide 1.3 - 16Copyright © 2012 Pearson Education, Inc. Publishing as Addison Wesley
Average Rate of Change
Slope can also be considered as an average rate of change. To find the average rate of change between any two data points on a graph, we determine the slope of the line that passes through the two points.

Slide 1.3 - 17Copyright © 2012 Pearson Education, Inc. Publishing as Addison Wesley
Example
The percent of American adolescents ages 12 to 19 who are obese increased from about 6.5% in 1985 to 18% in 2008. The graph below illustrates this trend. Find the average rate of change in the percent of adolescents who are obese from 1985 to 2008.

Slide 1.3 - 18Copyright © 2012 Pearson Education, Inc. Publishing as Addison Wesley
Example
The coordinates of the two points on the graph are (1985, 6.5%) and (2008, 18%).
Slope Average rate of change Change in y
Change in x
2008 1985
18% 6. 11.55 %%0.5%
23
The average rate of change over the 23-yr period was
an increase of 0.5% per year.

Slide 1.3 - 19Copyright © 2012 Pearson Education, Inc. Publishing as Addison Wesley
Slope-Intercept Equation
The linear function f given by f (x) = mx + b is written in slope-intercept form. The graph of an equation in this form is a straight line parallel to f (x) = mx.
The constant m is called the slope, and they-intercept is (0, b).
Slide 1.3 - 20Copyright © 2012 Pearson Education, Inc. Publishing as Addison Wesley
Example
Find the slope and y-intercept of the line with equation y = – 0.25x – 3.8.
Solution: y = – 0.25x – 3.8
Slope = –0.25; y-intercept = (0, –3.8)

Slide 1.3 - 21Copyright © 2012 Pearson Education, Inc. Publishing as Addison Wesley
Example
Find the slope and y-intercept of the line with equation 3x – 6y 7 = 0.
Solution: We solve for y: 3x 6y 7 0
Thus, the slope is and the y-intercept is1
20,
7
6
.
6y 3x 7
1
6( 6y)
1
6( 3x 7)
y 1
2x
7
6
Slide 1.3 - 22Copyright © 2012 Pearson Education, Inc. Publishing as
Addison Wesley
Example
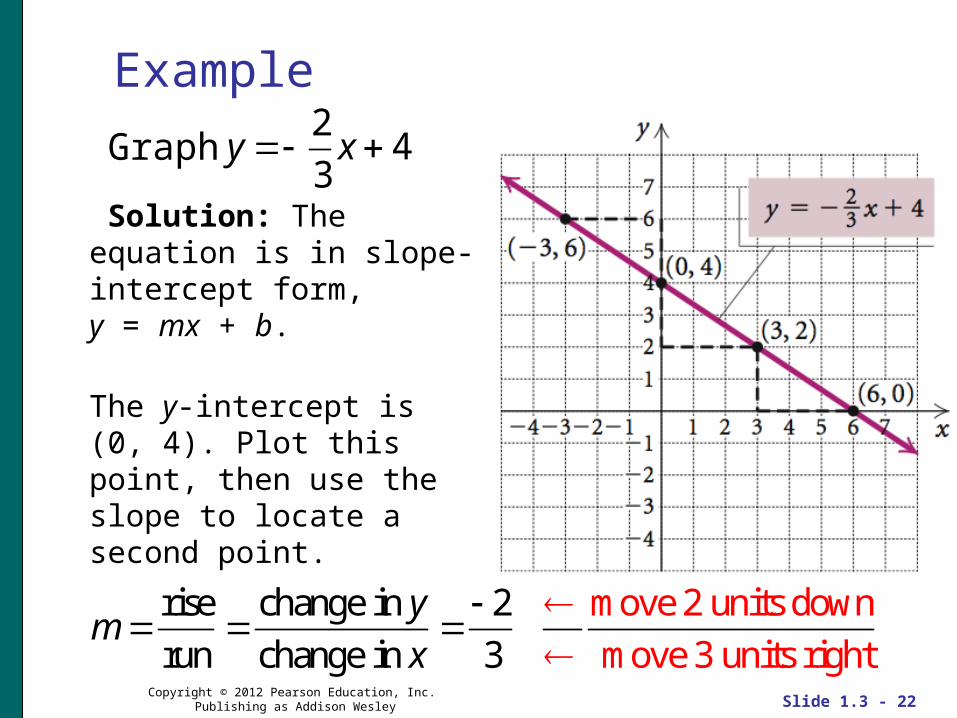
Solution: The equation is in slope-intercept form, y = mx + b.
The y-intercept is (0, 4). Plot this point, then use the slope to locate a second point.
y 2
3x 4
m rise
run
change in y
change in x
2
3
move 2 units down
move 3 units right
Graph
Slide 1.3 - 23Copyright © 2012 Pearson Education, Inc. Publishing as Addison Wesley
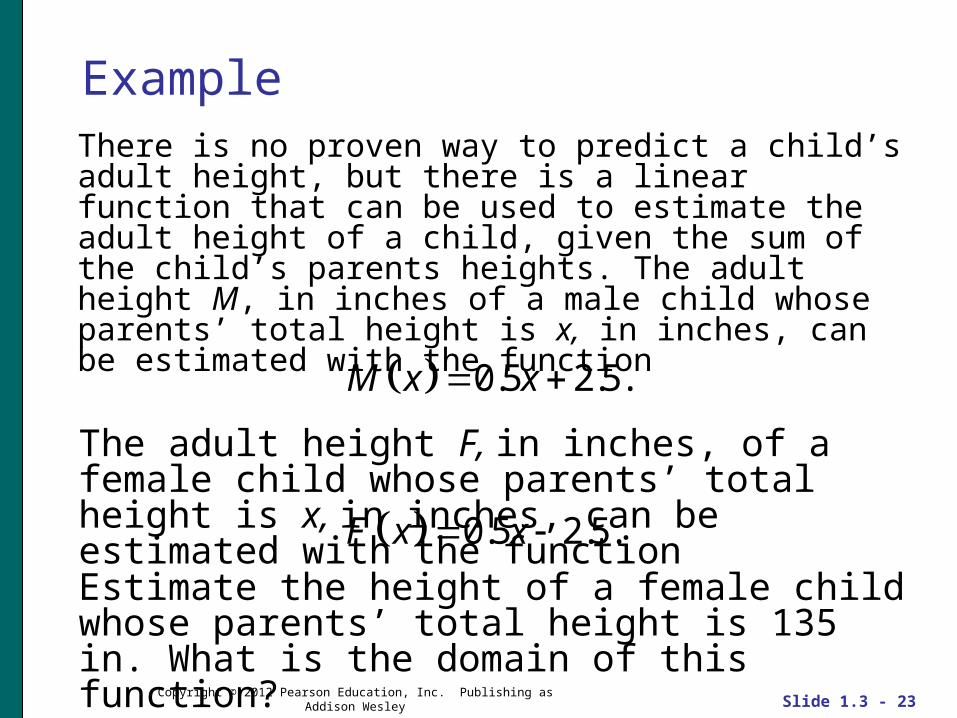
ExampleThere is no proven way to predict a child’s adult height, but there is a linear function that can be used to estimate the adult height of a child, given the sum of the child’s parents heights. The adult height M, in inches of a male child whose parents’ total height is x, in inches, can be estimated with the function
0.5 2.5. M x x
0.5 2.5. F x x
The adult height F, in inches, of a female child whose parents’ total height is x, in inches, can be estimated with the function
Estimate the height of a female child whose parents’ total height is 135 in. What is the domain of this function?

Slide 1.3 - 24Copyright © 2012 Pearson Education, Inc. Publishing as Addison Wesley
Example
Thus we can estimate the adult height of the female child as 65 in., or 5 ft 5 in.
0.5135 13 2 55 . F
65
Solution: We substitute into the function:
0.5 2.5. F x x