Slide 1- 1 Copyright © 2006 Pearson Education, Inc. Publishing as Pearson Addison-Wesley.
Upload
antony-yorkCategory
view
215download
3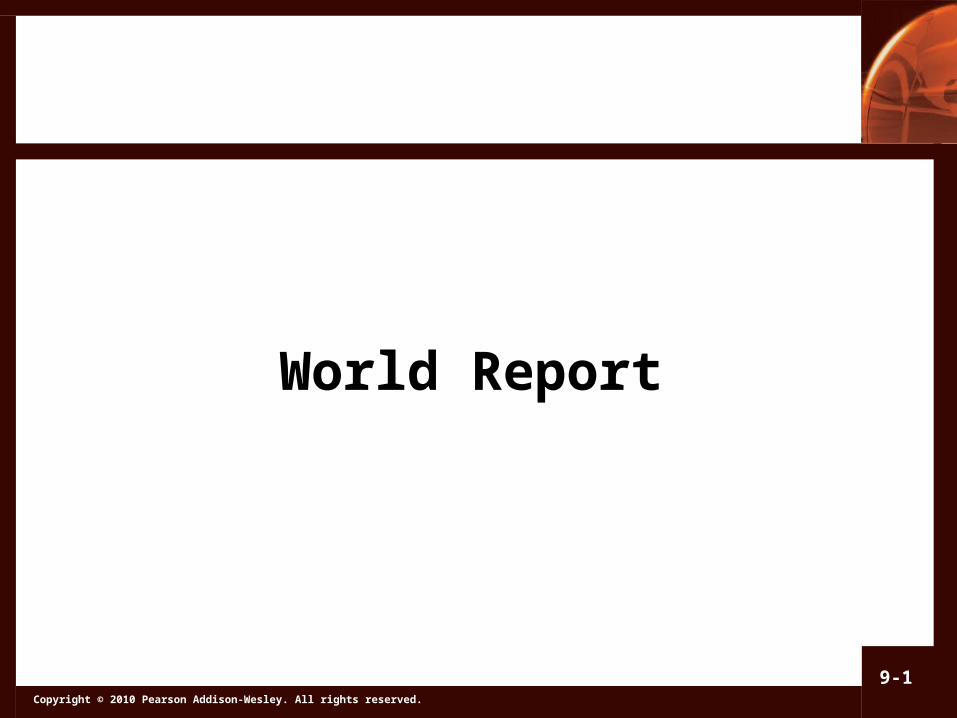
Copyright © 2010 Pearson Addison-Wesley. All rights reserved.
9-1
World Report
Copyright © 2010 Pearson Addison-Wesley. All rights reserved.
9-2
Rich and Poor?
Copyright © 2010 Pearson Addison-Wesley. All rights reserved.
9-3
Introduction
Why are some countries rich while other countries are poor?
What affects their current economies?
An understanding of the answers to these questions helps you understand your life: Why are some people rich and others poor? Is there anything we can do?

Copyright © 2010 Pearson Addison-Wesley. All rights reserved.
9-4
General Project Objectives
• develop the six Core skills,• develop the three Honors Program Core tenets
(critical thinking, research and writing),• integrate the knowledge and skills from various
disciplines (e.g., communication, geography, history, political science and mathematics),
• understand the relevance of other disciplines (e.g., geographical, historical and social factors) to the contemporary economies around the world
• develop a global perspective in understanding economic, geopolitical and social issues

Copyright © 2010 Pearson Addison-Wesley. All rights reserved.
9-5
Components & Criteria
1. PowerPoint File (50 points)
– Preparation; data; organization
2. Oral Presentation (50 points)
– Preparation; contents & accuracy; oral skill
3. Written Report (100 points)
– Writing skill & documentation
Copyright © 2010 Pearson Addison-Wesley. All rights reserved.
9-6
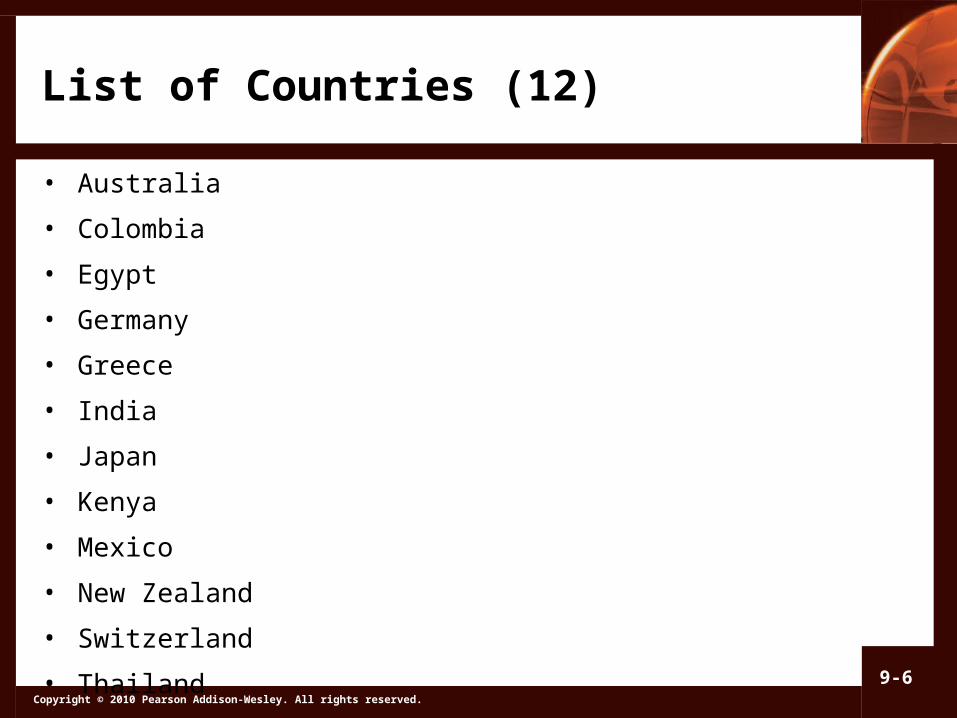
List of Countries (12)
• Australia
• Colombia
• Egypt
• Germany
• Greece
• India
• Japan
• Kenya
• Mexico
• New Zealand
• Switzerland
• Thailand
Copyright © 2010 Pearson Addison-Wesley. All rights reserved.
9-7
Background
• Brief history (factors that may affect the economy)
• Colony (British, French or Spanish)?
• Population/demography (natives vs. migrants)
• Government setup and institutional factors
Copyright © 2010 Pearson Addison-Wesley. All rights reserved.
9-8
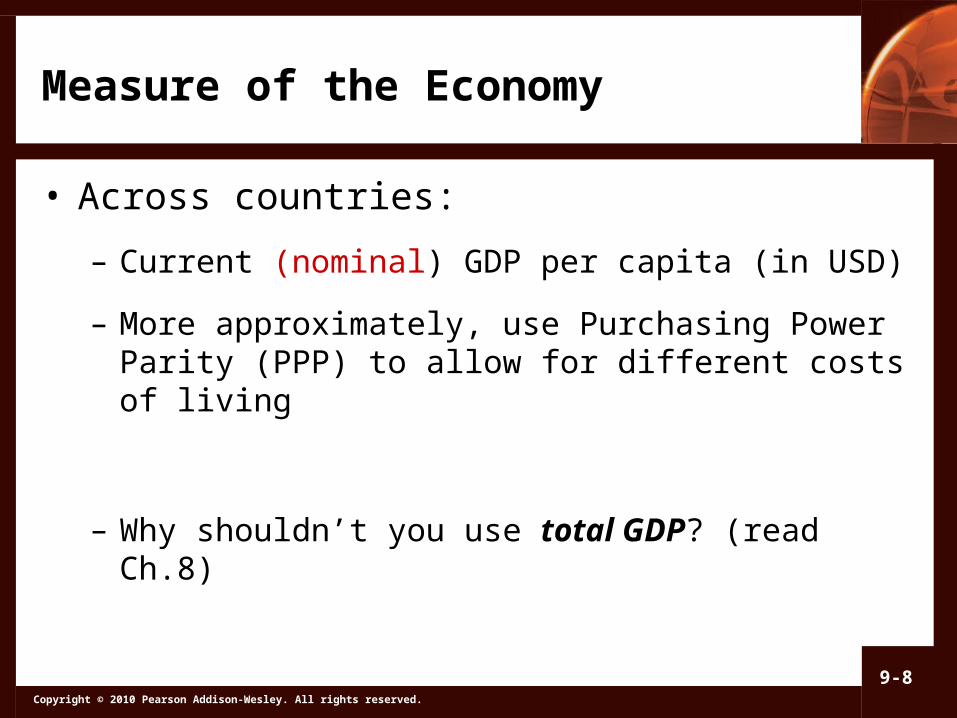
Measure of the Economy
• Across countries:
– Current (nominal) GDP per capita (in USD)
– More approximately, use Purchasing Power Parity (PPP) to allow for different costs of living
– Why shouldn’t you use total GDP? (read Ch.8)
Copyright © 2010 Pearson Addison-Wesley. All rights reserved.
9-9
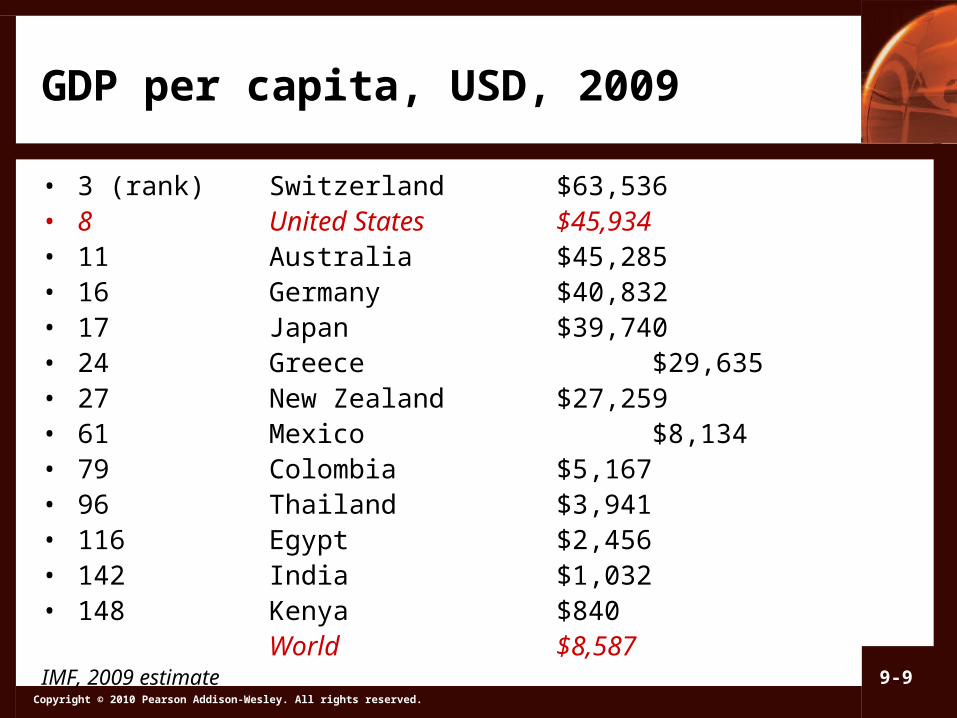
GDP per capita, USD, 2009
• 3 (rank) Switzerland $63,536• 8 United States $45,934• 11 Australia $45,285• 16 Germany $40,832• 17 Japan $39,740• 24 Greece $29,635• 27 New Zealand $27,259• 61 Mexico $8,134• 79 Colombia $5,167• 96 Thailand $3,941• 116 Egypt $2,456• 142 India $1,032• 148 Kenya $840
World $8,587IMF, 2009 estimate
Copyright © 2010 Pearson Addison-Wesley. All rights reserved.
9-10
Other Economic “Indicators”
• Inflation (ch. 7)
– Inflation is tied to monetary policy (ch. 16)
– During a recession (2007-09), inflation reduced
• Unemployment (ch. 7)
– Cyclical (short term) vs. natural (long term)
– Why is the unemployment rate persistently low in some countries (e.g., Japan) and high in other countries (e.g., Germany)?
– During a recession (2007-09), unemployment (cyclical) rose
Copyright © 2010 Pearson Addison-Wesley. All rights reserved.
9-11
How Do We Define Economic Growth? (book)
• Economic Growth
– Increase in per capita real GDP measured by its rate of change per year
– NOT just the past business cycle (<10 years)
– Use the rule of 70, or calculate the average growth over a long period of time
Copyright © 2010 Pearson Addison-Wesley. All rights reserved.
9-12
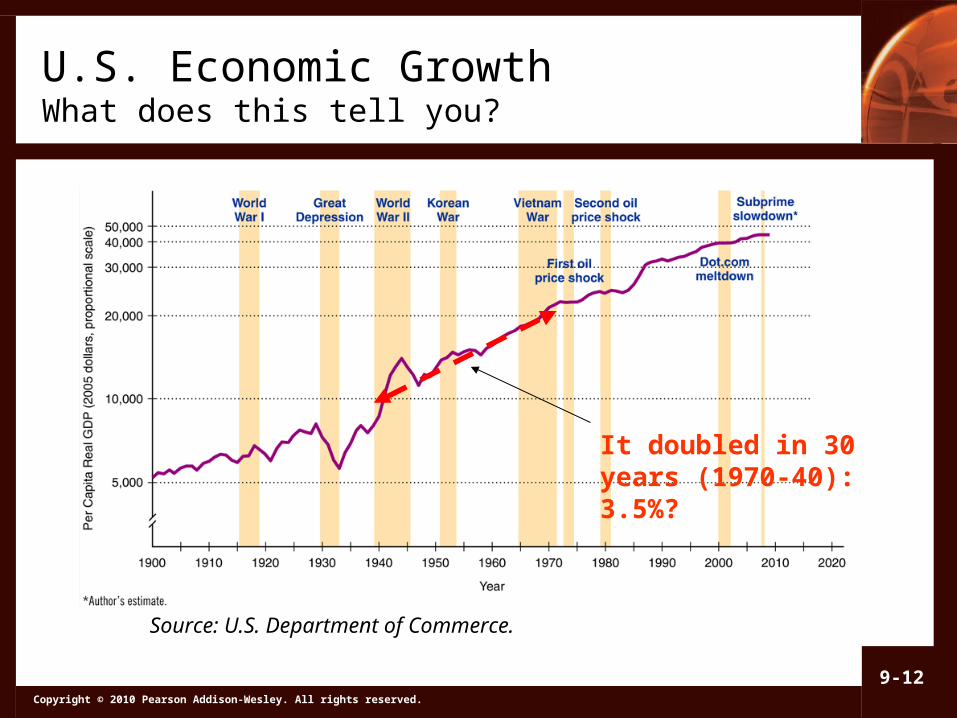
U.S. Economic GrowthWhat does this tell you?
Source: U.S. Department of Commerce.
It doubled in 30 years (1970-40): 3.5%?
Copyright © 2010 Pearson Addison-Wesley. All rights reserved.
9-13
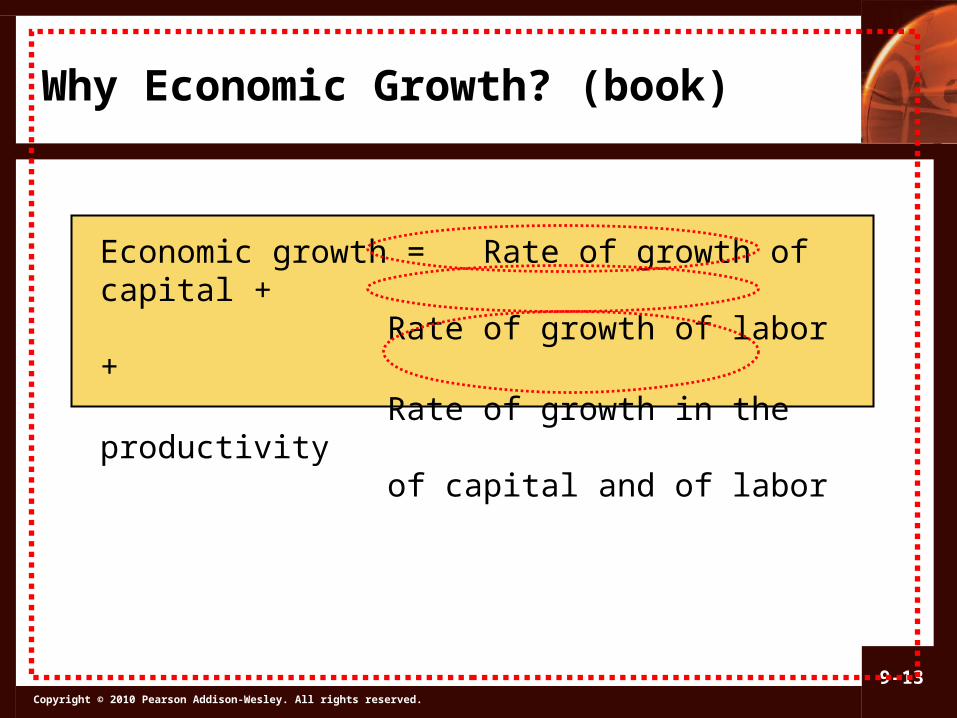
Economic growth = Rate of growth of capital + Rate of growth of labor +Rate of growth in the productivityof capital and of labor
Why Economic Growth? (book)
Copyright © 2010 Pearson Addison-Wesley. All rights reserved.
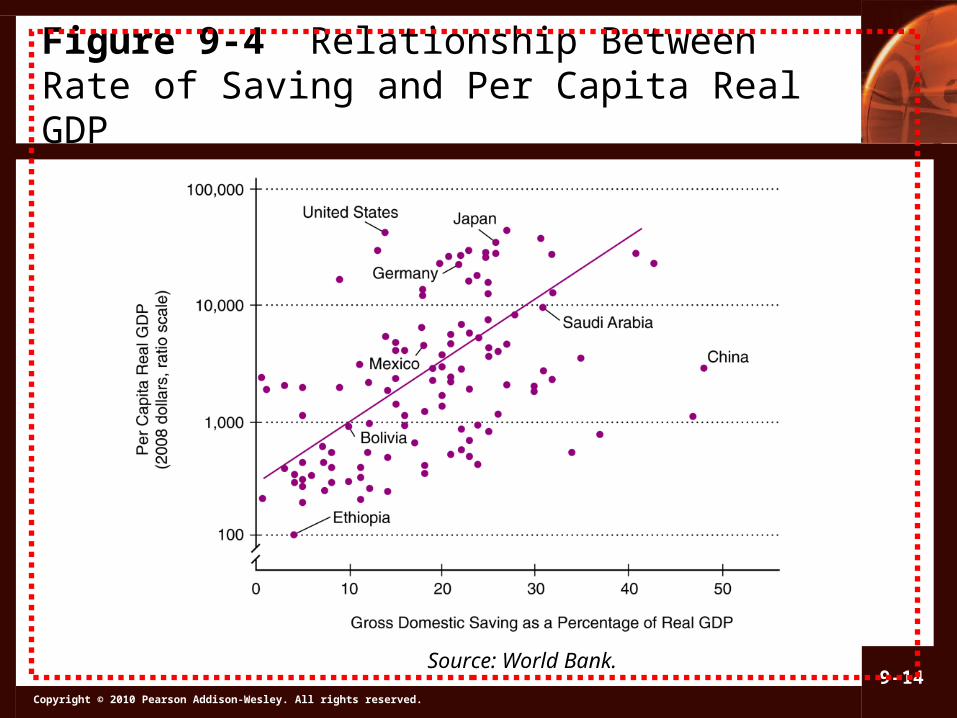
9-14Source: World Bank.
Figure 9-4 Relationship Between Rate of Saving and Per Capita Real GDP
Copyright © 2010 Pearson Addison-Wesley. All rights reserved.
9-15
Economic Development (cont'd)
• The relationship between population growth and economic development
– Growth leads to smaller families, lower birth rates.
– The more economic development occurs, the slower the population growth rate.
– Birth rates decline with modernization.• Reduced infant mortality• People do not rely on children to take care of them in
old age• Why a conflict between work and having babies?
Copyright © 2010 Pearson Addison-Wesley. All rights reserved.
9-16
Economic Development (cont'd)
• Keys to economic development
– Establishing a system of property rights
– Developing an educated population (not high population growth)
– Letting “creative destruction” (free market) run its course
– Limiting protectionism (opposite of free trade)
Copyright © 2010 Pearson Addison-Wesley. All rights reserved.
9-17
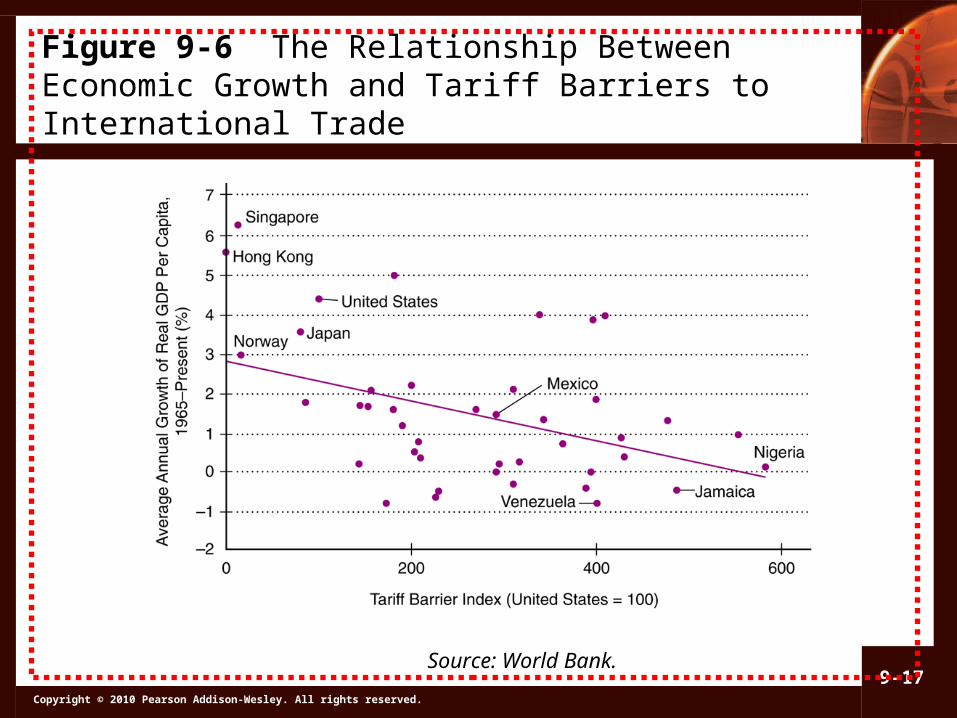
Figure 9-6 The Relationship Between Economic Growth and Tariff Barriers to International Trade
Source: World Bank.
Copyright © 2010 Pearson Addison-Wesley. All rights reserved.
9-18
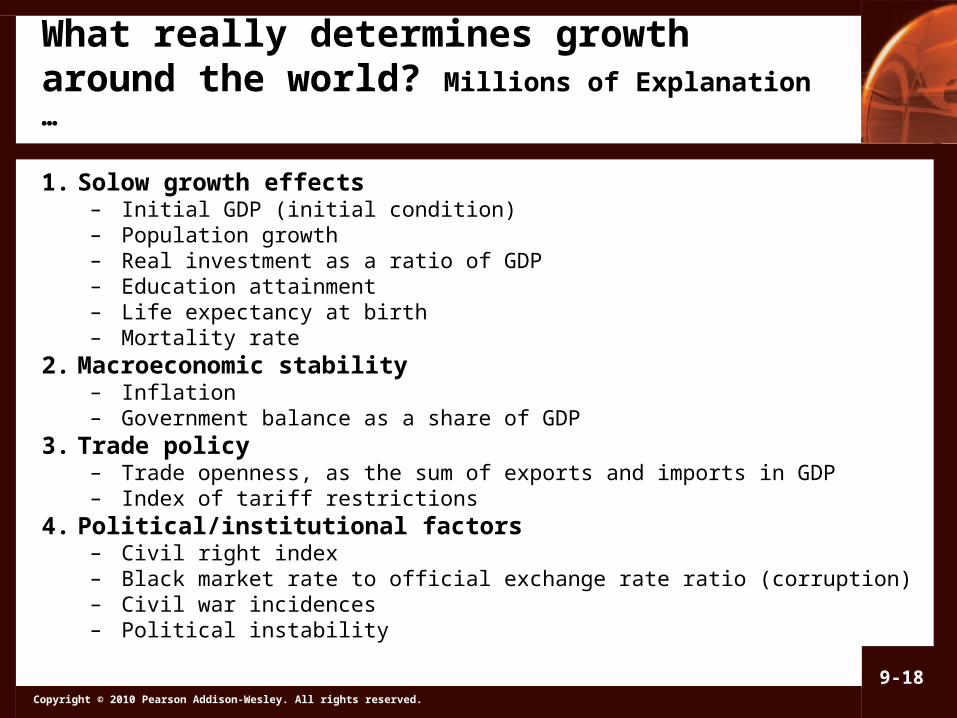
What really determines growth around the world? Millions of Explanation …
1. Solow growth effects– Initial GDP (initial condition)– Population growth– Real investment as a ratio of GDP– Education attainment– Life expectancy at birth– Mortality rate
2. Macroeconomic stability– Inflation – Government balance as a share of GDP
3. Trade policy– Trade openness, as the sum of exports and imports in GDP– Index of tariff restrictions
4. Political/institutional factors– Civil right index– Black market rate to official exchange rate ratio (corruption)– Civil war incidences– Political instability
Copyright © 2010 Pearson Addison-Wesley. All rights reserved.
9-19
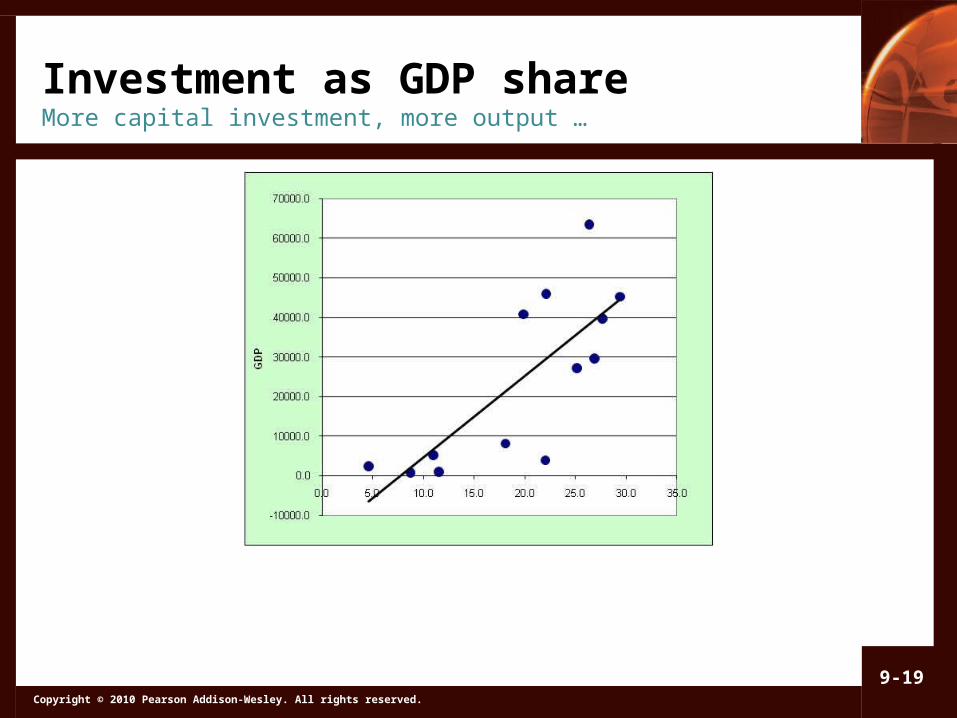
Investment as GDP shareMore capital investment, more output …
Copyright © 2010 Pearson Addison-Wesley. All rights reserved.
9-20
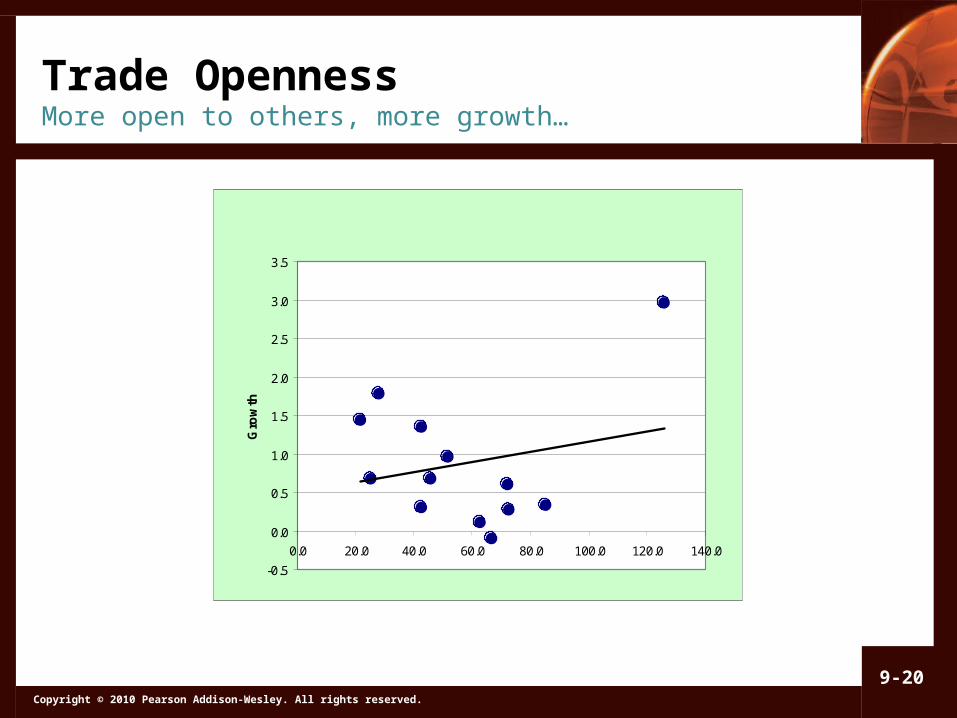
Trade OpennessMore open to others, more growth…
-0.5
0.0
0.5
1.0
1.5
2.0
2.5
3.0
3.5
0.0 20.0 40.0 60.0 80.0 100.0 120.0 140.0
Gro
wth
Copyright © 2010 Pearson Addison-Wesley. All rights reserved.
9-21
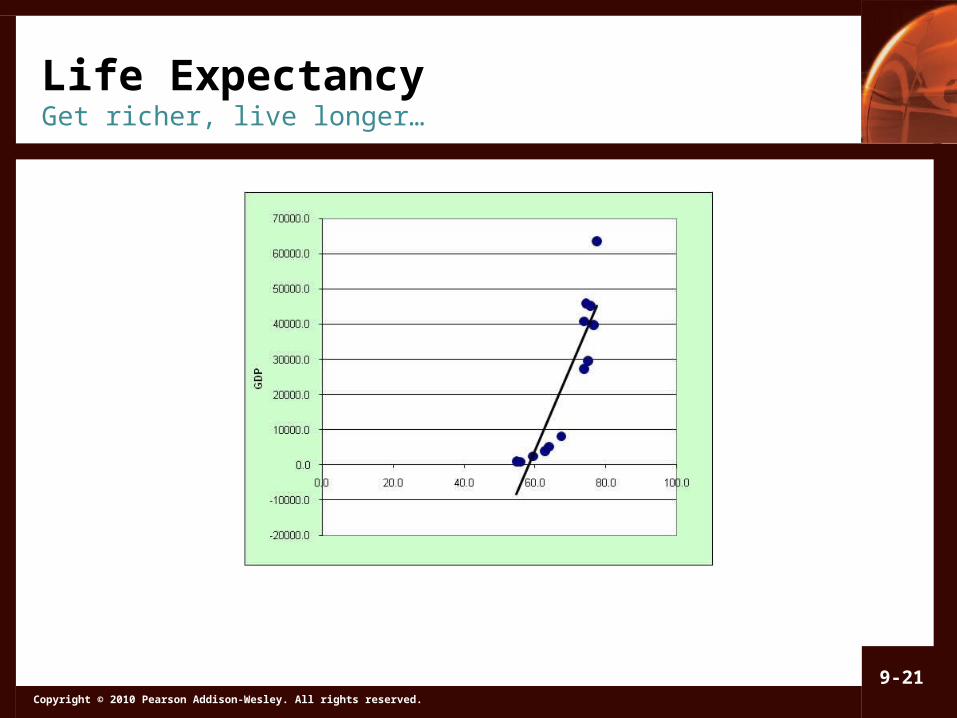
Life ExpectancyGet richer, live longer…
Copyright © 2010 Pearson Addison-Wesley. All rights reserved.
9-22
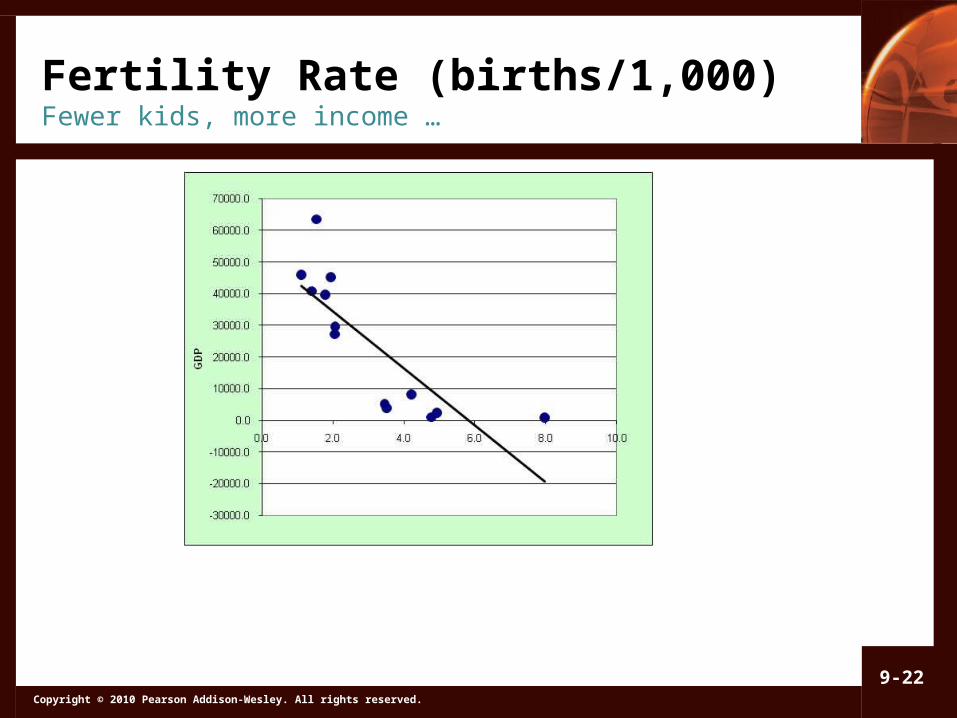
Fertility Rate (births/1,000)Fewer kids, more income …

Copyright © 2010 Pearson Addison-Wesley. All rights reserved.
9-23
High School AttainmentMore education, more productive …
Copyright © 2010 Pearson Addison-Wesley. All rights reserved.
9-24
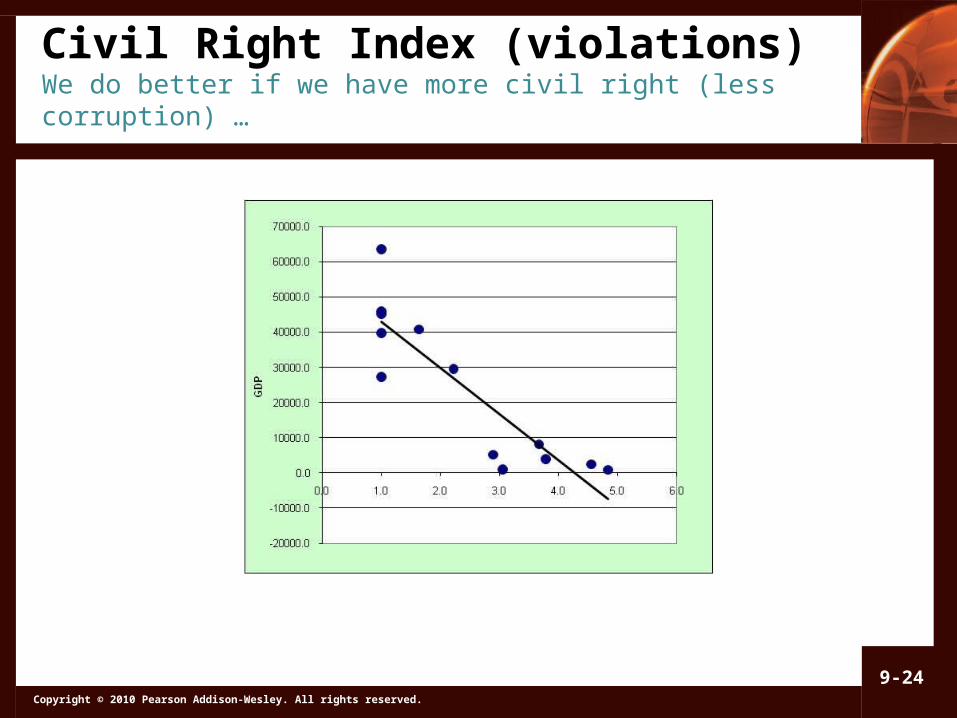
Civil Right Index (violations)We do better if we have more civil right (less corruption) …
Copyright © 2010 Pearson Addison-Wesley. All rights reserved.
9-25
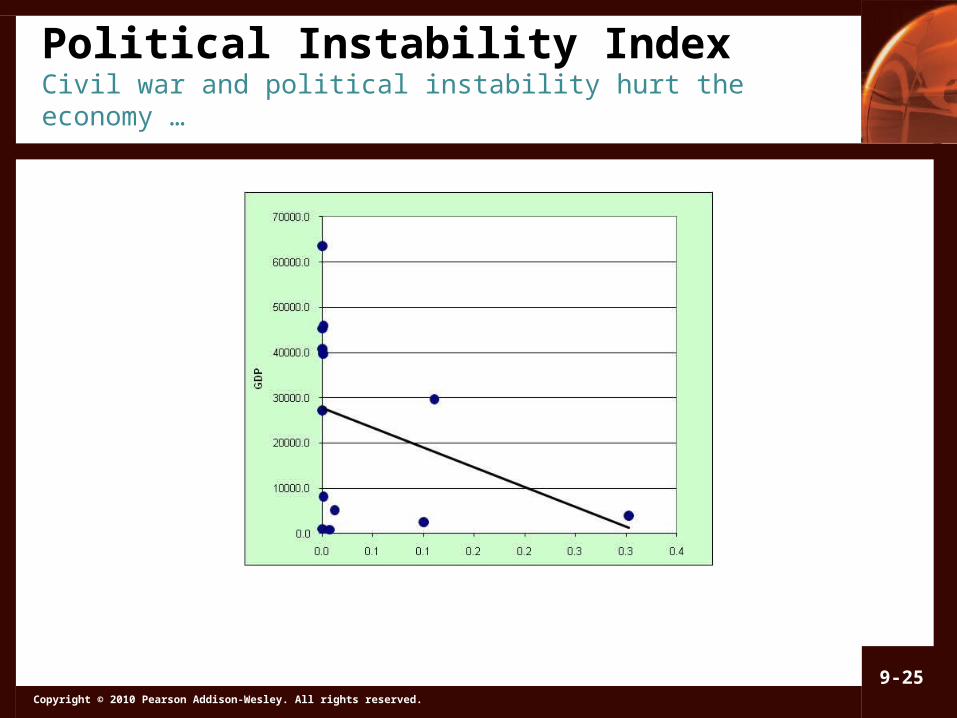
Political Instability IndexCivil war and political instability hurt the economy …
Copyright © 2010 Pearson Addison-Wesley. All rights reserved.
9-26
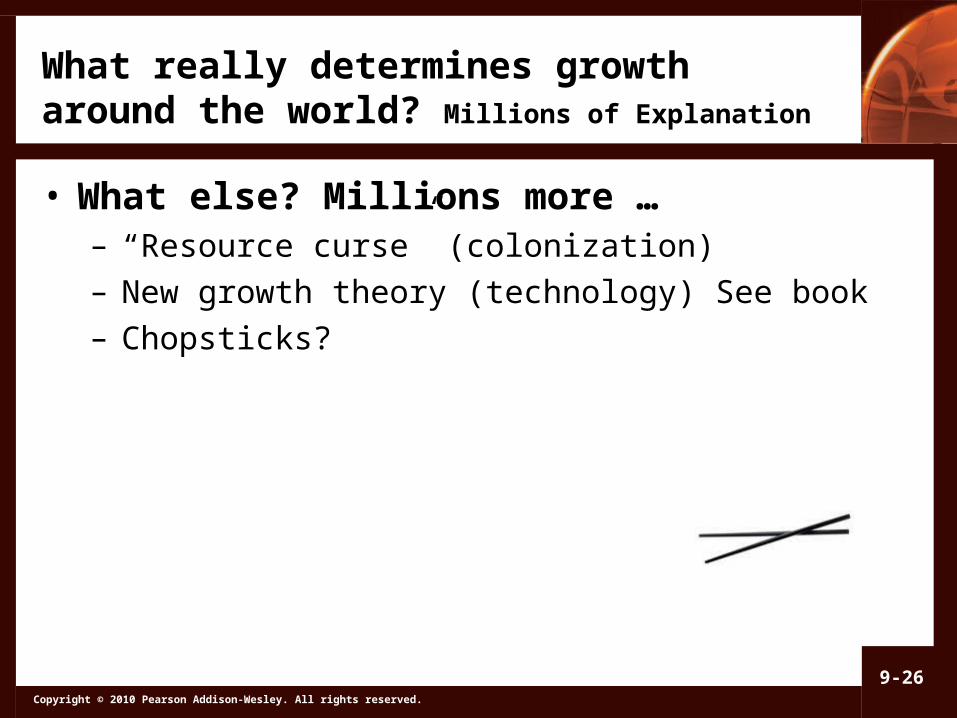
What really determines growth around the world? Millions of Explanation
• What else? Millions more …– “Resource curse” (colonization)– New growth theory (technology) See book– Chopsticks?
Copyright © 2010 Pearson Addison-Wesley. All rights reserved.
9-27
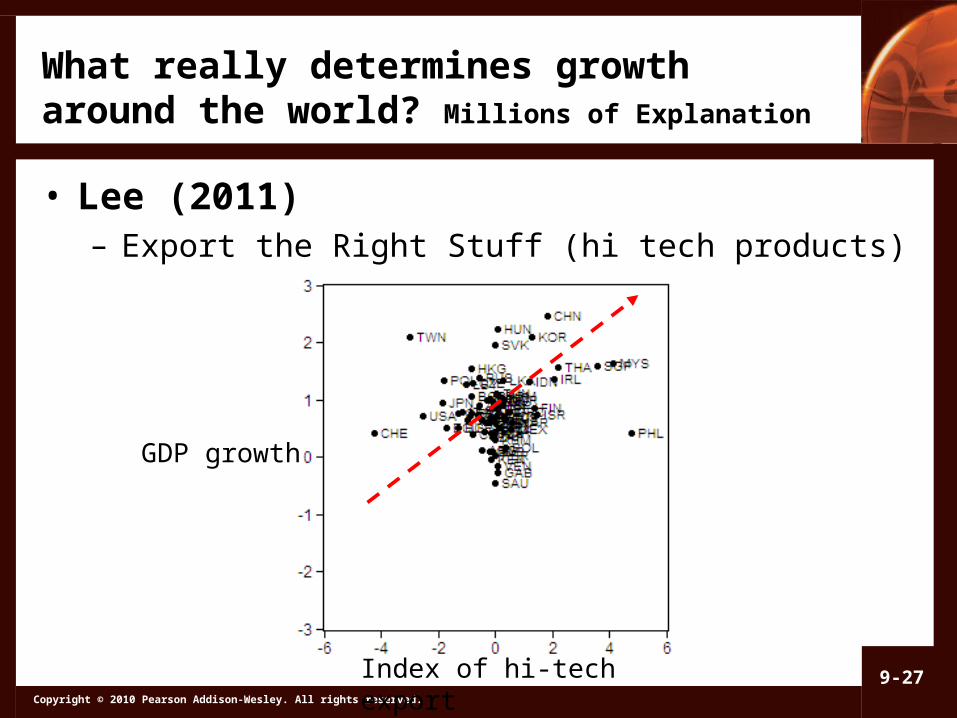
What really determines growth around the world? Millions of Explanation
• Lee (2011)– Export the Right Stuff (hi tech products)
Index of hi-tech export
GDP growth
Copyright © 2010 Pearson Addison-Wesley. All rights reserved.
9-28
Recent Conditions
• Short term/business cycles (e.g., 2000-)• Affected by monetary policy
– Central bank– Missions/objectives (mostly the same as the Fed)– “Talk the talk, walk the walk”—many countries in
practice inflated their currencies at times– Inflation targeting (stated objective to be met, or
be fired): e.g., New Zealand (1989), Australia (1993), Switzerland (2000)
– Observe: other countries followed the US

Copyright © 2010 Pearson Addison-Wesley. All rights reserved.
9-29
Written Report
• See the Guidelines• Due 12/7 (Tue) Midnight• Team: Evaluation of partners (100%
combined)