Copyright © 2009 Pearson Education, Inc. Chapter 5 Frictions in the Labor Market.
19
Copyright © 2009 Pearson Education, Inc. Chapter 5 Frictions in the Labor Market
Transcript of Copyright © 2009 Pearson Education, Inc. Chapter 5 Frictions in the Labor Market.

Copyright © 2009 Pearson Education, Inc.
Chapter 5
Frictions in the Labor Market
Copyright © 2009 Pearson Education, Inc. 5- 2
FIGURE 2.13 Demand and Supply at the "Market" and "Firm" Level

Copyright © 2009 Pearson Education, Inc. 5- 3
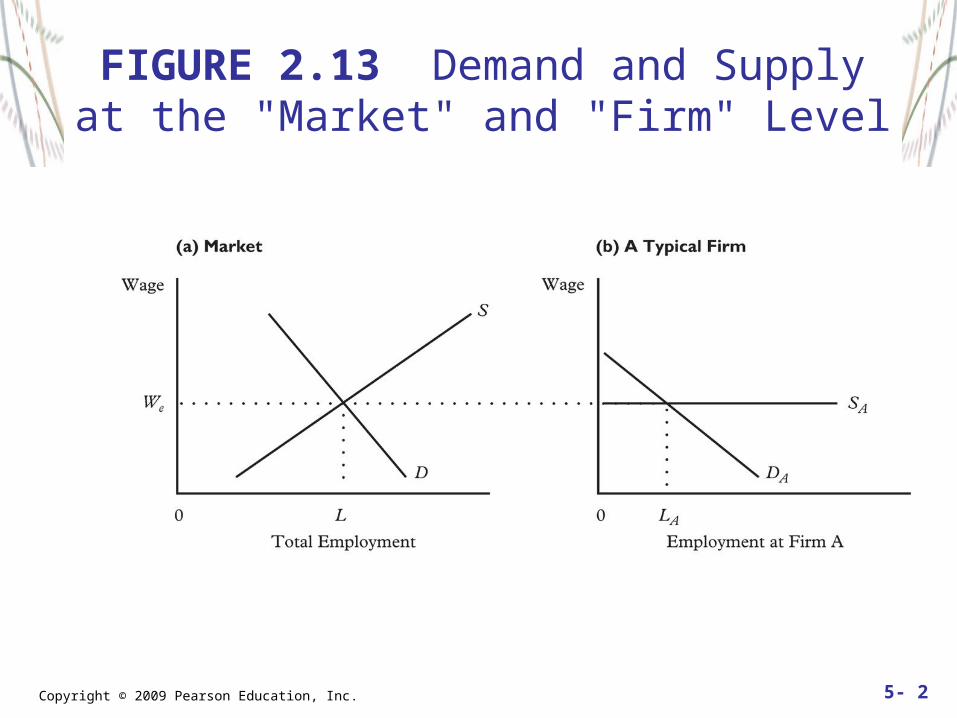
Figure 5.1: The Supply of Labor to Firm A: Worker Mobility Costs Increase the Slope
of the Labor Supply Curve Facing Individual Employers
Copyright © 2009 Pearson Education, Inc. 5- 4
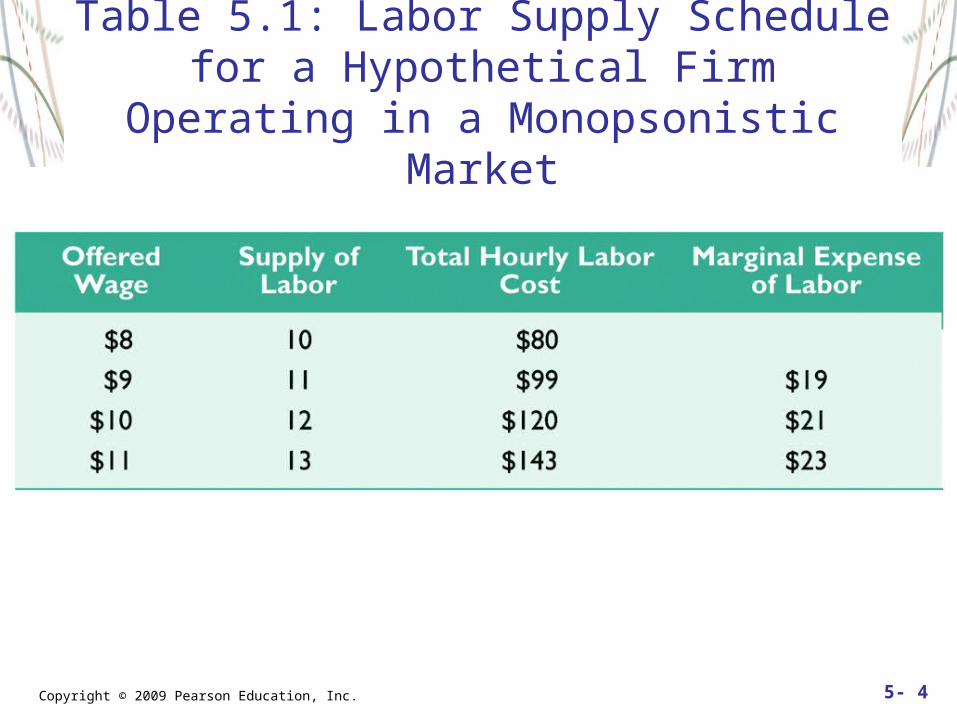
Table 5.1: Labor Supply Schedule for a Hypothetical Firm Operating in a
Monopsonistic Market

Copyright © 2009 Pearson Education, Inc. 5- 5
Figure 5.2: A Graph of the Firm-Level Data in Table 5.1

Copyright © 2009 Pearson Education, Inc. 5- 6
Profit Is Maximized For The Monopsonist When:
MRP = ME (marginal expense)
where
ME > Wage
Monopsony

Copyright © 2009 Pearson Education, Inc. 5- 7
Figure 5.3: Profit-Maximizing Employment and Wage Levels in a Firm Facing a
Monopsonistic Labor Market
Copyright © 2009 Pearson Education, Inc. 5- 8
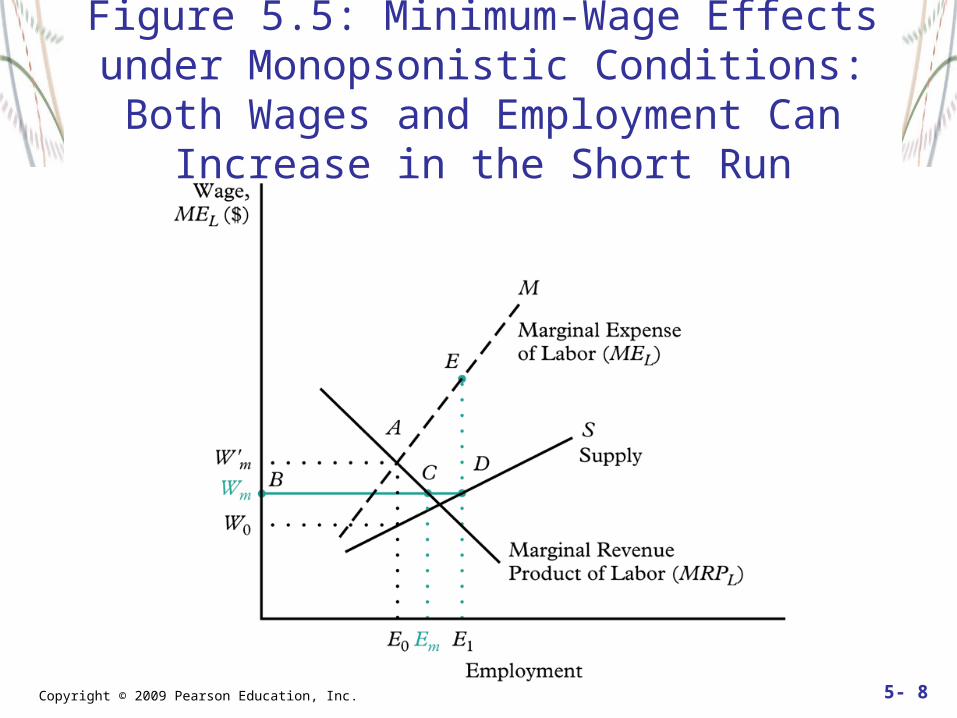
Figure 5.5: Minimum-Wage Effects under Monopsonistic Conditions: Both Wages and Employment Can Increase in the Short Run

Copyright © 2009 Pearson Education, Inc. 5- 9
Quasi-Fixed Labor Costs I
Variable Costs vs. Quasi-Fixed CostsHiring CostsImplicit and Explicit Training CostsNon Wage Benefits

Copyright © 2009 Pearson Education, Inc. 5- 10
Table 5.2: Hours Devoted by Firms to Training a New Worker during First Three
Months on Job, 1992
Copyright © 2009 Pearson Education, Inc. 5- 11
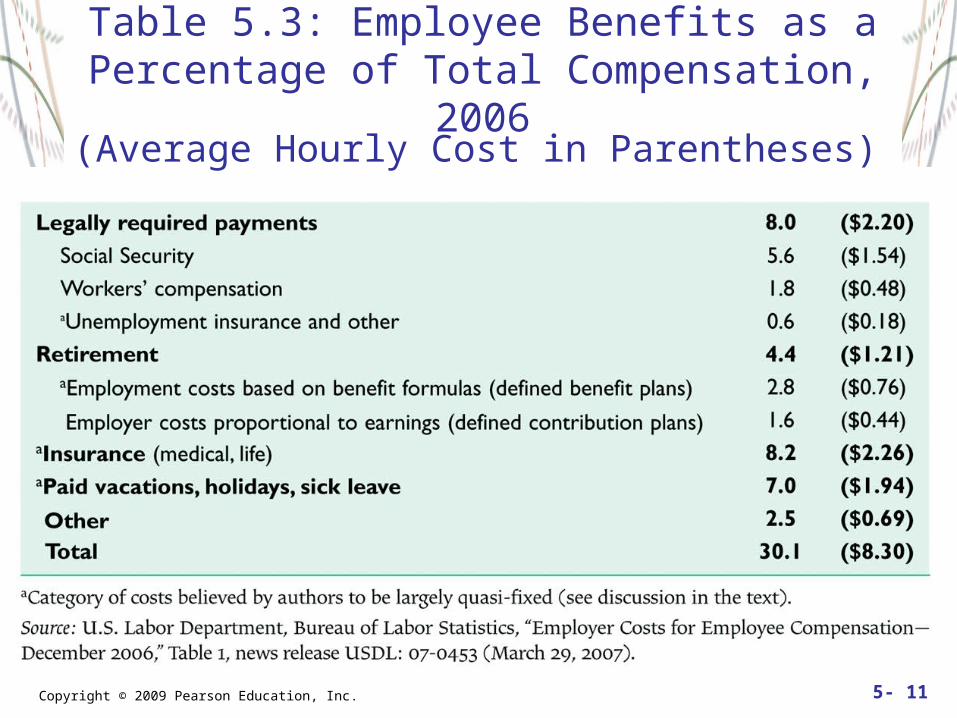
Table 5.3: Employee Benefits as a Percentage of Total Compensation, 2006
(Average Hourly Cost in Parentheses)

Copyright © 2009 Pearson Education, Inc. 5- 12
The Employment/Hours Trade-Off
MP of Labor and MP of HoursME of Labor and ME of HoursOvertime Pay Premium and Employment
When there are quasi-fixed labor costs, production cost Is minimized when:
MEm/MPm = MEh/MPh

Copyright © 2009 Pearson Education, Inc. 5- 13
Figure 5.6: The Predicted Relationship between MEM/MEH and Overtime Hours

Copyright © 2009 Pearson Education, Inc. 5- 14
Training InvestmentsI
Training investments are quasi-fixed costs that are normally paid for by both the firm and the worker
Increased employee productivity motivates the company to bear the net costs of training, but:
a. training must raise the worker’s productivity more than it increases his/her wageb. the employee must stay with the company until the net cost of training is recovered

Copyright © 2009 Pearson Education, Inc. 5- 15
Training InvestmentsI
Assume that:
NEo is net expense in period 0 Wo is the wage during period 0 Z are the training cost in period 0 MRPo is trainee’s contribution in period 0
If: NEo = Wo + Z - MRPo > 0
Then, in the next Period, MRP1 must exceed W1
so that MRPo + MRP1 / (1+r) is greater or equal
Wo + Z + W1 / (1+r)

Copyright © 2009 Pearson Education, Inc. 5- 16
I Will the firm offer general training to its employees?
Only if Wo + Z –MPo = 0
Why?
Because after training, other firms will be willing to
offer the employee a wage W1 = MRP1.
But, if Wo + Z –MPo > 0, the training firm
must pay a wage of W1 < MRP1.

Copyright © 2009 Pearson Education, Inc. 5- 17
A Two-Period Wage Stream Associated with Specific Training

Copyright © 2009 Pearson Education, Inc. 5- 18
Figure 5.7: Productivity and Wage Growth, First Two Years on Job, by Occupation and
Initial Hours of Employer Training
Copyright © 2009 Pearson Education, Inc. 5- 19
Hiring Costs
The Use of Credentials or Signals
Statistical Discrimination
Internal Labor Markets