Copyright 2008 ADDITIONAL PROXY DATA FOR STUDYING CLIMATE CHANGE.
9
Copyright 2008 ADDITIONAL PROXY DATA FOR STUDYING CLIMATE CHANGE
-
Upload
elinor-newton -
Category
Documents
-
view
216 -
download
0
Transcript of Copyright 2008 ADDITIONAL PROXY DATA FOR STUDYING CLIMATE CHANGE.

Copyright 2008
ADDITIONAL PROXY DATA FOR STUDYING CLIMATE
CHANGE

Copyright 2008
Sediment Cores from the Ocean Floor
Photo credit: Ocean Drilling Program, Texas A&M University
Copyright 2008
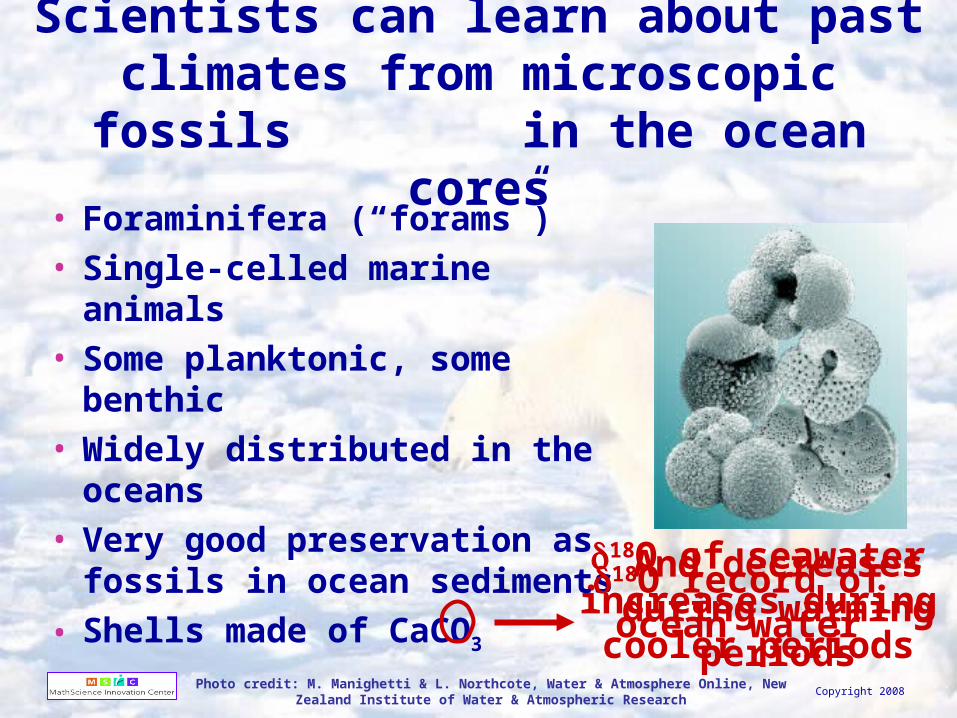
18O of seawater increases during cooler periods
And decreases during warming
periods
Scientists can learn about past climates from microscopic fossils
in the ocean cores• Foraminifera (“forams”)• Single-celled marine
animals• Some planktonic, some
benthic• Widely distributed in the
oceans• Very good preservation as
fossils in ocean sediments
• Shells made of CaCO3
18O record of ocean water
Photo credit: M. Manighetti & L. Northcote, Water & Atmosphere Online, New Zealand Institute of Water & Atmospheric Research

Copyright 2008
Speleothems
Because speleothems (cave formations) such as stalactites grow in annual layers or “rings”, 18O ratios
in their CaCO3 can be used to study past climate.
Photo © Paul Williams, New Zealand National Institute of Water & Atmospheric Research
Photo: Dave Bunnell

Copyright 2008
Studies of Modern and Fossil Plants
• Leaf shapes & surfaces from fossil leaves can be used as palaeoclimate indicators – as with modern leaves, certain shapes are associated with warm or cold climates.
• Density of leaf stomata (pores) can indicate ancient atmospheric CO2 levels. Because plants take in CO2 through the stomata, more stomata are needed if CO2 levels are low, and fewer if the levels are high.
• Tree ring width can indicate ancient climate, and annual tree rings can be used to determine the time in the past.
Photo credit: Woudloper
Photo credit: Patricia Miller
Photo credit: Dartmouth Electron Microscope
Facility
Photo credit: Menchi
Photo credit; Hannes Grobe

Copyright 2008
Using computer models for “hindcasting” of recorded climate observations
Illustration from Prof. Alan J. Thorpe, 2005, on behalf of the Institute of Physics.
Illustration © Institute of Physics and IOP Publishing Limited (“IOPP”) 2006

Copyright 2008
Natural variations alone do not explain observed trends & a model incorporating both natural and anthropogenic factors
yields the best fit
Illustration from Prof. Alan J. Thorpe, 2005, on behalf of the Institute of Physics.
Illustration © Institute of Physics and IOP Publishing Limited (“IOPP”) 2006

Copyright 2008
6
Foraminifera photo & δO-18 plot adapted from B. Manighetti & L. Northcote, Water & Atmosphere Online,

Copyright 2008
-50°C
-30°C
-40°C
Temperature
DATA SHEET 6 Graphs of temperature and calcium from the GISP2 (Greenland Ice Sheet Project) ice core. Temperature values were determined from 18O analyses of ice core layers. Calcium concentrations are equivalent to the concentration of calcium dust particles trapped in the ice core. Dust particles can be transported into the atmosphere by wind and can travel great distances, but they eventually settle out back to Earth. Calcium is a major component of limestone rock, which is formed in the oceans and which is deposited as limestone mud on the world’s continental shelves.
7
Illustration courtesy of Teachers’ Domain. Source: Zach Smith, Wright Center for Education, Tufts University