Copyright © 2003 Pearson Education, Inc.Slide 1-1 PPF -- the slope of PPF measures the opportunity...
13
Copyright © 2003 Pearson Education, Inc. Slide 1-1 PPF -- the slope of PPF measures the opportunity cost of M in terms of D Ricardian model -- labor is the only factor of production • The production possibility frontier is a straight line because the opportunity cost of M in terms of D is constant. H-O model -- the addition of other factors of production changes the shape of the PPF to a curve. • Because of diminishing returns, PPF is a bowed-out curve instead of a straight line.
-
Upload
meredith-stanley -
Category
Documents
-
view
215 -
download
1
Transcript of Copyright © 2003 Pearson Education, Inc.Slide 1-1 PPF -- the slope of PPF measures the opportunity...

Copyright © 2003 Pearson Education, Inc. Slide 1-1
PPF -- the slope of PPF measures the opportunity cost of M in terms of D
Ricardian model -- labor is the only factor of production• The production possibility frontier is a straight line
because the opportunity cost of M in terms of D is constant.
H-O model -- the addition of other factors of production changes the shape of the PPF to a curve. • Because of diminishing returns, PPF is a bowed-out
curve instead of a straight line.

Copyright © 2003 Pearson Education, Inc. Slide 1-2
PPF-Constant opportunity costs
As the production of QC expands,the output of QW
falls, but as a constant rate.
QW
QC1 1
Copyright © 2003 Pearson Education, Inc. Slide 1-3
PPF-increasing opportunity costs
For each additional unit of QC produces in the economy, the amount of QW produced falls by an increasing amount.
QC
QW
1 1

Copyright © 2003 Pearson Education, Inc. Slide 1-4
• Diminishing returns: because adding a worker means that each worker has less land to work with, each successive increment of labor will add less to production than the last.
• Opportunity cost:the amount of production of one type of good that must be sacrificed to produceone more unit of the other.
Diminishing Returns

Copyright © 2003 Pearson Education, Inc. Slide 1-5
Assumptions--2
ASSUMPTION4:Perfect competition prevails in both
industries. In addition, there are no externalities in
production.
ASSUMPTION5:Factors of production are perfectly
mobile between the industries within the country.
Copyright © 2003 Pearson Education, Inc. Slide 1-6
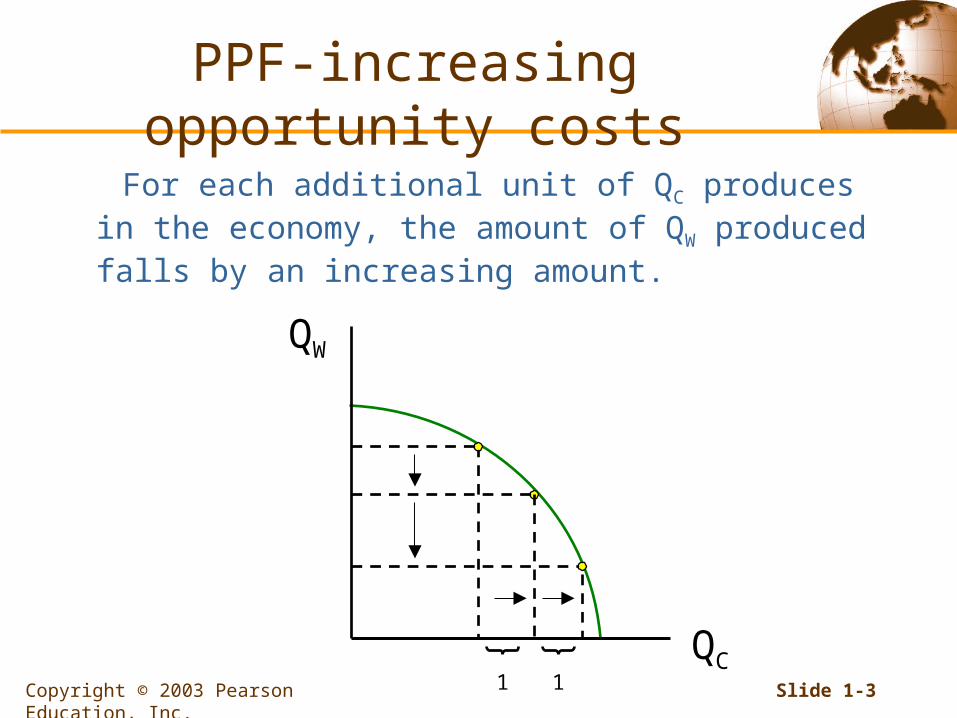
Perfect competition requires that price equals marginal cost. (the price of QC in terms of QW must equal the cost
of producing QC in terms of QW -- = )PC
PW
QW
QC
Relationship Between Price Line and Production Point
QC
QWPrice line
Slope =
Production point
PC
PW

Copyright © 2003 Pearson Education, Inc. Slide 1-7
Assumptions-3 ASSUMPTION6:Community preferences in
consumption can be represented by a consistent set of community indifference curves.• Indifference curves
– Each traces a set of combinations of cloth (C) and food (F) consumption that leave the individual equally well off
– They have three properties:– Downward sloping
– The farther up and to the right each lies, the higher the level of welfare to which it corresponds
– Each gets flatter as we move to the right

Copyright © 2003 Pearson Education, Inc. Slide 1-8
Indifference Curves
QW
QC
IC
1 1

Copyright © 2003 Pearson Education, Inc. Slide 1-9
Indifference Curves and Individual Utility Maximization
PC QCj+PW QWj=M j : Ms.Jones
(budget constraint)
QW
QC
u2
u3Price line Slope =
- PC
PW
u1
D
Consumption point

Copyright © 2003 Pearson Education, Inc. Slide 1-10
Assumptions-3
• Community indifference curve:
A diagram that expresses the preferences
of all the consumers of a country.

Copyright © 2003 Pearson Education, Inc. Slide 1-11
模型目的。內生變數。行為法則。均衡。外生衝擊
• 判斷是否為外生變數改變?• 判斷此外生變數之改變將影響哪些行為法則• 判斷此外生變數之改變造成行為法則何種影響
學習經濟模型五步驟
均衡。

Copyright © 2003 Pearson Education, Inc. Slide 1-12
CICPPF
General Equilibrium for a Closed Economy
-increasing opportunity costs
QC
QW
x
QC*
QW*
Price line Slope =- PC
PW

Copyright © 2003 Pearson Education, Inc. Slide 1-13
General Equilibrium for a Closed Economy
-constant opportunity costs
QC
CIC
PPFQW
z
QC*
QW*


![GEOLOGIC MAP OF THE BOULDER—FORT … · kpu kptz qrf kph qc kl ppf pi ppf tkda]pl ppf tqm kpl ppf qv kn qv ply ppf kpm qrf qpp qs kprl]pl qc qprf ppf kcg ppf qpc xbc]pl qs qpp kl](https://static.fdocuments.us/doc/165x107/5d5584a688c9930d778b9e00/geologic-map-of-the-boulderfort-kpu-kptz-qrf-kph-qc-kl-ppf-pi-ppf-tkdapl.jpg)