Copy Journal of PCA based Iris Recognition using DWT 15...
10
PCA based Iris Recognition using DWT Shashi Kumar D R 1 , K B Raja 2 , R. K Chhootaray 3 , Sabyasachi Pattnaik 4 1 Department of CSE, Cambridge Institute of Technology, Bangalore 2 Department of ECE, University Visvesvaraya College of Engineering, Bangalore University, Bangalore 3 Department of CSE, Seemanta Engineering College, Mayurbhanj, Odisha 4 Department of Computer Science, F.M. University, Balasore, Odisha [email protected],[email protected], [email protected], [email protected] Abstract—The Iris pattern is an important biological feature of human body. The recognition of an individual based on iris pattern is gaining more popularity due to the uniqueness of the pattern among the people. In this paper PCA based iris recognition using DWT (PIRDWT) is proposed. The upper and lower portion of the iris which is occluded by the eyelids and eyelashes is removed using morphological process. According to Springer Analysis of CASIA data base, to get better recognition forty five pixels to left and right of the pupil boundary is considered as iris template for the proposed algorithm analysis. The image is enhanced using Histogram Equalization to get high contrast. DWT is applied on histogram equalised iris template to get DWT coefficients. The features are extracted from the approximation band of the DWT coefficients using PCA. Multiple classifiers such as KNN, RF and SVM are used for matching. The proposed algorithm has better performance parameters compared to existing algorithm. Keywords- Iris, Dilation, Erosion, Biometrics, DWT, PCA, KNN, RF, SVM; 1. Introduction Identification and authentication of any individual is becoming more important in recent days. In the modern world where computers and electronics devices are more extensively used and the population of the world is increasing, there is a need for highly accurate and secured practical authentication technology. Traditional techniques such as user name, passwords, keys, ID cards, hardware token based systems are not reliable and secure in many of the security zones. Thus there is an increasing need for automatic reliable authentication process in modern society. In the recent few years biometric identification has proven to be more reliable means of verifying the human identity. Biometric refers to a science of analyzing human physiological or behavioral characteristics for security purposes and the word is derived from the Greek words bios means life and metrikos means measure. The Biometric [1] characteristics cannot be faked, forged, guessed and stolen easily. One need not remember his/her biometric traits. Biometric identification techniques use inherent physical or behavioral characteristics which are unique among all individuals. The behavioral biometrics are signature, voice, keystroke, gait tec., and physiological biometrics are fingerprint, face, palm print, iris, retina, ear, DNA etc. Among the physiological biometrics, iris is an important feature of the human body and it has the characters of uniqueness and stability. Iris recognition technology is now a days more advantageous in the field of information security and verification of individuals in the areas such as controlling access to security zones, verification of passengers at airports, stations, computer access at defence establishments, research organization, data base access control in distributed systems etc. Iris recognition systems are currently being deployed in many countries for airline crews, airport staffs, national ID cards, and missing children identification etc. Iris is the round contractile membrane of the eye suspended between cornea and lens which is perforated by the pupil. Iris begins to form during gestation and by the eighth month of the pregnancy it gets completely formed. The uniqueness of the iris pattern comes from the richness of the texture details in the iris image such as cornea, crypts, filaments, flecks, radial furrows, stripes, arching ligaments etc. These irregularly shaped microstructures are so randomly distributed patterns which make the human iris as one of the most important biometric characteristics. Iris is encircled by two concentric circles. The inner boundary is the junction of the iris and the pupil which is identified by the gray scale change and the border where as the outer boundary is the junction between iris and sclera which is characterized by smooth gray scale change and the little vogue border. The inner and outer boundaries are like circles but they are not concentric and blocked by the upper and lower eyelids and eyelashes. There are many iris recognition systems and the first automatic system was developed by Daugman [2] using efficient integrodifferential operator, which is still popular in today’s most of the iris recognition systems. In the zero crossings representation method [3] the image is decomposed using wavelet transform and the required features are extracted from the image. Using Gabor filter the coefficients are converted to binary code for matching. Key local variation method [4] proposed by L ma is another technique of iris recognition. The position of the local variations of the normalized image reduced to one dimensional feature vector of 660. This feature vector is Shashi Kumar D R et al, Int. J. Comp. Tech. Appl., Vol 2 (4), 884-893 IJCTA | JULY-AUGUST 2011 Available [email protected] 884 ISSN:2229-6093
Transcript of Copy Journal of PCA based Iris Recognition using DWT 15...

PCA based Iris Recognition using DWT Shashi Kumar D R
1, K B Raja
2, R. K Chhootaray
3, Sabyasachi Pattnaik
4
1Department of CSE, Cambridge Institute of Technology, Bangalore
2Department of ECE, University Visvesvaraya College of Engineering, Bangalore University, Bangalore
3Department of CSE, Seemanta Engineering College, Mayurbhanj, Odisha
4Department of Computer Science, F.M. University, Balasore, Odisha
[email protected],[email protected], [email protected], [email protected]
Abstract—The Iris pattern is an important biological feature of
human body. The recognition of an individual based on iris
pattern is gaining more popularity due to the uniqueness of the
pattern among the people. In this paper PCA based iris
recognition using DWT (PIRDWT) is proposed. The upper and
lower portion of the iris which is occluded by the eyelids and
eyelashes is removed using morphological process. According
to Springer Analysis of CASIA data base, to get better
recognition forty five pixels to left and right of the pupil
boundary is considered as iris template for the proposed
algorithm analysis. The image is enhanced using Histogram
Equalization to get high contrast. DWT is applied on histogram
equalised iris template to get DWT coefficients. The features
are extracted from the approximation band of the DWT
coefficients using PCA. Multiple classifiers such as KNN, RF
and SVM are used for matching. The proposed algorithm has
better performance parameters compared to existing
algorithm.
Keywords- Iris, Dilation, Erosion, Biometrics, DWT, PCA,
KNN, RF, SVM;
1. Introduction
Identification and authentication of any individual is
becoming more important in recent days. In the modern
world where computers and electronics devices are more
extensively used and the population of the world is
increasing, there is a need for highly accurate and secured
practical authentication technology. Traditional techniques
such as user name, passwords, keys, ID cards, hardware
token based systems are not reliable and secure in many of
the security zones. Thus there is an increasing need for
automatic reliable authentication process in modern society.
In the recent few years biometric identification has proven to
be more reliable means of verifying the human identity.
Biometric refers to a science of analyzing human
physiological or behavioral characteristics for security
purposes and the word is derived from the Greek words bios
means life and metrikos means measure. The Biometric [1]
characteristics cannot be faked, forged, guessed and stolen
easily. One need not remember his/her biometric traits.
Biometric identification techniques use inherent physical or
behavioral characteristics which are unique among all
individuals. The behavioral biometrics are signature, voice,
keystroke, gait tec., and physiological biometrics are
fingerprint, face, palm print, iris, retina, ear, DNA etc.
Among the physiological biometrics, iris is an important
feature of the human body and it has the characters of
uniqueness and stability. Iris recognition technology is now
a days more advantageous in the field of information
security and verification of individuals in the areas such as
controlling access to security zones, verification of
passengers at airports, stations, computer access at defence
establishments, research organization, data base access
control in distributed systems etc. Iris recognition systems
are currently being deployed in many countries for airline
crews, airport staffs, national ID cards, and missing children
identification etc.
Iris is the round contractile membrane of the eye suspended
between cornea and lens which is perforated by the pupil.
Iris begins to form during gestation and by the eighth month
of the pregnancy it gets completely formed. The uniqueness
of the iris pattern comes from the richness of the texture
details in the iris image such as cornea, crypts, filaments,
flecks, radial furrows, stripes, arching ligaments etc. These
irregularly shaped microstructures are so randomly
distributed patterns which make the human iris as one of the
most important biometric characteristics. Iris is encircled by
two concentric circles. The inner boundary is the junction of
the iris and the pupil which is identified by the gray scale
change and the border where as the outer boundary is the
junction between iris and sclera which is characterized by
smooth gray scale change and the little vogue border. The
inner and outer boundaries are like circles but they are not
concentric and blocked by the upper and lower eyelids and
eyelashes.
There are many iris recognition systems and the first
automatic system was developed by Daugman [2] using
efficient integrodifferential operator, which is still popular in
today’s most of the iris recognition systems. In the zero
crossings representation method [3] the image is
decomposed using wavelet transform and the required
features are extracted from the image. Using Gabor filter the
coefficients are converted to binary code for matching. Key
local variation method [4] proposed by L ma is another
technique of iris recognition. The position of the local
variations of the normalized image reduced to one
dimensional feature vector of 660. This feature vector is
Shashi Kumar D R et al, Int. J. Comp. Tech. Appl., Vol 2 (4), 884-893
IJCTA | JULY-AUGUST 2011 Available [email protected]
884
ISSN:2229-6093

converted to binary code in the matching phase and
comparison is computed using Exclusive OR.
Motivation: Traditional methods of identifying a person are
PIN, password etc. However these methods can be stolen or
faked, but biometric parameters are more secure and reliable
in personal identification. Several biometric traits have been
used till date for authentication. However most biometric
parameters have several drawbacks thus iris is chosen as the
best amongst all. Iris pattern has unique, i.e., stable
throughout one’s life time and are not similar even for twins.
Organization: The paper is organized into following
sections. Section 2 is an overview of related work. The
proposed model is described in section 3. Section 4 discusses
the algorithm of iris recognition based on DWT and PCA.
Performance analysis is discussed in section 5 and
Conclusion is given in section 6.
Contribution: In this paper, PIRDWT is proposed. The
dilation and erosion operations are used to generate iris
template. The DWT and PCA are applied on iris template to
derive iris features, and different classifiers are used for
matching.
2. Related Work
Benke Xiang and Xiaoping Cheng [5] proposed an improved
AD Adaboost algorithm for eye detection in an image. The
AD Adaboost is an integration of multiple classifier and all
of them work together to train samples. The identification
mark was used with suitable positive weight and negative
weights. Depending upon the weights the AD Adaboost
algorithm produce the results with a spread of degradation
Nitin Bhatia and Megha Chhabra [6] proposed the algorithm
of improved Hough transform for fast recognition of iris.
The iris image of size A = M X N was divided into 9 equal
parts of size M/3 X N/3. The middle part was used to get the
centre and the features of the iris. The method was to limit
the image space to the valid promising region and applying
the transforms like circle Hough transform to detect the iris
circles. Hugo Procenca [7] proposed the segmentation
method for iris recognition from degraded images acquired
in the visible wave length. The degraded images provide
poor segmentation. In the algorithm the sclera was detected
and extracted. The mandatory adjacency between the iris and
sclera was calculated for the localization of iris. The
constrained polynomial fitting procedure was adopted to get
the pupilary and scleric iris border. Liu Yang et al., [8]
proposed the iris recognition system based on chaos
encryption. After the preprocessing the features of iris were
extracted using the multiscale 2D Gabor filter to generate the
iris code. The iris code was encrypted using one way
coupled map lattice to store into the data base for future
protection of data and to reduce the size of the data base.
P Radu et al., [9] proposed the method of combining
information from both eyes for iris recognition. The CASIA
data base containing the iris images with the motion blur
was used for recognition. After the preprocessing, 2D Gabor
wavelet was employed for feature extraction. The features
from both left and right iris was combined to generate the
feature vector for the images distorted by motion blur.
Qichuan Tian et al., [10] introduced the zero crossing
detection method for iris recognition. The captured iris
image was subjected to boundary localization to locate the
boundary of iris/pupil and iris/sclera. Then the eye lashes
occlusions were detected and eliminated using the
segmentation techniques. The circular iris was then unrolled
into a horizontal strip for feature extraction. The Zero
Crossing detection was performed over the iris to extract
sharp local variations as feature vector. The matching was
performed using Exclusive OR operation. Mahdi S Hosseini
et al., [11] presented the algorithm of extracting the pigment
melanin for iris recognition. The iris image acquired in
Visible Light (VL) session will be affected by reflections
from cornea thus the pattern of melanin pigments and shapes
were extracted to get more features. The Near Infrared
(NIR) images were also used for feature extraction using the
variable technique on image histogram. The features from
VL and NIR images were fused to generate the final feature
vector.
Chung-Chih Tsai N et al., [12] presented a matching strategy
based on possibilistic fuzzy clustering algorithm for iris
recognition system. The gradient iris image around the iris
boundaries was generated in the radial direction. The Fuzzy
gray scale curve tracing method was applied to extract the
smooth curve of the inner and outer boundaries. A bank of
Gabor filters were used to detect the local feature points to
generate the feature vector. The matching was performed
using Fuzzy Clustering method. Nathan D Kalka et al.,[13]
presented the Dampster-Shafer (DS) algorithm to estimate
and fuse quality factors for different iris images. A
procedure was presented for estimation of defocus blur,
occlusion, lighting, motion blur, specular reflection, off-
angle, pixel counts and their features were applied on the
images of the data sets CASIA 3.0, WVU and ICE 1.0. Then
the features were combined using DS fusion algorithm to
assess the unified quality score as a measure of the overall
suitability for authenticating the individual. Eri Prasentyo
Wibowo and Wisnu Sukma Moulana [14] proposed the real
time iris recognition system using fusion of multiple
techniques. The dilation and erosion techniques were applied
on iris images. The value between dilation and erosion was
calculated. Iris localization was done using the skeleton
algorithm and pupil edge boundary detection algorithm.
Cutting and canny edge detectors were used for feature
extraction. Matching was performed using Hamming and
Euclidean distance algorithms. Poulami Das et al., [15]
Shashi Kumar D R et al, Int. J. Comp. Tech. Appl., Vol 2 (4), 884-893
IJCTA | JULY-AUGUST 2011 Available [email protected]
885
ISSN:2229-6093

presented the statistical approach for iris recognition and
personal identification. After the preprocessing operations,
the pupil area the boundary was located using the edge
detection operator. The iris location and boundary detection
was performed and then 12 X 8 rectangular area of iris
effective region was extracted. The statistical correlation
coefficients were calculated using statistical estimation
theory for matching and recognition. Kazuyuki Miyazawa et
al., [16] proposed an iris recognition system using phase
based image matching. In preprocessing iris localization and
normalization was performed. The matching was carried
using matching techniques of phase only correlation function
and band limited phase only correlation function. Popescu –
Bodarin and Bolas [17] introduced the family of iris
encoders for matching. The circular fuzzy iris segmentation
procedure was adopted to get limbic boundary. The features
were extracted using Haar-Hilbert based iris encoders.
Single level 2 D Discrete Haar Wavelet Transform was used
for noise attenuation and Hilbert transform was used to
encode. The phase Log–Gabor encoder was employed for
feature extraction. Jinyu Zuo and Natalia A Schmid [18]
proposed methodology for robust segmentation of non ideal
iris images. In preprocessing a sparse PDE based inpainting
procedure was applied to refine localized specular
reflections. To eliminate the noise 2D adaptive Wiener filter
was adopted. An Ellipse based model was used to contour
the estimated boundaries for pupil and iris regions. To detect
the iris boundary even under uneven illumination, contrast
balancing technique was used. The estimation of occlusion
was performed by applying adaptive illumination
compensation technique and Sobel operator. The
segmentation procedure was applied on CASIA3.0, INT,
ICE, WVU and WVU-OA data bases.
F M Wheeler et al., [19] proposed the stand off iris
technique for recognition system. A dual iris approach was
described for feature extraction. Hamming distance was used
for matching. The user was declared as identified if one of
the two irises was recognized. Zhonghua Lin and Bibo Lu
[20] suggested the iris recognition method based on the
imaginary coefficients of Morlet Wavelet Transform. The
one dimensional series of imaginary coefficients at different
scales were generated. The distribution map of imaginary
coefficients of wavelet transform at different scales was
formed. The binary code of the iris image according to the
coefficients was created. The matching and classification
was performed using the pattern matching method.
Dhananjay [21] presented the algorithm using Principal
Component Analysis for iris detection. In preprocessing step
the iris was localized and centered. The principal component
analysis was used to extract the features and computing
Eigen irises. The matching was performed using Euclidean
distance. Jing Huang et al., [22] proposed iris recognition
based on non separable wavelet. Iris image was decomposed
into wavelet sub band coefficients using sixteen non
separable wavelet filters. The Generalized Gaussian Density
(GGD) modeling of each non separable orthogonal wavelet
coefficient was treated as means for feature extraction. The
Kullback Leiblar distance between GGDs was computed for
matching. Zian Osman [23] proposed iris recognition using
phase congruency. Before applying phase congruency, the
iris was segmented in the image of the eye, then normalized
using Hough transform and Daugman’s rubber sheet model.
The wavelet transform was applied to obtain the frequency
information local to a point. The phase congruency
algorithm was applied to normalized iris image at eight
different orientations and feature vector matrix was formed.
Matching was performed using Euclidean distance.
Mohammed Abdullah et al., [24] presented an algorithm of
wavelet transform for iris recognition. The acquired image
was filtered using Gaussian filter for noise reduction. Using
the Canny edge detector and Hough transform, the iris
region was segmented and normalized. The wavelet
transform was used to extract features from the enhanced iris
image to generate feature vector. XOR operator was used for
matching. The feature vector in the form of binary code was
stored in the smart to create biometric smart card.
3. Proposed Model
The definitions and block diagram of PIRDWT are
discussed in this section.
3.1. Definitions
3.1.1. False Acceptance Rate (FAR): The probability that a
biometric system will incorrectly identify an individual or
will fail to reject an imposter using Match Count (MC) and
is designed as ratio of Match Count (MC) to the total
imposter persons (IP) as given in the Equation 1.
FAR% = �� ∗ 100 (1)
3.1.2. False Rejection Rate (FRR): The probability that a biometric system will fail to identify an enrollee using Miss Match Count (MMC) and Total Number of Persons (NP) as given in the Equation 2.
FRR% = ���� ∗ 100 (2)
3.1.3. Morphology: The technique of analyzing images based on geometrical structures and topology.
3.1.4. Threshold: The acceptance or rejection of biometric data is dependent on the match score falling above or below the threshold. The threshold is adjustable so that the biometric systems can be more or less strict, depending on the requirements of any given biometric application.
3.1.5. Equal Error Rate (EER): The rates at which both accept and reject errors are equal. The smaller the EER, the more precise is the biometric system.
Shashi Kumar D R et al, Int. J. Comp. Tech. Appl., Vol 2 (4), 884-893
IJCTA | JULY-AUGUST 2011 Available [email protected]
886
ISSN:2229-6093

Fig.1. Iris Recognition Flow Diagram
3.2. Block Diagram
The block diagram of the proposed PIRDshown in Figure 1:
3.2.1. Iris database
The iris is an annular region between the sclera and the pupil
which is rich in unique textural information. The image of an
eye is captured using the appropriate set up with good
contrast and resolution, avoiding aberrations and reflections.
The acquired image must initially be converted to grayscale
format. The Chinese Academy of Sciences Institute of
Automation (CASIA V1.0) [25] iris database is considered
to test the algorithm which consists of 756 eye images from
108 persons i.e., 7 eye images per individual. Each ey
image is a grayscale image of size 280×320. The database
images were collected using close-up iris camera in two
sessions i.e., first three images in the first session and the
next four images in the second session. The pupil regions of
all the iris images in the CASIA V1.0 database were initially
detected and replaced by a circular region of constant
intensity masking out the reflections. This makes the iris
recognition system much simpler and has minimal or no
effects on the feature extraction and match
The first six out of seven images per person are considered
to create the iris database ie., total number of images in the
database is 108×6=648. The seventh image of each person is
used as test image to compare with six images in the
database. One image sample of CASIA is shown in the
Figure 2.
Matching
Matching
Result
Test Iris
Iris Template
DWT (LL)
PCA
Iris Database
Iris Template
DWT (LL)
PCA
Recognition Flow Diagram
IRDWT model is igure 1:
annular region between the sclera and the pupil
which is rich in unique textural information. The image of an
eye is captured using the appropriate set up with good
avoiding aberrations and reflections.
ially be converted to grayscale
format. The Chinese Academy of Sciences Institute of
iris database is considered
to test the algorithm which consists of 756 eye images from
108 persons i.e., 7 eye images per individual. Each eye
image is a grayscale image of size 280×320. The database
up iris camera in two
sessions i.e., first three images in the first session and the
next four images in the second session. The pupil regions of
es in the CASIA V1.0 database were initially
detected and replaced by a circular region of constant
intensity masking out the reflections. This makes the iris
recognition system much simpler and has minimal or no
effects on the feature extraction and matching algorithms.
The first six out of seven images per person are considered
number of images in the
database is 108×6=648. The seventh image of each person is
used as test image to compare with six images in the
One image sample of CASIA is shown in the
3.2.2. Iris Template
An iris region between the pupil and the sclera from an eye
is obtained by iris localization. The iris region can be
approximated by two circles viz., one for the iris/sclera
boundary and another for the iris/pupil boundary. The upper
and lower parts of an iris region nearer to sclera are
considered as it is occupied by eyelids and eyelashes. The
initial stage begins with locating the center and radius of the
pupil in order to separate the iris image. The estimation
efficiency of the pupil depends on computational speed
rather than accuracy since it is simple in shape and is the
darkest region in an eye image and can be extracted using a
suitable threshold. The Morphological process is used to
remove the eyelashes and to obtain the center and radius of
the pupil and is shown in Figure 3.
Fig.2. Sample iris image from CASIA V1.0 database
Fig.3. Extracted pupil
The basic morphological operations are
which use the structuring element to process the image. The
structuring element with required dimension is used to
remove the eyelashes. A structuring element is a matrix
consisting of 1's and 0's which can have arbitrary shape and
size and is typically smaller than the image being processed.
The centre pixel of the structuring element is called the
origin which identifies the pixel of interest in an image and
the neighbouring elements are used to dilate or erode the
image. Dilation adds pixels to the bound
an image, while erosion removes pixels on object
boundaries. The number of pixels added or removed from
the objects in an image depends on the size and shape of
the structuring element. In dilation and erosion operations, a
rule is applied to the pixel of interest and its
an image. The rules are:
Test Iris
Iris Template
(LL)
CA
nd the sclera from an eye
is obtained by iris localization. The iris region can be
approximated by two circles viz., one for the iris/sclera
boundary and another for the iris/pupil boundary. The upper
and lower parts of an iris region nearer to sclera are not
considered as it is occupied by eyelids and eyelashes. The
initial stage begins with locating the center and radius of the
pupil in order to separate the iris image. The estimation
efficiency of the pupil depends on computational speed
racy since it is simple in shape and is the
darkest region in an eye image and can be extracted using a
suitable threshold. The Morphological process is used to
remove the eyelashes and to obtain the center and radius of
Fig.2. Sample iris image from CASIA V1.0 database
Extracted pupil
The basic morphological operations are dilation and erosion
which use the structuring element to process the image. The
structuring element with required dimension is used to
remove the eyelashes. A structuring element is a matrix
consisting of 1's and 0's which can have arbitrary shape and
aller than the image being processed.
The centre pixel of the structuring element is called the
which identifies the pixel of interest in an image and
elements are used to dilate or erode the
image. Dilation adds pixels to the boundaries of an object in
an image, while erosion removes pixels on object
boundaries. The number of pixels added or removed from
the objects in an image depends on the size and shape of
. In dilation and erosion operations, a
plied to the pixel of interest and its neighbours in
Shashi Kumar D R et al, Int. J. Comp. Tech. Appl., Vol 2 (4), 884-893
IJCTA | JULY-AUGUST 2011 Available [email protected]
887
ISSN:2229-6093

i) The origin of the structuring element identifies the pixel
of interest in the input eye image and the
of all the pixels in its neighbourhood is assigned to the
corresponding pixel in the output image. In a binary
image, if any of the pixels is set to 0, the output pixel is
also set to 0 in erosion as shown in Figure
��������0 1 0 0 0 1 0 00 0 0 1 0 0 0 00 0 0 1 1 0 0 00 0 1 1 1 1 0 00 0 1 1 1 1 0 00 0 0 1 1 0 0 00 0 0 0 0 0 1 00 0 0 0 0 0 0 1�
�������
��������0 0 00 0 00 0 00 0 00 0 00 0 00 0 00 0 0
Fig.4. Eroded image
ii) The origin of the structuring element identifies the pixel
of interest in the input eye image and the
of all the pixels in its neighbourhood is assigned to the
corresponding pixel in the output image. In a binary
image, if any of the pixels is set to the value
pixel is also set to 1 in dilation as shown in the Figure
��������0 0 0 0 0 0 0 00 0 0 0 0 0 0 00 0 0 0 0 0 0 00 0 0 1 1 0 0 00 0 0 1 1 0 0 00 0 0 0 0 0 0 00 0 0 0 0 0 0 00 0 0 0 0 0 0 0�
�������
��������0 0 00 0 00 0 00 0 10 0 10 0 00 0 00 0 0
Fig.5. Dilated image
Pupil Detection: Connected components labeling scans an
image and groups its pixels into components based on
connectivity. All pixels in a connected component share
similar pixel intensity values and are in some way connected
Erosion
Dilation
of the structuring element identifies the pixel
of interest in the input eye image and the minimum value
is assigned to the
esponding pixel in the output image. In a binary
0, the output pixel is
also set to 0 in erosion as shown in Figure 4.
0 0 0 0 00 0 0 0 00 0 0 0 01 1 0 0 01 1 0 0 00 0 0 0 00 0 0 0 00 0 0 0 0�
�������
of the structuring element identifies the pixel
of interest in the input eye image and the maximum value
is assigned to the
corresponding pixel in the output image. In a binary
image, if any of the pixels is set to the value 1, the output
pixel is also set to 1 in dilation as shown in the Figure 5.
0 0 0 0 00 0 0 0 01 1 0 0 01 1 1 0 01 1 1 0 01 1 0 0 00 0 0 0 00 0 0 0 0�
�������
Connected components labeling scans an
into components based on pixel
All pixels in a connected component share
and are in some way connected
with each other. Once all groups have been determined, each
pixel in that group is labeled. The center and the diameter of
all the groups are determined and the one with the largest
diameter is the pupil.
Now the upper and lower portions of the iris, occluded by
eyelashes and eyelids are removed by setting all the pixels
above and below the diameter of the pupil as Not a Number
(NaN) as shown in Figure 6.
Fig.6. After removing upper and lower iris regions
According to the Springer analysis of the CASIA database
[26], the lowest and highest iris radius is found to be 90
125. Based on this, 45 pixels to the left and right of the pupil
boundary is considered as iris region for the proposed
algorithm analysis as shown in Figure
Fig.7. Localized image
Conventional iris recognition systems use edge detection
techniques for localization like Hough circle for iris and
pupil boundary detection and line detecting algorithms for
eyelids. These methods involve excessive computation and
hence are time consuming. However, we have used
morphological processing which reduces the time required
for preprocessing to a large extent. Also, conventional
methods use Daugman’s rubber sheet model for iris
normalization. In the proposed method, iris normalization is
avoided. From the localized image, the iris regions to the left
and right of the pupil are selected and a template is created
by mapping the selected pixels on a 60×80 matrix as shown
in Figure 8.
Histogram equalization is done on each iris template to
generate an image whose intensity
also covers the entire range of intensity levels. The resulting
image has high contrast as shown in Figure
with each other. Once all groups have been determined, each
. The center and the diameter of
determined and the one with the largest
Now the upper and lower portions of the iris, occluded by
eyelashes and eyelids are removed by setting all the pixels
ameter of the pupil as Not a Number
After removing upper and lower iris regions
According to the Springer analysis of the CASIA database
iris radius is found to be 90 and
. Based on this, 45 pixels to the left and right of the pupil
boundary is considered as iris region for the proposed
igure 7.
Localized image
Conventional iris recognition systems use edge detection
techniques for localization like Hough circle for iris and
pupil boundary detection and line detecting algorithms for
eyelids. These methods involve excessive computation and
. However, we have used
morphological processing which reduces the time required
for preprocessing to a large extent. Also, conventional
methods use Daugman’s rubber sheet model for iris
normalization. In the proposed method, iris normalization is
From the localized image, the iris regions to the left
and right of the pupil are selected and a template is created
by mapping the selected pixels on a 60×80 matrix as shown
Histogram equalization is done on each iris template to
levels are uniform and it
also covers the entire range of intensity levels. The resulting
image has high contrast as shown in Figure 9.
Shashi Kumar D R et al, Int. J. Comp. Tech. Appl., Vol 2 (4), 884-893
IJCTA | JULY-AUGUST 2011 Available [email protected]
888
ISSN:2229-6093

Fig.8. Iris template
Fig.9. Histogram equalized iris template
3.2.3. DWT
Discrete Wavelet Transform (DWT) is applied on the
Histogram equalized iris template to determine DWT
coefficients by passing the signal through low pass filter to
derive approximation coefficients and high pass filter to get
detail coefficients. The coiflet wavelet is used to generate
four bands of coefficients viz., approximation, horizontal,
vertical and diagonal as shown in Figure 10.
3.2.4. PCA Feature Extraction
The Principal Component Analysis (PCA), known as Eigen
XY analysis is applied on the approximation band of DWT
to reduce the dimensionality of the image data. This
technique extracts the main variations in the feature vector
and allows an accurate reconstruction of the data to be
produced from the extracted feature values and reduces the
amount of computation needed. PCA identifies the strength
of variations along different directions in the image data
which involves computation of Eigen vectors and
corresponding Eigen values. The Eigen vectors with largest
associated Eigen values are the principal components and
correspond to maximum variation in the data set.
Eigen vectors can only be found in square matrices; however
every square matrix need not have Eigen vectors. There are
n Eigen vectors for a given n×n matrix that has Eigen
vectors. The proposed model consists of 648 Eigen vectors.
Eigen vectors of a square matrix are the non
which being multiplied by the matrix remains proportional
to the original vector. The examples of non Eigen and an
Eigen Vector are given in Equations 3 and 4
. Histogram equalized iris template
Discrete Wavelet Transform (DWT) is applied on the
Histogram equalized iris template to determine DWT
coefficients by passing the signal through low pass filter to
derive approximation coefficients and high pass filter to get
wavelet is used to generate
four bands of coefficients viz., approximation, horizontal,
The Principal Component Analysis (PCA), known as Eigen-
ximation band of DWT
to reduce the dimensionality of the image data. This
technique extracts the main variations in the feature vector
and allows an accurate reconstruction of the data to be
produced from the extracted feature values and reduces the
of computation needed. PCA identifies the strength
along different directions in the image data
which involves computation of Eigen vectors and
corresponding Eigen values. The Eigen vectors with largest
ipal components and
correspond to maximum variation in the data set.
Eigen vectors can only be found in square matrices; however
every square matrix need not have Eigen vectors. There are
matrix that has Eigen
roposed model consists of 648 Eigen vectors.
Eigen vectors of a square matrix are the non-zero vectors,
which being multiplied by the matrix remains proportional
to the original vector. The examples of non Eigen and an
respectively.
Fig.10. Results of DWT transform
�2 32 1� �1
3� = �115
�2 32 1� �3
2� = �128 �=4×
The steps involved in PCA include:
• The DWT coefficients of each iris template, of size
40×32 are converted into a one
vector. These column vectors of 648 images are stacked
to form a matrix ‘X’ of size 1280×648.
• The mean of each vector is given
�� = 1� � ��
!"#
Where N=648.
• The mean is subtracted from all of the vectors to
produce a set of zero mean vectors given in Equation
Xz=Xi - Xm
Where
Xz is the zero mean vectors,
Xi is each element of the column vector,
Xm is the mean of each column vector.
• The Covariance matrix is computed using
Equation 7.
C= [XzT × Xz]
• The Eigen Vectors and Eigen valu
Equation 8.
[C – λI ]e = 0
Where
λ’s are the Eigen value and
e’s are the Eigen vectors.
This gives us N Eigen Vectors (e1, e2,…,eN).
Results of DWT transform
�115 �
(3)
�=4�32� (4)
The steps involved in PCA include:
coefficients of each iris template, of size
converted into a one-dimensional column
vector. These column vectors of 648 images are stacked
’ of size 1280×648.
he mean of each vector is given in Equation 5.
(5)
The mean is subtracted from all of the vectors to
produce a set of zero mean vectors given in Equation 6.
(6)
is each element of the column vector,
is the mean of each column vector.
The Covariance matrix is computed using an
× Xz] (7)
The Eigen Vectors and Eigen values are computed using
(8)
This gives us N Eigen Vectors (e1, e2,…,eN).
Shashi Kumar D R et al, Int. J. Comp. Tech. Appl., Vol 2 (4), 884-893
IJCTA | JULY-AUGUST 2011 Available [email protected]
889
ISSN:2229-6093
• Each of an Eigen vectors is multiplied with zero mean
vectors Xz to form the feature vector. The feature
vector is given in Equation 9.
fi = [Xz] Vi (9)
• The signature of each image is found by multiplying
the transpose of zero mean vectors with feature vectors
given in Equation 10.
S% = [Xz)]f% (10)
3.2.5. Matching
The features of the test image are compared with the features
of images in the database for match or non match using
classifiers such as:
i) K-Nearest Neighbors (KNN): It involves (a) Training
phase in which the feature vectors are stored and the
class labels are assigned to the training samples and (b)
Classification phase in which the test sample is
classified by assigning the label which is most
frequently occurring among the k training samples
closest to the test sample. Cityblock distance parameter
in KNN is used for matching and is given in Equation
11.
,-., 01 = �|03 − .3|5
6"# -111
ii) Random forest (RF): The training set consisting of N
cases is sampled at random to form a new training set,
which is used for growing the decision trees. If there
are M variables, then m<<M variables are selected
which are used to split the node. The tree is grown
without pruning. For a given input vector each tree
gives its classification, this is called as voting. The
forest chooses the class which has maximum number
of votes. The error is calculated during the training.
The feature vectors are sampled and a few vectors are
left out and are called OOB (out-of-bag) data. The size
of OOB data is about N/3. The classification error is
estimated by using this OOB data. The classification
error is calculated as follows:
• A prediction is obtained for each vector which is OOB
relative to the i89 tree.
• The class winner (one with majority votes) is found
from the vectors which are OOB and compared to
ground-truth response.
• The ratio of misclassified OOB vectors to all vectors in
the original data is equal to the classification error.
The forest error depends on two things such as:
a) The correlation between any two trees in the forest.
Increasing the correlation increases the error.
b) The strength of each individual tree in the forest.
Increasing the strength decreases the error.
iii) Support Vector Machine (SVM) classifier: It takes a
set of input data and predicts which of the possible
classes the input belongs to. The input data is treated
as an x-dimensional vector. It builds a model by
constructing a set of hyper planes in a high
dimensional space. For an x-dimensional vector, (x-1)
hyper planes are created. A good separation is
achieved by the hyper plane that has the largest
distance to the nearest training data points of any
class and is the functional margin. The larger the
margin, the better is the classification.
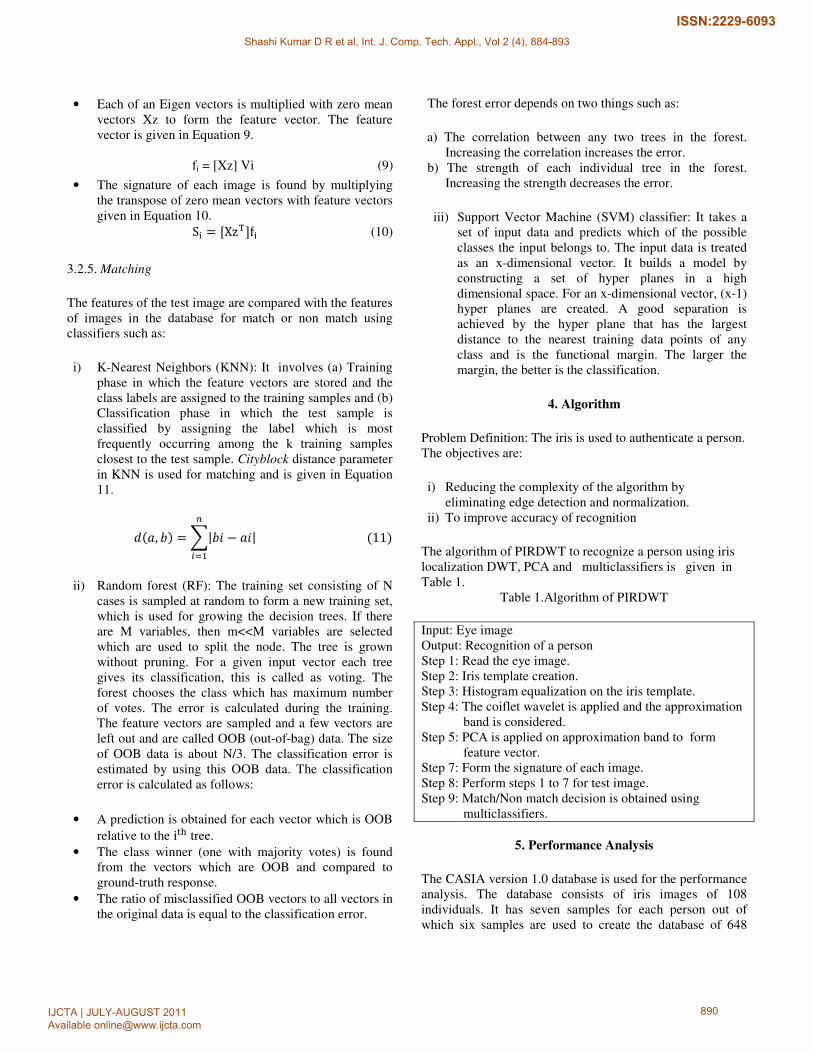
4. Algorithm
Problem Definition: The iris is used to authenticate a person.
The objectives are:
i) Reducing the complexity of the algorithm by
eliminating edge detection and normalization.
ii) To improve accuracy of recognition
The algorithm of PIRDWT to recognize a person using iris
localization DWT, PCA and multiclassifiers is given in
Table 1.
Table 1.Algorithm of PIRDWT
Input: Eye image
Output: Recognition of a person
Step 1: Read the eye image.
Step 2: Iris template creation.
Step 3: Histogram equalization on the iris template.
Step 4: The coiflet wavelet is applied and the approximation
band is considered.
Step 5: PCA is applied on approximation band to form
feature vector.
Step 7: Form the signature of each image.
Step 8: Perform steps 1 to 7 for test image.
Step 9: Match/Non match decision is obtained using
multiclassifiers.
5. Performance Analysis
The CASIA version 1.0 database is used for the performance
analysis. The database consists of iris images of 108
individuals. It has seven samples for each person out of
which six samples are used to create the database of 648
Shashi Kumar D R et al, Int. J. Comp. Tech. Appl., Vol 2 (4), 884-893
IJCTA | JULY-AUGUST 2011 Available [email protected]
890
ISSN:2229-6093

images and one sample per person is used for the test image.
The seven iris samples of a person are shown in Figure
Fig.11. Iris samples of one person from CASIA V1.0 database
The recognition rate i.e., Success Rate (SR
using an Equation 12.
SR = Number of persons correctly recognizedTotal number of persons in the database
The SR for different number of features with KNN,
SVM are tabulated in the Table 2. It is observed that the
improves as the number of features increases from 10 to 50.
KNN classifier gives better SR compared to RF and SVM
for 50 features.
Table 2. Accuracy of recognition for different number of
features
Number of
features per
image
Success Rate (%)
KNN RF
50 99.07 98.15
40 99.07 98.15
30 94.45 98.15
20 90.75 97.22
10 78.70 89.81
The performance parameters such as FAR, FRR and EER
are evaluated by splitting total database of 108 persons into
90 and 18 persons. The database is created
with 6 images per person i.e., total number of images in the
database are 540. FRR is calculated by comparing seventh
image of every individual with 540 images in the database of
90 persons. FAR is calculated by considering 18 individuals
as imposters and are compared with 540 images in the
database. The variations of FAR and FRR with thresho
shown in the Figure 12. It is noticed that for lower values of
threshold, there is a possibility of genuine samples
is used for the test image.
The seven iris samples of a person are shown in Figure 11.
Iris samples of one person from CASIA V1.0 database
(SR) is determined
recognizeddatabase -121
SR for different number of features with KNN, RF and
It is observed that the SR
as the number of features increases from 10 to 50.
compared to RF and SVM
Table 2. Accuracy of recognition for different number of
Success Rate (%)
SVM
97.22
97.22
97.22
97.22
87.96
performance parameters such as FAR, FRR and EER
are evaluated by splitting total database of 108 persons into
he database is created for 90 persons
ber of images in the
lculated by comparing seventh
image of every individual with 540 images in the database of
90 persons. FAR is calculated by considering 18 individuals
as imposters and are compared with 540 images in the
database. The variations of FAR and FRR with threshold is
. It is noticed that for lower values of
samples being
rejected and hence the FRR is high and for higher values of
threshold, invalid samples could also be accepted as a valid
match, hence the FAR is high. The
Fig.12. Plot of FAR and FRR vs. threshold
Table 3. Comparison of efficiency between existing
and proposed algorithm
Algorithms Number of
features
Existing
IRDWT [27]
24
Proposed
PIRDWT
40
The efficiency of the existing algorithm
using Discrete Wavelet Transform (IRDWT)
compared with the proposed PIRD
The efficiency of the proposed algorithm is improved by
increasing the number of features and using morphological
localization with reduced region of interest in the iris portion
compared to the existing algorithm.
6. Conclusion
Iris pattern recognition is one of the most
and promising approaches for individual
this paper PIRDWT algorithm based on DWT and PCA is
proposed. The basic morphological operations such as
dilation and erosion are used to remove the ey
eyelids. Histogram equalization is applied to get the high
contrast iris image. As per the Springer Analysis of CASIA
data base maximum features will be found in iris image at
the radius of 90 to 125 pixels on left and right of the pupil
boundary. In our algorithm 45 pixels portions of the iris to
the left and right of the pupil is considered to get the
template. Using DWT and PCA the feature vector is
generated. The matching of test iris and data base iris is
performed using KN, RF and SVM Cla
that the success rate is better in the case of KNN classifier
compared to RF and SVM. In future the features are
rejected and hence the FRR is high and for higher values of
threshold, invalid samples could also be accepted as a valid
ence the FAR is high. The value of n EER is 0.111.
. Plot of FAR and FRR vs. threshold
Table 3. Comparison of efficiency between existing
and proposed algorithm
Efficiency
98.98
99.07
The efficiency of the existing algorithm, Iris Recognition
using Discrete Wavelet Transform (IRDWT) [27] is
IRDWT is given in Table 3.
The efficiency of the proposed algorithm is improved by
increasing the number of features and using morphological
localization with reduced region of interest in the iris portion
compared to the existing algorithm.
6. Conclusion
cognition is one of the most reliable, secure
and promising approaches for individual authentication. In
this paper PIRDWT algorithm based on DWT and PCA is
proposed. The basic morphological operations such as
dilation and erosion are used to remove the eyelashes and
eyelids. Histogram equalization is applied to get the high
contrast iris image. As per the Springer Analysis of CASIA
data base maximum features will be found in iris image at
the radius of 90 to 125 pixels on left and right of the pupil
ary. In our algorithm 45 pixels portions of the iris to
the left and right of the pupil is considered to get the
template. Using DWT and PCA the feature vector is
generated. The matching of test iris and data base iris is
performed using KN, RF and SVM Classifiers. It is found
that the success rate is better in the case of KNN classifier
In future the features are
Shashi Kumar D R et al, Int. J. Comp. Tech. Appl., Vol 2 (4), 884-893
IJCTA | JULY-AUGUST 2011 Available [email protected]
891
ISSN:2229-6093

generated by different techniques and are fused with
multiple classifiers.
References
[1] A K Jain, Ross A, Nandakumar K, “Introduction to
Biometrics,” Ninteenth IEEE International Conference
on Pattern Recognition, pp. 1-1, December 2008.
[2] J Daugman, “How Iris recognition Works,” IEEE
Transaction on Circuits and Systems for Video
Technology, vol 14, issue 1, pp 21-30, 2004.
[3] W Boles and Boashashash, “A Human Identification
Technique Using Images of the Iris and Wavelet
Transform,” IEEE Transaction on Signal Processing,
vol 46, pp. 1185-1188, April 1998.
[4] L Ma, “Efficient Iris Recognition by Characterising Key
Local Variations,” IEEE Transactions on Image
Processing, vol 13, pp. 739-750, June 2004.
[5] Benke Xiang and Xiaoping Cheng, “Eye Detection Based
on Improved AD AdaBoost Algorithm,” Second IEEE
International Conference on Signal Processing Systems,
vol 2, pp 617-620, 2010.
[6] Nitin Bhatia and Megha Chhabra, “Improved Hough
Transform for Fast Iris Detection,” Second IEEE
International Conference on Signal Processing systems,
vol VI, pp. 172 -176, 2010.
[7] Hugo Procenca, “Iris Recognition: On the Segmentation
of Degraded Images Acquired in the Visible
Wavelength,” IEEE Transactions on Pattern Analysis
and Machine Intelligence, vol 32, no. 8, pp 1502-1516,
August 2010.
[8] Liu Yang, Yue Xue Dong, Liu Ying Fei and He Yan,
“Iris Recognition System Based on Choas Encryption,”
IEEE International Conference on Computer Design and
Applications, vol 1, pp. 537-539, 2010.
[9] P Radu, K Sirlantzis, G Howells, S Hoque and F Deravi,
“On Combining Information from Both Eyes to Cope
With Motion Blur in Iris Recognition,” Fourth
International Workshop on Soft Computing
Application, pp 175-180, July 2010.
[10] Qichuan Tian, Xirong Liu, Ziliang Li and Linsheng Li,
“Imperfect Iris Information for Identity Recognition,”
Second IEEE International Congress on Image and
Signal Processing, pp. 1-5, October 2009.
[11] Mahdi S Hosseini, Babak N Araabi, Hamid Saltranian,
“Pigment Melanin: Pattern for Iris Recognition,” IEEE
Transactions on Instrumentation and Measurement, vol
59, no. 4, pp 792-804, April 2010.
[12] Chung–Chih Tsai, Heng-Yi Lin, Jinshiuh Taur and
Chin–Wang Tao, “A New Matching Approach for Local
Feature Based Iris Recognition System,” Fifth IEEE
International Conference on Industrial Electronics and
Applications, pp. 387-392, July 2010.
[13] Nathan D Kalka, Jinyu Zuo, Natalia A Schmid, Bojan
Cukic, “Estimating and Fusing Quality Factors for Iris
Biometric Images,” IEEE Transactions on Systems,
Man and Cybernetics-Part A: Systems and Humans, vol
40, no 3, pp 509-524, May 2010.
[14] Eric Prasetyo Wibowo and Wisnu Sukma Maulana,
“Real Time Iris Recognition System Using A Proposed
Method,” IEEE International Conference on Signal
Processing, pp 98-102, 2009.
[15] Poulami Das, Debnath Bhattacharyya, Samir Kumar
Bandyopadhyay, Tai-hoon Kim, “Person Identification
Through Iris Recognition,” International Journal of
Security and Its Applications, vol 3, no 1, pp 129-148,
January 2009.
[16] Kazuyuki Miyazawa, Kaichi Ito, Takafumi Aoki, Koji
Kobayashi and Atsushi Katsumata, “An iris Recognition
System Using Phase Based Image Matching,” IEEE
International Conference on Image Processing, pp. 325-
328, 2006.
[17] N popescu – Bodorin and V E Balas, “Comparing Haar-
Hilbert and Log – Gabor Based Iris Encoders on Bath
Iris Image Database,” Fourth IEEE International
Workshop on Soft Computing Application, pp. 191-196,
July 2010.
[18] Jinyu Zuo and Natalia A Schmid, “On A Methodology
for Robust Segmentation of Nonideal Iris Images,”
IEEE Transactions on Systems, Man and Cybernetics-
Part B: Systems and Humans, vol 40, no 3, pp 703-718,
June 2010.
[19] F. M Wheeler, Perera A G A, Abramovich G, Bing Yu,
Tu P H, “Stand-Off Iris Recognition System,” Second
IEEE International Conference on Biometrics: Theory,
Applications and Systems, pp 1-7, 2008
[20] Zhonghua Lin and Bibo Lu, “Iris Recognition Method
Based on the Imaginary Coefficients of Morlet wavelet
Transform,” Seventh IEEE international Conference on
Fuzzy Systems and Knowledge Discovery, pp. 573-577,
September 2010.
[21] Dhananjay Theckedath, “Iris Detection Based on
Principal Component Analysis-Eigen Irises,” SPIT-
IEEE Colloquium and international Conference, vol 1,
pp 49-52,
[22] Jing Huang, Xinge You, Yuan Yan Tang, “Iris
Recognition Based on Non Separable Wavelet,” IEEE
International Conference on Systems, Man and
Cybernetics, pp. 1552-1557, 2008
[23] Zian Osman, “Iris Recognition Using Phase
Congruency,” IEEE International Conference on
Modelling and Simulation, pp. 341-344, 2011.
[24] Mohammed A M Abdullah, F H A Al-Dulaimi, Waleed
Al-Nuaimy and Ali Al-Ataby, “Smart Card with Iris
Recognition for Hifh Security Access Environment,”
IEEE International Conference on Biomedical
Engineering, pp. 382-385, 2011.
[25] http://www.sinobiometrics.com, CASIA Iris Image
Database.
[26] http://www.springerimages.com, Springer Analysis of
CASIA Database.
Shashi Kumar D R et al, Int. J. Comp. Tech. Appl., Vol 2 (4), 884-893
IJCTA | JULY-AUGUST 2011 Available [email protected]
892
ISSN:2229-6093

[27] Lenina Birgale and Manesh Kokare, “Iris Recognition
Using Discrete Wavelet Transform,” IEEE International
Conference on Digital Image Processing, pp. 147-151,
August 2009.
Shashikumar D R received B.E degree in
Electronics & Communication Engineering
from Mysore University and M.E degree in
Electronics from Bangalore University,
Bangalore. He is pursuing his Ph.D. in
Information and Communication
Technology of Fakir Mohan University, Balasore, Odisha
under the guidance of Dr. K. B. Raja, Assistant Professor,
Department of Electronics and Communication Engineering,
University Visvesvaraya College of Engineering,
Dr.Sabyasachi Pattanaik Professor & HOD, Department of
Information and Communication Technology F M
University, Balasore, Odisha, R K Chhootaray, Principal,
Seemantha Engineering College, Orissa. He has got 6
publications in national and International Journals and
Conferences. He is currently working as Professor, Dept. of
Computer Science, Cambridge Institute of Technology,
Bangalore. His research interests include Microprocessors,
Pattern Recognition, and Biometrics.
K B Raja is an Assistant Professor, Dept. of
Electronics and Communication
Engineering, University Visvesvaraya
college of Engineering, Bangalore
University, Bangalore. He obtained his BE
and M.E in Electronics and Communication
Engineering from University Visvesvaraya College of
Engineering, Bangalore. He was awarded Ph.D. in Computer
Science and Engineering from Bangalore University. He has
received best paper presentation awards in many
International Conferences. He is involved in guiding several
Ph.D scholars in the field of Image processing, VLSI design
and Computer Networks. He has over 65 research
publications in refereed International Journals and
Conference Proceedings. His research interests include
Image Processing, Biometrics, VLSI, Signal Processing and
Computer Networks.
Dr. Sabyasachi Pattnaik has done his B.E
in Computer Science, and M Tech., from
IIT Delhi. He has received his Ph D degree
in Computer Science in the year 2003 and
now working as Professor in the
Department of Information and
Communication Technology, in Fakir Mohan University,
Vyasa Vihar, Balasore, Odisha, India. He has got 21 years of
teaching and research experience in the field of Neural
Networks, Soft Cmputing Techniques. He has got 52
publications in National & International Journals and
Conferences. He has published three books in Office
Automation, Object Oriented Programming using C++ and
Artificial Intelligence. At present he is involved in guiding 8
Ph D scholars in the field of Neural Networks, Cluster
Analysis, Bio-informatics, Computer Vision & Stock Market
Applications. He has received the best paper award & gold
medal from Orissa Engineering Congress in 1992 and
Institution of Engineers in 2009.
R K Chhootaray received B.Sc
Engineering in Electrical Engineering and
M.Sc Engineering in Electrical Engineering
with specialization in Control Systems
from Banaras Hindu University, and Ph D
in Control Systems from Sambalpur
University. He was Professor and Head of Department of
Computer Science and Engineering, Regional Engineering
College, Rourkela, from which he retired in 2003.
Currently he is working as Principal of Seemanta
Engineering College, Odisha. He has been associated with
many Universities of India in the capacity of Chairman and
member of various Boards of Studies, Syllabus Committee,
and Regulation Committee. He has about hundred
publications in International and National Journals of repute,
and has received Best Technical Paper award in many
occasions. His special fields of interest include Control of
Infinite Dimensional Hereditary Systems, Modeling and
Simulation, Theoretical Computer Science, Signal and
Image Processing, and Optimization.
Shashi Kumar D R et al, Int. J. Comp. Tech. Appl., Vol 2 (4), 884-893
IJCTA | JULY-AUGUST 2011 Available [email protected]
893
ISSN:2229-6093