Copper cobalt oxide ore Tenke Fungurume, DRC Certificate ...
26
AMIS0295 Certified Reference Material Copper cobalt oxide ore Tenke Fungurume, DRC Certificate of Analysis AMIS (A Division of Torre Analytical Services (Pty) Limited) (Reg. No. 1989/000201/07) A: 11 Avalon Road, West Lake View Ext 11, Modderfontein, South Africa P: PO Box 856, Isando, 1600, Gauteng, South Africa T: +27 (0) 11 923-0800 W: www.amis.co.za Directors: JT Botes, R Naidoo, NN Robinson, M Padayachee
Transcript of Copper cobalt oxide ore Tenke Fungurume, DRC Certificate ...
AMIS0295
Certified Reference Material
Copper cobalt oxide ore Tenke Fungurume, DRC
Certificate of Analysis
AMIS (A Division of Torre Analytical Services (Pty) Limited)
(Reg. No. 1989/000201/07)
A: 11 Avalon Road, West Lake View Ext 11, Modderfontein, South Africa
P: PO Box 856, Isando, 1600, Gauteng, South Africa
T: +27 (0) 11 923-0800
W: www.amis.co.za
Directors: JT Botes, R Naidoo, NN Robinson, M Padayachee
1
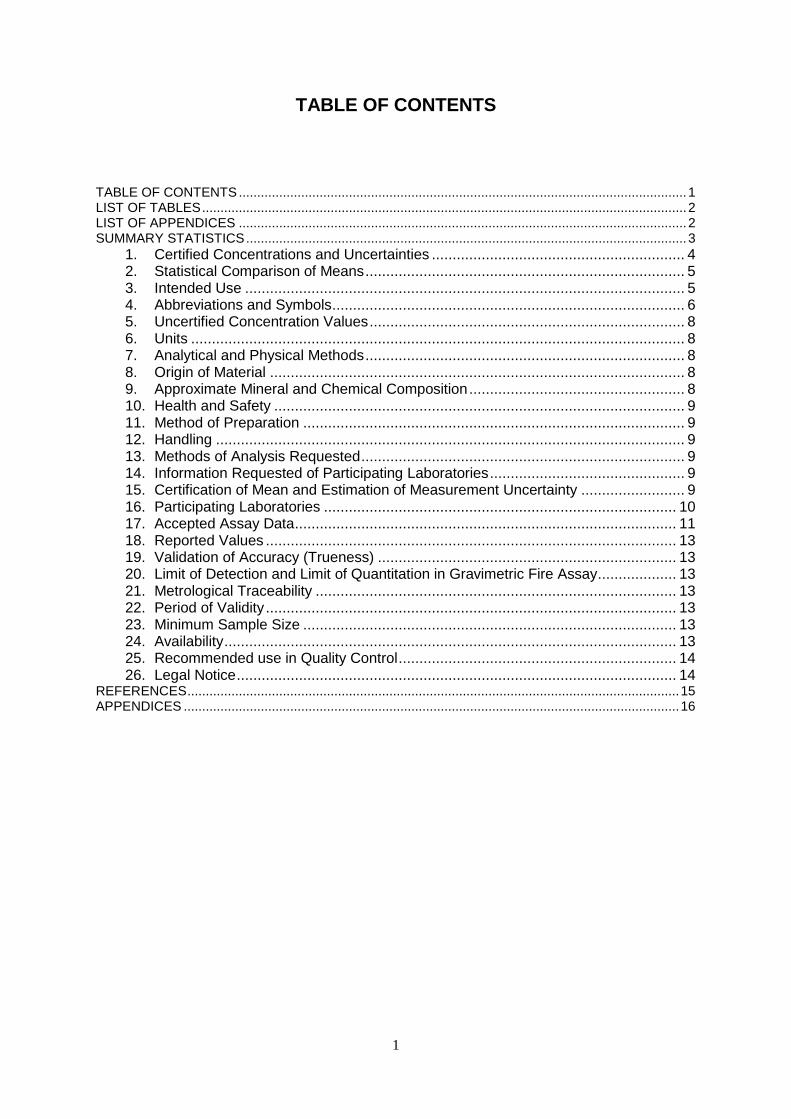
TABLE OF CONTENTS TABLE OF CONTENTS .......................................................................................................................... 1 LIST OF TABLES .................................................................................................................................... 2 LIST OF APPENDICES .......................................................................................................................... 2 SUMMARY STATISTICS ........................................................................................................................ 3
1. Certified Concentrations and Uncertainties ............................................................. 4 2. Statistical Comparison of Means ............................................................................. 5 3. Intended Use .......................................................................................................... 5 4. Abbreviations and Symbols ..................................................................................... 6 5. Uncertified Concentration Values ............................................................................ 8 6. Units ....................................................................................................................... 8 7. Analytical and Physical Methods ............................................................................. 8 8. Origin of Material .................................................................................................... 8 9. Approximate Mineral and Chemical Composition .................................................... 8 10. Health and Safety ................................................................................................... 9 11. Method of Preparation ............................................................................................ 9 12. Handling ................................................................................................................. 9 13. Methods of Analysis Requested .............................................................................. 9 14. Information Requested of Participating Laboratories ............................................... 9 15. Certification of Mean and Estimation of Measurement Uncertainty ......................... 9 16. Participating Laboratories ..................................................................................... 10 17. Accepted Assay Data ............................................................................................ 11 18. Reported Values ................................................................................................... 13 19. Validation of Accuracy (Trueness) ........................................................................ 13 20. Limit of Detection and Limit of Quantitation in Gravimetric Fire Assay ................... 13 21. Metrological Traceability ....................................................................................... 13 22. Period of Validity ................................................................................................... 13 23. Minimum Sample Size .......................................................................................... 13 24. Availability ............................................................................................................. 13 25. Recommended use in Quality Control ................................................................... 14 26. Legal Notice .......................................................................................................... 14
REFERENCES ...................................................................................................................................... 15 APPENDICES ....................................................................................................................................... 16
2
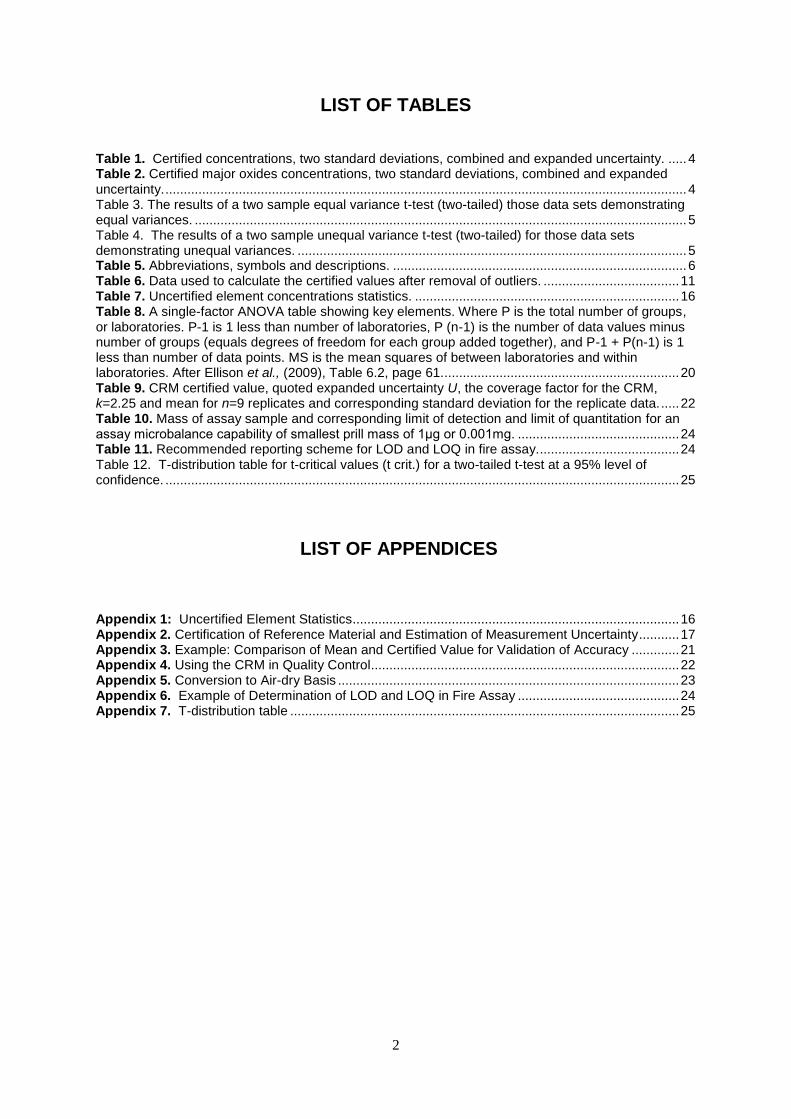
LIST OF TABLES Table 1. Certified concentrations, two standard deviations, combined and expanded uncertainty. ..... 4 Table 2. Certified major oxides concentrations, two standard deviations, combined and expanded uncertainty. .............................................................................................................................................. 4 Table 3. The results of a two sample equal variance t-test (two-tailed) those data sets demonstrating equal variances. ...................................................................................................................................... 5 Table 4. The results of a two sample unequal variance t-test (two-tailed) for those data sets demonstrating unequal variances. .......................................................................................................... 5 Table 5. Abbreviations, symbols and descriptions. ................................................................................ 6 Table 6. Data used to calculate the certified values after removal of outliers. ..................................... 11 Table 7. Uncertified element concentrations statistics. ........................................................................ 16 Table 8. A single-factor ANOVA table showing key elements. Where P is the total number of groups, or laboratories. P-1 is 1 less than number of laboratories, P (n-1) is the number of data values minus number of groups (equals degrees of freedom for each group added together), and P-1 + P(n-1) is 1 less than number of data points. MS is the mean squares of between laboratories and within laboratories. After Ellison et al., (2009), Table 6.2, page 61. ................................................................ 20 Table 9. CRM certified value, quoted expanded uncertainty U, the coverage factor for the CRM, k=2.25 and mean for n=9 replicates and corresponding standard deviation for the replicate data. ..... 22 Table 10. Mass of assay sample and corresponding limit of detection and limit of quantitation for an assay microbalance capability of smallest prill mass of 1μg or 0.001mg. ............................................ 24 Table 11. Recommended reporting scheme for LOD and LOQ in fire assay. ...................................... 24 Table 12. T-distribution table for t-critical values (t crit.) for a two-tailed t-test at a 95% level of confidence. ............................................................................................................................................ 25
LIST OF APPENDICES Appendix 1: Uncertified Element Statistics ......................................................................................... 16 Appendix 2. Certification of Reference Material and Estimation of Measurement Uncertainty ........... 17 Appendix 3. Example: Comparison of Mean and Certified Value for Validation of Accuracy ............. 21 Appendix 4. Using the CRM in Quality Control.................................................................................... 22 Appendix 5. Conversion to Air-dry Basis ............................................................................................. 23 Appendix 6. Example of Determination of LOD and LOQ in Fire Assay ............................................ 24 Appendix 7. T-distribution table .......................................................................................................... 25
3
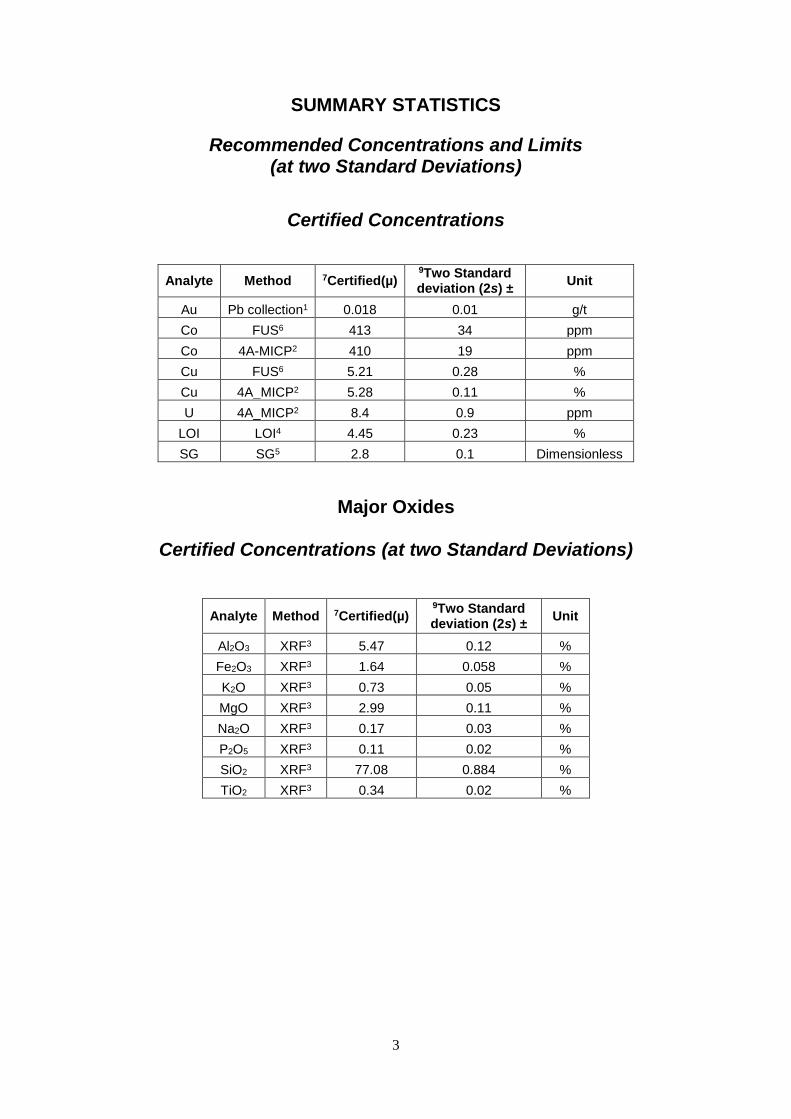
SUMMARY STATISTICS
Recommended Concentrations and Limits (at two Standard Deviations)
Certified Concentrations
Analyte Method 7Certified(µ) 9Two Standard deviation (2s) ±
Unit
Au Pb collection1 0.018 0.01 g/t
Co FUS6 413 34 ppm
Co 4A-MICP2 410 19 ppm
Cu FUS6 5.21 0.28 %
Cu 4A_MICP2 5.28 0.11 %
U 4A_MICP2 8.4 0.9 ppm
LOI LOI4 4.45 0.23 %
SG SG5 2.8 0.1 Dimensionless
Major Oxides
Certified Concentrations (at two Standard Deviations)
Analyte Method 7Certified(µ) 9Two Standard deviation (2s) ±
Unit
Al2O3 XRF3 5.47 0.12 %
Fe2O3 XRF3 1.64 0.058 %
K2O XRF3 0.73 0.05 %
MgO XRF3 2.99 0.11 %
Na2O XRF3 0.17 0.03 %
P2O5 XRF3 0.11 0.02 %
SiO2 XRF3 77.08 0.884 %
TiO2 XRF3 0.34 0.02 %
4
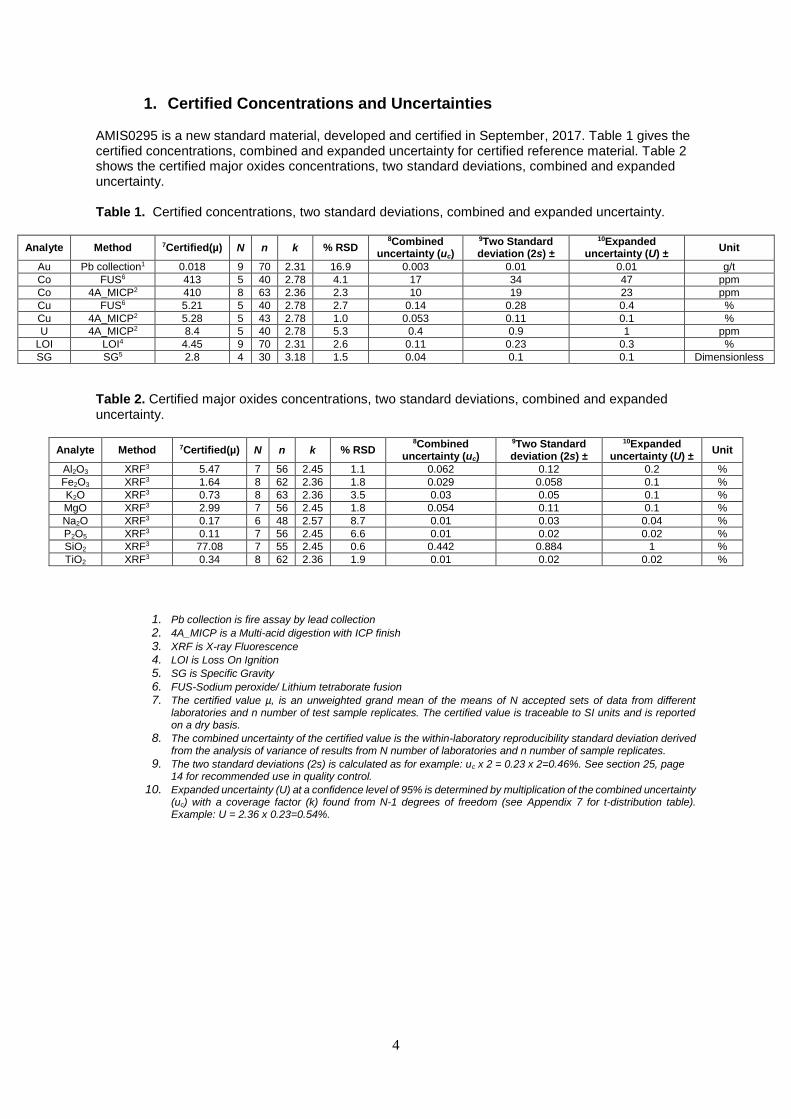
1. Certified Concentrations and Uncertainties AMIS0295 is a new standard material, developed and certified in September, 2017. Table 1 gives the certified concentrations, combined and expanded uncertainty for certified reference material. Table 2 shows the certified major oxides concentrations, two standard deviations, combined and expanded uncertainty. Table 1. Certified concentrations, two standard deviations, combined and expanded uncertainty.
Analyte Method 7Certified(µ) N n k % RSD 8Combined
uncertainty (uc)
9Two Standard deviation (2s) ±
10Expanded uncertainty (U) ±
Unit
Au Pb collection1 0.018 9 70 2.31 16.9 0.003 0.01 0.01 g/t
Co FUS6 413 5 40 2.78 4.1 17 34 47 ppm
Co 4A_MICP2 410 8 63 2.36 2.3 10 19 23 ppm
Cu FUS6 5.21 5 40 2.78 2.7 0.14 0.28 0.4 %
Cu 4A_MICP2 5.28 5 43 2.78 1.0 0.053 0.11 0.1 %
U 4A_MICP2 8.4 5 40 2.78 5.3 0.4 0.9 1 ppm
LOI LOI4 4.45 9 70 2.31 2.6 0.11 0.23 0.3 %
SG SG5 2.8 4 30 3.18 1.5 0.04 0.1 0.1 Dimensionless
Table 2. Certified major oxides concentrations, two standard deviations, combined and expanded uncertainty.
Analyte Method 7Certified(µ) N n k % RSD 8Combined
uncertainty (uc)
9Two Standard deviation (2s) ±
10Expanded uncertainty (U) ±
Unit
Al2O3 XRF3 5.47 7 56 2.45 1.1 0.062 0.12 0.2 %
Fe2O3 XRF3 1.64 8 62 2.36 1.8 0.029 0.058 0.1 %
K2O XRF3 0.73 8 63 2.36 3.5 0.03 0.05 0.1 %
MgO XRF3 2.99 7 56 2.45 1.8 0.054 0.11 0.1 %
Na2O XRF3 0.17 6 48 2.57 8.7 0.01 0.03 0.04 %
P2O5 XRF3 0.11 7 56 2.45 6.6 0.01 0.02 0.02 %
SiO2 XRF3 77.08 7 55 2.45 0.6 0.442 0.884 1 %
TiO2 XRF3 0.34 8 62 2.36 1.9 0.01 0.02 0.02 %
1. Pb collection is fire assay by lead collection 2. 4A_MICP is a Multi-acid digestion with ICP finish
3. XRF is X-ray Fluorescence
4. LOI is Loss On Ignition
5. SG is Specific Gravity
6. FUS-Sodium peroxide/ Lithium tetraborate fusion
7. The certified value µ, is an unweighted grand mean of the means of N accepted sets of data from different laboratories and n number of test sample replicates. The certified value is traceable to SI units and is reported on a dry basis.
8. The combined uncertainty of the certified value is the within-laboratory reproducibility standard deviation derived from the analysis of variance of results from N number of laboratories and n number of sample replicates.
9. The two standard deviations (2s) is calculated as for example: uc x 2 = 0.23 x 2=0.46%. See section 25, page 14 for recommended use in quality control.
10. Expanded uncertainty (U) at a confidence level of 95% is determined by multiplication of the combined uncertainty (uc) with a coverage factor (k) found from N-1 degrees of freedom (see Appendix 7 for t-distribution table). Example: U = 2.36 x 0.23=0.54%.
5
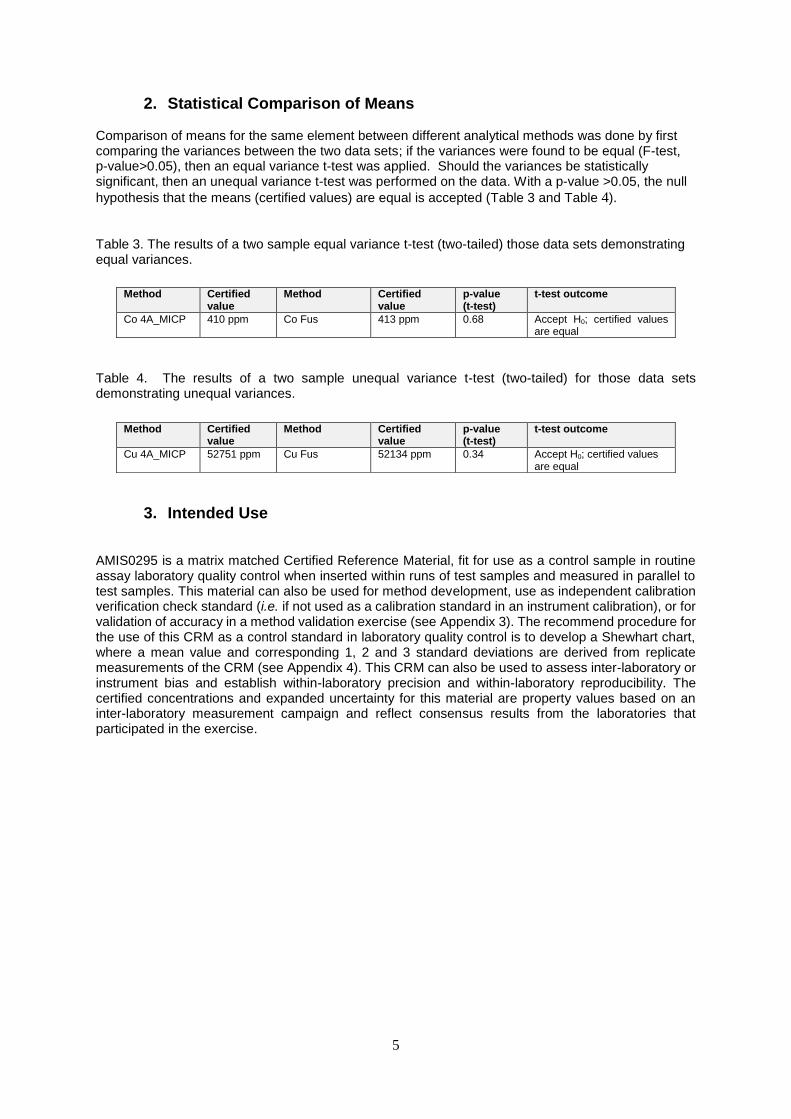
2. Statistical Comparison of Means Comparison of means for the same element between different analytical methods was done by first comparing the variances between the two data sets; if the variances were found to be equal (F-test, p-value>0.05), then an equal variance t-test was applied. Should the variances be statistically significant, then an unequal variance t-test was performed on the data. With a p-value >0.05, the null
hypothesis that the means (certified values) are equal is accepted (Table 3 and Table 4).
Table 3. The results of a two sample equal variance t-test (two-tailed) those data sets demonstrating equal variances.
Table 4. The results of a two sample unequal variance t-test (two-tailed) for those data sets demonstrating unequal variances.
Method Certified value
Method Certified value
p-value (t-test)
t-test outcome
Cu 4A_MICP 52751 ppm Cu Fus 52134 ppm 0.34 Accept H0; certified values are equal
3. Intended Use AMIS0295 is a matrix matched Certified Reference Material, fit for use as a control sample in routine assay laboratory quality control when inserted within runs of test samples and measured in parallel to test samples. This material can also be used for method development, use as independent calibration verification check standard (i.e. if not used as a calibration standard in an instrument calibration), or for validation of accuracy in a method validation exercise (see Appendix 3). The recommend procedure for the use of this CRM as a control standard in laboratory quality control is to develop a Shewhart chart, where a mean value and corresponding 1, 2 and 3 standard deviations are derived from replicate measurements of the CRM (see Appendix 4). This CRM can also be used to assess inter-laboratory or instrument bias and establish within-laboratory precision and within-laboratory reproducibility. The certified concentrations and expanded uncertainty for this material are property values based on an inter-laboratory measurement campaign and reflect consensus results from the laboratories that participated in the exercise.
Method Certified value
Method Certified value
p-value (t-test)
t-test outcome
Co 4A_MICP 410 ppm Co Fus 413 ppm 0.68 Accept H0; certified values are equal
6
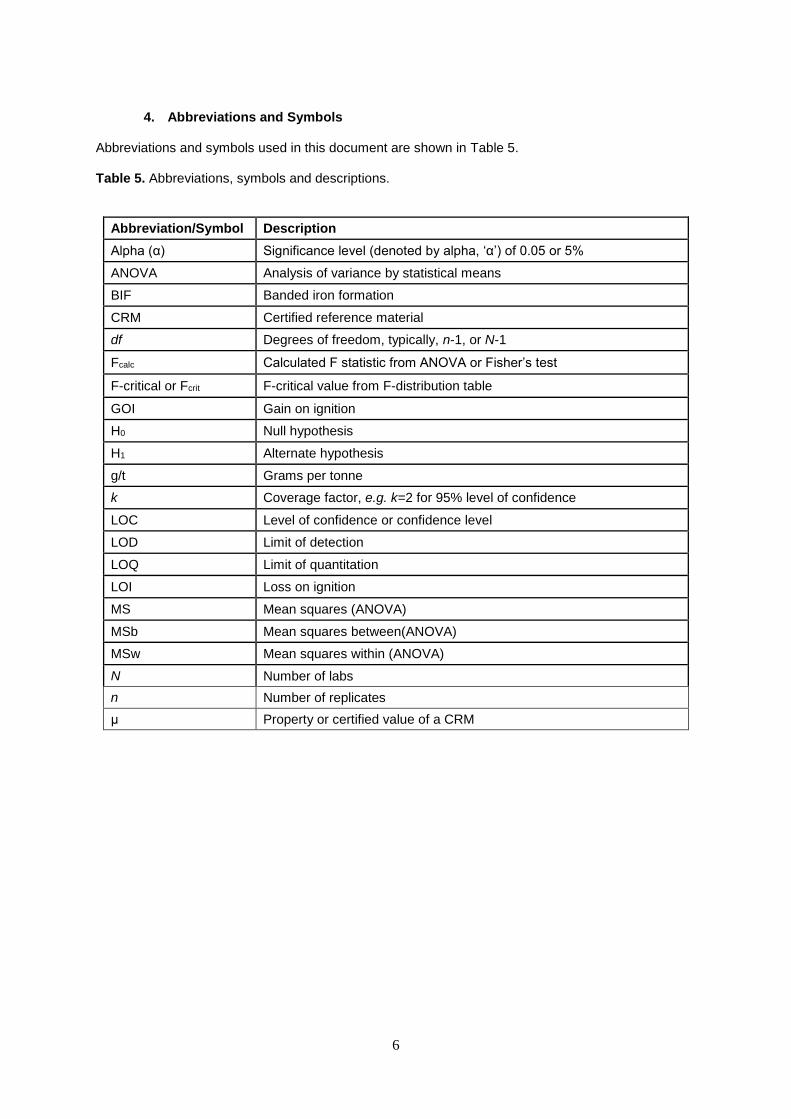
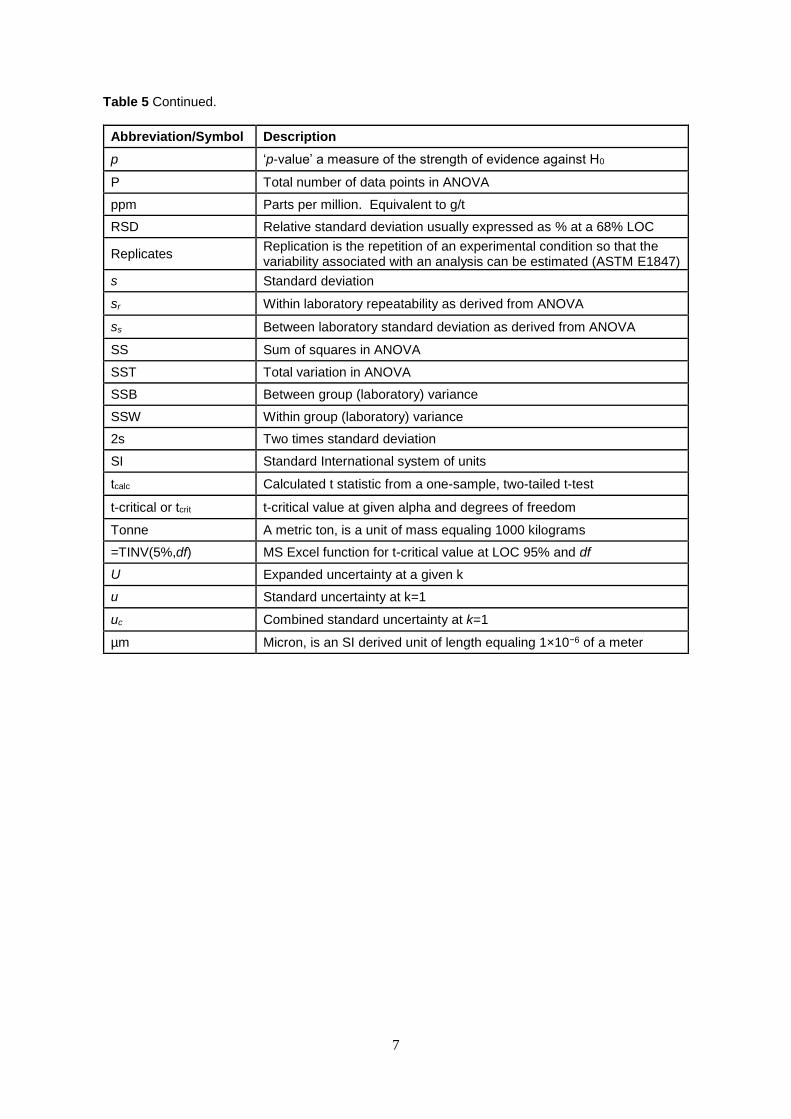
4. Abbreviations and Symbols
Abbreviations and symbols used in this document are shown in Table 5. Table 5. Abbreviations, symbols and descriptions.
Abbreviation/Symbol Description
Alpha (α) Significance level (denoted by alpha, ‘α’) of 0.05 or 5%
ANOVA Analysis of variance by statistical means
BIF Banded iron formation
CRM Certified reference material
df Degrees of freedom, typically, n-1, or N-1
Fcalc Calculated F statistic from ANOVA or Fisher’s test
F-critical or Fcrit F-critical value from F-distribution table
GOI Gain on ignition
H0 Null hypothesis
H1 Alternate hypothesis
g/t Grams per tonne
k Coverage factor, e.g. k=2 for 95% level of confidence
LOC Level of confidence or confidence level
LOD Limit of detection
LOQ Limit of quantitation
LOI Loss on ignition
MS Mean squares (ANOVA)
MSb Mean squares between(ANOVA)
MSw Mean squares within (ANOVA)
N Number of labs
n Number of replicates
μ Property or certified value of a CRM
7
Table 5 Continued.
Abbreviation/Symbol Description
p ‘p-value’ a measure of the strength of evidence against H0
P Total number of data points in ANOVA
ppm Parts per million. Equivalent to g/t
RSD Relative standard deviation usually expressed as % at a 68% LOC
Replicates Replication is the repetition of an experimental condition so that the variability associated with an analysis can be estimated (ASTM E1847)
s Standard deviation
sr Within laboratory repeatability as derived from ANOVA
ss Between laboratory standard deviation as derived from ANOVA
SS Sum of squares in ANOVA
SST Total variation in ANOVA
SSB Between group (laboratory) variance
SSW Within group (laboratory) variance
2s Two times standard deviation
SI Standard International system of units
tcalc Calculated t statistic from a one-sample, two-tailed t-test
t-critical or tcrit t-critical value at given alpha and degrees of freedom
Tonne A metric ton, is a unit of mass equaling 1000 kilograms
=TINV(5%,df) MS Excel function for t-critical value at LOC 95% and df
U Expanded uncertainty at a given k
u Standard uncertainty at k=1
uc Combined standard uncertainty at k=1
µm Micron, is an SI derived unit of length equaling 1×10⁻⁶ of a meter
8
5. Uncertified Concentration Values Appendix 1 gives uncertified concentrations for other elements present in the CRM.
6. Units All results for major oxides are reported as oxides in percentages. All results for major elements analyses reported in percentages or ppm. Results for Au and the platinum group elements are reported in g/t or ppm. Specific gravity (SG) is the ratio of the density of a substance to the density of a reference substance, i.e. equivalently; it is the ratio of the mass of a substance to the mass of a reference substance for the same given volume. Since specific gravity is a ratio of densities its units are therefore dimensionless.
7. Analytical and Physical Methods A complete list of analytical and physical methods as generic method codes with a brief description of the methods is available on the AMIS web site www.amis.co.za
8. Origin of Material This CRM is made from run-of-mine oxide Cobalt-Copper ore from the Tenke Fungurume (Tenke) mine operated by Freeport- McMoRan Copper & Gold Inc. The mine is situated in Katanga Province of the Democratic Republic of Congo. The Tenke-Fungurume deposits are sedimentary copper deposits located in the Lufilian arc, an 800 km fold belt formed between the Angolan Plate to the southeast and Congo Plate to the northwest during the late Neoproterozic approximately 650 to 600 million years before present (Ma). Copper mineralization at Tenke-Fungurume is stratabound and generally restricted to two dolomitic shale horizons (RSF and SDB respectively) each ranging in thickness from 5 to 15 m, separated by 20 m of cellular silicified dolomite (RSC).
9. Approximate Mineral and Chemical Composition The main economic minerals present at Tenke and Fungurume are malachite, chrysocolla, bornite, and hetrogenite; the primary copper and cobalt mineralogy is predominately chalcocite (Cu2S), digenite (Cu9S5) bornite (Cu5FeS4), and carrollite (CuCo2S4); however oxidation has resulted in widespread alteration producing malachite (Cu2CO3(OH)2), pseudomalachite (Cu5(PO4)2(OH)4), chrysocolla (hydrated copper silicate) and heterogenite (Co3+O(OH)). The primary copper-cobalt mineral associations are homogeneous in both mineralized zones and any variations are due to the effect of oxidation and supergene enrichment. Consequently the mineral assemblages can be grouped into three main categories dependent upon the degree of alteration – oxide, mixed and sulfide zone. Dolomite and quartz are the main gangue minerals present. Dolomite or dolomitic rocks make up the bulk of the host strata. Weathering of the host rocks is normally depth related, intensity decreasing with increasing depth, producing hydrated iron oxides and silica at the expense of dolomite, which is leached and removed. For a detailed description please refer to the Technical Report prepared for Tenke Mining Corp by GRD Minproc Limited available at:
http://www.lundinmining.com/i/pdf/TenkeFungurumeFeasibilityStudy.pdf .
9
10. Health and Safety The material is a very fine powder coloured Yellowish Gray (5Y 8/2). Safety precautions for handling fine particulate matter are recommended, such as the use of safety glasses, breathing protection, gloves and a laboratory coat.
11. Method of Preparation The particle size distribution for this material was shown to have a nominal top size of 54µm (95% passing 54µm). The procedure of preparation in brief is as follows: the material was crushed, dry-milled and air-classified to <54µm. It was then blended in a bi-conical mixer, systematically divided and sealed into 1kg Laboratory Packs. Explorer Packs are then subdivided from the Laboratory Packs as required. Final packaged units were then selected on a random basis and submitted for analysis to an independent laboratory accredited with the ISO17025:2005 standard of general requirements for the competence of testing and calibration laboratories. The results obtained from this laboratory are then evaluated statistically by AMIS for homogeneity.
12. Handling The material is packaged in Laboratory Packs and Explorer Packs that must be shaken or otherwise agitated before use. The analyte concentrations are quoted on a dry basis, therefore the user needs to determine the moisture content in order to convert any obtained assay values to an air-dry basis (see Appendix 5 for an example calculation).
13. Methods of Analysis Requested
1. Au – Pb collection finished with gravimetric or AAS or ICP-OES/ICP-MS. 2. Cu and Co Fusion finished with AAS or ICP-OES/MS 3. 4-acid digest multi-element scan - (to include Cu and Co) finished with AAS or ICP-OES/MS 4. Majors (Al2O3, CaO, Cr2O3, Fe2O3, K2O, MgO, MnO, Na2O, P2O5, SiO2, TiO2, LOI) XRF fusion 5. S Combustion/LECO 6. SG – gas pycnometer
14. Information Requested of Participating Laboratories The following information was requested of the participating laboratories for the development of this CRM:
1. State and provide brief description of analytical techniques used 2. State aliquots used for all determinations 3. Results for individual analyses to be reported 4. All results for base metals to be reported in ppm, oxides to be reported in % and Gold to be
reported in ppb. 5. Report all QC data, to include replicates, blanks and certified reference materials used
15. Certification of Mean and Estimation of Measurement Uncertainty The samples used in this certification process have been selected in such a way as to represent the entire batch of material and were taken from the final packaged units; therefore all possible sources of uncertainty are included in the combined standard uncertainty determination. Initially the data submitted
10
by all of the laboratories are subjected to a z-score test, equation [1] to exclude outliers and the remaining data sets examined for their normality in distribution. This is followed by the exclusion of further outliers as defined by the IUPAC Harmonised Protocol of 1995 in which both Cochran and Grubbs tests are applied until all outliers are identified, equations [2], [3], [4] and [5]. A grand mean and standard deviation is re-calculated using all remaining data (Thompson, 2008; Carr, 2011) (see Appendix 2). These data are then subjected to an analysis of variance (ANOVA) as per equations, [10],[11],[12],[13] and [14] in Appendix 2. The mean squares for data within and between laboratories derived from ANOVA are used to compute the within-laboratory reproducibility, or combined standard uncertainty as shown in Appendix 2, equation [15], [16] and [17]. The Horwitz function is applied to assess the performance of the data under consideration with respect to precision as relative standard deviation (equations [6], [7] and [8]). Should the ratio of the observed %RSD and a calculated %RSD be <2, the observed %RSD is accepted (Horwitz & Albert, 2006). A final certified value is then found by calculating a grand mean of equally weighted individual laboratory means [9] (ISO Guide 35, 2003; Barwick & Pritchard, 2011). An uncertainty statement on AMIS certificates is typically presented as: The expanded uncertainty (U) is determined by multiplication of the combined uncertainty (uc) with a coverage factor (k) found from N-1 degrees of freedom and a t-critical value at a level of confidence of 95% (EURACHEM / CITAC Guide CG 4., (2012), (see Table 12, Appendix 7 for a t-critical table). N is the number of laboratory means used in the establishment of the certified value. Since the estimated values of the CRM approximate a normal distribution with combined uncertainty, uc, the certified value of the CRM is understood to lie in the interval defined by U with a level of confidence of 95 % (Thompson & Lowthian, 2011). Appendix 2 gives detail on the principles used for certification of the reported assay values and estimation of measurement uncertainty.
16. Participating Laboratories Twenty One laboratories were each given eight randomly selected packages of the CRM. Fefteen laboratories of the twenty one laboratories submitted results in time for certification. The 15 laboratories that provided results timeously are:
1. UIS Analytical Services (pty) Ltd 2. Shiva Analyticals India 3. SGS South Africa 4. SGS Mineral Services Lakefield (Canada) 5. SGS Ankara (Turkey) 6. SGS Ahafo Ghana 7. Mimosa Mine Laboratory Zimbabwe 8. Intertek Utama Services (Indonesia) 9. Genalysis Laboratory Services (W Australia P) 10. Bureau Veritas Minerals Ultra Trace Pty Ltd 11. ARGETEST 12. ALS (Vancouver) - Analytical Laboratory Services - Vancouver, Canada 13. ALS Chemex Laboratory Group Johannesburg SA 14. ALS Chemex Laboratory Group Lima (Peru) 15. ALS OMAC (Ireland)
11
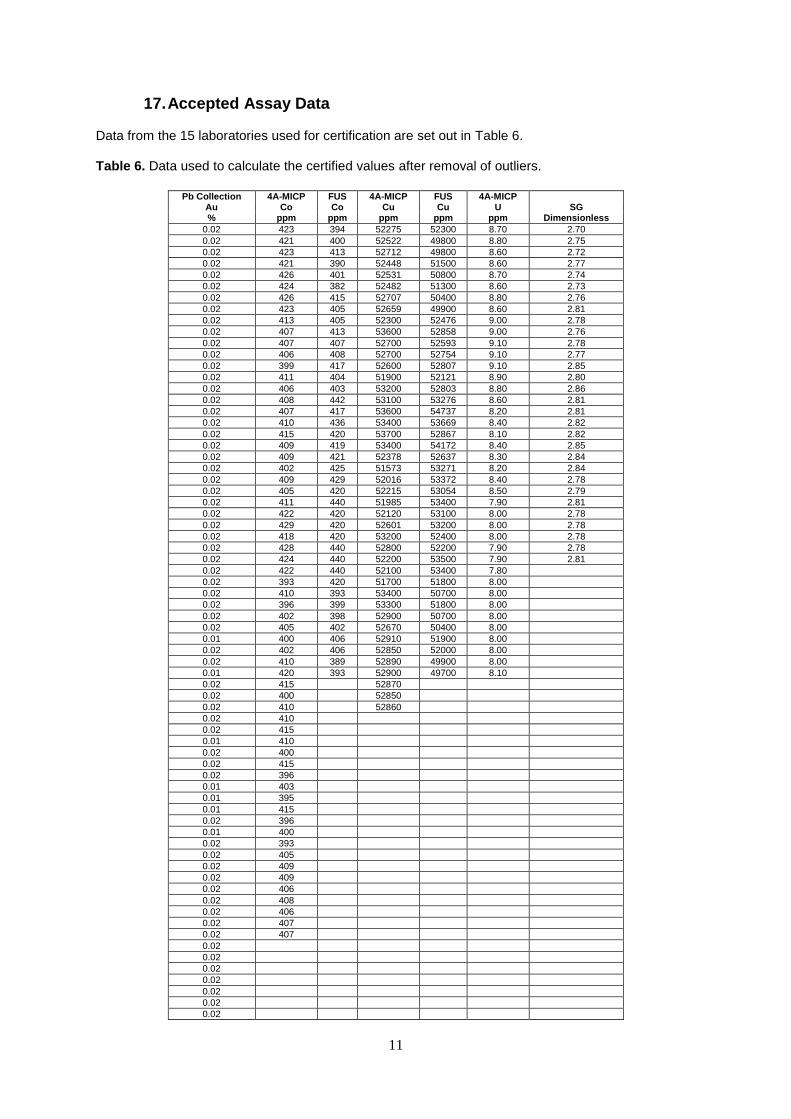
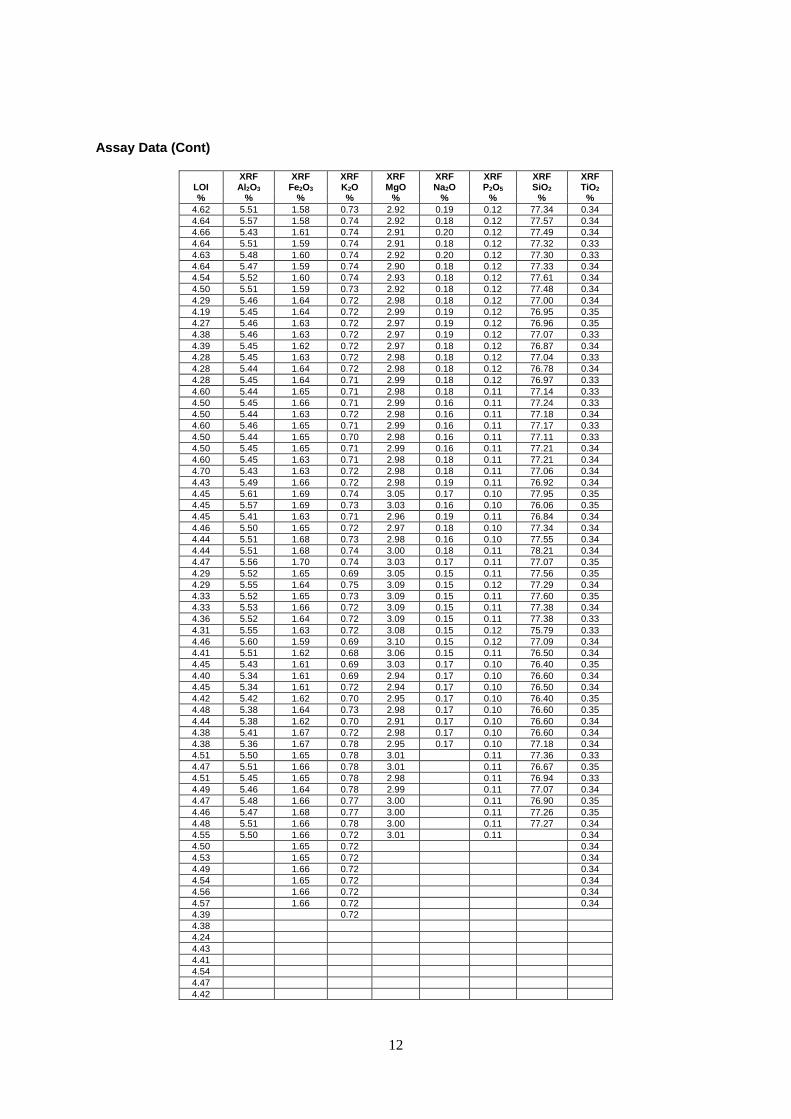
17. Accepted Assay Data Data from the 15 laboratories used for certification are set out in Table 6. Table 6. Data used to calculate the certified values after removal of outliers.
Pb Collection 4A-MICP FUS 4A-MICP FUS 4A-MICP
Au Co Co Cu Cu U SG % ppm ppm ppm ppm ppm Dimensionless
0.02 423 394 52275 52300 8.70 2.70
0.02 421 400 52522 49800 8.80 2.75
0.02 423 413 52712 49800 8.60 2.72
0.02 421 390 52448 51500 8.60 2.77
0.02 426 401 52531 50800 8.70 2.74
0.02 424 382 52482 51300 8.60 2.73
0.02 426 415 52707 50400 8.80 2.76
0.02 423 405 52659 49900 8.60 2.81
0.02 413 405 52300 52476 9.00 2.78
0.02 407 413 53600 52858 9.00 2.76
0.02 407 407 52700 52593 9.10 2.78
0.02 406 408 52700 52754 9.10 2.77
0.02 399 417 52600 52807 9.10 2.85
0.02 411 404 51900 52121 8.90 2.80
0.02 406 403 53200 52803 8.80 2.86
0.02 408 442 53100 53276 8.60 2.81
0.02 407 417 53600 54737 8.20 2.81
0.02 410 436 53400 53669 8.40 2.82
0.02 415 420 53700 52867 8.10 2.82
0.02 409 419 53400 54172 8.40 2.85
0.02 409 421 52378 52637 8.30 2.84
0.02 402 425 51573 53271 8.20 2.84
0.02 409 429 52016 53372 8.40 2.78
0.02 405 420 52215 53054 8.50 2.79
0.02 411 440 51985 53400 7.90 2.81
0.02 422 420 52120 53100 8.00 2.78
0.02 429 420 52601 53200 8.00 2.78
0.02 418 420 53200 52400 8.00 2.78
0.02 428 440 52800 52200 7.90 2.78
0.02 424 440 52200 53500 7.90 2.81
0.02 422 440 52100 53400 7.80
0.02 393 420 51700 51800 8.00
0.02 410 393 53400 50700 8.00
0.02 396 399 53300 51800 8.00
0.02 402 398 52900 50700 8.00
0.02 405 402 52670 50400 8.00
0.01 400 406 52910 51900 8.00
0.02 402 406 52850 52000 8.00
0.02 410 389 52890 49900 8.00
0.01 420 393 52900 49700 8.10
0.02 415 52870
0.02 400 52850
0.02 410 52860
0.02 410
0.02 415
0.01 410
0.02 400
0.02 415
0.02 396
0.01 403
0.01 395
0.01 415
0.02 396
0.01 400
0.02 393
0.02 405
0.02 409
0.02 409
0.02 406
0.02 408
0.02 406
0.02 407
0.02 407
0.02
0.02
0.02
0.02
0.02
0.02
0.02
12
Assay Data (Cont)
XRF XRF XRF XRF XRF XRF XRF XRF LOI Al2O3 Fe2O3 K2O MgO Na2O P2O5 SiO2 TiO2 % % % % % % % % %
4.62 5.51 1.58 0.73 2.92 0.19 0.12 77.34 0.34
4.64 5.57 1.58 0.74 2.92 0.18 0.12 77.57 0.34
4.66 5.43 1.61 0.74 2.91 0.20 0.12 77.49 0.34
4.64 5.51 1.59 0.74 2.91 0.18 0.12 77.32 0.33
4.63 5.48 1.60 0.74 2.92 0.20 0.12 77.30 0.33
4.64 5.47 1.59 0.74 2.90 0.18 0.12 77.33 0.34
4.54 5.52 1.60 0.74 2.93 0.18 0.12 77.61 0.34
4.50 5.51 1.59 0.73 2.92 0.18 0.12 77.48 0.34
4.29 5.46 1.64 0.72 2.98 0.18 0.12 77.00 0.34
4.19 5.45 1.64 0.72 2.99 0.19 0.12 76.95 0.35
4.27 5.46 1.63 0.72 2.97 0.19 0.12 76.96 0.35
4.38 5.46 1.63 0.72 2.97 0.19 0.12 77.07 0.33
4.39 5.45 1.62 0.72 2.97 0.18 0.12 76.87 0.34
4.28 5.45 1.63 0.72 2.98 0.18 0.12 77.04 0.33
4.28 5.44 1.64 0.72 2.98 0.18 0.12 76.78 0.34
4.28 5.45 1.64 0.71 2.99 0.18 0.12 76.97 0.33
4.60 5.44 1.65 0.71 2.98 0.18 0.11 77.14 0.33
4.50 5.45 1.66 0.71 2.99 0.16 0.11 77.24 0.33
4.50 5.44 1.63 0.72 2.98 0.16 0.11 77.18 0.34
4.60 5.46 1.65 0.71 2.99 0.16 0.11 77.17 0.33
4.50 5.44 1.65 0.70 2.98 0.16 0.11 77.11 0.33
4.50 5.45 1.65 0.71 2.99 0.16 0.11 77.21 0.34
4.60 5.45 1.63 0.71 2.98 0.18 0.11 77.21 0.34
4.70 5.43 1.63 0.72 2.98 0.18 0.11 77.06 0.34
4.43 5.49 1.66 0.72 2.98 0.19 0.11 76.92 0.34
4.45 5.61 1.69 0.74 3.05 0.17 0.10 77.95 0.35
4.45 5.57 1.69 0.73 3.03 0.16 0.10 76.06 0.35
4.45 5.41 1.63 0.71 2.96 0.19 0.11 76.84 0.34
4.46 5.50 1.65 0.72 2.97 0.18 0.10 77.34 0.34
4.44 5.51 1.68 0.73 2.98 0.16 0.10 77.55 0.34
4.44 5.51 1.68 0.74 3.00 0.18 0.11 78.21 0.34
4.47 5.56 1.70 0.74 3.03 0.17 0.11 77.07 0.35
4.29 5.52 1.65 0.69 3.05 0.15 0.11 77.56 0.35
4.29 5.55 1.64 0.75 3.09 0.15 0.12 77.29 0.34
4.33 5.52 1.65 0.73 3.09 0.15 0.11 77.60 0.35
4.33 5.53 1.66 0.72 3.09 0.15 0.11 77.38 0.34
4.36 5.52 1.64 0.72 3.09 0.15 0.11 77.38 0.33
4.31 5.55 1.63 0.72 3.08 0.15 0.12 75.79 0.33
4.46 5.60 1.59 0.69 3.10 0.15 0.12 77.09 0.34
4.41 5.51 1.62 0.68 3.06 0.15 0.11 76.50 0.34
4.45 5.43 1.61 0.69 3.03 0.17 0.10 76.40 0.35
4.40 5.34 1.61 0.69 2.94 0.17 0.10 76.60 0.34
4.45 5.34 1.61 0.72 2.94 0.17 0.10 76.50 0.34
4.42 5.42 1.62 0.70 2.95 0.17 0.10 76.40 0.35
4.48 5.38 1.64 0.73 2.98 0.17 0.10 76.60 0.35
4.44 5.38 1.62 0.70 2.91 0.17 0.10 76.60 0.34
4.38 5.41 1.67 0.72 2.98 0.17 0.10 76.60 0.34
4.38 5.36 1.67 0.78 2.95 0.17 0.10 77.18 0.34
4.51 5.50 1.65 0.78 3.01 0.11 77.36 0.33
4.47 5.51 1.66 0.78 3.01 0.11 76.67 0.35
4.51 5.45 1.65 0.78 2.98 0.11 76.94 0.33
4.49 5.46 1.64 0.78 2.99 0.11 77.07 0.34
4.47 5.48 1.66 0.77 3.00 0.11 76.90 0.35
4.46 5.47 1.68 0.77 3.00 0.11 77.26 0.35
4.48 5.51 1.66 0.78 3.00 0.11 77.27 0.34
4.55 5.50 1.66 0.72 3.01 0.11 0.34
4.50 1.65 0.72 0.34
4.53 1.65 0.72 0.34
4.49 1.66 0.72 0.34
4.54 1.65 0.72 0.34
4.56 1.66 0.72 0.34
4.57 1.66 0.72 0.34
4.39 0.72
4.38
4.24
4.43
4.41
4.54
4.47
4.42
13
18. Reported Values The certified values listed in this certificate fulfil the AMIS statistical criteria (see section 15) regarding agreement for certification and have been independently validated by Allan Fraser.
19. Validation of Accuracy (Trueness) This CRM can be used to validate accuracy (trueness) as required in method validation as stated in the ISO17025:2005 standard, clause 5.4. See Appendix 3 for an example on the validation of accuracy using replicate data derived from the analysis of a CRM.
20. Limit of Detection and Limit of Quantitation in Gravimetric Fire Assay In the determination of limit of detection (LOD) and limit of quantitation (LOQ) in gravimetric fire assay (i.e. lead collection and weighing of resulting gold prill), the minimum mass that an assay microbalance is capable of weighing and the original test sample mass determines the LOD and the LOQ in the assay (Fraser, 2015), (see Appendix 6 for an example of the calculation LOD and LOQ and Table 11 for a recommend reporting scheme for LOD and LOQ values).
21. Metrological Traceability The values quoted herein are based on the consensus values derived from statistical analysis of the data from an inter-laboratory measurement program. Traceability to SI units is via the standards used by the individual laboratories the majority of which are accredited to the ISO17025:2005 general requirements for the competence of testing and calibration laboratories and who have maintained measurement traceability during the analytical process.
22. Period of Validity The certified values are valid for this product, while still sealed in its original packaging, until notification to the contrary. The stability of the material will be subject to continuous testing for the duration of the inventory. Should product stability become an issue, all customers will be notified and notification to that effect will be placed on the www.amis.co.za website.
23. Minimum Sample Size The majority of laboratories reporting used a 0.5g sample size for the ICP-OES and a 30g sample size for the fire assay. These are the recommended minimum sample sizes for the use of this material.
24. Availability This product is available in Laboratory Packs containing 1kg of material and Explorer Packs containing custom weights (from 50 to 250g) of material. The Laboratory Packs are sealed bottles delivered in sealed foil pouches. The Explorer Packs contain material in standard geochem envelopes, nitrogen flushed and vacuum sealed in foil pouches.
14
25. Recommended use in Quality Control Users should set their own limits i.e. 1, 2 and 3 standard deviations from an obtained mean value based on at least 10 replicate analyses using this CRM (see Appendix 4 for detail on the use of this CRM in quality control).
26. Legal Notice This certificate and the reference material described in it have been prepared with due care and attention. However AMIS, a division of Torre Analytical Services (Pty) Ltd, Thivhafuni Matodzi, and Allan Fraser; accept no liability for any decisions or actions taken following the use of the reference material. 07 September 2017 Certifying Officers:
African Mineral Standards: _______________________________________
Thivhafuni Matodzi
Geochemist:__________________________________________________
Allan Fraser M.Sc. (Geology), N.D. (Analytical Chem.), Pr.Sci.Nat.
15
REFERENCES Abzalov, M. (2011). Sampling Errors and Control of Assay Data Quality in Exploration and Mining
Geology, Applications and Experiences of Quality Control. Ivanov, O., (Ed.), InTech, DOI: 10.5772/14965. Available from: http://www.intechopen.com/books/applications-and-experiences-of-quality-control/sampling-errors-and-control-of-assay-data-quality-in-exploration-and-mining-geology. Accessed 25th September, 2016.
ASTM E122-09e1, Standard Practice for Calculating Sample Size to Estimate, With Specified Precision, the Average for a Characteristic of a Lot or Process, ASTM International, West Conshohocken, PA, 2011, www.astm.org
Barwick V.J., Pritchard E. (Eds). (2011). Eurachem Guide; Terminology in Analytical Measurement – Introduction to VIM 3 (2011). ISBN 978-0-948926-29-7.
Carr R.H. (2011). Estimating errors using graphs and taking good data. California State University Los Angeles. March 2011. 14. http://web.calstatela.edu/faculty/kaniol/Err-Gph-Meas-IBooklet.pdf. Retrieved: 29 August, 2016.
Cochran, W.G. (1950). The Comparison of Percentages in Matched Samples. Biometrika, 37, 256-66.
Ellison, S., Barwick, V., Duguid Farrant, T. (2009). Practical statistics for the analytical scientist, a bench guide. 2nd Edition. RSC Publishing. 25-172.
ERM Application Note 1. (2005). Comparison of a measurement value with a certified value. European Commission – Joint Research Centre Institute for Reference Materials and Measurements (IRMM). 1-2.
EURACHEM / CITAC Guide CG 4. (2012). Quantifying uncertainty in analytical measurement. 3rd
Edition. Editors: Ellison, S. L. R., Williams, A. 4-121. Eurolab Technical Report No.1/2007. (2007). Measurement uncertainty revisited: Alternative
approaches to uncertainty evaluation. European Federation of National Associations of Measurement, Testing and Laboratories. 43-46.
Fraser, A.W. (2015). Minimising uncertainty in measurement and improving limit of detection in gold bearing ores from concentrations predicted by linear regression in atomic absorption spectrometry. M.Sc. thesis (unpublished), University of Johannesburg: 199 pages.
Grubbs, F.E. (1969). Procedures for detecting outlying observations in samples. Technometrics, 11, 1969. 1-21.
Horwitz, W., Albert, R. (2006). The Horwitz Ratio (HorRat): A useful index of method performance with respect to precision, Journal of Association of Official Analytical Chemists International, 89: 1095-1109.
ISO/IEC 17025:2005(E).(2005). General requirements for the competence of testing and calibration laboratories. 2nd Edition: 14-59.
ISO Guide 35 (2003). Certification of reference materials — General and Statistical principles, 3rd edition. ISO/REMCO WG 1.
ISO 5725-2:1994. Accuracy (trueness and precision) of measurement methods and results -- Part 2: Basic method for the determination of repeatability and reproducibility of a standard measurement method.
Long, J., Winefordner, J. (1983). Limit of detection - a closer look at the IUPAC definition. Analytical Chemistry 55: 712A - 724A.
Miller, J., Miller, J. (2010). Statistics for analytical chemistry. 6th Edition. New York: Ellis Horwood.36-126.
Nelsen T.C., Wehling P. (2008). Collaborative studies for quantitative chemical analytical methods. AACC International Report. Cereal Foods World. September – October 2008, Vol. 53, No. 5. 285-288.
Skoog, D., West, D. (1982). Fundamentals of analytical chemistry. 4th Edition. CBS College Publishing. Holt Saunders International Editions:39-73.
Thompson, M. (Ed.) (2008). Test for ‘sufficient homogeneity’ in a reference material. Analytical Methods Committee, AMCTB 17A, ISSN 1757-5958.
Thompson, M. (Ed.) (2010). Internal quality control in routine analysis. AMC Technical Brief. Analytical Methods Committee. AMCTB No.46. 2010. Issn 1757-5958.
Thompson, M., Lowthian, P. (2011). Notes on statistics and data quality for analytical chemists. Imperial College Press: 15-115.
16
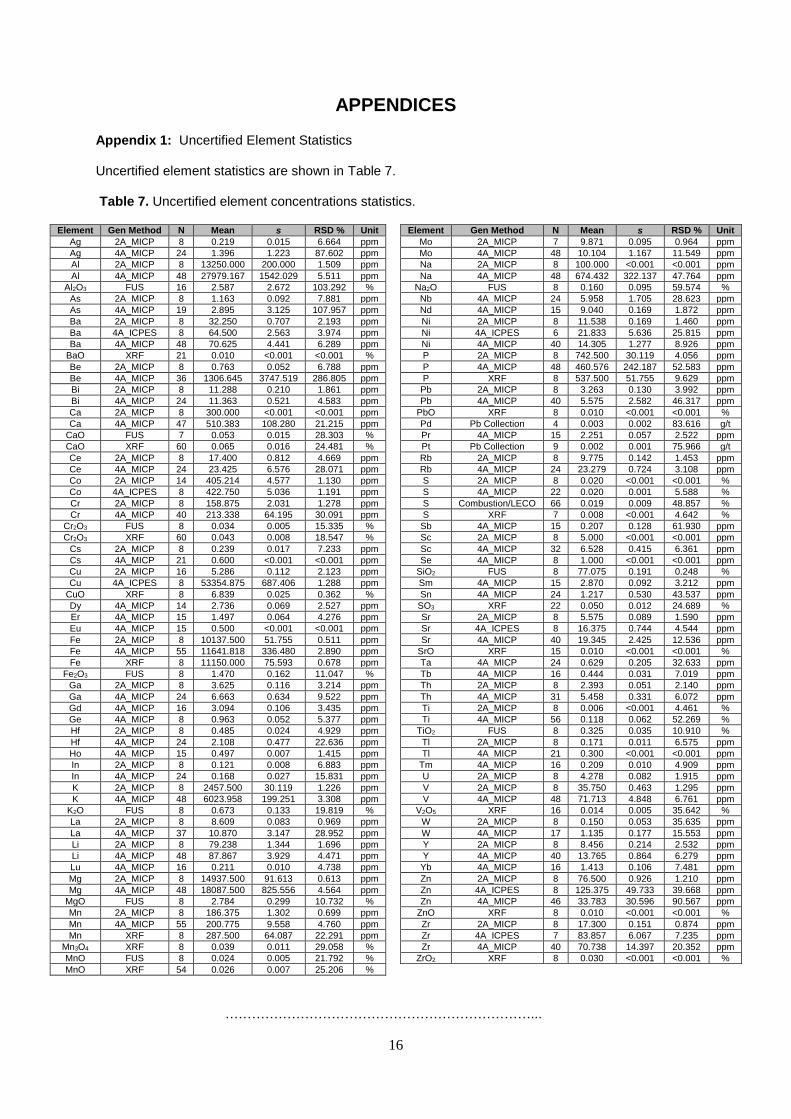
APPENDICES Appendix 1: Uncertified Element Statistics Uncertified element statistics are shown in Table 7. Table 7. Uncertified element concentrations statistics.
Element Gen Method N Mean s RSD % Unit Element Gen Method N Mean s RSD % Unit
Ag 2A_MICP 8 0.219 0.015 6.664 ppm Mo 2A_MICP 7 9.871 0.095 0.964 ppm
Ag 4A_MICP 24 1.396 1.223 87.602 ppm Mo 4A_MICP 48 10.104 1.167 11.549 ppm
Al 2A_MICP 8 13250.000 200.000 1.509 ppm Na 2A_MICP 8 100.000 <0.001 <0.001 ppm
Al 4A_MICP 48 27979.167 1542.029 5.511 ppm Na 4A_MICP 48 674.432 322.137 47.764 ppm
Al2O3 FUS 16 2.587 2.672 103.292 % Na2O FUS 8 0.160 0.095 59.574 %
As 2A_MICP 8 1.163 0.092 7.881 ppm Nb 4A_MICP 24 5.958 1.705 28.623 ppm
As 4A_MICP 19 2.895 3.125 107.957 ppm Nd 4A_MICP 15 9.040 0.169 1.872 ppm
Ba 2A_MICP 8 32.250 0.707 2.193 ppm Ni 2A_MICP 8 11.538 0.169 1.460 ppm
Ba 4A_ICPES 8 64.500 2.563 3.974 ppm Ni 4A_ICPES 6 21.833 5.636 25.815 ppm
Ba 4A_MICP 48 70.625 4.441 6.289 ppm Ni 4A_MICP 40 14.305 1.277 8.926 ppm
BaO XRF 21 0.010 <0.001 <0.001 % P 2A_MICP 8 742.500 30.119 4.056 ppm
Be 2A_MICP 8 0.763 0.052 6.788 ppm P 4A_MICP 48 460.576 242.187 52.583 ppm
Be 4A_MICP 36 1306.645 3747.519 286.805 ppm P XRF 8 537.500 51.755 9.629 ppm
Bi 2A_MICP 8 11.288 0.210 1.861 ppm Pb 2A_MICP 8 3.263 0.130 3.992 ppm
Bi 4A_MICP 24 11.363 0.521 4.583 ppm Pb 4A_MICP 40 5.575 2.582 46.317 ppm
Ca 2A_MICP 8 300.000 <0.001 <0.001 ppm PbO XRF 8 0.010 <0.001 <0.001 %
Ca 4A_MICP 47 510.383 108.280 21.215 ppm Pd Pb Collection 4 0.003 0.002 83.616 g/t
CaO FUS 7 0.053 0.015 28.303 % Pr 4A_MICP 15 2.251 0.057 2.522 ppm
CaO XRF 60 0.065 0.016 24.481 % Pt Pb Collection 9 0.002 0.001 75.966 g/t
Ce 2A_MICP 8 17.400 0.812 4.669 ppm Rb 2A_MICP 8 9.775 0.142 1.453 ppm
Ce 4A_MICP 24 23.425 6.576 28.071 ppm Rb 4A_MICP 24 23.279 0.724 3.108 ppm
Co 2A_MICP 14 405.214 4.577 1.130 ppm S 2A_MICP 8 0.020 <0.001 <0.001 %
Co 4A_ICPES 8 422.750 5.036 1.191 ppm S 4A_MICP 22 0.020 0.001 5.588 %
Cr 2A_MICP 8 158.875 2.031 1.278 ppm S Combustion/LECO 66 0.019 0.009 48.857 %
Cr 4A_MICP 40 213.338 64.195 30.091 ppm S XRF 7 0.008 <0.001 4.642 %
Cr2O3 FUS 8 0.034 0.005 15.335 % Sb 4A_MICP 15 0.207 0.128 61.930 ppm
Cr2O3 XRF 60 0.043 0.008 18.547 % Sc 2A_MICP 8 5.000 <0.001 <0.001 ppm
Cs 2A_MICP 8 0.239 0.017 7.233 ppm Sc 4A_MICP 32 6.528 0.415 6.361 ppm
Cs 4A_MICP 21 0.600 <0.001 <0.001 ppm Se 4A_MICP 8 1.000 <0.001 <0.001 ppm
Cu 2A_MICP 16 5.286 0.112 2.123 ppm SiO2 FUS 8 77.075 0.191 0.248 %
Cu 4A_ICPES 8 53354.875 687.406 1.288 ppm Sm 4A_MICP 15 2.870 0.092 3.212 ppm
CuO XRF 8 6.839 0.025 0.362 % Sn 4A_MICP 24 1.217 0.530 43.537 ppm
Dy 4A_MICP 14 2.736 0.069 2.527 ppm SO3 XRF 22 0.050 0.012 24.689 %
Er 4A_MICP 15 1.497 0.064 4.276 ppm Sr 2A_MICP 8 5.575 0.089 1.590 ppm
Eu 4A_MICP 15 0.500 <0.001 <0.001 ppm Sr 4A_ICPES 8 16.375 0.744 4.544 ppm
Fe 2A_MICP 8 10137.500 51.755 0.511 ppm Sr 4A_MICP 40 19.345 2.425 12.536 ppm
Fe 4A_MICP 55 11641.818 336.480 2.890 ppm SrO XRF 15 0.010 <0.001 <0.001 %
Fe XRF 8 11150.000 75.593 0.678 ppm Ta 4A_MICP 24 0.629 0.205 32.633 ppm
Fe2O3 FUS 8 1.470 0.162 11.047 % Tb 4A_MICP 16 0.444 0.031 7.019 ppm
Ga 2A_MICP 8 3.625 0.116 3.214 ppm Th 2A_MICP 8 2.393 0.051 2.140 ppm
Ga 4A_MICP 24 6.663 0.634 9.522 ppm Th 4A_MICP 31 5.458 0.331 6.072 ppm
Gd 4A_MICP 16 3.094 0.106 3.435 ppm Ti 2A_MICP 8 0.006 <0.001 4.461 %
Ge 4A_MICP 8 0.963 0.052 5.377 ppm Ti 4A_MICP 56 0.118 0.062 52.269 %
Hf 2A_MICP 8 0.485 0.024 4.929 ppm TiO2 FUS 8 0.325 0.035 10.910 %
Hf 4A_MICP 24 2.108 0.477 22.636 ppm Tl 2A_MICP 8 0.171 0.011 6.575 ppm
Ho 4A_MICP 15 0.497 0.007 1.415 ppm Tl 4A_MICP 21 0.300 <0.001 <0.001 ppm
In 2A_MICP 8 0.121 0.008 6.883 ppm Tm 4A_MICP 16 0.209 0.010 4.909 ppm
In 4A_MICP 24 0.168 0.027 15.831 ppm U 2A_MICP 8 4.278 0.082 1.915 ppm
K 2A_MICP 8 2457.500 30.119 1.226 ppm V 2A_MICP 8 35.750 0.463 1.295 ppm
K 4A_MICP 48 6023.958 199.251 3.308 ppm V 4A_MICP 48 71.713 4.848 6.761 ppm
K2O FUS 8 0.673 0.133 19.819 % V2O5 XRF 16 0.014 0.005 35.642 %
La 2A_MICP 8 8.609 0.083 0.969 ppm W 2A_MICP 8 0.150 0.053 35.635 ppm
La 4A_MICP 37 10.870 3.147 28.952 ppm W 4A_MICP 17 1.135 0.177 15.553 ppm
Li 2A_MICP 8 79.238 1.344 1.696 ppm Y 2A_MICP 8 8.456 0.214 2.532 ppm
Li 4A_MICP 48 87.867 3.929 4.471 ppm Y 4A_MICP 40 13.765 0.864 6.279 ppm
Lu 4A_MICP 16 0.211 0.010 4.738 ppm Yb 4A_MICP 16 1.413 0.106 7.481 ppm
Mg 2A_MICP 8 14937.500 91.613 0.613 ppm Zn 2A_MICP 8 76.500 0.926 1.210 ppm
Mg 4A_MICP 48 18087.500 825.556 4.564 ppm Zn 4A_ICPES 8 125.375 49.733 39.668 ppm
MgO FUS 8 2.784 0.299 10.732 % Zn 4A_MICP 46 33.783 30.596 90.567 ppm
Mn 2A_MICP 8 186.375 1.302 0.699 ppm ZnO XRF 8 0.010 <0.001 <0.001 %
Mn 4A_MICP 55 200.775 9.558 4.760 ppm Zr 2A_MICP 8 17.300 0.151 0.874 ppm
Mn XRF 8 287.500 64.087 22.291 ppm Zr 4A_ICPES 7 83.857 6.067 7.235 ppm
Mn3O4 XRF 8 0.039 0.011 29.058 % Zr 4A_MICP 40 70.738 14.397 20.352 ppm
MnO FUS 8 0.024 0.005 21.792 % ZrO2 XRF 8 0.030 <0.001 <0.001 %
MnO XRF 54 0.026 0.007 25.206 % ……………………………………………………………...
17
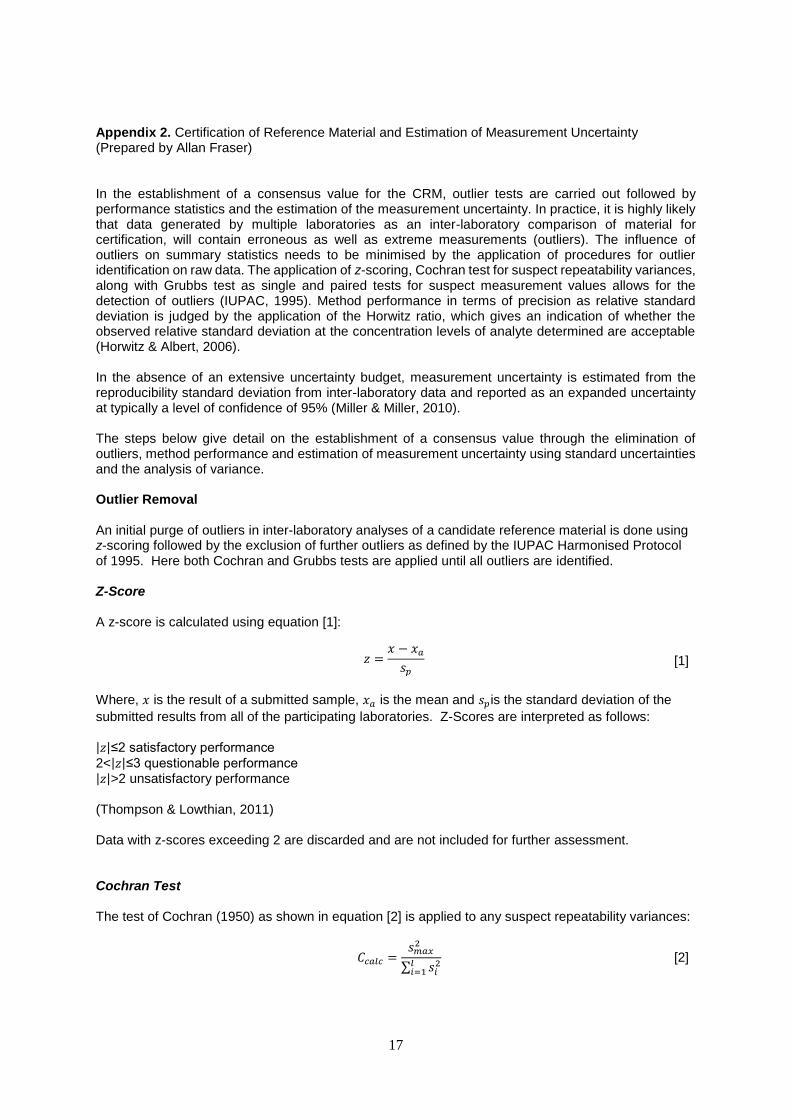
Appendix 2. Certification of Reference Material and Estimation of Measurement Uncertainty (Prepared by Allan Fraser) In the establishment of a consensus value for the CRM, outlier tests are carried out followed by performance statistics and the estimation of the measurement uncertainty. In practice, it is highly likely that data generated by multiple laboratories as an inter-laboratory comparison of material for certification, will contain erroneous as well as extreme measurements (outliers). The influence of outliers on summary statistics needs to be minimised by the application of procedures for outlier identification on raw data. The application of z-scoring, Cochran test for suspect repeatability variances, along with Grubbs test as single and paired tests for suspect measurement values allows for the detection of outliers (IUPAC, 1995). Method performance in terms of precision as relative standard deviation is judged by the application of the Horwitz ratio, which gives an indication of whether the observed relative standard deviation at the concentration levels of analyte determined are acceptable (Horwitz & Albert, 2006). In the absence of an extensive uncertainty budget, measurement uncertainty is estimated from the reproducibility standard deviation from inter-laboratory data and reported as an expanded uncertainty at typically a level of confidence of 95% (Miller & Miller, 2010). The steps below give detail on the establishment of a consensus value through the elimination of outliers, method performance and estimation of measurement uncertainty using standard uncertainties and the analysis of variance. Outlier Removal An initial purge of outliers in inter-laboratory analyses of a candidate reference material is done using z-scoring followed by the exclusion of further outliers as defined by the IUPAC Harmonised Protocol of 1995. Here both Cochran and Grubbs tests are applied until all outliers are identified. Z-Score A z-score is calculated using equation [1]: 𝑧 =
𝑥 − 𝑥𝑎
𝑠𝑝
[1]
Where, 𝑥 is the result of a submitted sample, 𝑥𝑎 is the mean and 𝑠𝑝is the standard deviation of the
submitted results from all of the participating laboratories. Z-Scores are interpreted as follows: |𝑧|≤2 satisfactory performance
2<|𝑧|≤3 questionable performance |𝑧|>2 unsatisfactory performance (Thompson & Lowthian, 2011) Data with z-scores exceeding 2 are discarded and are not included for further assessment. Cochran Test The test of Cochran (1950) as shown in equation [2] is applied to any suspect repeatability variances:
𝐶𝑐𝑎𝑙𝑐 =𝑠𝑚𝑎𝑥
2
∑ 𝑠𝑖2𝑙
𝑖=1
[2]
18
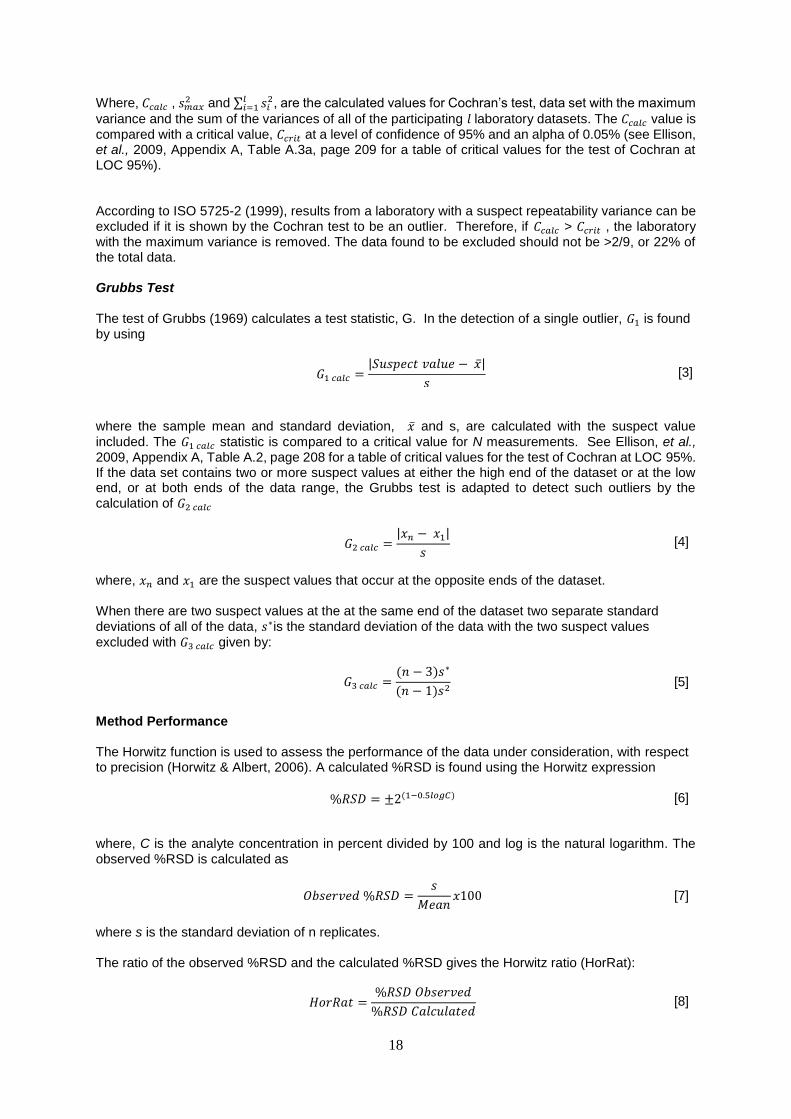
Where, 𝐶𝑐𝑎𝑙𝑐 , 𝑠𝑚𝑎𝑥2 and ∑ 𝑠𝑖
2𝑙𝑖=1 , are the calculated values for Cochran’s test, data set with the maximum
variance and the sum of the variances of all of the participating 𝑙 laboratory datasets. The 𝐶𝑐𝑎𝑙𝑐 value is compared with a critical value, 𝐶𝑐𝑟𝑖𝑡 at a level of confidence of 95% and an alpha of 0.05% (see Ellison, et al., 2009, Appendix A, Table A.3a, page 209 for a table of critical values for the test of Cochran at LOC 95%). According to ISO 5725-2 (1999), results from a laboratory with a suspect repeatability variance can be excluded if it is shown by the Cochran test to be an outlier. Therefore, if 𝐶𝑐𝑎𝑙𝑐 > 𝐶𝑐𝑟𝑖𝑡 , the laboratory with the maximum variance is removed. The data found to be excluded should not be >2/9, or 22% of the total data. Grubbs Test
The test of Grubbs (1969) calculates a test statistic, G. In the detection of a single outlier, 𝐺1 is found by using
𝐺1 𝑐𝑎𝑙𝑐 =|𝑆𝑢𝑠𝑝𝑒𝑐𝑡 𝑣𝑎𝑙𝑢𝑒 − �̅�|
𝑠 [3]
where the sample mean and standard deviation, �̅� and s, are calculated with the suspect value
included. The 𝐺1 𝑐𝑎𝑙𝑐 statistic is compared to a critical value for N measurements. See Ellison, et al., 2009, Appendix A, Table A.2, page 208 for a table of critical values for the test of Cochran at LOC 95%. If the data set contains two or more suspect values at either the high end of the dataset or at the low end, or at both ends of the data range, the Grubbs test is adapted to detect such outliers by the calculation of 𝐺2 𝑐𝑎𝑙𝑐
𝐺2 𝑐𝑎𝑙𝑐 =|𝑥𝑛 − 𝑥1|
𝑠 [4]
where, 𝑥𝑛 and 𝑥1 are the suspect values that occur at the opposite ends of the dataset. When there are two suspect values at the at the same end of the dataset two separate standard deviations of all of the data, 𝑠∗is the standard deviation of the data with the two suspect values
excluded with 𝐺3 𝑐𝑎𝑙𝑐 given by:
𝐺3 𝑐𝑎𝑙𝑐 =(𝑛 − 3)𝑠∗
(𝑛 − 1)𝑠2 [5]
Method Performance The Horwitz function is used to assess the performance of the data under consideration, with respect to precision (Horwitz & Albert, 2006). A calculated %RSD is found using the Horwitz expression %𝑅𝑆𝐷 = ±2(1−0.5𝑙𝑜𝑔𝐶) [6]
where, C is the analyte concentration in percent divided by 100 and log is the natural logarithm. The observed %RSD is calculated as 𝑂𝑏𝑠𝑒𝑟𝑣𝑒𝑑 %𝑅𝑆𝐷 =
𝑠
𝑀𝑒𝑎𝑛𝑥100 [7]
where s is the standard deviation of n replicates. The ratio of the observed %RSD and the calculated %RSD gives the Horwitz ratio (HorRat):
𝐻𝑜𝑟𝑅𝑎𝑡 =%𝑅𝑆𝐷 𝑂𝑏𝑠𝑒𝑟𝑣𝑒𝑑
%𝑅𝑆𝐷 𝐶𝑎𝑙𝑐𝑢𝑙𝑎𝑡𝑒𝑑 [8]
19
A HorRat <2 indicates that the method is of adequate precision. Should the HorRat be >2 the overall data are discarded and the candidate material considered not suitable for certification as the precision is excessive for the concentration of the analyte being determined (Nelsen & Wehling, 2008). Grand Mean
The grand mean (�̿�) i.e. the certified value of a dataset is the total of all the data values divided by the total sample size (n) : x̿ = ∑
x
n [9]
Certified Value From ANOVA as per the description in section 15, an ‘appropriate precision’ as shown in [10] is calculated for sufficient homogeneity (Thompson, 2008): 𝑠𝑟 ≤ 0.3𝑢𝑐 [10]
Where, 𝑠𝑟 is the within laboratory repeatability, as determined from [16]. Once [10] is satisfied, a grand mean [9] is calculated and this is taken to be the certified value. Total Variation (SST) The total variation (not the variance) comprises the sum of the squares of the differences of each mean with the grand mean.
SST = ∑(𝑥 − �̿�)2 [11]
Between Group Variation (SSB) The variation due to the interaction between the laboratories is denoted SSB or Sum of Squares Between laboratories and given by [12]. If the laboratory means are close to each other (and therefore the Grand Mean) SSB will be a small value. There are P samples involved with one datum value for each sample (the sample mean), so there are P-1 degrees of freedom. SSB = ∑ 𝑛(�̅� − �̿�)2 [12]
The variance due to the interaction between the laboratories is denoted MSB for Mean Square Between groups and is the SSB divided by its degrees of freedom.
𝑀𝑆 =𝑆𝑆𝐵
𝑛 − 1 [13]
Within Group Variation (SSW) The variation due to differences within individual samples is denoted SSW for Sum of Squares Within laboratories. The degrees of freedom are equal to the sum of the individual degrees of freedom for each sample. Since each sample has degrees of freedom (df) equal to one less than their sample sizes, and there are k samples, the total degrees of freedom is P less than the total sample size: df = n - P. 𝑆𝑆𝑊 = ∑ 𝑑𝑓 ∙ 𝑠2 [14]
20
The variance due to the differences within individual samples is denoted MSW for Mean Square Within groups. This is the within group variation divided by its degrees of freedom:
𝑀𝑆𝑊 =𝑆𝑆𝑊
P − 𝑛 [15]
From equations [9] through [15], the ANOVA table as shown in Table 8 is developed. Table 8. A single-factor ANOVA table showing key elements. Where P is the total number of groups, or laboratories. P-1 is 1 less than number of laboratories, P (n-1) is the number of data values minus number of groups (equals degrees of freedom for each group added together), and P-1 + P(n-1) is 1 less than number of data points. MS is the mean squares of between laboratories and within laboratories. After Ellison et al., (2009), Table 6.2, page 61.
Source Sum of Squares
df Mean Sum of Squares
F p Fcrit
Between Laboratories
SSB P-1 MSB=SSB/df MSB/MSW =FDIST(x,df,df) F-table
Within Laboratories
SSW P(n-1) MSW=SSW/df _ _ _
Total SSB+SSW P-1 + P(n-1)
_ _ _ _
Combined Standard Uncertainty The combined standard uncertainty (uc) represents the effects of random events such as days, instruments, and analysts on the precision of the analytical procedures of all accepted data of the participating laboratories. Using the output from ANOVA, the combined standard uncertainty (uc) is determined from the square root of the sum of squares of the variances of the within laboratory repeatability, 𝑠𝑟 and the between laboratory precision, 𝑠𝑠: 𝑢𝑐 = √𝑠𝑟
2 + 𝑠𝑠2 [16]
Within laboratory repeatability is determined as 𝑠𝑟 = √𝑀𝑆𝐵 [17]
and, the between laboratory precision as
𝑠𝑠 = √(𝑀𝑆𝑊 − 𝑀𝑆𝐵)
𝑛 [18]
where 𝑀𝑆𝑊 is the mean squares of the within laboratory variance, 𝑀𝑆𝐵 is the mean squares for the between laboratories and 𝑛 in this case, is the number of replicates in a group of the accepted data (Thompson & Lowthian, 2011). Expanded Uncertainty The expanded uncertainty (U) at a confidence level of 95% is determined by multiplication of the combined uncertainty (uc) by a coverage factor (k) found from N-1 degrees of freedom (df), where N is the number of laboratory means accepted in the establishment of the certified value. The t-critical value for 5% significance can be found in a t-critical table (see Appendix 7, or from MS Excel as =TINV (5%, df).
21
Uncertainty Statement Typically, an uncertainty statement is presented as follows: Au =0.77±0.04 g/t, where the number following the symbol ± is the numerical value of an expanded uncertainty, U = kuc, with U determined from a combined standard uncertainty multiplied by a coverage factor k = 2 or, a t-critical value for N-1 accepted laboratories. Since it can be assumed that the possible estimated values of the standard are approximately normally distributed with standard uncertainty, uc, the certified value of the CRM is believed to lie in the interval defined by U with a level of confidence of approximately 95 %, e.g. a mean value of 0.77±0.04g/t will have intervals of: 0.73<0.77<0.81 g/t. Appendix 3. Example: Comparison of Mean and Certified Value for Validation of Accuracy (Prepared by Allan Fraser)
According to ERM (2005); Eurolab (2007); Abzalov (2011) and Carr (2011), the validation of accuracy for a given mean and certified value requires the inclusion of the measurement uncertainty of the CRM in a t-test for statistical significance. The classical Student’s t-test as shown in [19], does not take into account the measurement uncertainty of the CRM. To compensate for this, Eurolab Technical Report No.1/2007 recommends equation [20] for the validation of CRMs with stated measurement uncertainties.
𝑡𝑐𝑎𝑙𝑐 =|�̅� − 𝜇|
𝑠
√𝑛
[19]
𝑡𝑐𝑎𝑙𝑐 =
|�̅� − 𝜇|
√(𝑢𝜇)2 +𝑠2
𝑛
[20]
Where, 𝑡𝑐𝑎𝑙𝑐 is the calculated t-statistic, �̅� the mean of n replicates with a standard deviation of s for a CRM of μ certified value. The standard uncertainty u is the stated expanded uncertainty (U) of the
CRM divided by the coverage factor (k) as stated on the certificate of analysis. Note that the | | bars indicate that the absolute value between the mean and the certified value is to be used, i.e. ignore the sign. An example in which [20] is used for validation of accuracy is given below.
Example A CRM is independently replicated nine times for Al2O3 concentration by XRF analysis, i.e. 9 individual fused glass beads were prepared. The observed mean and standard deviation of the replicate data are shown with the certified value and expanded uncertainty in Table 9. In validation of accuracy, the hypothesis question is: Is the difference between the observed mean and the certified value statistically significant at a level of confidence of 95%? Alternatively put, is there sufficient evidence to conclude that the data i.e. replicates generated, are inaccurate? The relevant hypotheses are: Null hypothesis: H0: Mean = Certified value of CRM with stated measurement uncertainty. The acceptance of H0 means that accuracy is demonstrated; i.e. insufficient evidence to reject H0; Alternate hypothesis: H1: Mean ≠ Certified value of CRM with stated measurement uncertainty. The acceptance of H1 means that accuracy is not demonstrated, i.e. there is sufficient evidence to accept H1;
22
Table 9. CRM certified value, quoted expanded uncertainty U, the coverage factor for the CRM, k=2.25 and mean for n=9 replicates and corresponding standard deviation for the replicate data.
CRM Certified
Value
Expanded Uncertainty
(U)
Coverage Factor (k)
Mean (n=9) n Standard Deviation
(s)
4.62% 0.08% 2.25 4.59 9 0.01015
The standard uncertainty (u) is found by dividing the expanded uncertainty by the coverage factor:
𝑢 =0.08
2.25= 0.0356 %
Using the observed mean for the replicate data (n=9) obtained for the CRM and substituting into [20]:
𝑡𝑐𝑎𝑙𝑐 =|�̅� − 𝜇|
√0.03562 +0.010152
9
=|4.59 − 4.62|
√0.00126 + 0.00001145= 0.84
Therefore, 𝑡𝑐𝑎𝑙𝑐= 0.84 and 𝑡𝑐𝑟𝑖𝑡(5%, 8) = 2.31 (df is 8, therefore, tcrit=2.31, see Appendix 7, page 25) which is >0.84. Similarly, the p-value=0.43 which is >0.05. This is strong evidence in favour of accepting the null hypothesis that there is no significant statistical difference between the certified value and the observed mean. Therefore, under the conditions that the uncertainty associated with the certified value is known the accuracy is validated for the CRM tested. If the null hypothesis is accepted that the mean obtained is not statistically different from the certified value, then the principle of traceability has been conformed to. ………………………………………………………………………….. Appendix 4. Using the CRM in Quality Control (Prepared by Allan Fraser) QC chart control limits should not be determined by the certified value and stated measurement uncertainty of the certified reference material used. These parameters although “certified” will never be known; it is only the corresponding statistical estimates, i.e. standard deviation and the mean calculated from replicated results that are known and these should be used in quality control charts. However, should the laboratory chose to use the certified value as the mean then the quoted 2s value for the CRM can be used in the quality control chart. It is recommended that a Shewhart chart be developed for the use if this CRM is to be used as a control sample in laboratory quality control. A Shewhart chart is a plot of sequential assay results obtained from quality control material such as an AMIS CRM. The warning and control limits are based on the standard deviation obtained from the mean of the replicates of a CRM (Ellison, et al., 2009; Thompson, 2010).The procedure in preparing a Shewhart chart is as follows:
1. Analyse 10 to15 replicates or more of the AMIS CRM; 2. Apply the Grubbs test for outliers; 3. Determine the mean of the replicates after application of the Grubbs test; 4. Determine the standard deviation, using equation [21], of the replicates; 5. Calculate the standard deviation, s from:
𝑠 = √∑(𝑥𝑖 − �̅�)2
𝑛 − 1 [21]
23
where, 𝑥𝑖 is an individual measurement in the data set, �̅� is the mean of the data set at n-1 degrees of freedom (df) and n is the number of replicates. The sample standard deviation can be found using the MS Excel formula “=stdev.s (number1;)”.
6. Verify accuracy of the mean value using equation [20]; 7. Once accuracy is verified, calculate ±2s and ±3s, where s is the standard deviation calculated
from [21]. 8. Construct the Shewhart control chart around the mean of n replicates; 9. Use ±2s as the warning limits; 10. Use ±3s as the control limits; 11. It is recommended that if 2 to 3 points are outside warning the limits analyse another sample
and if it then within warning limits, continue. If it is outside the warning limits, stop and troubleshoot;
12. It is recommend that if any point is outside control limits, analyse another portion (sample) of the CRM. If it is within control limits, continue. If it is outside control limits, stop and troubleshoot;
13. For reference purposes, the CRM certified value can be plotted on the Shewhart chart alongside the mean value.
On a regular basis the accuracy of the replicates of the CRM should be assessed in terms of the certified value of the CRM using equation [20].
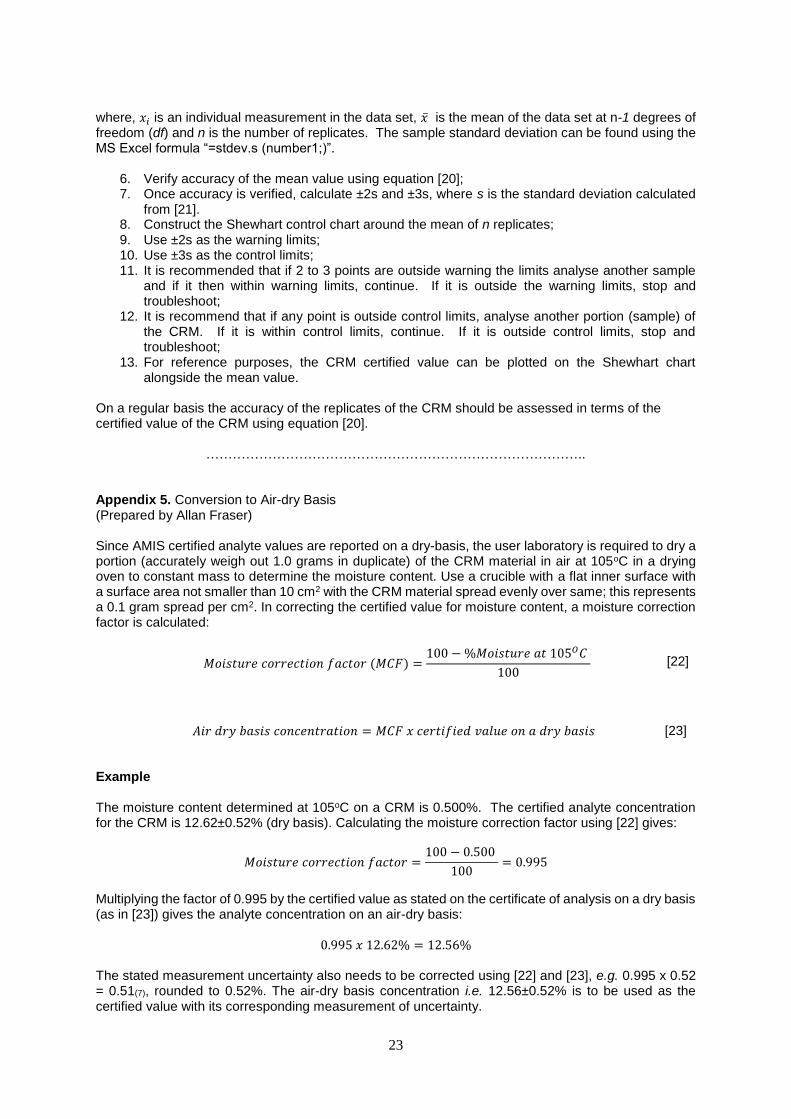
………………………………………………………………………….. Appendix 5. Conversion to Air-dry Basis (Prepared by Allan Fraser) Since AMIS certified analyte values are reported on a dry-basis, the user laboratory is required to dry a portion (accurately weigh out 1.0 grams in duplicate) of the CRM material in air at 105oC in a drying oven to constant mass to determine the moisture content. Use a crucible with a flat inner surface with a surface area not smaller than 10 cm2 with the CRM material spread evenly over same; this represents a 0.1 gram spread per cm2. In correcting the certified value for moisture content, a moisture correction factor is calculated:
𝑀𝑜𝑖𝑠𝑡𝑢𝑟𝑒 𝑐𝑜𝑟𝑟𝑒𝑐𝑡𝑖𝑜𝑛 𝑓𝑎𝑐𝑡𝑜𝑟 (𝑀𝐶𝐹) =100 − %𝑀𝑜𝑖𝑠𝑡𝑢𝑟𝑒 𝑎𝑡 105𝑂𝐶
100 [22]
𝐴𝑖𝑟 𝑑𝑟𝑦 𝑏𝑎𝑠𝑖𝑠 𝑐𝑜𝑛𝑐𝑒𝑛𝑡𝑟𝑎𝑡𝑖𝑜𝑛 = 𝑀𝐶𝐹 𝑥 𝑐𝑒𝑟𝑡𝑖𝑓𝑖𝑒𝑑 𝑣𝑎𝑙𝑢𝑒 𝑜𝑛 𝑎 𝑑𝑟𝑦 𝑏𝑎𝑠𝑖𝑠 [23]
Example The moisture content determined at 105oC on a CRM is 0.500%. The certified analyte concentration for the CRM is 12.62±0.52% (dry basis). Calculating the moisture correction factor using [22] gives:
𝑀𝑜𝑖𝑠𝑡𝑢𝑟𝑒 𝑐𝑜𝑟𝑟𝑒𝑐𝑡𝑖𝑜𝑛 𝑓𝑎𝑐𝑡𝑜𝑟 =100 − 0.500
100= 0.995
Multiplying the factor of 0.995 by the certified value as stated on the certificate of analysis on a dry basis (as in [23]) gives the analyte concentration on an air-dry basis:
0.995 𝑥 12.62% = 12.56% The stated measurement uncertainty also needs to be corrected using [22] and [23], e.g. 0.995 x 0.52 = 0.51(7), rounded to 0.52%. The air-dry basis concentration i.e. 12.56±0.52% is to be used as the certified value with its corresponding measurement of uncertainty.
24
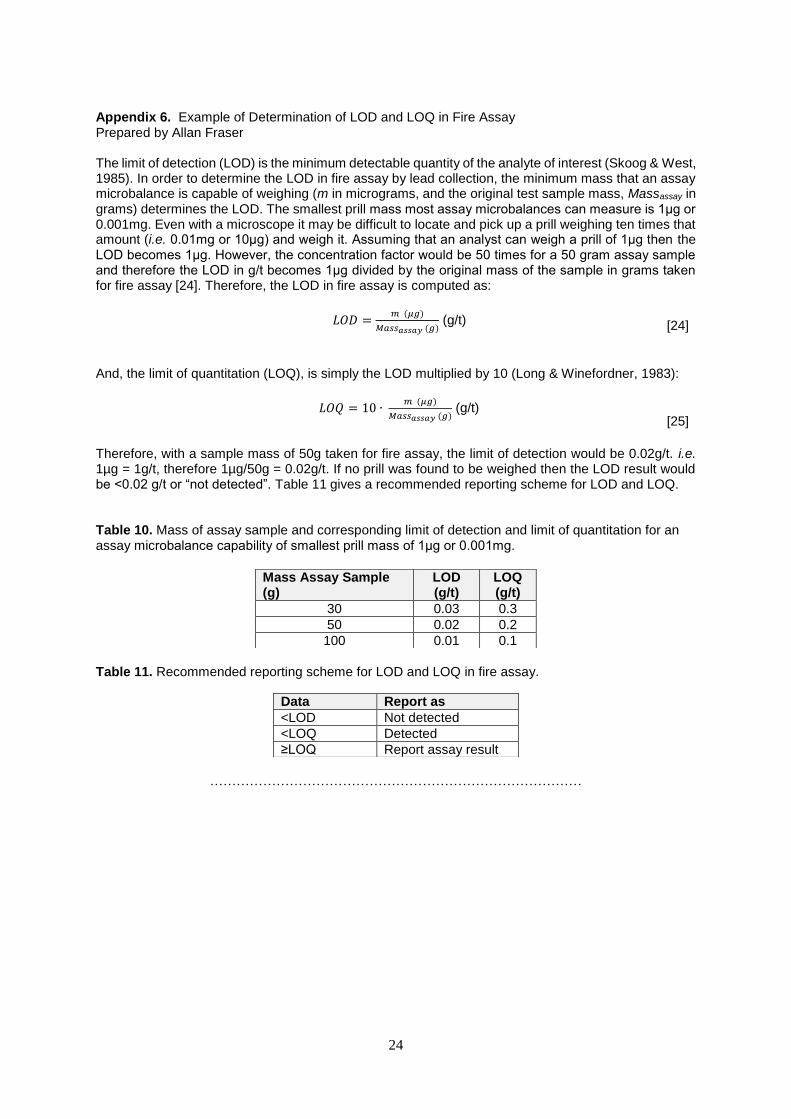
Appendix 6. Example of Determination of LOD and LOQ in Fire Assay Prepared by Allan Fraser The limit of detection (LOD) is the minimum detectable quantity of the analyte of interest (Skoog & West, 1985). In order to determine the LOD in fire assay by lead collection, the minimum mass that an assay microbalance is capable of weighing (m in micrograms, and the original test sample mass, Massassay in grams) determines the LOD. The smallest prill mass most assay microbalances can measure is 1μg or 0.001mg. Even with a microscope it may be difficult to locate and pick up a prill weighing ten times that amount (i.e. 0.01mg or 10μg) and weigh it. Assuming that an analyst can weigh a prill of 1μg then the LOD becomes 1μg. However, the concentration factor would be 50 times for a 50 gram assay sample and therefore the LOD in g/t becomes 1μg divided by the original mass of the sample in grams taken for fire assay [24]. Therefore, the LOD in fire assay is computed as: 𝐿𝑂𝐷 =
𝑚 (𝜇𝑔)
𝑀𝑎𝑠𝑠𝑎𝑠𝑠𝑎𝑦 (𝑔) (g/t) [24]
And, the limit of quantitation (LOQ), is simply the LOD multiplied by 10 (Long & Winefordner, 1983): 𝐿𝑂𝑄 = 10 ∙
𝑚 (𝜇𝑔)
𝑀𝑎𝑠𝑠𝑎𝑠𝑠𝑎𝑦 (𝑔) (g/t)
[25]
Therefore, with a sample mass of 50g taken for fire assay, the limit of detection would be 0.02g/t. i.e. 1µg = 1g/t, therefore 1µg/50g = 0.02g/t. If no prill was found to be weighed then the LOD result would be <0.02 g/t or “not detected”. Table 11 gives a recommended reporting scheme for LOD and LOQ. Table 10. Mass of assay sample and corresponding limit of detection and limit of quantitation for an assay microbalance capability of smallest prill mass of 1μg or 0.001mg.
Mass Assay Sample (g)
LOD (g/t)
LOQ (g/t)
30 0.03 0.3
50 0.02 0.2
100 0.01 0.1
Table 11. Recommended reporting scheme for LOD and LOQ in fire assay.
Data Report as
<LOD Not detected
<LOQ Detected
≥LOQ Report assay result
…………………………………………………………………………
25
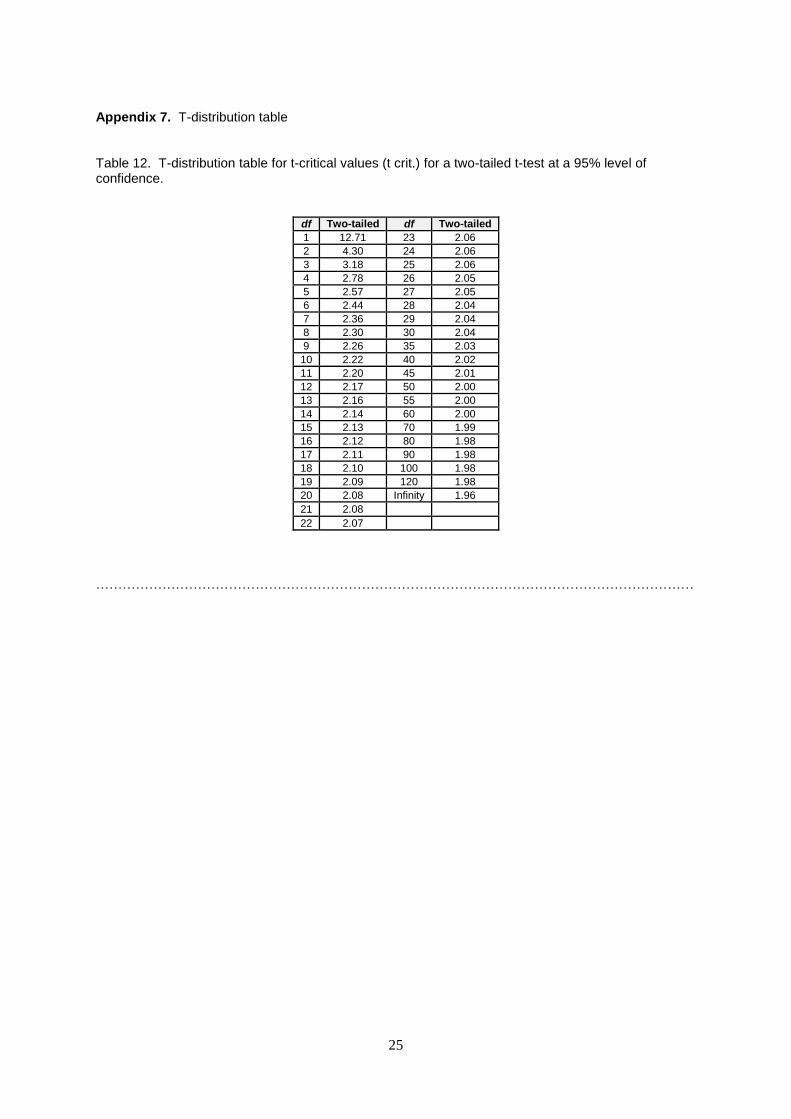
Appendix 7. T-distribution table Table 12. T-distribution table for t-critical values (t crit.) for a two-tailed t-test at a 95% level of confidence.
df Two-tailed df Two-tailed
1 12.71 23 2.06
2 4.30 24 2.06
3 3.18 25 2.06
4 2.78 26 2.05
5 2.57 27 2.05
6 2.44 28 2.04
7 2.36 29 2.04
8 2.30 30 2.04
9 2.26 35 2.03
10 2.22 40 2.02
11 2.20 45 2.01
12 2.17 50 2.00
13 2.16 55 2.00
14 2.14 60 2.00
15 2.13 70 1.99
16 2.12 80 1.98
17 2.11 90 1.98
18 2.10 100 1.98
19 2.09 120 1.98
20 2.08 Infinity 1.96
21 2.08
22 2.07
………………………………………………………………………………………………………………………