Copper and Zinc Loading Associated with Automotive Brake-Pad
40
Copper and Zinc Loading Associated with Automotive Brake-Pad and Tire Wear Puget Sound Basin December 2011 Publication no. 11-10-087
Transcript of Copper and Zinc Loading Associated with Automotive Brake-Pad
Copper and Zinc Loading Associated with Automotive Brake-Pad and Tire Wear
Puget Sound Basin December 2011 Publication no. 11-10-087

Publication and Contact Information
This report is available on the Department of Ecology’s website at www.ecy.wa.gov/biblio/1110087.html For more information contact: Water Quality Program P.O. Box 47600 Olympia, WA 98504-7600
Phone: 360-407-6600
Washington State Department of Ecology - www.ecy.wa.gov
o Headquarters, Olympia 360-407-6000 o Northwest Regional Office, Bellevue 425-649-7000 o Southwest Regional Office, Olympia 360-407-6300 o Central Regional Office, Yakima 509-575-2490 o Eastern Regional Office, Spokane 509-329-3400 To ask about the availability of this document in a format for the visually impaired, call the Water Quality Program at 360-407-6600. Persons with hearing loss can call 711 for Washington Relay Service. Persons with a speech disability can call 877-833-6341.

Copper and Zinc Loading Associated with Automotive
Brake-Pad and Tire Wear
Puget Sound Basin
by Anthony J. Whiley, P.E.
Water Quality Program Washington State Department of Ecology
Olympia, Washington

This page is purposely left blank

iii
Table of Contents
Page
List of Figures and Tables.............................................................................................................. iv Figures...................................................................................................................................... iv Tables .........................................................................................................................................v
Analysis Overview ...........................................................................................................................1 Methods......................................................................................................................................1 Vehicle Miles Travelled (VMT) ................................................................................................3 Brake pad and tire wear rates and metals composition ..............................................................4
Brake pad copper composition and wear rates ..................................................................4 Vehicle tire zinc composition and wear rates ....................................................................5
Considering proximity of loading ..............................................................................................7
Results ..............................................................................................................................................9 Vehicle kilometers travelled ......................................................................................................9
Seasonal use .....................................................................................................................12 Representation by vehicle-type .......................................................................................13
Automotive metals loading ......................................................................................................14 Zinc loading associated with tire wear ............................................................................14 Copper loading associated with brake pad wear .............................................................20
Conclusions ....................................................................................................................................25 Vehicle kilometers travelled ....................................................................................................25 Tire related zinc loading ..........................................................................................................25 Brake pad-related copper loading ............................................................................................25
References ......................................................................................................................................27
Appendix A: Additional Discussion, Figures and Tables .............................................................29 Check on tire wear rate ............................................................................................................29 Assessment of VKT accuracy based on vehicle type ..............................................................30 Lane kilometers and vehicle kilometers travelled ...................................................................31

iv
List of Figures and Tables
Figures Figure 1. Total vehicle kilometers travelled on both highway and non-highway roads, by
county. .......................................................................................................................... 10
Figure 2. The representation of total annual vehicle kilometers travelled (VKT) for highway and non-highway roads by setting, urban or rural. ....................................................... 12
Figure 3. Monthly variation to annual highway-based vehicle kilometers travelled. .................. 13
Figure 4. The representation of the six vehicle types of the total 2008 VKT occurring within the Puget Sound counties considered by this analysis. ................................................ 14
Figure 5. The annual zinc load (kilograms) estimated for the combined highway and non-highway road system, by county. ................................................................................. 15
Figure 6. The zinc yield (g/km-yr) based on the annual load and total lane miles (highway and local), by county. ................................................................................................... 16
Figure 7. The annual zinc load for the highway system based on county and setting. ................ 17
Figure 8. The annual zinc load for the non-highway road system by county and setting. .......... 18
Figure 9. The annual zinc load estimated for the highway road system by vehicle type and setting. ........................................................................................................................... 19
Figure 10. The annual zinc load estimated for the non-highway (local) road system by vehicle type and setting. .............................................................................................. 19
Figure 11. Annual Copper loading associated with brake wear for the highway and non- highway road system by county. ................................................................................. 21
Figure 12. The copper yield (g/km-yr) based on the annual load and total lane kilometers, by county. ........................................................................................................................ 21
Figure 13. Annual copper loading associated with brake wear for the highway system, by county and setting. ..................................................................................................... 22
Figure 14. Annual copper loading associated with brake wear for the highway system, by vehicle type and setting. ............................................................................................. 23
Figure 15. Annual copper loading associated with brake wear for the non-highway road system, by county and setting. .................................................................................... 24
Figure 16. Annual copper loading associated with brake wear for the non-highway road system, by vehicle type and setting. ........................................................................... 24

v
Tables Table 1. Assumed values and associated variability. ..................................................................... 2
Table 2. The classification scheme applied to WSDOT vehicle miles travelled (VMT) data....... 3
Table 3. Assumptions applied to calculate copper loading associated with brake pad wear. ........ 5
Table 4. Assumptions applied to calculate zinc loading associated with tire wear. ...................... 6
Table 5. The annual VKT (considering all vehicle types) by county and setting. ....................... 11
Table 6. The annual (2008) zinc loading associated with tire wear (kg) by county and road system. ............................................................................................................................ 15
Table 7. The annual (2008) zinc loading associated with tire wear (kg) by county and road system. ............................................................................................................................ 18
Table 8. The annual copper loading associated with brake wear (kg) by county and road system........................................................................................................................................................ 20
Table 9. The annual copper loading associated with brake wear (kg) by vehicle type and road system. ........................................................................................................................... 23

vi
This page is purposely left blank.

1
Analysis Overview This analysis provides an estimate of the annual loading of zinc and copper to road surfaces associated with automotive tire and brake pad wear within twelve counties in the greater Puget Sound basin. These estimates are for deposition to road surfaces as opposed to receiving waters, and are based primarily on the number of vehicle kilometers travelled (VKT) within each of the study counties in 2008. A finer resolution to these loading estimates could be undertaken and would be warranted, particularly if water quality impacts associated with automotive-related metals deposition is the ultimate interest. The distribution of this loading throughout the road network is not even. For instance, for a given kilometer of rural highway it is expected that the loading of brake pad-related copper is lower than that of an urban intersection. Highway tire wear rates of passenger vehicles are different from non-highway wear rates. In addition, differences in driving behavior, type and age of vehicle, road surface, weather conditions, the characteristics of the brake and tire material, and their level of maintenance, are among the many variables that could be considered in making this type of estimate. While recognizing this complexity, the approach ultimately undertaken by this analysis steered in the direction of simplicity due in large part to the lack of data available to support a more detailed type of analysis that more fully accounted for these many variables. The ultimate objective of this work is to:
• Determine the relative magnitude of copper and zinc deposition associated with automotive brake pad and tire wear occurring within the greater Puget Sound basin.
• Quantify that load by proximity and the types of vehicles primarily associated with it. The study methods can also be applied to examine the loading of other constituents present within brakes and tires.
Methods The estimation of automotive metals loading associated with brake pad and tire wear was based on three primary factors: 1) the annual vehicle kilometers travelled (VKT); 2) brake pad and tire wear rates; and 3) the representation of copper and zinc within brakes pads and tires, respectively. To provide a greater level of specificity to the loading estimates, the vehicle kilometers travelled data was further defined by period (month), proximity (county), and representation among vehicle types. In addition, brake pad and tire wear rates were defined by vehicle type. These factors were incorporated into two equations used to estimate loading (following): equation 1 was used to estimate zinc loading associated with tire wear, while equation 2 was used to estimate copper loading associated with brake pad wear.

2
Equation 1. Zinc loading associated with tire wear.
��������� ��� ������ ������ �
∑������� �!" #!$%����&'�( ) * �+�
�� . * - #�!� .�$! !$ � � �/+�0#�!�* - #�!� 12�3�! - 4( #�!� 5�(6�( !$ ��( ��/
+/* -(10-12)
Equation 2. Copper loading associated with brake pad wear.
��������� ��� ������ ������ �
∑������� �!" #!$%����&'�( ) * �+�
�� . * - 7!$+� 8$& 9�$! :$ � � �/+�0%�)�6��* - 52 7!$+� 8$& 5�(6�( !$ ��( ;�/
+/ <*(10-12)
There is considerable variability for many of the parameters used to estimate the loading of
copper and zinc associated with automobile use. To account for these various uncertainties, a
Monte Carlo-type analysis was applied. The analysis took the form of generating results for
1000 iterations of loading estimates through the application of the Excel formula:
NORMINV(rand(), mean, standard deviation). The formula generates a random parameter value
based on sample mean and associated standard deviation. (The underlying assumption in the use
of this formula is that the parameter distribution is normal.) The NORMINV() function was
applied to these parameters: vehicle kilometers travelled, wear rates, metals composition, and in
the case of passenger cars and light trucks, the representation of brake pads as opposed to drums.
Mean parameter values and assumed variability are included in Table 1 with further discussion in
the report section titled: “Brake pad and tire wear rates and metals composition”.
Table 1. Assumed values and associated variability.*
Parameters and assumed variability
Brake Pads / Drums
Parameter Mean value Assumed standard deviation
Vehicle kilometers travelled ===== 5% of parameter value
Copper representation Pads =49552 mg Cu/kg brake material Drums = 2179 mg Cu/kg brake material
Pads = 12699 mg Cu/kg brake material Drums =2439 mg Cu/kg brake material
Representation of pads vs. drums on passenger cars and light trucks
1.66 axles full pads 0.34 axles front pads, rear drums
10% of parameter value
Brake pad / drum wear rates Refer to Table 3 10% of parameter value
Tires
Parameter Mean value Assumed standard deviation
Vehicle kilometers travelled ===== 5% of parameter value
Zinc representation 7434 mg Zn/kg tire material 3771 mg Zn/kg tire material
Tire wear rate 38 mg tire material/km travel 26 mg tire material/km travel
*Data sources and discussion included in section “Brake pad and tire wear rates and metal composition”.

3
Loading estimates were based at the county level by vehicle type and roadway system (highway, non-highway). Percentiles were determined from the 1000 loading estimates and a series of box plot figures generated from those estimates. The box plots provide a graphical display of the estimated loading variability.
Vehicle miles travelled (VMT) Within Washington State, an annual estimation of vehicle miles travelled (VMT) for the state highway system is conducted by the Washington State Department of Transportation (WSDOT). (WSDOT reports vehicle travel in units of miles, though this report uses kilometers.) The estimate is conducted in part to fulfill an annual reporting requirement of the Federal Highway Administration’s Performance Monitoring System (www.wsdot.wa.gov/mapsdata/tdo/annualtrafficreport.htm). The data is reported at the county level. In addition, as part of that requirement, VMT are also reported for non-highway or local road automotive use. This estimate is conducted at the local level (city and county) and reported annually to WSDOT. Within each county, both the highway and non-highway VMT estimates are further defined by rural and urban settings, based on Census Bureau designations. From this information, and particular to this analysis, these annual VMT data were further divided into a monthly distribution by county and vehicle type. Twelve counties draining to the greater Puget Sound were included in this assessment: Clallam, Island, Jefferson, King, Kitsap, Mason, Pierce, San Juan, Skagit, Snohomish, Thurston, and Whatcom. Vehicle types were divided into the following groups: motorcycle, passenger car, light truck, bus, single unit truck, and combination truck. The representation of these vehicle types on the urban and rural highway network is based on traffic survey data collected by WSDOT. The vehicle representations are expressed as a percent of the total annual VMT, providing an annual average use level. For this analysis, it was assumed that the representation of vehicle types present for the highway system is the same as that for the non-highway system. In addition, it was assumed that vehicle representation shows no seasonal (monthly) variation. The standard deviation applied in the analysis for vehicle kilometers travelled was assumed ±5% around the reported levels (www.wsdot.wa.gov/mapsdata/tdo/annualtrafficreport.htm). This VMT categorization scheme was conducted to examine metals loading in terms of proximity, seasonal variation, and to determine the relative source levels by vehicle type. An outline of this classification scheme is presented in Table 2.
Table 2. The classification scheme applied to WSDOT vehicle miles travelled (VMT) data. County Clallam, Island, Jefferson, King, Kitsap, Mason, Pierce, San Juan, Skagit, Snohomish,
Thurston, Whatcom Functional Use
Highway, Non-Highway Setting Urban, Rural
Reporting Period
Monthly Vehicle Type
Motorcycle, Passenger Car, Light Truck, Bus, Single Unit Truck, Combination Truck

4
Brake pad and tire wear rates and metals composition
Brake pad copper composition and wear rates While a number of studies have been conducted to examine metal levels in brake pads, in particular copper levels, there is a wide range in their findings. Part of this variability has to do with the application of differing analytical procedures for the extraction, processing, and analysis of the brake pad samples examined. Further complicating matters is the fact that the representation of copper present in brake pads is highly variable. Brake pad composition is a complex of materials and considered proprietary; therefore, there is not a uniform process to their manufacture. Levels vary among the automobile manufacturers as well as among their various vehicle models. In addition, the copper representation in brake pads tends to be significantly higher in those originally equipped with the vehicle (OEM) in comparison to replacement pads. Not discussed among the various brake pad studies is the relation between the price of copper and its representation in brake pads, which also could be a factor affecting variability. Despite recent economic concerns, which caused a short though rapid drop in the price of copper, prices have risen by a factor of 5 since 2003. This may be a factor in the variability and, in particular, in the lower copper representation in the aftermarket pads in which profit margins are lower. Study results define the average copper represented in brake pads, based on a broad spectrum of manufacturers and vehicle models, at between 4 and 12%. A weighted average based on original manufacturers equipment (OEM) brake pads from various manufacturers and their respective vehicle models, determined the representation of copper at 4.2% (Armstrong, 1994). Similarly, an overall weighted average, based on the percentage of vehicles equipped with OEM, as opposed to replacement pads, determined a copper representation of 5.2% (Hjortenkrans, 2007). The OEM copper representation was found to be 13% while the replacement pads were significantly lower at 0.015%. An assessment of brake pads found average copper levels of 11.8% and 9.2% for OEM front and rear, respectively, and 7.2% and 5.1% for front and rear replacements (Westerlund, 2001). The assessment took into consideration OEM versus replacement, along with differences in pad location (front wheel brakes or rear wheel brakes). An analysis of copper levels in OEM pads, based on a compilation of manufacturers and models which together represented about 40% of the passenger car traffic in the San Francisco Bay area over an 8-year period (1998-2005), found an average of 5% (Rosselot, 2006). Appropriately, due to its high representation among traffic, the primary focus of brake pad study has been passenger as opposed to commercial vehicles. It is generally assumed that commercial vehicles utilize brake drums that, due to lower braking temperatures, contain less copper. The material that is worn is further contained within the brake drum, resulting in a lower overall emission level (Rosselot, 2006). When analyzed, brake drums associated with commercial vehicles were found to have a fraction of the copper typically found in those associated with passenger cars: 0.2% as opposed to 5% (Uexkull, 2003). This analysis assumes an average representation of copper present in the brake-pads of motorcycles, passenger vehicles, and light trucks at 5%, with a standard deviation of 1.3% (Brake Pad Partnership, 2005) (Table 3). The representation of brake pads in light trucks and passenger vehicles is variable, depending on manufacturer, model, and year of production,

5
among other factors. Almost all recent light trucks and passenger cars have brake pads present on the front axle with representation on the rear axle the reason for the variability. This analysis assumes that 66% of passenger cars and light trucks have full brake-pad coverage, with 34% of the vehicles having front brake-pads and rear drums. This assumption is consistent with prior reported estimates (Rosselot, 2006) and those provided by several local automobile repair shops. Around these figures, a standard deviation of 10% was assumed. It is assumed that commercial vehicles utilized brake drums that have an average copper representation of 0.22% with a standard deviation of 0.24% (Uexkull, 2003). The vehicles assumed to represent commercial vehicles include buses, single unit and combination trucks. An analysis of deposition rates and composition of traffic-related roadway deposits, conducted prior to the wide use of the brake pads, determined a copper deposition rate of 0.0801 mg Cu/km-axle (Shaleen, 1975). The assumption of a 0.2% copper composition applied to an average estimated drum brake wear rates per axle of 43 mg/km-axle (average of bus, single unit and combination trucks) (Table 2), results in a copper deposition rate of 0.086 mg Cu / km-axle, similar to the pre-brake pad loading level. This estimate provides further foundation to the assumption of lower copper representation of brake drums as opposed to brake pads. The average wear rate, by vehicle type, of brake pads (drums) is based on the distance traveled to achieve a 70% loss in mass of the original braking material. Table 3 includes estimates of brake material wear rates applied in this analysis. The estimates for automobile, bus, and light goods truck wear rates were those reported in Westerlund (2001), while the rates used for single unit and combination trucks were those from Rosselot (2006). The assumed brake pad wear rate for motorcycles was 3 mg/kg, based on the ratio of the average vehicle weight to pad number (341 kg/pad for automobile as opposed to 68 kg/pad for motorcycle). Therefore, motorcycles have an 80% lower vehicle weight to pad metric in comparison to automobiles. For this analysis, it was assumed that standard deviation associated with brake pad wear is 10% of the mean value.
Table 3. Assumptions applied to calculate copper loading associated with brake pad wear. Vehicle Type Per Vehicle
Brake pad/drum wear rate (mg/Km)
Per Vehicle No. axles
Per Vehicle Wear rate based on axles (mg/axle-km)
Representation of copper in brake material (mg Cu/kg)
Per Vehicle Average copper emission rate (mg Cu/km) Average Standard
Deviation Motorcycle 3 1 3 49552 12699 0.15 Automobile* 16 2 8 49552 12699 0.66 Bus 110 3 37 2179 2439 0.24 Light Truck* 16 2 8 2179 2439 0.66 Single Unit Truck 129 3 43 2179 2439 0.28 Combination Truck 245 5 49 2179 2439 0.53
*Assumes a weighting factor of 1.66 axles with brake-pads and 0.34 axles with drums, ± 10%.
Vehicle tire zinc composition and wear rates The representation of zinc in automobile tires is about 1% of composition by weight (Councell, 2004). Reported zinc composition levels for retread and non-retread tires were found to average 1.2% and 0.94%, respectively (Hjortenkrans, 2007). Compilations of literature values found

6
reported zinc compositions ranging between 0.04 to 1.6% with a mean level of 0.7% (7434 mg Zn/kg tire tread) ( (EMEP, 2006; Councell, 2004). Reported tire wear rates range between 10 and 97 mg thread/km with median levels approximately 40 mg/km (Councell, 2004). (Appendix A contains a calculation of tire wear rate for a common passenger car, finding a wear rate of 38 mg/km.) Few studies focus on the tire wear rates of commercial vehicles, though reported rates are comparable to those found for passenger vehicles (EMEP, 2006). This is likely due to the larger number of tires supporting the increased weight of commercial vehicles, balancing stresses. An analysis of deposition rates and composition of traffic-related roadway deposits determined a zinc deposition rate of 0.987 mg Zn / km-axle (Shaheen, 1975). Considering a tire-wear rate of 38 mg/km, a 1% Zn composition, and a weighted-average tire per axle of 2.14 (based on the representation of the various vehicle-types considered and their associated tire number – refer to Table 4), would result in a loading rate of 0.813 mg Zn / km-axle, similar to the prior estimate. This is not unexpected, in that while the advent of the brake pad resulted in increased copper composition for passenger vehicles, the level of zinc in automotive tires has remained at a similar level for an extended period (Councell, 2004). Also, the estimated lower loading rate is appropriate, given that there are additional automotive sources of zinc besides tires, for instance the wearing of metal parts (i.e. brake pads), along with being an additive to lubricants and petrol. This analysis assumes an average tire wear rate of 38 mg/km, with a standard deviation of 26 mg/km. These metrics are derived from literature-compiled rates reported in Councell (2004) and EMEP (2006). The average zinc composition associated with this wear is assumed to be 7,434 mg Zn/kg tire tread (0.74%), with a standard deviation of 3771 mg Zn/kg tire tread (EMEP, 2006). (The standard deviation was estimated based on half the reported range divided by the square root of three.) The assumed number of axles and associated tires by vehicle type is presented in Table 4.
Table 4. Assumptions applied to calculate zinc loading associated with tire wear. Vehicle Type Tire Wear
Rate (mg/Km)
Per Vehicle No. Axles
Per Vehicle No. Tires
Per Vehicle No. Tires per axle
Representation of Zinc (mg Zn/kg)
Per Vehicle Zn Emission Rate (mg Zn/km)
Average Standard Deviation
Motorcycle 38 1 2 2.00 7434 3771 0.56 Automobile 38 2 4 2.00 7434 3771 1.13 Bus 38 3 8 2.67 7434 3771 2.26 Light Truck 38 2 4 2.00 7434 3771 1.13 Single Unit Truck
38 3 8 2.67 7434 3771 2.26
Combination Truck
38 5 18 3.60 7434 3771 5.08

7
Considering proximity of loading The metals loading rates (mg/km) presented in Tables 3 and 4 are based on vehicle type, their associated brake pad and tire wear rates, and the average composition of copper and zinc, respectively. It is recognized that there are various pathways that brake pad and tire material can take, including introduction to air, retention on the vehicle under carriage, and direct deposition to the street surface. However, for this analysis the loading estimates are based on the assumption that the brake-pad and tire material, once emitted, is all eventually deposited to the road surface in proximity (at county level) to the point of travel. Applying the wear rates implies that there is an equitable distribution to the metals loading. However, in reality the proximity of the loading will be quite varied. For instance, some tire wear will always occur, to varying levels, with movement of the vehicle. In contrast, brake pad wear only occurs with application of the brake mechanism. So, for highway travel under conditions of low traffic volume, very little brake pad wear can be expected per kilometer travelled. However, braking at higher speeds in more urbanized highway sections (in high to moderate traffic volumes) results in considerably higher wear rates. The highest metals loading associated with brake pad wear is expected to occur in urbanized highway and non-highway (local) roadways due to the increased frequency and intensity of braking. Recognizing this variability, the vehicle kilometers travelled and, ultimately, loading, was categorized by the type of road system (highway and non-highway) and setting (urban and rural), providing a surrogate of traffic intensity.

8
This page purposely left blank

9
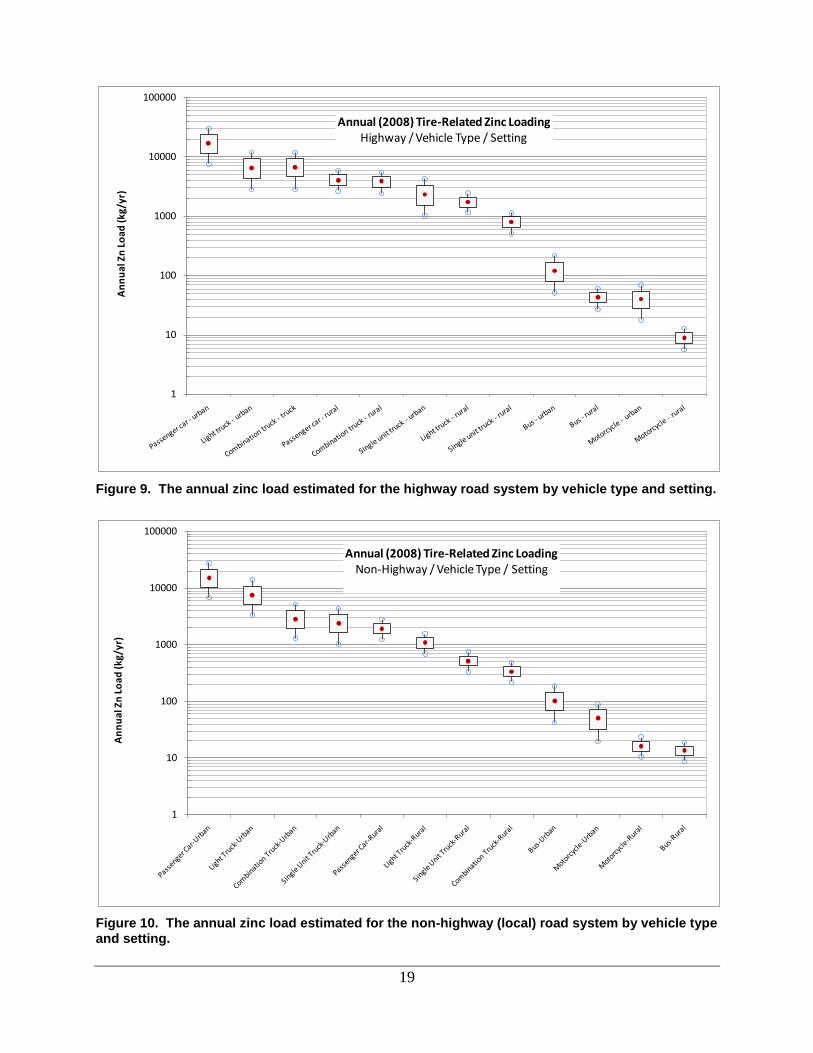
Results While an assessment of variability was included when calculating annual loading rates, for this discussion only the overall median values will be considered. This is mainly to keep the discussion focused on relative comparisons. Variability has not been completely ignored, but instead is considered in the series of figures found throughout the results section in the form of box plots. Regarding the interpretation of the box plot graphic: the upper and lower sides of the central box indicate the 75th and 25th percentiles of the data set; the dot within the box is the median (50th percentile); while the upper and lower circles (at end of upper and lower whisker extensions) are the 90th and 10th percentile of the load estimates.
Vehicle kilometers travelled An estimated 58 billion (109) kilometers were travelled throughout the Puget Sound study area in 2008. 55% of the travel occurred on the highway system with the remainder (45%) occurring on the non-highway (local) road system (Figure 1). Among the Puget Sound counties considered by this analysis, travel within King County represented approximately 45% of the annual total, more than twice that of Pierce County (17%), the county with the next greatest level. Travel within King, Pierce, and Snohomish counties together accounts for 77% of the greater Puget Sound area total (Table 5). Travel within these counties is polarized. For instance, 91% of the annual VKT in King, Pierce, and Snohomish Counties occurs in their urbanized western portions, along the Interstate-5 corridor (Figure 2).

10
Figure 1. Total vehicle kilometers travelled on both highway and non-highway roads, by county. In contrast, the majority of the VKT occurring in counties situated outside of the Interstate-5 corridor (including Clallam, Island, Jefferson, and Mason), is rural-based. For these counties, approximately 77% of the annual VKT occurs on rural roads, with the other 23% occurring in an urbanized setting. (San Juan County has no highway road system or urbanized setting.) Thurston, Skagit, and Whatcom counties are also bisected by Interstate-5, but the road systems in these counties remain primarily rural with a smaller urbanization base. For this reason, the travel in these counties is more evenly split between the urbanized and rural road systems. Kitsap County, though also outside of the I-5 corridor, has a level of urbanization and highway road system more reflective of the Puget Sound urban core (King, Pierce, and Snohomish Counties) and, for this reason, is an anomaly among the study counties.
0
2
4
6
8
10
12
14
16
18
20
22
24
26
Ann
ual V
ehic
le K
ilom
eter
s Tra
velle
d (x
109 )
Total Kilometers Travelled Annually (Highway and Non-Highway) by County
(in Billions)

11
Table 5. The annual VKT (considering all vehicle types) by county and setting.
Annual (2008) Vehicle Kilometers Travelled (VKT), By County - All Vehicles Combined
County Highway (VKT) Non-highway (VKT)
Total % of Total Urban Rural Urban Rural
Clallam 97,299,288 378,013,946 133,126,937 144,611,190 753,051,361 1.30
Island 43,158,368 287,366,106 144,593,651 187,968,248 663,086,374 1.15
Jefferson 35,009,427 305,600,742 59,605,294 87,337,644 487,553,106 0.84
King 12,300,087,970 1,223,423,233 12,047,277,095 288,829,021 25,859,617,319 44.76
Kitsap 1,110,058,763 341,035,909 901,614,425 247,285,322 2,599,994,419 4.50
Mason 24,547,226 442,867,264 71,457,049 265,670,768 804,542,306 1.39
Pierce 4,512,323,884 460,243,337 4,783,037,335 226,948,614 9,982,553,170 17.28
Skagit 596,466,763 779,742,298 379,555,153 214,187,995 1,969,952,209 3.41
San Juan 0 0 0 59,569,789 59,569,789 0.10
Snohomish 4,566,913,715 834,985,220 2,887,046,507 297,244,484 8,586,189,926 14.86
Thurston 1,156,157,579 786,993,578 1,199,591,739 662,203,992 3,804,946,889 6.59
Whatcom 629,810,232 606,256,865 607,778,181 353,887,944 2,197,733,222 3.80
Total = 25,071,833,215 6,446,528,497 23,214,683,366 3,035,745,010 57,768,790,088 100.00 % of Total= 43.40 11.16 40.19 5.25 ======= =======

12
Figure 2. The representation of total annual vehicle kilometers travelled (VKT) for highway and non-highway roads by setting, urban or rural. In this analysis, VKT is a major factor in estimating automotive-related metals loading and, as will be shown, the majority of the automotive metals loading within the Puget Sound study area occurs within King, Pierce, and Snohomish Counties.
Seasonal use The distribution of travel by month is presented in Figure 3. Within the study area, the greatest travel period occurs in July and August with 9.3% and 9.5%, respectively, of the annual total. As expected, lower travel levels occur during the winter months, with an annual low occurring in December, accounting for 6.9% of the total. While December sets an annual low to the VKT metric, it is only 2.6% lower than the August peak, indicating an underlying steady and relatively high travel base to the seasonal variation. The seasonal use pattern is important to recognize in terms of potential water quality impacts. From the seasonal VKT pattern, the greatest automotive-related metal loading occurs during the summer months. Travel during July and August accounts for about 19% of the annual total. This is a period when precipitation, and therefore storm water runoff, is at an annual low. For this reason, it is expected that these loadings accumulate on road surfaces and are only transported to receiving waters at greater levels following the onset of more sustained and intense precipitation events in the fall and winter.
0
20
40
60
80
100
Leve
l of R
epre
sent
atio
n (%
)Representation of Total VKT Annually
(Urban vs Rural)
Urban
Rural

13
Representation by vehicle type Among the vehicle types considered by this study, passenger cars are the dominant form of transportation within the Puget Sound counties, accounting for approximately 63% of all VKT in 2008 (Figure 4). Light trucks are a distant second at 26%. The total for the other vehicles considered, including combination trucks (6.0%), single unit trucks (4.8%), motorcycles (0.4%), and buses (0.2%) together account for the remaining 11%.
Figure 3. Monthly variation to annual highway-based vehicle kilometers travelled. Based on these statistics, passenger cars within the urban road system of King County alone account for approximately 26% (15 billion VKT) of the 58 billion VKT total for all vehicle travel within the study area in 2008. As will be shown, the dominance of passenger car travel within the Puget Sound basin, particularly King County, also results in it being the major source for metals loading associated with tire and brake pad wear.
6
7
8
9
10
Leve
l of R
epre
sent
atio
n (%
)
Representation of Annual Highway Kilometers Travelled by Month

14
Figure 4. The representation of the six vehicle types of the total 2008 VKT occurring within the Puget Sound counties considered by this analysis.
Automotive metals loading
Zinc loading associated with tire wear The average annual zinc load to road surfaces, associated with automotive tire wear, is estimated at 80 tonnes (t) for the Puget Sound counties considered (Table 6). (1 tonne (t) = 1000 kilograms). Approximately 44% of the zinc load (35 t) is associated with vehicle travel occurring solely within King County (Table 6, Figure 5). Together, King, Pierce, and Snohomish counties accounted for 76% (61 t) of the estimated 2008 total. A tire-based zinc yield can be calculated for each county by dividing its annual load by the total lane kilometers (highway and local roads) within its jurisdiction. (The lane kilometer metric is a measure of the linear length of road accounting for the number of lanes present.) Considering the entire study area, the overall yield is 914 grams per kilometer per year (g/km-yr). Study area yields varied from 1222 g/km-yr for King County to 77 g/km-yr for San Juan County (Figure 6). Counties with the highest loads tended to also have the highest yields, indicating a relationship between VKT and road length (refer to Appendix A). The zinc yields for Pierce, Snohomish, and Thurston Counties were similar, with an overall median of 982 g/km-yr. (The increased yield for Thurston County indicates that there is a higher level of vehicular travel relative to the lane kilometers compared to the other counties.) As a reference, an assessment in the United Kingdom found a tire-based zinc yield of 1435 g/km-yr, while in Germany highway-based yields were estimated at 810 g/km-yr (Councell et al, 2004).
0
10
20
30
40
50
60
70
Passenger Car(2 Axle, 4 Tire)
Light Trucks (2 Axle, 4 Tire)
Combination Trucks Single-Unit Trucks Motor Cycles Buses
Leve
l of R
epre
sent
atio
n (%
)
Vehicle Type
Vehicle Representation of Highway Kilometers Travelled

15
Table 6. The annual (2008) zinc loading associated with tire wear (kg) by county and road system. Annual zinc loading associated with tire wear (kg) by county and road system. County Highway Non-Highway Total (by
County) % Representation Urban Rural Urban Rural
Clallam 135.8 633.3 172.5 188.5 1130.0 1.4 Island 60.2 481.4 187.3 245.0 974.0 1.2 Jefferson 48.9 512.0 77.2 113.8 751.9 0.9 King 17164.6 2049.6 15606.5 376.4 35197.2 44.1 Kitsap 1549.1 571.3 1168.0 322.3 3610.7 4.5 Mason 34.3 741.9 92.6 346.3 1215.0 1.5 Pierce 6296.9 771.1 6196.1 295.8 13559.9 17.0 Skagit 832.4 1306.3 491.7 279.2 2909.5 3.6 San Juan 0.0 0.0 0.0 77.6 77.6 0.1 Snohomish 6373.0 1398.9 3740.0 387.4 11899.3 14.9 Thurston 1613.4 1318.5 1554.0 863.1 5349.0 6.7 Whatcom 878.9 1015.7 787.3 461.2 3143.1 3.9 Total 34987.3 10800.0 30073.2 3956.7 79817.2 100.0 % Representation 43.8 13.5 37.7 5.0 ===== =====
Figure 5. The annual zinc load (kilograms) estimated for the combined highway and non-highway road system, by county.
10
100
1000
10000
100000
Ann
ual Z
n Lo
ad (k
g/ye
ar)
Annual (2008) Tire-Related Zn LoadingHighway and Non-Highway / County

16
Figure 6. The zinc yield (g/km-yr) based on the annual load and total lane miles (highway and local), by county. Highway-based zinc loading Focusing solely on highway-based loading and considering both urban and rural settings, the zinc load in King County accounts for 41% (19 t) of that estimated for all the Puget Sound counties considered (45.8 t) (Figure 7). In comparison, both Snohomish and Pierce Counties had significantly lower load levels at approximately 7.8 t and 7.1 t, respectively. Together, the estimated loading for King, Snohomish, and Pierce counties represents about 74% (34 t) of the Puget Sound total for highway-based zinc loading. As observed, within the Puget Sound counties the vast majority of the load occurs within the urbanized setting representing 76% (35 t) of the total highway-based zinc load with the majority occurring within the King, Snohomish, and Pierce urbanized corridor which represent 65% (30 t) of the total. Non-highway-based zinc loading Zinc loading occurring on the non-highway-based (local) road system exhibited a similar pattern as observed for the highway system though at a lower level, 34 t as opposed to 46 t (Figure 8). Again, the greatest load occurs on the urbanized roads of King, Snohomish, and Pierce counties, which together represent 78% of the total load attributed to this grouping. The estimated zinc load associated with the urbanized road system of King County, in particular, was about 16 t or 47% of the annual total. The urbanized local road systems of Pierce and Snohomish Counties accounted for 19% (6.5 t) and 12% (4.1 t) respectively, of the annual total.
0
500
1000
1500
2000
2500
Ann
ual Z
n Yi
eld
(g /
km-y
r)Annual (2008) Tire-Related Zn YieldHighway and Non-Highway / County

17
Figure 7. The annual zinc load for the highway system based on county and setting. Zinc loading by vehicle type Based on vehicle type, the major source of tire-related zinc loading is passenger vehicles, representing about 50% and 53% for the total annual loading occurring on the highway and non-highway road systems, respectively (Table 7, Figures 9 and 10). As previously indicated, the majority of this loading occurs on urbanized roads. Zinc loading associated with combination trucks and light trucks comprises the next greatest sources at 24% and 19% of the highway-based load. Light trucks contribute a greater percentage of the non-highway based load at 27%, as opposed to combination trucks at 10%. Combination trucks are primarily highway-based and this is reflected in these loading rates. Together, the three most dominant tire-based zinc sources – passenger cars, light trucks, and combination trucks, for the highway and non-highway road system, comprise 92% and 90%, respectively, of the total loading. The zinc loading associated with passenger cars just on the urbanized road system of King County represents 21% (17 t) of the entire annual load associated with highway and non-highway travel throughout the study area.
10
100
1000
10000
100000
Ann
ual Z
n Lo
ad (k
g/yr
)Annual (2008) Tire-Related Zinc Loading
Highway / County / Setting

18
Figure 8. The annual zinc load for the non-highway road system by county and setting.
Table 7. The annual (2008) zinc loading associated with tire wear (kg) by county and road system. Annual zinc loading associated with tire wear (kg) by vehicle type and road system. Vehicle-Type Highway Non-Highway Total (by
Vehicle Type) % Representation Urban Rural Urban Rural
Motor Cycles 40.8 9.3 54.3 16.6 121.0 0.2 Passenger Car (2 Axle, 4 Tire) 18383.3 4189.8 15792.6 1950.8 40316.5 50.5 Light Trucks (2 Axle, 4 Tire) 7014.3 1763.5 8209.5 1098.3 18085.6 22.7 Buses 130.3 43.4 110.2 13.7 297.6 0.4 Single-Unit Trucks 2494.8 812.1 2712.4 526.0 6545.2 8.2 Combination Trucks 6923.8 3982.1 3194.3 351.2 14451.3 18.1 Total (by road system and setting) 34987.3 10800.0 30073.2 3956.7 79817.2 100.0 % Representation 43.8 13.5 37.7 5.0 ===== =====
10
100
1000
10000
100000A
nnua
l Zn
Load
(kg/
yr)
Annual (2008) Tire-Related Zinc LoadingNon-Highway / County / Setting
19
Figure 9. The annual zinc load estimated for the highway road system by vehicle type and setting.
Figure 10. The annual zinc load estimated for the non-highway (local) road system by vehicle type and setting.
1
10
100
1000
10000
100000
Ann
ual Z
n Lo
ad (k
g/yr
)Annual (2008) Tire-Related Zinc Loading
Highway / Vehicle Type / Setting
1
10
100
1000
10000
100000
Ann
ual Z
n Lo
ad (k
g/yr
)
Annual (2008) Tire-Related Zinc LoadingNon-Highway / Vehicle Type / Setting

20
Copper loading associated with brake pad wear The estimated annual copper load associated with automotive brake pad wear for the Puget Sound study area is 37 t. Approximately 45% of the load (16 t) is associated with travel solely within King County, followed by Pierce (17%, 6 t) and Snohomish (15%, 5 t). Together, the copper load in these counties accounts for 77% of the annual total (Table 8, Figure 11).
Table 8. The annual copper loading associated with brake wear (kg) by county and road system. Annual copper loading associated with brake wear (kg) by county and road system. County Highway Non-Highway Total (by
County) % Representation Urban Rural Urban Rural
Clallam 62.0 236.0 84.9 90.5 473.4 1.3 Island 27.5 179.4 92.2 117.6 416.7 1.1 Jefferson 22.3 190.8 38.0 54.7 305.8 0.8 King 7842.4 763.7 7681.8 180.8 16468.7 44.9 Kitsap 707.8 212.9 574.9 154.8 1650.3 4.5 Mason 15.7 276.5 45.6 166.3 503.9 1.4 Pierce 2877.0 287.3 3049.8 142.0 6356.2 17.3 Skagit 380.3 486.8 242.0 134.0 1243.1 3.4 San Juan 0.0 0.0 0.0 37.3 37.3 0.1 Snohomish 2911.8 521.2 1840.9 186.0 5460.0 14.9 Thurston 737.2 491.3 764.9 414.4 2407.8 6.6 Whatcom 401.6 378.5 387.5 221.5 1389.0 3.8 Total 15985.6 4024.4 14802.5 1899.8 36712.2 100.0 % Representation
43.5 11.0 40.3 5.2 ===== =====
The overall automotive copper yield for the study area is 424 g/km-yr though it varied from 588 g/km-yr for King County to 39 g/km-yr for San Juan County (Figure 12). Of the total estimated load, approximately 55% (20 t) is associated with highway-based travel, 80% of which occurs within the urban road network (Figure 13). As discussed earlier, some level of tire wear occurs once the vehicle is in motion. However, brake-pad wear only occurs on actuation of the brake mechanism. For this reason, it is expected that the copper loading associated with brake-pad wear occurs more prominently in urban settings where, due to higher traffic volumes (highway) and management measures (traffic lights, stop signs) higher brake use and, therefore, wear occurs. Therefore, a conservative estimate of the brake pad copper load can be determined by assuming that it occurs solely in the urbanized setting of the highway and non-highway roadways.

21
Figure 11. Annual Copper loading associated with brake wear for the highway and non-highway road system by county.
Figure 12. The copper yield (g/km-yr) based on the annual load and total lane kilometers, by county.
10
100
1000
10000
100000
Ann
ual C
oppe
r Loa
d (k
ilogr
ams)
Annual (2008) Brake-Related Cu LoadingHighway and Non-Highway / County
10
100
1000
Ann
ual C
oppe
r Yie
ld (g
Cu/
km-y
r)
Annual (2008) Brake-Related Cu YieldHighway and Non-Highway / County

22
Figure 13. Annual copper loading associated with brake wear for the highway system, by county and setting. Highway-based copper loading
Focusing just on the urbanized highway setting, the highest level of loading occurs in King County at 7.8 t, representing 49% of the total (Figure 13). In comparison, the estimated copper load for Snohomish and Pierce counties is approximately 3 t each. Together, the copper loading associated with brake pads (drums) within these counties comprises 85% of the annual load estimated for the urban highway designation.
Non-highway-based copper loading A similar loading pattern is present for the non-highway road system. The majority of the copper loading occurs in King County, 47% of the 17 t, followed by Pierce (19%) and Snohomish (12%), with the majority of the load in each of these counties occurring in the urban setting. Copper loading by vehicle type Passenger cars provide the majority of the copper load, representing 65% (24 t) of the total highway-based and non-highway-based annual loads (Table 9, Figure 14), followed by light trucks at 29% (11 t). In both cases, loading occurs primarily in the urban setting, representing about 85% of the annual total. The representation of the copper load attributed to the other vehicle types is significantly lower, either due to lower copper levels in drum-brakes (combination trucks, buses, single-unit trucks) or a low VKT presence (motorcycle). Copper
1
10
100
1000
10000
Ann
ual C
oppe
r Loa
d (k
ilogr
am/y
ear)
Annual (2008) Brake-Related Cu LoadingHighway / County / Setting

23
loading associated with passenger cars within urban King County (highway and non-highway roads) is estimated at 10 t or 27% of the study area total.
Table 9. The annual copper loading associated with brake wear (kg) by vehicle type and road system. Annual copper loading associated with brake wear (kg) by vehicle type and road system. Vehicle Type Highway Non-Highway Total (by
Vehicle Type)
% Representation Urban Rural Urban Rural
Motor Cycles 10.7 2.4 14.3 4.4 31.8 0.1 Passenger Car (2 Axle, 4 Tire)
10802.2 2461.9 9279.9 1146.3 23690.3 64.5
Light Trucks (2 Axle, 4 Tire)
4121.7 1036.2 4824.0 645.4 10627.2 28.9
Buses 13.8 4.6 11.7 1.5 31.6 0.1 Single-Unit Trucks
310.3 101.0 337.4 65.4 814.1 2.2
Combination Trucks
726.9 418.1 335.4 36.9 1517.2 4.1
Total (by road system and setting)
15985.6 4024.3 14802.5 1899.8 36712.2 =====
% Representation
43.5 11.0 40.3 5.2 ===== =====
Figure 14. Annual copper loading associated with brake wear for the highway system, by vehicle type and setting.
0.1
1
10
100
1000
10000
100000
Ann
ual C
oppe
r Loa
d (k
ilogr
ams)
Annual (2008) Brake-Related Cu LoadingHighway / Vehicle Type / Setting

24
Figure 15. Annual copper loading associated with brake wear for the non-highway road system, by county and setting.
Figure 16. Annual copper loading associated with brake wear for the non-highway road system, by vehicle type and setting.
0.1
1.0
10.0
100.0
1000.0
10000.0
100000.0
Ann
ual C
oppe
r Loa
d (k
ilogr
am/y
ear)
Annual (2008) Brake-Related Cu LoadingNon-Highway / Vehicle Type / Setting
10
100
1000
10000
Ann
ual C
oppe
r Loa
d (k
ilogr
ams)
Annual (2008) Brake-Related Cu LoadingNon-Highway / County / Setting

25
Conclusions The conclusions of this analysis are summarized by the vehicle kilometers travelled metric because of its importance in defining loading characteristics, followed by tire-related zinc and brake pad-related copper loading.
Vehicle kilometers travelled • 2008 vehicle kilometers travelled (VKT) were estimated at 58 billion kilometers for the
Puget Sound study area: 55% occurred on highway and 45% on local roads.
• 77% of the annual VKT occurred in three counties: King (45%), Pierce (17%), and Snohomish (15%).
• Within these counties, 93% of the VKT occurred in urbanized roadways, representing 71% of all VKT throughout the study area.
• Passenger cars are the dominant form of travel, accounting for 63% of all VKT.
• Passenger car travel within King County alone represents 26% of the study area total.
Tire-related zinc loading • The annual (2008) zinc load to road surfaces within the study area is estimated at 80 t.
• The majority of the annual load occurred in King County (44% or 35 t), followed by Pierce (17%) and Snohomish (15%).
• The zinc yield (based on lane miles) for the study is 914 g/km-yr though ranged from 1222 g/km-yr for King County to 77 g/km-yr for San Juan County.
• As with the VKT, the majority of the load occurred on urban-based roadways. Urban (highway and local road) travel in King, Pierce, and Snohomish Counties together accounted for 70% (55 t) of the annual study area total. The majority of this load, approximately 41% or 33 t, occurred in urbanized roadways within King County.
• The major source of tire-related zinc loading is passenger vehicles, representing about 49% and 52% of the total annual loading occurring in the highway and non-highway (local) road systems, respectively.
• Passenger vehicles in the urbanized road system (highway and local) of King County contribute 22% to the entire zinc load estimated for the study area.
Brake pad-related copper loading • The estimated annual (2008) copper load to road surfaces within the study area is 37 t.
• The majority of the annual load occurred in King County (45% or 16 t), followed by Pierce (17%, 6 t) and Snohomish (15%, 5 t) together accounting for 77% of the total.

26
• The copper yield (based on lane miles) for the study was 425 g/km-yr, though it ranged from 589 g/km-yr for King County to 40 g/km-yr for San Juan County.
• As with the VKT, the majority of the load occurred on urban-based roadways. Loading occurred on urban-situated highway and local roads in King, Pierce, and Snohomish Counties together accounted for 71% (26 t) of the annual study area total. The majority of this load, approximately 42% or 15 t, occurred in urbanized roadways situated within King County.
• The major sources of brake pad-related copper loading are passenger cars followed by light trucks representing about 65% and 29%, respectively of the estimated total annual copper load.
• Passenger cars within urbanized King County contribute approximately 10 t or 27% of the total estimated for the study area.

27
References Armstrong, Louis J. 1994. Contribution of Heavy Metals to Storm Water from Automotive Disc Brake Pad Wear. Woodward-Clyde Consultants, prepared for Santa Clara Valley Nonpoint Source Pollution Control Program.
Councell, Terry, Kea Duckenfield, Edward Landa, Edward Callender. 2004. Tire Wear Particles as a Source of Zinc to the Environment. Environmental Science and Technology, Volume 38, Number 15.
EMEP / CORINAIR Emission Inventory Guidebook – 2006. 2006. European Environment Agency. Technical Report No. 11/2006.
Environment Canada. Environmental Implications of the Automobile (SOE Fact Sheet No. 93-1).
Garg, Bhadwan, Steven Cadle, Patricia Mulawa, Peter Groblicki. 2000. Brake Wear Particulate Matter Emissions. Environmental Science & Technology. Vol. 34, No. 21.
Hjortenkrans, David S., Bo Bergback, Agneta Haggerud. 2007. Metal Emissions from Brake Linings and Tires: Case Studies of Stockholm, Sweden 1995/1998 and 2005. Environmental Science and Technology. Vol. 41., No. 15.
Hulskotte, J. H. J., M. Schaap, A. J. H. Visschedijk. 2006. Brake Wear from Vehicles as an Important Source of Diffuse Copper Pollution. International Water Association, 10th Int. Specialized Conference on Diffuse Pollution and Sustainable Basin Management.
Lough, Glynis; James Schauer; June Park, Martin Shafer, Jeffrey Deminter, Jason Weinstein. 2005. Emissions of Metals Associated with Motor Vehicle Roadways. Environmental Science and Technology. Vol. 39, No. 3.
Rosselot, Kirsten Sinclair. January 2006. Copper Released from Brake Lining Wear in the San Francisco Bay Area. Process Profiles, prepared for the Brake Pad Partnership.
Sanders, Paul G; Ning Xu; Tom Dalka; M. Maricq. 2003. Airborne Brake Wear Debris: Size Distributions, Composition, and a Comparison of Dynamometer and Vehicle Tests. Environmental Science and Technology. Vol. 37, No. 18.
Shaheen, Donald G. 1975. Contributions of Urban Roadway Usage to Water Pollution. United States Environmental Protection Agency, Office of Research and Development.
Uexkull, Ole von, Staffan Skerfving, Reed Doyle, Michael Braungart. 2005. Antimony in Brake Pads – a Carcinogenic Component? Journal of Cleaner Production. Vol. 13.
Westerlund, K. G. 2001. Metal Emissions from Stockholm Traffic – Wear of Brake Linings. Stockholm Air Quality and Noise Analysis, prepared for Stockholm Environmental and Health Protection Administration and Swedish Environmental Protection Agency.

28
This page is purposely left blank.

29
Appendix A: Additional Discussion, Figures and Tables
Table A-1. Automotive brake and tire constituent levels (EMEP, 2006). Material Tire Composition (mg/kg)
Brake Composition (mg/kg)
Average Min Max Average Min Max Aluminum (Al) 324 81 470 2050 330 3770 Arsenic (As) 1 ==== ==== 10 ==== ==== Barium (Ba) 125 1 370 38520 2640 74400 Bromine (Br) 20 ==== ==== 40 ==== ==== Calcium (Ca) 892 113 2000 7700 1100 14300 Cadmium (Cd) 3 0 5 13 2.7 29.9 Chlorine (Cl) 250 ==== ==== 1500 ==== ==== Chloride (Cl-) 600 ==== ==== 1500 ==== ==== Cobalt (Co) 13 1 25 6 ==== ==== Chromium (Cr) 12 0 30 669 115 1200 Copper (Cu) 174 2 490 51112 370 142000 Ele. Carbon (EC) 153000 ==== ==== 26100 ==== ==== Iron (Fe) 1712 2 4600 209667 115000 399000 Potassium (K) 280 180 380 524 190 857 Lithium (Li) 1 0 2 56 ==== ==== Magnesium (Mg+2) 166 32 360 44570 6140 83000 Manganese (Mn) 51 2 100 2460 1700 3220 Molybdenum (Mo) 3 ==== ==== 10000 ==== ==== Sodium (Na+) 645 610 680 7740 80 15400 Ammonium (NH4+) 190 ==== ==== 30 ==== ==== Nickel (Ni) 34 1 50 463 133 850 Nitrate (NO3-) 1500 ==== ==== 1600 ==== ==== Organic Carbon (OC) 360000 ==== ==== 107000 ==== ==== Phosphorus (P) ==== ==== ==== ==== ==== ==== Lead (Pb) 107 1 160 3126 50 6594 Rubidium (Rb) ==== ==== ==== 50 ==== ==== Sulfur (S) 1100 ==== ==== 12800 ==== ==== Antimony (Sb) 2 ==== ==== 10000 ==== ==== Selenium (Se) 20 ==== ==== 20 ==== ==== Silicon (Si) 1800 ==== ==== 67900 ==== ==== Sulfate (SO4-) 2500 ==== ==== 33400 ==== ==== Tin (Sn) ==== ==== ==== 7000 ==== ==== Strontium (Sr) 14 0 40 520 81.4 740 Titanium (Ti) 378 ==== ==== 3600 ==== ==== Vanadium (V) 1 ==== ==== 660 ==== ==== Zinc (Zn) 7434 430 13494 8676 270 21800
(The mg/kg ratio is an expression of parts per million. To express the concentration as a percent, or parts per 100, divide by 10,000. For instance, the assumed average concentration of zinc in tires is 10,000 mg/kg representing about 1% of the composition.)
Check on tire wear rate As a check on the tire wear rate, assume that the average passenger car tire is represented by that on the most popular car in 2008, the Toyota Camry. That tire is described by the following characteristics inscribed on its sidewall: P215/60/R16. The “P” indicates that it is a passenger car tire. The “215” denotes the nominal section width in millimeters. The nominal section width is a measure that is close to the tread width so it can be assumed that the tread width for this tire
30
is approximately 215 millimeters (mm) or 21.5 centimeters (cm). Assuming that the tread occupied 90% of the width then the effective width, the portion of the tire in contact with the roadway, is 19.4 cm. The wheel diameter (“R”) is 16 inches or approximately 40.6 centimeters. The “40” in the tire numerical description refers to the aspect ratio, which is the sidewall height, expressed as a percentage of the nominal section width (approximately the tread width). Therefore, the sidewall height is approximately 60% of the nominal section width (21.5 *0.6) or 12.9 cm. The entire wheel diameter is then 66.4 cm with a radius of 33.2 cm, resulting in a circumference of 208.6 cm. The typical tire has a thread depth of 10/32nd of an inch or 0.79 cm, and is considered completely worn when it has a tread depth of 2/32nd of an inch or 0.16 cm. Therefore, the tread loss from new to obsolete is 0.63 cm. The entire volume of tire loss is then (19.4 cm * 208.6 cm* 0.63 cm) or 2550 cm3. The density of tread is approximately 1180 mg/cm3. When the density is multiplied by the volume of rubber loss, the result is 3,009,000 mg (3.0 kg) of material loss over the life of a passenger car tire. Assuming that the average tire lasts 50,000 miles (approximately 80,000 kilometers), the wear rate is determined by dividing the weight of the material lost (3,009,000 mg) by the kilometers travelled (80,000 km), resulting in 38 milligrams of tire loss per kilometer travelled (kg/km).
Assessment of VKT accuracy based on vehicle type As previously discussed, this analysis divided the annual VKT data among six general vehicle groups. This was accomplished through application of WSDOT data indicating the representation of these vehicle categories among highway traffic. While the representation was determined for highway traffic, it was assumed that the same vehicular representation also applied to the non-highway road system. The end result was to construct the monthly VKT, by vehicle type, occurring within each of the Puget Sound counties examined. It is difficult to provide a check on these numbers, though perhaps the most accurate measure of VKT, for a specific vehicle type, are those reported by the various public transit systems present within the study area. In most of the Puget Sound counties examined (except San Juan), there is at least one community transit system. All are required to report vehicle miles travelled, among other measures, to the Federal Highway Administration. These reported annual VKT figures were compiled for the various public transportation systems and compared with those estimated by this study (Table A2, www.wsdot.wa.gov/Publications/Manuals/PTSummary.htm). This comparison, while applying to the estimate of bus-related travel in particular, also provides a check on the overall approach in estimating VKT based on vehicular representation. Table A2 includes this study’s annual estimate of bus-related travel by county, along with the name of the primary transit authority present within each county and reported (estimated for 2008) VKT. As an indicator of the accuracy of the study’s estimate, a ratio was determined between the estimated study VKT and those reported by the associated county transit authority. As observed, the range of these ratios extended from 0.76 (study value underestimated reported value by 24%) for transit service within Snohomish County to 4.27 for Skagit County. In general, a higher level of accuracy occurred for counties with higher bus-related travel. The majority of the bus travel occurs in King County (44% of annual total for bus VKT), Pierce (17%), and Snohomish (15%).

31
Together, bus travel occurring in these counties accounts for 76% of the annual bus-related VKT total for the study area. Ratios for King, Pierce, and Snohomish were 0.79, 1.00, and 0.76, respectively. Considering the overall total for all bus travel within the study area, a ratio of 0.95 was determined, indicating a relatively close overall estimate between the study and reported values.
Table A-2. The relationship between the study estimate and reported VKT for bus-related travel in 2008, by county and transit authority.
County Estimated 2008 Bus Total
Percent of Total
Reporting Transit Authority
2008 Reported VKT
Ratio Study Estimate: Reported
Clallam 1,920,207 1.48 Clallam Transit System 1,876,094 1.02
Island 1,639,536 1.26 Island Transit 1,828,786 0.90
Jefferson 1,293,832 1.00 Jefferson Transit Authority 627,673 2.06
King 56,637,100 43.68 King County Metro Transit 71,786,832 0.79
Kitsap 5,891,950 4.54 Kitsap Transit 3,967,794 1.48
Mason 2,077,026 1.60 Mason County Transportation Authority
885,047 2.34
Pierce 21,792,537 16.81 Pierce Transit 21,700,836 1.00
Skagit 4,904,411 3.78 Skagit Transit 1,149,521 4.27
San Juan 119,140 0.09 ========================= === ===
Snohomish 19,390,464 14.95 Community Transit Everett Transit
25,606,439 0.76
Thurston 8,794,215 6.78 Intercity Transit 4,449,688 1.98
Whatcom 5,213,930 4.02 Whatcom Transportation Authority
3,327,412 1.57
Total 129,674,348 100.00 ======================== 137,206,120
0.95
Lane kilometers and vehicle kilometers travelled Figure A1 includes the relationship between study area county highway and local road development levels, indicated by total lane kilometers, and vehicle kilometers travelled. (The lane kilometer metric is a measure of the linear length of road accounting for the number of lanes present.) As observed, the polynomial regression relationship indicates a close relationship between the level of road development and the amount of vehicle kilometers travelled for both types of road systems. As expected, the relationship for the highway network displays a steeper slope in comparison to local roads, indicating a greater level of automotive use per length of road.

32
These variables are not independent. For instance, an increase in lane kilometers may occur due to increased traffic levels (as indicated by VKT) or alternatively, increased lane kilometers may result in an increase in VKT. Regardless, the close relationship between these variables indicates that there is ultimately a balance that is achieved between the two.
Figure A-1. The relationship between lane kilometers and vehicle kilometers travelled for county highway and local roads.
y = 7E-08x2 + 0.0005xR² = 0.97
y = 3E-08x2 + 7E-05xR² = 0.98
0
2
4
6
8
10
12
14
0 5000 10000 15000 20000 25000
Vehi
cle
Kilo
met
ers T
rave
lled
(km
x 1
09 )
Lane Kilometers (by County)
Lane Kilometers vs VKT
Highway
Local