Coping with Global market commodity Price Fluctuations...
14
Ts.Gerelchimeg National Consultant, Revenue division Ministry of Finance Coping with Global market commodity Price Fluctuations: Impact on Fiscal and Debt Management in case of Mongolia World Bank’s Annual Stakeholders Forum of the Debt Management Facility Manila, Philippines June 3-4, 2015
Transcript of Coping with Global market commodity Price Fluctuations...

Ts.Gerelchimeg
National Consultant, Revenue division
Ministry of Finance
Coping with Global market commodity Price
Fluctuations: Impact on Fiscal and Debt
Management in case of Mongolia
World Bank’s Annual Stakeholders Forum of the Debt Management Facility
Manila, Philippines
June 3-4, 2015

Contents
1. Country Profile
2. Role of commodity on economy
3. Effect of commodity prices on the fiscal
4. Fiscal policy and improvement on legal environment
5. Medium term policy for Debt sustainability
2

1. Country Profile
3
Geography
• Area: 1,564,116 sq. km
• Capital City: Ulaanbaatar
• Geographic Areas: Gobi, Steppes, Mountains
Population and Culture
• Population: 3 million
• Language(s): Mongolian (90%), Kazakh, Russian
• Religion(s): Buddhist Lamaism, Muslim, Shaman, Christian
• Nomadic Culture
Economics
• Currency: Tugrug (MNT), US$1=1900
• Major Industry: Mining – Copper, coal and gold, Cashmere, agriculture
• Major Trading partners: China, Russia, USA, Japan.
• GDP per capita: ~3600 USD
1. Country Profile

Phase 2: Mining
boom
4
Billion MNT
Mongolia has transitioned into free market
economy in 1990. The transition period from
1990-2008 had experienced steady growth
averaging about 3% in real terms.
With the discovery of two major copper and
coal deposits (Oyu Tolgoi and Tavan Tolgoi),
Mongolia has experienced a very rapid GDP
growth during the Mining Boom, the average
real GDP growth is 10%. While the highest
growth was 17% in 2011.
2. Role of commodity on economy
0
5
10
15
20
25
30
2011 2012 2013 2014
Real GDP growth (in percent)
Mining Non-mining
GDP
0
5
10
15
20
25
1990 1991 1992 1993 1994 1995 1996 1997 1998 1999 2000 2001 2002 2003 2004 2005 2006 2007 2008 2009 2010 2011 2012 2013 2014
Tax revenue Nominal GDP
Phase 1: Transition period
Tax revenue and Nominal GDP
Phase 2: Mining
boom
0.
1000.
2000.
3000.
4000.
5000.
6000.
7000.
8000.
1990 1991 1992 1993 1994 1995 1996 1997 1998 1999 2000 2001 2002 2003 2004 2005 2006 2007 2008 2009 2010 2011
p)
2012 2013
Million
USD
Foreign investment Domestic investment
Phase 1: Transition period
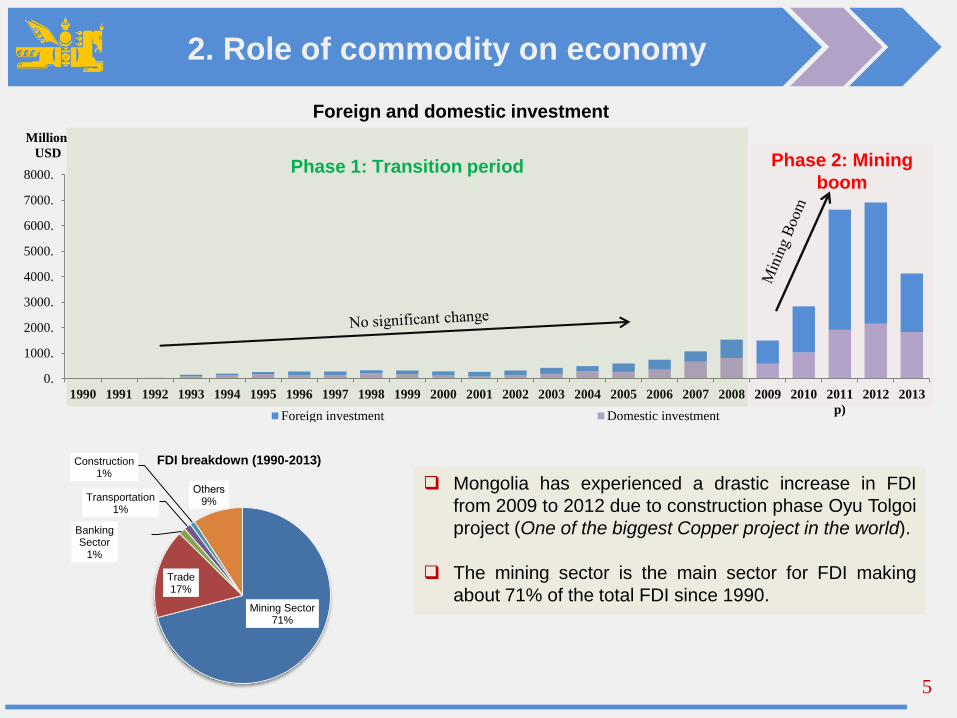
Mongolia has experienced a drastic increase in FDI
from 2009 to 2012 due to construction phase Oyu Tolgoi
project (One of the biggest Copper project in the world).
The mining sector is the main sector for FDI making
about 71% of the total FDI since 1990.
5
Mining Sector71%
Trade17%
Banking Sector
1%
Transportation1%
Construction1%
Оthers9%
FDI breakdown (1990-2013)
2. Role of commodity on economy
Foreign and domestic investment

6
2. Economy, FDI and Tax system
Mining has become the biggest sector in Mongolia, accounting for 20 percent of GDP, 60
percent of industrial value added, and ~90 percent of export earnings.
Major export-related minerals include copper, molybdenum, gold, coal, and fluorspar
concentrates. The country also produces limited amounts of tungsten, salt, clay, lime and
aggregates.
60%66%
81%
89% 89% 82%
83%
0
1000
2000
3000
4000
5000
6000
7000
2008 2009 2010 2011 2012 2013 2014*
Million USD
Mongolia export structure
Total export Mining product export
2. Role of commodity on economy
-
50
100
150
200
250
300
350
-4,000.0
-2,000.0
-
2,000.0
4,000.0
6,000.0
8,000.0
10,000.0
2008 2009 2010 2011 2012 2013 2014*
$/tMillion USD /
$/t
Foreign trade
Import Export Trade balance
Copper price, $/t Coal price, $/t

7
VAT
30.0%
Excise Tax
7.3%
Customs
7.6%
Mining
Royalty
11.8%
CIT
12.7%
PIT
8.1%
Capital tax
0.5%
Other
22.0%
Tax revenue breakdown
by taxes (as of 2014)
31%21%
28%29%
18% 18%14%
-
500.0
1,000.0
1,500.0
2,000.0
2,500.0
3,000.0
3,500.0
4,000.0
4,500.0
2008 2009 2010 2011 2012 2013 2014*
thousand USD Mining sector revenue share
Mining sector revenue Fiscal revenue
Revenue from mining sector consists of Mining
royalties, CIT, VAT, PIT, air pollution and customs
fee.
At its peak, revenue from mining sector made about
30% of the total revenue, but since 2011 with the
decline of commodity prices it has been steadily
decreasing.
Mining companies make about 20% of the corporate
income tax revenue.
3. Fiscal policy and commodity price effect

8
Main commodities for export are coal and copper concentrates.
Copper and coal generates ~20% of total fiscal revenue, setting the trend for revenue growth.
16%22%
17% 14%
26%21%
14%
78%58%
61%
47%
49%53%
60%
5%
20% 22%
39%
25% 27% 26%
2008 2009 2010 2011 2012 2013 2014*
Mining revenue share by commodities
Other Copper Coal
3. Fiscal policy and commodity price effect
31.2%
17.5%12.1%
23.7%16.4%
7.3% 7.0%
7.3%
9.8% 30.3%
47.2% 43.4%
26.3%
14.7%
30.7%
41.2%41.7%
33.0%
26.6%
26.5%
20.1%19.1%
22.2% 44.6%
0%
10%
20%
30%
40%
50%
60%
70%
80%
2005 2006 2007 2008 2009 2010 2011 2012 2013 2014
Share of main commodity export in total export
Copper concentrate Coal Gold, unwrought or in semi-manufactured forms

Total revenue rises in response to increases in commodity export prices.
Total revenue changes are closely correlated with the copper commodity prices (0.78), and
therefore its safe to say that Mongolian economy is copper driven economy.
9
3. Fiscal policy and commodity price effect
-60%
-40%
-20%
0%
20%
40%
60%
80%
100%
120%
140%
160%
2004 2005 2006 2007 2008 2009 2010 2011 2012 2013
Growth rates of commodity export prices and fiscal revenue
Copper price growth Coal price growth Revenue growth

Central Bank
Firms
Government
Financial SectorHousehold
External Sector
₮
Tax
RevenueC
apital
exp
en
ditu
re
Exp
ort Im
po
rt
Imp
ort
Cu
rre
nt
exp
en
ditu
re
We
lfa
re
₮
$
Commodity price
1990-2009 2010-2011 2012-2014
Commodity price
FD
I

1. Fiscal Stability Law (FSL), which was enacted in 2010.
Structural revenue rule
Expenditure rule
Deficit ceiling rule
Debt ceiling rule
2. Debt Management Law, Government debt management strategy
Debt management law was approved by Parliament in this year.
11
4. Fiscal policy and improvement on legal
environment

In the medium-term government debt will be stabilized and its ratio to GDP
will be reduced.
12
5. Medium term policy for Debt
sustainability
44% 43.5%
48%
58%
55%
50%
40%
30%
35%
40%
45%
50%
55%
60%
2012 2013 2014 2015* 2016* 2017* 2018*
Government debt ratio to GDP

The Government of Mongolia shall pursue the following policy objectives within
the Medium-Term Government Debt Management Strategy for 2016-2018 and
shall align all borrowing decisions with the set policy objectives:
Level off government debt services in long-term, gradually reduce a ratio of
debt services to total budget revenues, and lengthen the average maturity
of the government debt portfolio through new borrowing with longer term
maturity in 2016-2018;
Improve Mongolia’s sovereign rating, actively engage with investors, gain
their confidence, raise the profile of Mongolia, reduce foreign debt services
and develop a yield curve of the domestic government debt securities;
Create optimal government debt portfolio by appropriately planning and
implementing comprehensive debt management actions in medium term.
13
5. Medium term policy for Debt
sustainability

Questions and Answers
14
THANK YOU FOR
YOUR KIND
ATTENTION