Coping with Drought and Food Insecurity in Ethiopia
15
Coping with Drought and Food Insecurity in Ethiopia PATRICK WEBB In this article I examine the impact of drought on farm households in Ethiopia and their response to crisis conditions. I ask whether every household in a community is equally affected by drought and what households do to mitigate the effects of drought and associated food insecurity. Znformation on production, income and food consumption is disaggregated by agroecological zone (highland and lowland), and by socioeconomic strata (relatively wealthy versus poor). Such detailed analysis permits an improved understanding of why the poor are much more vulnerable than the wealthy to drought and associated famines and why they need to be more effectively targeted by relief and development interventions. In a world of limited public resources for crisis intervention, such understanding is crucial to the design of improved policies and projects for reaching people most at risk. It has been claimed that ‘drought and famine affect mostly poor peasants and landless labourers, not the wealthy and propertied sectors of society’, (Kebbede and Jacob, 1988, p. 68; ICIHI, 1985; Devereux, 1988; Hamson, 1988; Herren, 1991). The assumption is made that wealthy house- holds have the resources to mitigate the worst effects of drought and to survive, largely unscathed, through drought-related famines. Yet there are few studies con- firming differential drought impact and household response according to wealth status (Swinton, 1990; Kennedy, 1992; Webb and Reardon, 1992). Cutler (1985, p. 94) has pointed out that ‘research into human response to drought should be an urgent undertaking. For Ethiopia, in par- ticular, we need to know why some popu- lations are more vulnerable than others’. Similarly, Campbell (1990, p. 144) argues that ‘while most studies have described the responses of particular societies to specific crises, they have not analyzed differences within and between groups in ability to cope’. In this article I seek to fill some of these information gaps by examining the dif- ferential impact of drought on farm house- holds in an environment in which everyone is poor in absolute terms. Drawing on detailed survey data from Ethiopia, I con- sider the effects of drought on richer and poorer households, as defined by their net annual income. The key questions are whether every household in a community is equally affected by drought and what households do to mitigate the effects of drought and associated food insecurity. Given finite public resources for crisis intervention, answers to these questions are crucial to the effective design of future poli- cies and projects for reaching people most at risk. Only with such a disaggregated 0 Basil Blackwell Ltd. 1993, 108 Cowley Road, Oxford OX4 IJF, UK and 238 Main Street, Cambridge, MA 02142, USA. DISASTERS VOLUME 17 NUMBER 1
-
Upload
patrick-webb -
Category
Documents
-
view
214 -
download
0
Transcript of Coping with Drought and Food Insecurity in Ethiopia

Coping with Drought and Food Insecurity in Ethiopia
PATRICK WEBB
In this article I examine the impact of drought on farm households in Ethiopia and their response to crisis conditions. I ask whether every household in a community is equally affected by drought and what households do to mitigate the effects of drought and associated food insecurity. Znformation on production, income and food consumption is disaggregated by agroecological zone (highland and lowland), and by socioeconomic strata (relatively wealthy versus poor). Such detailed analysis permits an improved understanding of why the poor are much more vulnerable than the wealthy to drought and associated famines and why they need to be more effectively targeted by relief and development interventions. In a world of limited public resources for crisis intervention, such understanding is crucial to the design of improved policies and projects for reaching people most at risk.
It has been claimed that ‘drought and famine affect mostly poor peasants and landless labourers, not the wealthy and propertied sectors of society’, (Kebbede and Jacob, 1988, p. 68; ICIHI, 1985; Devereux, 1988; Hamson, 1988; Herren, 1991). The assumption is made that wealthy house- holds have the resources to mitigate the worst effects of drought and to survive, largely unscathed, through drought-related famines. Yet there are few studies con- firming differential drought impact and household response according to wealth status (Swinton, 1990; Kennedy, 1992; Webb and Reardon, 1992). Cutler (1985, p. 94) has pointed out that ‘research into human response to drought should be an urgent undertaking. For Ethiopia, in par- ticular, we need to know why some popu- lations are more vulnerable than others’. Similarly, Campbell (1990, p. 144) argues that ‘while most studies have described the
responses of particular societies to specific crises, they have not analyzed differences within and between groups in ability to cope’.
In this article I seek to fill some of these information gaps by examining the dif- ferential impact of drought on farm house- holds in an environment in which everyone is poor in absolute terms. Drawing on detailed survey data from Ethiopia, I con- sider the effects of drought on richer and poorer households, as defined by their net annual income. The key questions are whether every household in a community is equally affected by drought and what households do to mitigate the effects of drought and associated food insecurity.
Given finite public resources for crisis intervention, answers to these questions are crucial to the effective design of future poli- cies and projects for reaching people most at risk. Only with such a disaggregated
0 Basil Blackwell Ltd. 1993, 108 Cowley Road, Oxford OX4 IJF, UK and 238 Main Street, Cambridge, MA 02142, USA.
DISASTERS VOLUME 17 NUMBER 1
34 Patrick Webb
analysis can the key characteristics of household food insecurity be established, and improved targeting of relief interven- tions be achieved.
STUDY AREAS AND RESEARCH DESIGN
The research was organized by the Inter- national Food Policy Research Institute in collaboration with Ethiopia’s former Ministry of Central Planning (now the Ministry of Planning and Economic Development) and with the International Livestock Centre for Africa.’ A survey of 550 households was conducted during 1989 and 1990, the first relatively good harvest year after five years of drought and extensive food deprivation. The households represented a stratified ran- dom sample drawn across seven villages: four in the semi-arid lowlands (below 1500 metres) and three in the more temperate, but still drought-prone, highlandsa2 Mul- tiple visits (up to 7 per household over a three-month period at each site) permitted the collection of data on production, assets, income sources, expenditure and consump- tion patterns, as well as information on experiences during the most recent famine.
No claims are made that the surveyed localities are statistically representative of the country as a whole. Many conditions were found to be the same, however, at all seven survey sites: proneness to climate- driven production fluctuations, a lack of employment opportunities, iimited house- hold asset base, isolation from major markets, low level of farm technology, con- straints to improvements in human capital and poor health and sanitation environ- ments. It is the way different households cope with these constraints that largely determines the degree of their food insecurity and vulnerability to famine.
Drought is only one element contribut- ing to household food insecurity and vul- nerability to famine. Chronic food insecurity in Ethiopia is the result of a complex inter- action between supply, distribution and
demand factors; no single element can be invoked to explain the causation and evolution of food crises. The focus here on drought, and its impact on productivity, does not imply a supply-side bias in the discussion of household vulnerability. The research aimed at understanding the under- lying conditions that result in greater suffering for some regions and households than others when faced with destabilizing events. The disruptive role of armed conflict on relief and development efforts in the north cannot be over-emphasized but, while the long-term drain on human and economic resources associated with war was felt in the study regions, military action never played a direct part in the famine experiences of the sample households. Environmental and policy-related factors were of more immediate importance.
DROUGHT IMPACT O N PRODUCTION
Droughts are common in Ethiopia. Although there has been only a small decline in the overall rainfall trend during the past 25 years, fluctuations around the mean be- tween years and between regions have been large. In 1984, for example, rainfall was 22 per cent below the long-term mean at a national level and most regions suffered. Such a shortfall is significant. A simple rainfall-crop output model based on 27 years of data indicates a relatively sturdy relationship between changes in total rain- fall and changes in production: a 10 per cent decline in rainfall (below long-term average) results in a 4.4 per cent fall in national pro- duction, representing a reduction in food production of about 300,000 tons in that year (Webb, von Braun and Yohannes, 1992). Yet, in other years, droughts affect only parts of the country. The worst drought to hit Wollo since 1961 occurred in 1984. Sidamo had a record drought in 1980, while Gondar’s worst experience was in 1966 (Webb, von Braun and Yohannes, 1992).
DISASTERS VOLUME 17 NUMBER 1 0 Basil Blackwell Ltd. 1993

Coping w i th Drought and Food Insecurity in Ethiopia 35
It is not just the severity of an individual drought that matters in relation to food in- security. While single year deficits are important, the cumulative effect of repeated droughts has more significance (Hay, 1988; de Waal, 1988). Household vulnerability increases through the progressive depletion of food stocks and capital assets as a result of repeated harvest failures. The worst of the recent famines represented the culmina- tion of at least two years of poor rainfall. Figure 1 shows that in Wollo and Hararghe provinces the 1972-1974 famine was preceded by three consecutive years of below-average (and declining) rainfall. Similar, if shorter, drought sequences preceded the national food crises of 1979/80 and 1984185.
At the survey locations, 75 per cent of respondents laid the blame for famine squarely on adverse climatic conditions (the other 25 per cent cited a mixture of declin- ing soil fertility and increasingly difficult
economic conditions). At the highland sur- vey sites, the worst drought year (1984/85) caused annual rainfall to drop from an average of 1,250 mm to 740 mm, while at the lowland sites it fell from 613 mm to only 440 mm.3 Below-average rainfall in the previous three years had already depleted food, seed and capital reserves.
The droughts affected a farming system characterized by low productivity even in good years (Harbeson, 1990; Brune, 1990; Belete et al., 1991). Mean farm size is only 0.15 ha per capita at the survey sites and 0.12 at a national level (Webb, von Braun and Yohannes, 1992). Such small farms result from a high population concentration in the central and northern highlands, coupled with policy restrictions on farm size in force since the 1975 land reforms. Because of land redistribution in the 1970s, relatively wealthier households in the sample (the top third of households in the sample with average annual incomes of US$lOO per
1300
1200
1100
1000
900 a
2 5
3 800
700
600
500
400
300
200 , , , , I , 1 1 , , 1 , 1 I , , , , , , , , I , , #
61 63 65 67 69 71 73 75 77 79 81 83 85 87
YEAR
+ WOLLO + HARARGHE
Source: National Meteorological Services Agency.
FIGURE 1 Mean annual rainfall from 1961 to 1988 for Wollo and Hararghe regions
0 Basil Blackwell Ltd.. 1993 DISASTERS VOLUME 17 NUMBER 1
Patrick Webb 36
capita) did not farm substantially more land than relatively poorer households (the bottom third of sample households, with an annual income of only US$42 per ~ a p i t a ) . ~ Former land-owning households in the sample (those that received rents from tenants before 1974), had access to roughly the same area as former tenant or landless households: 0.14 ha and 0.16 ha, respectively.
In other areas of the farm economy, however, wealthier households gain the advantage. Access to labor (animal and manual), capital and improved inputs was limited everywhere, but the wealthier had greater access than the poor. In the high- lands, where thick vertisols (black volcanic soils) predominate, access to plough oxen is one of the prerequisites of a successful harvest. In 1989, fewer than 13 per cent of the sample households owned a pair of oxen (required to pull a traditional plough), while 79 per cent did not own any at all. Of those that did not own any oxen, 91 per cent were poorer households.
Similarly, few sample households had access to formal credit or improved inputs, such as seed and fertilizer. Those that did were generally wealthier. While none of the respondents had a formal bank account, for example, 17 per cent reported membership in a community-based savings society (Equb). This ranged from 12 per cent among the poorest households to 30 per cent among the relatively wealthier households. Likewise, only 8 per cent of survey house- holds (all relatively wealthier households) ever obtained a loan from local Service Cooperatives for the purchase of fertilizer (normally procured through the Cooper- ative). As a result, only 1 per cent of sample households used any chemical fertilizer during the 1988189 season.
These general production constraints (coupled with pricing, marketing and infra- structure constraints) result in very low pro- ductivity (Webb, von Braun and Yohannes, 1992). In 1988/89, a year of good rainfall,
survey households obtained average yields of only 740 kg per hectare in the highland sites and 340 kg per hectare at the lowland sites. This translated into an average 111 kg of cereals per capita across sites. Yields fell lower still during the drought of the mid-1980s. Despite common 'risk aversion' measures (such as crop diversification, inter-cropping, staggered planting and selective weeding), cereal yields at the study sites dropped in 1985 to an average of only 181 kg per hectare, or 24 kg per capita.
What is more, there was differentiation between rich and poor. Wealthier house- holds achieved drought-year yields three times higher than poor households - 300 kg versus 111 kg per hectare. As a result, drought-year output from wealthier households was also higher, reaching an average of 38 kg per capita, compared with only 9.5 kg per capita in poor households. Yet, while the relative difference between the income groups is high, drought-year cereal output in wealthier households was still extremely small in absolute terms. In 1985, the wealthier households produced only 38 kg of cereals per capita, only a third of the average of 112 kg per capital in 1988. Thus, although some smallholders were more successful than others in dealing with the adverse climatic conditions of the mid- 1980s, almost all households faced major crop and livestock production shortfalls.
The differential impact of drought by wealth status also extended into livestock production. Extraordinary measures were taken by households trylng to keep animals alive. At the lowland survey sites, 69 per cent of sample households fed roof thatch to their oxen and milch cows. Cactus stems and fruit were used by 24 per cent of house- holds, and 5 per cent collected tree vines. In addition 35 per cent of pastoral respond- ents increased the watering frequency of their herd, and another 10 per cent increased the frequency of their trans- humant cycles by staying for shorter periods at any one place.
DISASTERS VOLUME 17 NUMBER 1 0 Basil Blackwell Ltd. 1993
Coping with Drought and Food Insecurity in Ethiopia 37
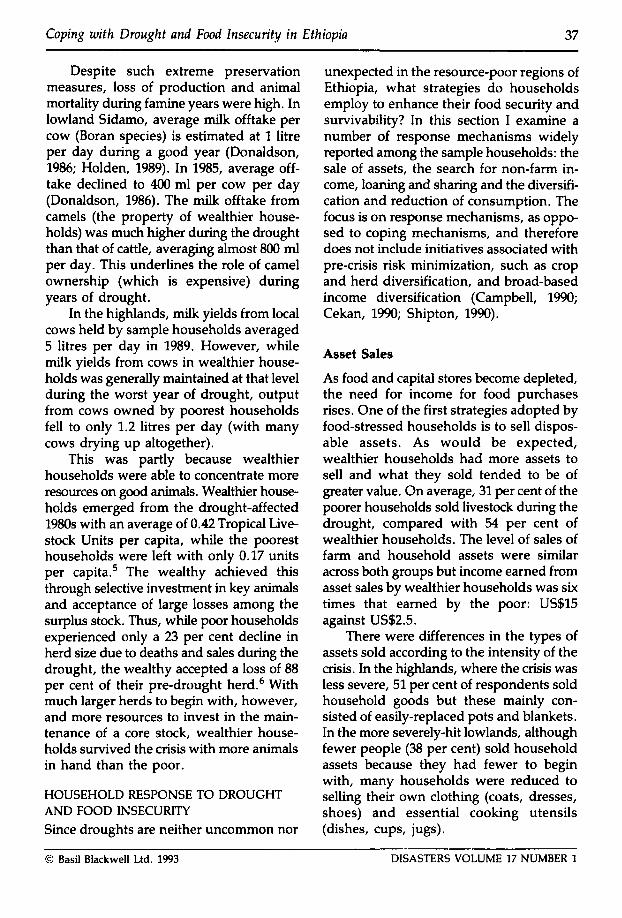
Despite such extreme preservation measures, loss of production and animal mortality during famine years were high. In lowland Sidamo, average milk offtake per cow (Boran species) is estimated at 1 litre per day during a good year (Donaldson, 1986; Holden, 1989). In 1985, average off- take declined to 400 ml per cow per day (Donaldson, 1986). The milk offtake from camels (the property of wealthier house- holds) was much higher during the drought than that of cattle, averaging almost 800 ml per day. This underlines the role of camel ownership (which is expensive) during years of drought.
In the highlands, milk yields from local cows held by sample households averaged 5 litres per day in 1989. However, while milk yields from cows in wealthier house- holds was generally maintained at that level during the worst year of drought, output from cows owned by poorest households fell to only 1.2 litres per day (with many cows drying up altogether).
This was partly because wealthier households were able to concentrate more resources on good animals. Wealthier house- holds emerged from the drought-affected 1980s with an average of 0.42 Tropical Live- stock Units per capita, while the poorest households were left with only 0.17 units per ~ a p i t a . ~ The wealthy achieved this through selective investment in key animals and acceptance of large losses among the surplus stock. Thus, while poor households experienced only a 23 per cent decline in herd size due to deaths and sales during the drought, the wealthy accepted a loss of 88 per cent of their pre-drought herd.6 With much larger herds to begin with, however, and more resources to invest in the main- tenance of a core stock, wealthier house- holds survived the crisis with more animals in hand than the poor.
HOUSEHOLD RESPONSE TO DROUGHT AND FOOD INSECURITY Since droughts are neither uncommon nor
unexpected in the resource-poor regions of Ethiopia, what strategies do households employ to enhance their food security and survivability? In this section I examine a number of response mechanisms widely reported among the sample households: the sale of assets, the search for non-farm in- come, loaning and sharing and the diversifi- cation and reduction of consumption. The focus is on response mechanisms, as oppo- sed to coping mechanisms, and therefore does not include initiatives associated with pre-crisis risk minimization, such as crop and herd diversification, and broad-based income diversification (Campbell, 1990; Cekan, 1990; Shipton, 1990).
Asset Sales
As food and capital stores become depleted, the need for income for food purchases rises. One of the first strategies adopted by food-stressed households is to sell dispos- able assets. As would be expected, wealthier households had more assets to sell and what they sold tended to be of greater value. On average, 31 per cent of the poorer households sold livestock during the drought, compared with 54 per cent of wealthier households. The level of sales of farm and household assets were similar across both groups but income earned from asset sales by wealthier households was six times that earned by the poor: US$15 against US$2.5.
There were differences in the types of assets sold according to the intensity of the crisis. In the highlands, where the crisis was less severe, 51 per cent of respondents sold household goods but these mainly con- sisted of easily-replaced pots and blankets. In the more severely-hit lowlands, although fewer people (38 per cent) sold household assets because they had fewer to begin with, many households were reduced to selling their own clothing (coats, dresses, shoes) and essential cooking utensils (dishes, cups, jugs).
0 Basil Blackwell Ltd. 1993 DISASTERS VOLUME 17 NUMBER 1

38 Pat rick Webb
The sale of productive assets represents the later stages of hardship. Since private ownership of land is not common, land did not often change hands during the crisis but 28 per cent of sample households sold at least some farm equipment, and 56 per cent sold livestock. The majority of animals sold were male cattle, calves and small rumi- nants but draft oxen, cows and donkeys (the principal mode of transport and haul- age) were also sold as conditions worsened. In 1984, few animals of any type repre- sented 'distress sales' (defined as sales for the purpose of obtaining food) but in 1985, and again in 1987 and 1988, distress sales of the three most valued animals (oxen, cows and donkeys) rose steeply. The long- term implications of such asset-stripping are considerable. Fewer oxen (and ploughs) are available for the next farm season, income from animal products disappears, and sales of fuel products suffer because of transport cons train ts.
There appears to have been some degree of substitution between the sale of livestock, household and farm assets depending on availability. Where fewer livestock were sold, more household or personal assets were often sold, and vice versa. In the southern pastoral lands of Sidamo, for example, 90 per cent of the pastoral households in the sample sold live- stock, while only 8 per cent sold household goods. Given that pastoralists own few household goods and many cattle this is not surprising. What is more, the sale of an animal is an event of high significance to pastoral clans. If a household was forced to sell livestock the clan tried to find a buyer within the clan so that animals rarely left the 'greater fold'. By contrast, in the densely- populated highlands of Wolayta (southern Shewa), 91 per cent of respondents sold household goods but only 55 per cent sold livestock, which fewer people own because of land pressure.
Disposable farm equipment took the form of ploughs, sickles, harvest sacks and
rope. Few of the wealthiest households sold any of their productive farm assets but 48 per cent of the poorest sample households sold farm-related assets. This indicates that, in the absence of efficient capital markets, the poor had no means of protecting their assets and their productive efficiency. In 1989 the mean value of assets still owned by households after five or more years of crisis was only US$66 per capital, ranging from US$114 per capita among wealthier households to only US52 in the poorest households. This underlines the relatively greater problem facing poorer households in attempting to re-establish post-drought production.
Non-Farm Income
Few households depend solely on crop pro- duction for survival. During a good rainfall year, such as 1989/90, wage labor, the sale of fuel products, the sale of craft-work and other activities unrelated to the home farm, account for an average of 69 per cent of total net income for wealthier households, and 36 per cent of income among the poorer households (Webb and Reardon, 1992). In other words, wealthier smallholders depend relatively less on agricultural pro- duction, and more on a diversified income portfolio.
Yet, as drought years succeed each other and reliance on domestic food pro- duction becomes more uncertain, the search for non-farm income grows - unfortunately at a time of falling demand for products and services. The collapse of demand for non- essential foods and fuel products during the crisis years of the mid-1980s sharply reduced the earning options for most households. In 1988/89, for example, (a good rainfall year), women in 21 per cent of the survey households earned a substan- tial income from the sale of fuel products. At the same time, women in another 8 per cent of households depended heavily on the sale of processed food and drink. During
DISASTERS VOLUME 17 NUMBER 1 0 Basil Blackwell Ltd. 1993

Coping with Drought and Food lnsecurity in Ethiopia 39
the years of drought and famine, however, less than 1 per cent of all households were engaged in such activities.
Instead, women were frequently forced to sell their last remaining asset of value (labor) alongside the men. In 1989, manual wage labor was a major source of income for men in 17 per cent of survey households and for women in only 3 per cent of house- holds. During the worst famine year, however, the percentage of households in which both women and men were working as laborers rose to 25 per cent. This was true despite a 50 to 60 per cent fall in wages in the survey areas during the famine.
The only major difference between male and female laborers was that women worked close to home, while men migrated longer distances to find jobs with higher wages. It should also be pointed out that the loss of certain productive assets, such as pack animals, had a further negative impact on women’s ability to pursue non-farm income-earning activities. The loss of a donkey made it much harder for women to collect and transport to market firewood or manure bricks. Similarly, the sale of craft products, such as spun cotton and woven cloth, was compromised by transport constraints.
Social Support
In many instances, migratory searches for employment and income needed to be preceded or supported by drawing on social investment systems, such as family and community exchange and reciprocal obliga- tion (Shipton, 1990). There is a large anthropological literature on the old, but still unresolved, debate about the nature and extent of sharing during times of stress (Turnbull, 1972; Dirks, 1980). The issue is whether communities, or even relatives, share what they have during famines. Evi- dence has been offered to support both sides of the argument (Pankhurst, 1984; Cekan, 1990).
The present findings are also mixed. Roughly one third of respondents at four of the survey sites supported their relatives at the worst time. The remainder reported that things were so bad that they could not help anyone but their own household. In southern Shewa, some relatives went out of their way to avoid seeing each other rather than confront the embarrassing issue of blood-ties. In the lowlands of eastern Shewa, where conditions were the worst of all the sites, a common response was that people felt a moral obligation to bury a neighbor if found dead, but that other forms of help were limited. One respondent replied, ‘there was no way of helping each other. It was a time of hating - even your own mother’.
The one exception was the pastoral site in Sidamo. Pastoral communities are often more mutually supportive than their agrarian counterparts (Laughlin, 1974; Webb, Bisrat and Coppock, 1991). Over 80 per cent of households supported not just other relatives, but anyone in the clan who needed assistance. Similarly, although access to water and grazing became very re- stricted during the drought, 90 per cent of respondents noted that there was no friction or conflict over resources. The few who did report clashes over grazing noted that this did not occur amongst the Borana or Gabbra, but with other ethnic groups such as the Gujji who attempted to move into the Beke area during the drought. Those report- ing friction over water said that this occur- red mostly amongst the Borana because of strict controls imposed by the elders on access to ponds and traditional wells. Most disputes were over the allocation of clan water right^.^
Apart from pastoral reciprocity, which showed considerable stability, the diversity of responses at other survey sites suggests that social relationships change with the conditions around them. Cultural norms and the changing severity of local conditions both play a part. As Shipton
0 Basil Blackwell Ltd. 1993 DISASTERS VOLUME 17 NUMBER 1

40 Patrick Webb
TABLE 1 Drought impact and household response by region and wealth status
Region Wealth Status
Highland Lowland Wealthier Poorer
Percentage of households Asset Sales
Livestock Household Farm
Food Cash
Loans
61 53 54 31 51 38 5 3 28 20 5 48
20 20 25 16 35 34 37 32
Sharing ‘Family support‘ 29 41 43 29 Sharing food 25 36 41 23
Famine foods 56 47 58 41 Reduced food 66 59 75 55 Reduced meals 17 40 47 63
Early weaning 54 35 57 29
Consumption Decline
( c 1 per day)
Source: lnternational Food Policy Research lnstitute Survey, 1989/90.
points out, ‘hunger seems to separate the more from the less valued ties . . . as shar- ing becomes more discriminant’ (Shipton, 1990).
But what of ability to share? It has been argued that families in Ethiopia survive long periods of hardship because community support mechanisms enable the almost- destitute to borrow and share food with wealthier households (Rahmato, 1987; McCann, 1987). While the present data are too aggregated to identify the direction of food and income flows between different household types, Table 1 shows that roughly one third of the sample households shared more food and cash with relatives during crisis years than during ‘normal’ times. On the other hand, increased shar- ing of food shows up more among wealthier households (41 per cent), than among poorer households (23 per cent). Few respondents
reported having shared freely with non- relatives. In other words, while sharing (and indeed increased sharing) of resources did take place, relatively more of the wealthier households were in a position to do so and they shared with blood-relatives rather than with destitute households outside of the family.
Credit and Loans
Where it was difficult to find access to shared resources, many households resorted to credit. Debts represent personal ties and personal ties represent security during crisis. Thus, if relatives could not (or would not) give food or cash in the form of a gift, they would often give a loan. Most households (87 per cent) took loans of food from nearby villages in the early stages of the crisis, which they later repaid with
DISASTERS VOLUME 17 NUMBER 1 0 Basil Blackwell Ltd. 1993

Coping with Drought and Food Insecurity in Ethiopia 41
interest. Almost half the loans reported were arranged between relatives. Another 41 per cent took the form of loans between friends, with only 11 per cent involving commercial money-lenders or merchants. Table 1 shows that slightly more wealthy households borrowed food and cash than did poorer households. They also made larger loans. This indicates that poor (in fact all) households lack access to the credit that is crucial to preserving resources during times of stress. Interest rates on loans ranged from 50 to 300 per cent, payable in cash or kind; where they were obtained from relatives rather than merchants, they usually carried no time limit for repayment.
Consumption Variation and Decline
Even during non-famine years calorie con- sumption in Ethiopia is extremely low. At a national level, average per capita figures commonly cited lie in the range of 1,500 to 1,750 calories per day (Harbeson, 1990). Among the sample households, daily calorie consumption in 1989/90 (a good har- vest year) stood at an average of 1,850 per capita (Webb, von Braun and Yohannes, 1992), but the average conceals considerable variation. Per capita consumption in the poorest households stood at only 1,690 calories per day across all survey sites, with four of the sites falling below the 1,600 level. This compares with an average of 2,183 calories per capita for the wealthier house- holds. Thus, wealthier households were consuming roughly 30 per cent more calories in 1989190 than the poor.
Yet, by any nutritional standard, all of these figures are low. Many of the wealthier households consume fewer than 2,000 calories per capita per day. As a result, an average of 68 per cent of the sample house- holds (across the entire sample) consumed less than 80 per cent of the recommended daily allowance of 2,300 calories per day. This compares unfavorably with recent surveys in The Gambia and Rwanda which
found only 18 per cent and 41 per cent respectively of households calorie-deficient (von Braun and Pandya-Lorch, 1991). In other words, in a good year an average of no less than 42 per cent of households across the surveyed communities can be classified as malnourished.
The low base level of consumption inevitably restricts the options available for a consumption adjustment to food short- ages. Nevertheless, three main consump- tion responses were adopted by the sample households: diets were diversified to incorporate food items not normally consumed, the quantity of food consumed per meal was reduced, and the number of meals per day was reduced.
Wealthier households changed their diet relatively less than the poorer house- holds, but they did change them. On the one hand, the wealthy reduced their con- sumption of the most expensive grain (teff), substituting cheaper cereals such as maize and sorghum. On the other hand, many wealthier households were also forced to eat 'famine foods'. While certain forage foods are collected as a matter of course even during normal years, the range of items, and frequency of consumption, rose con- siderably among most households during the droughts and associated famines. Table 1 shows that at the upland sites, 56 per cent of households supplemented their diets with famine foods, such as roots, leaves and even grass and rats. In the lowlands, an average of 47 per cent of households con- sumed famine foods. Both men and women joined in the search for products to sup- plement an increasingly restricted diet.
Interestingly, 58 per cent of wealthier households increased their consumption of famine foods, compared with only 41 per cent of poorer households. This is because poorer households supplement a cereal or tuber-based diet with berries and fruits, even in years of good rainfall (Irvine, 1952; Wilding, 1985). Certain types of foraged food should therefore be distinguished from
0 Basil Blackwell Ltd. 1993 DISASTERS VOLUME 17 NUMBER 1
42 Patrick Webb
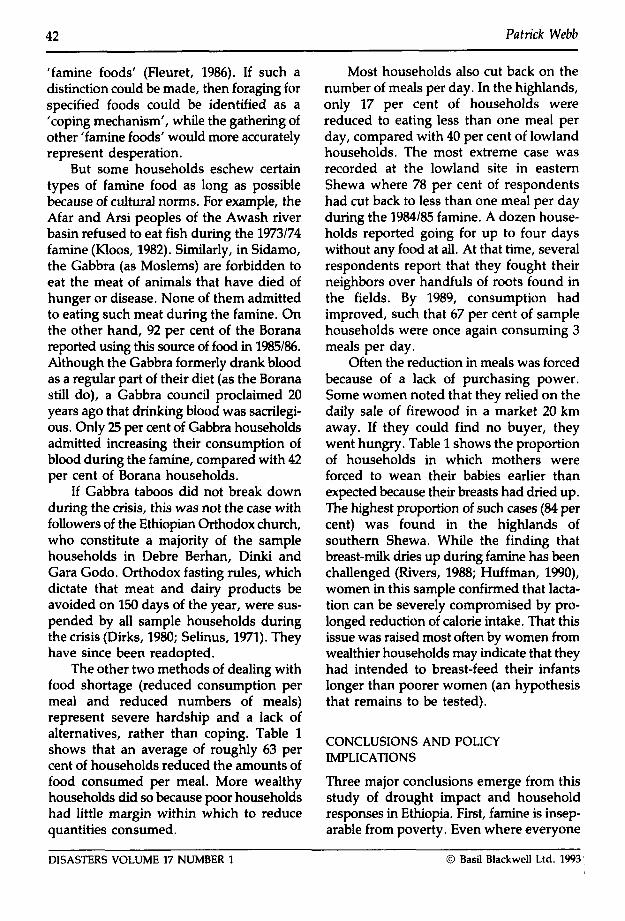
'famine foods' (Fleuret, 1986). If such a distinction could be made, then foraging for specified foods could be identified as a 'coping mechanism', while the gathering of other 'famine foods' would more accurately represent desperation.
But some households eschew certain types of famine food as long as possible because of cultural norms. For example, the Afar and Arsi peoples of the Awash river basin refused to eat fish during the 1973174 famine (Kloos, 1982). Similarly, in Sidamo, the Gabbra (as Moslems) are forbidden to eat the meat of animals that have died of hunger or disease. None of them admitted to eating such meat during the famine. On the other hand, 92 per cent of the Borana reported using this source of food in 1985/86. Although the Gabbra formerly drank blood as a regular part of their diet (as the Borana still do), a Gabbra council proclaimed 20 years ago that drinking blood was sacrilegi- ous. Only 25 per cent of Gabbra households admitted increasing their consumption of blood during the famine, compared with 42 per cent of Borana households.
If Gabbra taboos did not break down during the crisis, this was not the case with followers of the Ethiopian Orthodox church, who constitute a majority of the sample households in Debre Berhan, Dinki and Gara Godo. Orthodox fasting rules, which dictate that meat and dairy products be avoided on 150 days of the year, were sus- pended by all sample households during the crisis (Dirks, 1980; Selinus, 1971). They have since been readopted.
The other two methods of dealing with food shortage (reduced consumption per meal and reduced numbers of meals) represent severe hardship and a lack of alternatives, rather than coping. Table 1 shows that an average of roughly 63 per cent of households reduced the amounts of food consumed per meal. More wealthy households did so because poor households had little margin within which to reduce quantities consumed.
Most households also cut back on the number of meals per day. In the highlands, only 17 per cent of households were reduced to eating less than one meal per day, compared with 40 per cent of lowland households. The most extreme case was recorded at the lowland site in eastern Shewa where 78 per cent of respondents had cut back to less than one meal per day during the 1984/85 famine. A dozen house- holds reported going for up to four days without any food at all. At that time, several respondents report that they fought their neighbors over handfuls of roots found in the fields. By 1989, consumption had improved, such that 67 per cent of sample households were once again consuming 3 meals per day.
Often the reduction in meals was forced because of a lack of purchasing power. Some women noted that they relied on the daily sale of firewood in a market 20 km away. If they could find no buyer, they went hungry. Table 1 shows the proportion of households in which mothers were forced to wean their babies earlier than expected because their breasts had dried up. The highest proportion of such cases (84 per cent) was found in the highlands of southern Shewa. While the finding that breast-milk dries up during famine has been challenged (Rivers, 1988; Huffman, 1990), women in this sample confirmed that lacta- tion can be severely compromised by pro- longed reduction of calorie intake. That this issue was raised most often by women from wealthier households may indicate that they had intended to breast-feed their infants longer than poorer women (an hypothesis that remains to be tested).
CONCLUSIONS AND POLICY IMPLICATIONS
Three major conclusions emerge from this study of drought impact and household responses in Ethiopia. First, famine is insep- arable from poverty. Even where everyone
DISASTERS VOLUME 17 NUMBER 1 0 Basil Blackwell Ltd. 1993
Coping with Drought and Food Znsecurity in Ethiopia 43
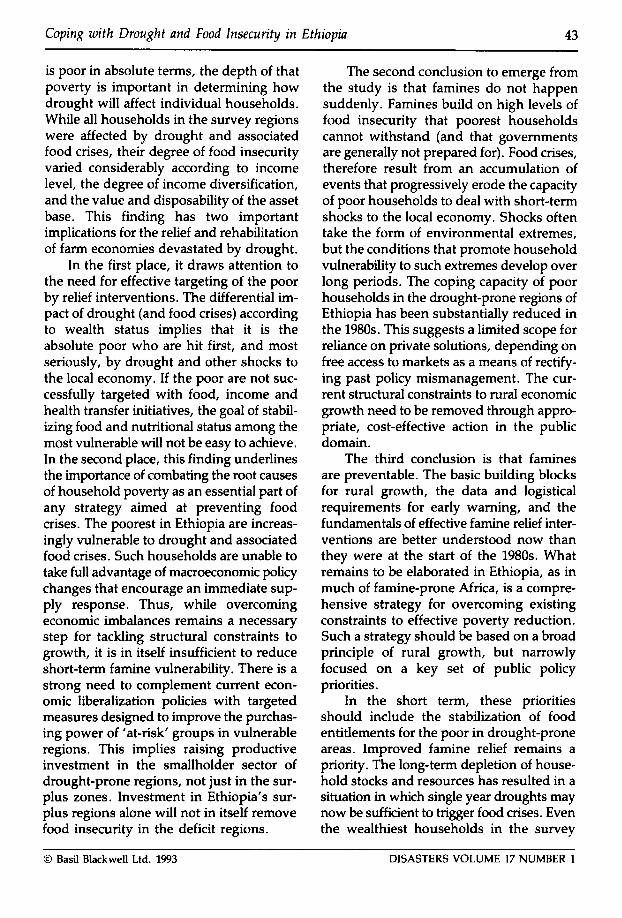
is poor in absolute terms, the depth of that poverty is important in determining how drought will affect individual households. While all households in the survey regions were affected by drought and associated food crises, their degree of food insecurity varied considerably according to income level, the degree of income diversification, and the value and disposability of the asset base. This finding has two important implications for the relief and rehabilitation of farm economies devastated by drought.
In the first place, it draws attention to the need for effective targeting of the poor by relief interventions. The differential im- pact of drought (and food crises) according to wealth status implies that it is the absolute poor who are hit first, and most seriously, by drought and other shocks to the local economy. If the poor are not suc- cessfully targeted with food, income and health transfer initiatives, the goal of stabil- izing food and nutritional status among the most vulnerable will not be easy to achieve. In the second place, this finding underlines the importance of combating the root causes of household poverty as an essential part of any strategy aimed at preventing food crises. The poorest in Ethiopia are increas- ingly vulnerable to drought and associated food crises. Such households are unable to take full advantage of macroeconomic policy changes that encourage an immediate sup- ply response. Thus, while overcoming economic imbalances remains a necessary step for tackling structural constraints to growth, it is in itself insufficient to reduce short-term famine vulnerability. There is a strong need to complement current econ- omic liberalization policies with targeted measures designed to improve the purchas- ing power of ‘at-risk’ groups in vulnerable regions. This implies raising productive investment in the smallholder sector of drought-prone regions, not just in the sur- plus zones. Investment in Ethiopia’s sur- plus regions alone will not in itself remove food insecurity in the deficit regions.
The second conclusion to emerge from the study is that famines do not happen suddenly. Famines build on high levels of food insecurity that poorest households cannot withstand (and that governments are generally not prepared for). Food crises, therefore result from an accumulation of events that progressively erode the capacity of poor households to deal with short-term shocks to the local economy. Shocks often take the form of environmental extremes, but the conditions that promote household vulnerability to such extremes develop over long periods. The coping capacity of poor households in the drought-prone regions of Ethiopia has been substantially reduced in the 1980s. This suggests a limited scope for reliance on private solutions, depending on free access to markets as a means of rectify- ing past policy mismanagement. The cur- rent structural constraints to rural economic growth need to be removed through appro- priate, cost-effective action in the public domain.
The third conclusion is that famines are preventable. The basic building blocks for rural growth, the data and logistical requirements for early warning, and the fundamentals of effective famine relief inter- ventions are better understood now than they were at the start of the 1980s. What remains to be elaborated in Ethiopia, as in much of famine-prone Africa, is a compre- hensive strategy for overcoming existing constraints to effective poverty reduction. Such a strategy should be based on a broad principle of rural growth, but narrowly focused on a key set of public policy priorities.
In the short term, these priorities should include the stabilization of food entitlements for the poor in drought-prone areas. Improved famine relief remains a priority. The long-term depletion of house- hold stocks and resources has resulted in a situation in which single year droughts may now be sufficient to trigger food crises. Even the wealthiest households in the survey
0 Basil Blackwell Ltd. 1993 DISASTERS VOLUME 17 NUMBER 1
44 Patrick Webb
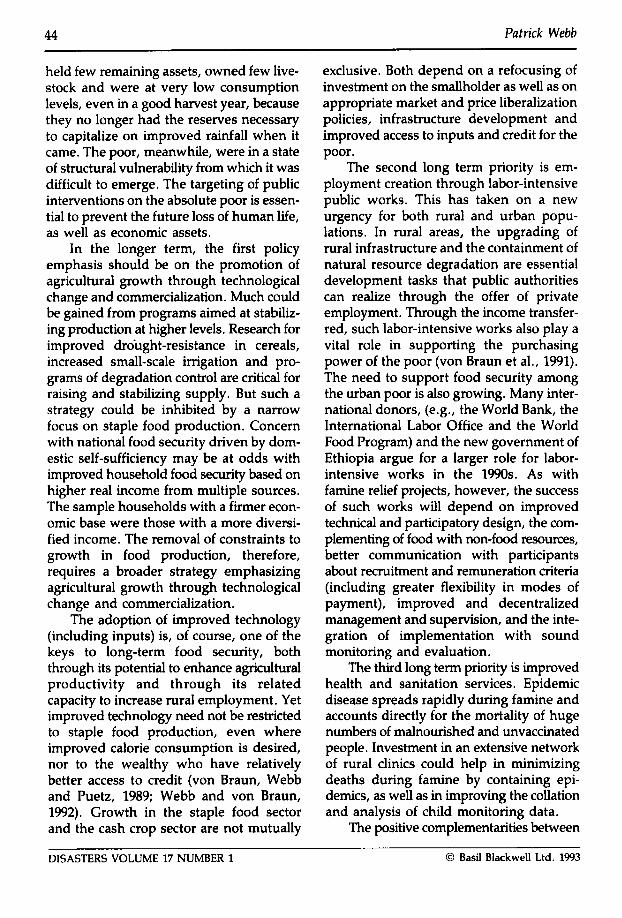
held few remaining assets, owned few live- stock and were at very low consumption levels, even in a good harvest year, because they no longer had the reserves necessary to capitalize on improved rainfall when it came. The poor, meanwhile, were in a state of structural vulnerability from which it was difficult to emerge. The targeting of public interventions on the absolute poor is essen- tial to prevent the future loss of human life, as well as economic assets.
In the longer term, the first policy emphasis should be on the promotion of agricultural growth through technological change and commercialization. Much could be gained from programs aimed at stabiliz- ing production at higher levels. Research for improved drought-resistance in cereals, increased small-scale irrigation and pro- grams of degradation control are critical for raising and stabilizing supply. But such a strategy could be inhibited by a narrow focus on staple food production. Concern with national food security driven by dom- estic self-sufficiency may be at odds with improved household food security based on higher real income from multiple sources. The sample households with a firmer econ- omic base were those with a more diversi- fied income. The removal of constraints to growth in food production, therefore, requires a broader strategy emphasizing agricultural growth through technological change and commercialization.
The adoption of improved technology (including inputs) is, of course, one of the keys to long-term food security, both through its potential to enhance agricultural productivity and through its related capacity to increase rural employment. Yet improved technology need not be restricted to staple food production, even where improved calorie consumption is desired, nor to the wealthy who have relatively better access to credit (von Braun, Webb and Puetz, 1989; Webb and von Braun, 1992). Growth in the staple food sector and the cash crop sector are not mutually
exclusive. Both depend on a refocusing of investment on the smallholder as well as on appropriate market and price liberalization policies, infrastructure development and improved access to inputs and credit for the poor.
The second long term priority is em- ployment creation through labor-intensive public works. This has taken on a new urgency for both rural and urban popu- lations. In rural areas, the upgrading of rural infrastructure and the containment of natural resource degradation are essential development tasks that public authorities can realize through the offer of private employment. Through the income transfer- red, such labor-intensive works also play a vital role in supporting the purchasing power of the poor (von Braun et al., 1991). The need to support food security among the urban poor is also growing. Many inter- national donors, (e.g., the World Bank, the International Labor Office and the World Food Program) and the new government of Ethiopia argue for a larger role for labor- intensive works in the 1990s. As with famine relief projects, however, the success of such works will depend on improved technical and participatory design, the com- plementing of food with non-food resources, better communication with participants about recruitment and remuneration criteria (including greater flexibility in modes of payment), improved and decentralized management and supervision, and the inte- gration of implementation with sound monitoring and evaluation.
The third long term priority is improved health and sanitation services. Epidemic disease spreads rapidly during famine and accounts directly for the mortality of huge numbers of malnourished and unvaccinated people. Investment in an extensive network of rural clinics could help in minimizing deaths during famine by containing epi- demics, as well as in improving the collation and analysis of child monitoring data.
The positive complementarities between
DISASTERS VOLUME 17 NUMBER 1 0 Basil Blackwell Ltd. 1993
Coping with Drought and Food lnsecurity in Ethiopia 45
these priorities are promising and, if allowed to operate in a favorable macro- economic environment, would permit high returns to public investment. There is no single public intervention that can alone improve food security. Nor is there a uni- versal, market-based solution just waiting to be tapped by vulnerable households. Many of the latter do not have the ability to take advantage of the potential for private initiatives. It is these households that must be targeted through appropriate public action. Programs such as wet feeding, food aid distribution, public works, asset distri- bution and technology transfer can operate simultaneously, so long as they are carefully coordinated to balance and complement each other rather than compete.
Of course, even well-designed and well-targeted projects cannot on their own resolve Ethiopia’s structural food insecurity. A consistent set of policies designed to sup- port strategic national and donor inter- ventions is required over the next decade (and beyond) to remove the long-standing obstacles to rural growth in Ethiopia. Last- ing peace through improved popular parti- cipation, and sustained poverty reduction through rural economic growth are the best foundation stones for a future without famine. The design of such policies and programs will need to be grounded in a better understanding of the dynamics of the rural economy. Sound household informa- tion is still surprisingly scarce in Ethiopia. A widely-held (but mistaken) belief in the uniformity of rural conditions and of house- hold strategies for coping with those condi- tions prevents appropriate attention being paid to the distributional consequences of policy and project interventions. As a result, the poorest of the poor, who are the most vulnerable to famine and therefore the first affected by it, are often overlooked.
Notes
This article benefitted greatly from comments
made on an earlier draft by Joachim von Braun, Thomas Reardon and Julie Witcover. Thanks go to Yohannes Habtu, Luel Getachew and Raya Abagodu for their tireless assistance in the collection of these data, and to Yisehac Yohannes for their analysis. I am also immensely grateful to Anna Hugo-Webb for her selfless support.
1.
2.
3.
4.
5.
6.
7.
See Webb, von Braun and Yohannes (1992), and Webb and Reardon (1992) for details of the research methodology and results. The lowland survey villages were located in eastern Shewa, northern Arssi, Sidamo and central Gamo Gofa. The highland sites were in north-west Hararghe, northern Shewa and south-western Shewa. There lowland villages represented settled farm communities, one a pastoral community. Based on data for nearest rainfall stations monitored by the National Meteorological Services Authority. Three income groups (’rich’, ’middle’ and ‘poor’) were calculated, ex post facto, across all survey sites based on data on household income and expenditure for 1989/90. The three groups each comprise roughly one third of the total of 550 households. Tropical Livestock Units are calculated as follows: Equines = 1.0, Camels = 1.0, Cattle = 0.83, Donkeys = 0.5, Small Ruminants = 0.2. If a poor household owned 2 cows before the drought and lost 1 of them, that is a loss of 50 per cent of the pre-drought herd. If a rich household had 100 cows and lost 80 of them, that is an 80 per cent loss. But the rich house- hold still has 20 cows, while the poor household has only 1 left. For details of the complex political structures which govern water allocation from shared wells that are 600 years old, see Legesse (1973), Wilding (1985), and Cossins and Upton (1987).
References
Belete, A., J.L. Dillon, and F.M. Anderson (1991) Development of agriculture in Ethiopia since the 1975 land reform. Agricultural Economics
von Braun, J., Puetz, D. and Webb, P. (1989) Irrigation technology and commercialization of rice
6, 159-75.
0 Basil Blackwell Ltd. 1993 DISASTERS VOLUME 17 NUMBER 1
46 Patrick Webb
in The Gambia: Eficts on income and nutrition. Research Report No. 75. International Food Policy Research Institute, Washington, D.C.
von Braun, J., Pandya-Lorch, R. eds (1991) Income sources of malnourished people in rural areas: Microlevel informution and policy implications. Working Papers on Commercialization of Agriculture and Nutrition, No. 5, Inter- national Food Policy Research Institute, Washington, D.C.
Briine, S. (1990) The agricultural sector: Struc- ture, performance, and issues (1974-1988). In S. Pausewang, F. Cheru, S. Briine and E. Chole (eds) Ethiopia: Rural development options. Zed Books, London, 15-29.
Cekan, J. (1990) Traditional coping strategies during the process of fimine in sub-Saharan Africa. Un- published Master’s thesis, Fletcher School of Law and Diplomacy, Tufts School of Nutrition, Medford, Massachusetts.
Campbell, D.J. (1990) Strategies for Coping with Severe Food Deficits in Rural Africa: A Review of the Literature. Food and Foodways
Cossins, N.J. and Upton, M. (1987) The Borana pastoral system of Southern Ethiopia. Agri- cultural Systems 25, 199-218.
Cutler, P. (1985) The use of economic and social information in famine prediction and response. London School of Hygiene and Tropical Medicine, London (Mimeo).
Dirks, R. (1980) Social response during severe food shortages and famine. Current Anthro-
Devereux, S. (1988) Entitlements, availability, and famine: A revisionist view of Wollo, 1972-74. Food Policy 13, 270-282.
Fleuret, A. (1986) Indigenous responses to drought in Sub-Saharan Africa. Disasters 10,
Hay, R.W. (1988) Famine and household coping strategies. World Development 16, 113-25.
Herren, U.J. (1991) ‘Droughts have different tails’: Response to Crises in Mukogodo Division. Disasters 15, 93-98.
Kennedy, E.T. (1992) The Impact of Drought on Production, Consumption and Nutrition in Southwestern Kenya. Disasters 16, 9-18.
Harbeson, J.W. (1990) The Current Food Situation in Ethiopia. Prepared Statement for the Joint Economic Committee of the United States Congress, February 27, 1990. Washington,
4, 143-62.
pology 21, 21-44.
224-29.
D.C. (Mimeo). Huffman, S.L. (1990) Maternal malnutrition and
breast-feeding: Is there really a choice for policy- makers? Center to Prevent Childhood Mal- nutrition. Washington, D.C.
ICIHI (Independent Commission on Inter- national Human Issues) (1985) Famine: A man- made disaster? Pan BookslIndependent Commission on International Human Issues, London.
Irvine, F.R. (1952) Supplementary and emergency food plants of West Africa. Economic Botany 6, 23-40.
Kebede, G. and Jacob, M.J. (1988) Drought, famine and the political economy of environ- mental degradation in Ethiopia. Geography 73,
Kloos, H. (1982) Development, drought, and famine in the Awash Valley of Ethiopia. African Study Review 25, 21-48.
Laughlin, C.D. Jr. (1974) Deprivation and reciprocity. Man (n.s.) 9, 380-396.
Legesse, A. (1973) Gada: Three approaches to the study of Aftlcan society. The Free Press, New York.
McCann, J. (1987) From poverty to famine in northeast Ethiopia: A rural history. University of Pennsylvania, Philadelphia.
Pankhurst, R. (1984) The history of famines and epidemics prior to the twentieth century. Relief and Rehabilitation Commission, Addis Ababa.
Rahmato, D. (1987) Famine and survival strategies: A case study from northeast Ethiopia. Food and Famine Monograph No. 1. Institute of Development Research, Addis Ababa.
Reardon, T., C. Delgado and P. Matlon (1992) Determinants and Effects of Income Diversifi- cation Amongst Farm Households in Burkina Faso. Journal of Development Studies 24, 365-377.
Rivers, J.P.W. (1988) The nutritional biology of famine. In G.A. Hanison (ed.) Famine, Oxford University Press, Oxford, 57-106.
Selinus, R. (1971) Dietary studies in Ethiopia: Dietary pattern among the Rift Valley Arsi Galla. American Journal of Clinical Nutrition 24, 365-377.
Shipton, P. (1990) African Famines and Food Security: Anthropological Perspectives. Annual Review of Anthropology 19, 353-94.
Swinton, S. (1988) Drought Survival Tactics of
65-70.
~~
DISASTERS VOLUME 17 NUMBER 1 0 Basil Blackwell Ltd. 1993

Coping with Drought and Food lnsecurity in Ethiopia 47
Subsistence Farmers in Niger. Human Ecology
Turnbull, C. (1972) The Mountain People. Simon and Schuster, New York.
de Wad, A. (1988) Famine early warning systems and the use of socioeconomic data. Disasters
Webb, P. and von Braun, J. (1992) Food security and famine prevention in Afnca in the 1990s: The search for appropriate policies. Paper presented at the International Conference on African Economic Issues, Abidjan, Cote d’Ivoire, October 13-15.
Webb, P. and Reardon, T. (1992) Drought Impact and Household Response in East and West Africa. Quarterly Journal of International Agriculture 31, 230-46.
Webb, P., von Braun, J. and Yohannes, Y. (1992) Famine in Ethiopia: Policy lmplications of Coping Failure at National and Household Levels. Research Report 92. International Food Policy Research Institute, Washington, D.C.
16, 123-44.
12, 81-91.
Webb, P., Bisrat, G. and Coppock, D.L. (1991) Food Security and Sustainable Growth for Pastoral Systems in Semi-Arid Africa. In S. Vosti, T. Reardon and W. von Urff (eds), Agricultural Sustainability, Growth and Poverty Alleviation: Issues and Policies, German Foundation for International Development, Feldafing, Germany, pp. 27-62.
Wilding, R. (1985) The history of pastoralism and emergence of the Borana Oromo. JEPSS Research Report No. 15. International Livestock Center for Africa, Addis Ababa.
Patrick Webb International Food Policy Research
Institute 1200 Seventeenth Street, N.W. Washington
USA D.C. 20036-3006
0 Basil Blackwell Ltd. 1993 DISASTERS VOLUME 17 NUMBER 1