Copia Proceedings of Spie
8
Application of laser interferometry to the evaluation of the dynamic characteristics of rolling bearings and comparison with piezoelectric device measurements Dagoberto Vela Arvizo* a , José Maria Rodríguez Lelis b,a , Marciano Vargas Treviño a , Aarón Flores Gil a , Manuel May Alarcón a , Adrián E. Villanueva Luna a a Universidad Autónoma del Carmen, DESDAIT-Facultad de Ingeniería, Av. 56, No. 4, Por AV. Concordia, Col. Aviación, Ciudad del Carmen, Campeche, 24180 b National Center for Research and Technological Development, Interior Internado Palmira s/n, Col. Palmira, Cuernavaca Morelos, A. P. 5-164, C. P. 62490, México ABSTRACT Bearings are elements of rotating machinery that are widely used as low friction joint elements between other machine elements. Like any other machine element they posses a finite life which is dependent on a number of factors, among them manufacture, assembling, maintenances, load, etc. Bearing failures are amongst the principal causes of machinery overhaul. They b y thems elves are a source of vibrat ion which is a function of surface condit ions, clea rances, misalignment, etc. Each of these defects present a specif ic dynamic signature, and can be analyzed by a number of techniques already in used, among them the laser vibrometry. This is a non-contact, non-disturbing method commonly used for measurements of vibrations on static objects. The technique offers the possibility to measure vibrations on thin- walled (light), and rotating objects as well as sound fields. Common vibration signal analy sis in rotating machinery are restricted to low frequencies, up to 3000 Hz, and in some cases when analyzing contact problems and fatigue at 7000 up to 15000 Hz. In this work, are presented the primary results to employ laser interferometry to study the dynamic signals generated by rolling bearings, and the feasibility to employ it to study high frequency problems of these machine elements. Keywords: laser interferometry, rolling bearings, diagnosis, failure analysis 1. INTRODUCTION Nowadays a large number of rotating machinery are designed to perform at high rotational speeds and efficiency. Mostly these machines are designed to perform duri ng long periods of time under aggressive envi ronmental conditions. Some of them use antifriction bearings to carry out the rotational movement, and when the bearing fail, non predicted overhaul may result costly, IRD Mechanalysis [1]. Bearings are employed in a variety of designs and applications in machinery, as described in [2], and the need to fulfill the high requirements of size, low weight, high velocity and load in modern industry, causes that the operation conditions of bearings to become every time more severe [3]. A number of reasons may be attributed to the cause of failure of a bearing, among them one can find those generated during the manufacturing process. Another kind it is presented as a consequence of the way in which the bearings were transported or storage. Al so, the final user can cooperate d to the causes o failure through an improper installation, the use of a contaminated lubricant or a deficient lubrication, or overloading. All of them contribute to the rapid aging and wearing of the bearing until fa ilure [1,2]. Sixth Symposium Optics in Industry, edited by Julio C. Gutiérrez-Vega, Josué Dávila-Rodríguez, Carlos López-Mariscal, Proc. of SPIE Vol. 6422, 64220J, (2007) · 0277-786X/07/$18 · doi: 10.1117/12.742568 Proc. of SP IE Vol. 6422 64220J-1
-
Upload
panzacleto -
Category
Documents
-
view
217 -
download
0
Transcript of Copia Proceedings of Spie
8/8/2019 Copia Proceedings of Spie
http://slidepdf.com/reader/full/copia-proceedings-of-spie 1/8
Application of laser interferometry to the evaluation of the dynamic
characteristics of rolling bearings and comparison with piezoelectric
device measurements
Dagoberto Vela Arvizo*a, José Maria Rodríguez Lelis b,a, Marciano Vargas Treviñoa , Aarón FloresGil
a, Manuel May Alarcón
a, Adrián E. Villanueva Luna
a
aUniversidad Autónoma del Carmen, DESDAIT-Facultad de Ingeniería, Av. 56, No. 4, Por AV.
Concordia, Col. Aviación, Ciudad del Carmen, Campeche, 24180
bNational Center for Research and Technological Development, Interior Internado Palmira s/n, Col.
Palmira, Cuernavaca Morelos, A. P. 5-164, C. P. 62490, México
ABSTRACT
Bearings are elements of rotating machinery that are widely used as low friction joint elements between other machine
elements. Like any other machine element they posses a finite life which is dependent on a number of factors, among
them manufacture, assembling, maintenances, load, etc. Bearing failures are amongst the principal causes of machinery
overhaul. They by themselves are a source of vibration which is a function of surface conditions, clearances,misalignment, etc. Each of these defects present a specific dynamic signature, and can be analyzed by a number of
techniques already in used, among them the laser vibrometry. This is a non-contact, non-disturbing method commonly
used for measurements of vibrations on static objects. The technique offers the possibility to measure vibrations on thin-walled (light), and rotating objects as well as sound fields. Common vibration signal analysis in rotating machinery are
restricted to low frequencies, up to 3000 Hz, and in some cases when analyzing contact problems and fatigue at 7000 up
to 15000 Hz. In this work, are presented the primary results to employ laser interferometry to study the dynamic signals
generated by rolling bearings, and the feasibility to employ it to study high frequency problems of these machine
elements.
Keywords: laser interferometry, rolling bearings, diagnosis, failure analysis
1. INTRODUCTION
Nowadays a large number of rotating machinery are designed to perform at high rotational speeds and efficiency. Mostly
these machines are designed to perform during long periods of time under aggressive environmental conditions. Some
of them use antifriction bearings to carry out the rotational movement, and when the bearing fail, non predicted overhaulmay result costly, IRD Mechanalysis [1]. Bearings are employed in a variety of designs and applications in machinery,
as described in [2], and the need to fulfill the high requirements of size, low weight, high velocity and load in modern
industry, causes that the operation conditions of bearings to become every time more severe [3].
A number of reasons may be attributed to the cause of failure of a bearing, among them one can find those generatedduring the manufacturing process. Another kind it is presented as a consequence of the way in which the bearings were
transported or storage. Also, the final user can cooperated to the causes o failure through an improper installation, the
use of a contaminated lubricant or a deficient lubrication, or overloading. All of them contribute to the rapid aging and
wearing of the bearing until failure [1,2].
Sixth Symposium Optics in Industry, edited by Julio C. Gutiérrez-Vega, Josué Dávila-Rodríguez, Carlos López-Mariscal,Proc. of SPIE Vol. 6422, 64220J, (2007) · 0277-786X/07/$18 · doi: 10.1117/12.742568
Proc. of SPIE Vol. 6422 64220J-1
8/8/2019 Copia Proceedings of Spie
http://slidepdf.com/reader/full/copia-proceedings-of-spie 2/8
Bhushan B [4], amongst others, established that wearing is an undesirable phenomena in machine elements such as bearings, seals, gears and cams. This is the predominant cause of mechanical failures in industry and the consequent
economic expenditure. Even though wearing could be prevented, as described by Harker and Sandy [2], bearings will
fail as a consequence of fatigue. Martínez [5], mention that wear as result of fatigue is produced by cycling loading, asnormally happens in rolling bearings.
Generally speaking, the majority of machinery perform under low levels of vibration, when properly designed. However,
as already mentioned, these are subjected to wear, fatigue and deformation among other things. All of them cause an
increment in clearances, misalignment, appearance of cracks in rotor shafts, etc. In time, additional dynamic loading is
impelled and the vibration amplitude grows until failure is presented. Te common types of failure found in industry that
increase the level of vibration are misalignment, unbalanced rotors, damage bearings, damage gearing, propellers´ blading and loosen mechanical parts [6].
As mentioned by Barkov and Barcoya [7] bearings can exhibit vibration caused by six kinds of dynamic forces. Also,
that the random vibration may be caused by friction forces at frequencies around the 30 kHz, exhibiting low amplitudecompared to the vibration encountered in the interval from 2-10 kHz. Vibration pulses caused by the sudden contact
metal to metal may be found in the interval from 1 to 10 kHz [8].
A typical arrangement for vibration monitoring consist of a transducer to measure the vibration, a data acquisition
device, a signal analyzer and a PC. The type of measuring device or transducer depends on the frequencies and
amplitudes to be measured, the machine dimensions and geometry, the performance conditions of the machinery and thedata processing. Typically in machinery as already, described by [7,8], analysis frequencies are lower of 10 kHz, and
generally in industry the frequencies lie below 3 kHz. Piezoelectric devices commonly are used in industry that satisfies
the failure diagnosis in vibration analysis. However, the diagnosis regarding surface contact, change of surface stiffnessrequires of higher frequency spans [9]. Due to the non-contact nature of the optical probe and the unparalleled
characteristics offered by the use of coherent monochromatic laser light as primary carrier of information, laser
techniques for vibration measurement have a series of undoubted advantages, offering interesting perspectives of
progress for vibration measurements in terms of innovative applications [10].
On the other hand, laser spectroscopy has itself being developed into a very rich field of scientific and technological
endeavour with applications ranging from analytical spectroscopy to Bose-Einstein condensation in gases. It has provided completely new possibilities in fields such as astrophysical research, where is used to combine signals from
two or more telescopes to obtain measurements with higher resolution than those obtained with individual telescopes.
With the fast development of laser sources and auxiliary equipment, including computers in the last five years, theapplications of laser spectroscopy can become widespread. In this work, are presented the primary results of using laser
interferometry with a spectrometer to study the dynamic signals generated by rolling bearings, and the feasibility to
study high frequency problems of these machine elements.
2. EXPERIMENTAL DEVICES
2.1 Optical Setup
The experiment was carried out basically with a Michelson interferometer array. The laser beam of this system follows
the path illustrated in Fig. 1. The beam is emitted by a He-Ne gas laser (1) of 632 nm, this is deviated by a tilted mirror
(2), which directs the beam to a 50/50 splitter lens (5). From this point forward, the beam is send to the the test mirror (4)fixed to the experimental rotor, and to the reference mirror placed perpendicular to the original path (3). Both beams are
reflected back to the splitter, and superposed to give the interference phenomena. Once the interference-beam isobtained, this is catchd by a single-mode fibber optic sensor (6) and then passed through a Czerny-Turner gratingspectrometer (7), which has a linear CCD array (SP2 Thorlabs spectrometer). The SP2 is an advanced fibber optic
spectrometers that connects directly to a standard PC (8).
Proc. of SPIE Vol. 6422 64220J-2

8/8/2019 Copia Proceedings of Spie
http://slidepdf.com/reader/full/copia-proceedings-of-spie 3/8
1
2
3
4
5
6
7
8
Fig. 1. Optical arrangement diagram: (1) He-Ne laser, (2) mirror, (3) reference mirror, (4) test mirror, (5) 50/50 beamsplitter, (6) mono-modo fiber sensor, (7) Spectrometer (8) PC.
2.1 Experimental Rotor
A diagram of the experimental rotor employed in this work is shown in figure 2. This is composed of a 750 W electric
motor (1) with a variable speed control (8). The motor is coupled to the shaft via a flexible coupling system (2). The
shaft is supported by two rolling bearings in a aluminum structure (3), and between these structures two inertial masses(4) are placed.
Fig. 2. Experimental rotor diagram: (1) Motor, (2) flexible coupling, (3) aluminum structures and bearings, (4) Inertial
masses, (5) Accelerometer, (6) acquisition data system, (7) PC and (8) Varying speed control.
The vibration signal from the rolling bearings is obtained via the piezoelectric accelerometer PCB model 603C01 (5).
The rolling bearing is placed in a vertical position on the aluminum structure that carries the rolling bearing. The signalfrom the accelerometer is then passed through a signal conditioner 687A02, and from here to the National Instrument
acquisition system (6), which in time is connected to the PC (7) for data analysis. The acquisition system was configuredto a 1 Hz spectral resolution and a Nyquist frequency of 15000 Hz.
Proc. of SPIE Vol. 6422 64220J-3

8/8/2019 Copia Proceedings of Spie
http://slidepdf.com/reader/full/copia-proceedings-of-spie 4/8
0
3. OPTICAL AND PIEZOELECTRIC MEASUREMENTS
3.1 The experimental procedure
In this work were carried three measurements uploading. These are shown in Table 1. The maximum speed selected was
jut above the first critical speed of the rotor. The procedure of measurement, once the optical arrangement was
initialized, consisted on increase the velocity until a steady condition was attained and the optical and piezoelectricmeasurements recorded. From here the rotational velocity was increased step by step until the maximum velocity
selected is reached following the same procedure. After the maximum velocity, the rotor is turned off and leave to rotate
freely until full stop.
Table 1. Test number and description
Test Description Label
1 Steady measurement at 27.4 Hz 11ST
2 Steady measurement at 33.5 Hz 13ST
3 Steady measurement at 57.7 Hz 16ST
As above described, bearings can exhibit vibration caused by six kinds of dynamic forces. Also, that the random
vibration may be caused by friction forces at frequencies around the 30 kHz, exhibiting low amplitude compared to the
vibration encountered in the interval from 2-10 kHz. Vibration pulses caused by the sudden contact metal to metal may be found in the interval from 1 to 1 kHz. On the other hand, Rodriguez and coworkers [9] showed that the variation in
surface stiffness caused by a surface modification can be localized at frequencies around 4 to 4.5 kHz. Bearing this in
mind, to compare the results obtained from measurements, FFT plots were carried out in the span 0-250 Hz.
The data obtained from the optical arrangement provided with a amplitude-wave length and time plot as shown in figure
3. Here at laser beam wave length of is found at 27.4 Hz. At both sides of this wavelength a number of picks are found
that may be attributed to the He-Ne laser nature. Each point of the graph in the plane amplitude-wave length provides
with a piece of information of the vibration behavior as a function of time.
Fig. 3. Signal plotting of the optical setup at 27.4 Hz.
Proc. of SPIE Vol. 6422 64220J-4
8/8/2019 Copia Proceedings of Spie
http://slidepdf.com/reader/full/copia-proceedings-of-spie 5/8
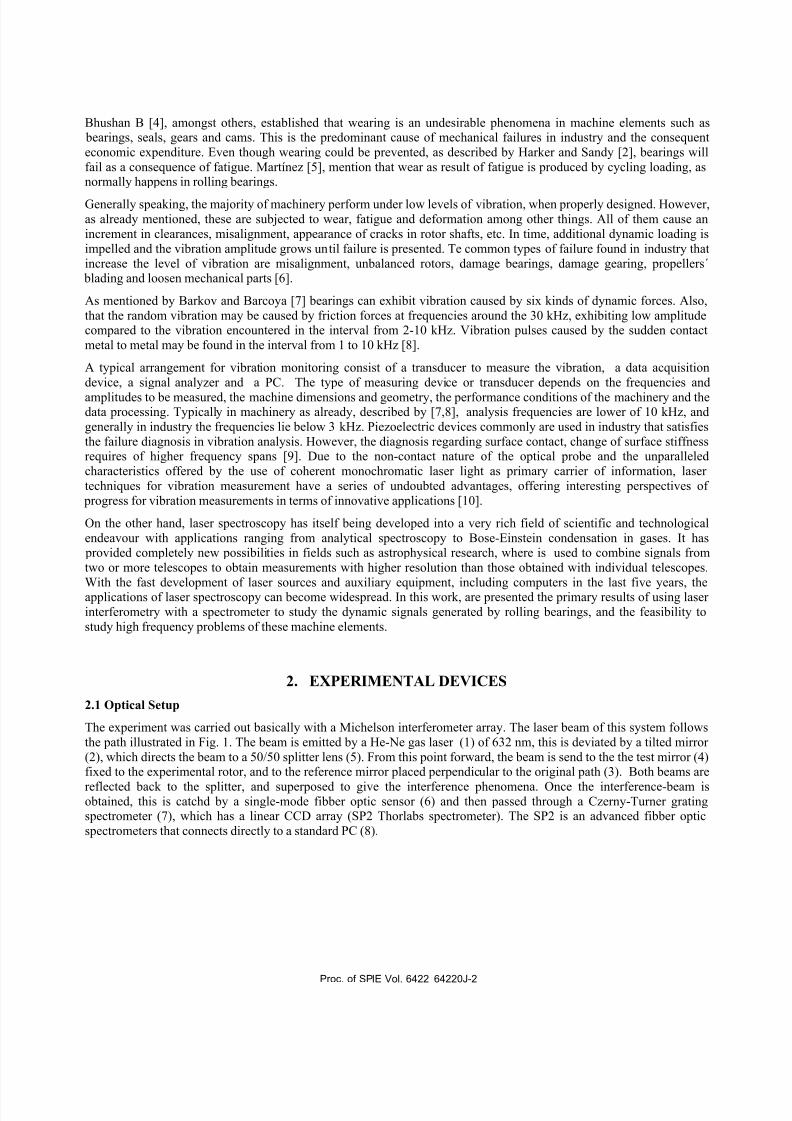
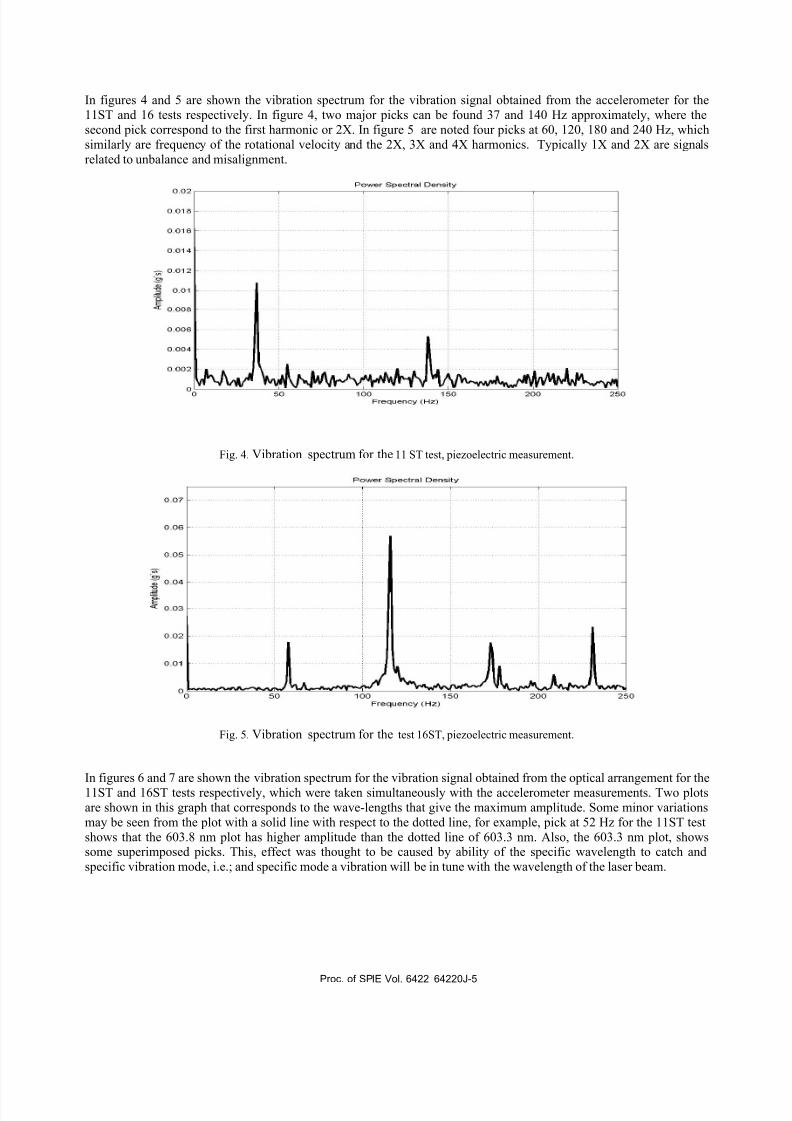
In figures 4 and 5 are shown the vibration spectrum for the vibration signal obtained from the accelerometer for the
11ST and 16 tests respectively. In figure 4, two major picks can be found 37 and 140 Hz approximately, where the
second pick correspond to the first harmonic or 2X. In figure 5 are noted four picks at 60, 120, 180 and 240 Hz, which
similarly are frequency of the rotational velocity and the 2X, 3X and 4X harmonics. Typically 1X and 2X are signals
related to unbalance and misalignment.
Fig. 4. Vibration spectrum for the 11 ST test, piezoelectric measurement.
Fig. 5. Vibration spectrum for the test 16ST, piezoelectric measurement.
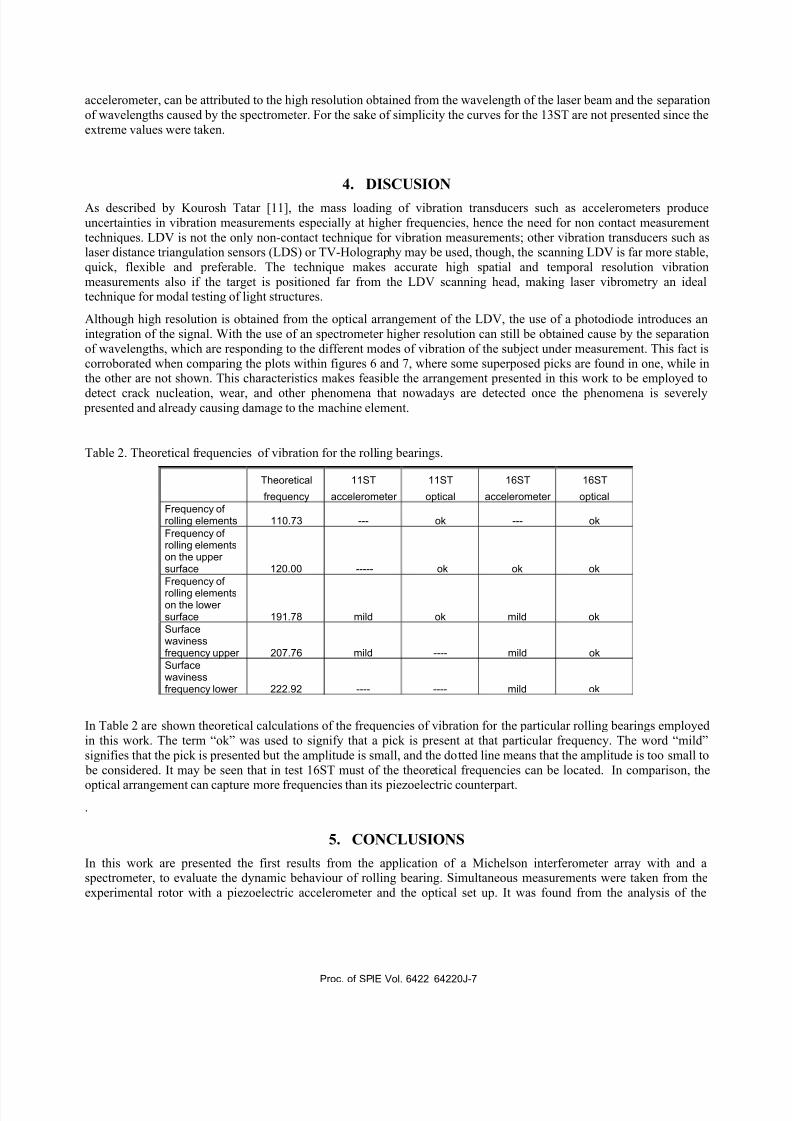
In figures 6 and 7 are shown the vibration spectrum for the vibration signal obtained from the optical arrangement for the
11ST and 16ST tests respectively, which were taken simultaneously with the accelerometer measurements. Two plots
are shown in this graph that corresponds to the wave-lengths that give the maximum amplitude. Some minor variations
may be seen from the plot with a solid line with respect to the dotted line, for example, pick at 52 Hz for the 11ST test
shows that the 603.8 nm plot has higher amplitude than the dotted line of 603.3 nm. Also, the 603.3 nm plot, showssome superimposed picks. This, effect was thought to be caused by ability of the specific wavelength to catch and
specific vibration mode, i.e.; and specific mode a vibration will be in tune with the wavelength of the laser beam.
Proc. of SPIE Vol. 6422 64220J-5

8/8/2019 Copia Proceedings of Spie
http://slidepdf.com/reader/full/copia-proceedings-of-spie 6/8
5 0 0
4 8 0
4 0 0
3 8 0
3 0 0
2 5 0
2 0 0
1 5 0
1 0 0
5 0
0 1 0 2 0 3 0 4 0 5 0 0 0 7 0 8 0 0 0 1 0 0 1 1 0 1 2 0 1 3 0 1 4 0 1 5 0 1 0 0 1 7 0 1 8 0 I S O 2 0 0 2 1 0 2 2 0 2 3 0 2 4 0
F r e ( I L I O I I C V I H Z I
A
e
-
--a C
rC =--.- -- —-—=-ca
—--—-
Z
_
-
--
In these figures it can laso be noted that the maximum picks are found at 52 and a 198 Hz for the 11ST and 16ST tests
respectively. Comparison between figure 4 and 6 shows that the maximum amplitude picks of figure 4, also appear at
figure 6. Similar behaviour can be found from comparison of figures 5 and 7.
Fig. 6. Vibration spectrum for the 11ST test, optical measurement: (a) --- 603.3 nm, (b) 603.8nm.
Fig. 7. Vibration spectrum for the 16ST test, optical measurement: : (a) --- 603.3 nm, (b) 603.8nm.
It is clear that in the optical measurement plots, a number of picks appear that are not present in the accelerometer
measurements. The ability of the optical measurement to pick up more detailed spectrum in comparison with the
Proc. of SPIE Vol. 6422 64220J-6
8/8/2019 Copia Proceedings of Spie
http://slidepdf.com/reader/full/copia-proceedings-of-spie 7/8
accelerometer, can be attributed to the high resolution obtained from the wavelength of the laser beam and the separation
of wavelengths caused by the spectrometer. For the sake of simplicity the curves for the 13ST are not presented since the
extreme values were taken.
4. DISCUSION
As described by Kourosh Tatar [11], the mass loading of vibration transducers such as accelerometers produce
uncertainties in vibration measurements especially at higher frequencies, hence the need for non contact measurement
techniques. LDV is not the only non-contact technique for vibration measurements; other vibration transducers such aslaser distance triangulation sensors (LDS) or TV-Holography may be used, though, the scanning LDV is far more stable,
quick, flexible and preferable. The technique makes accurate high spatial and temporal resolution vibration
measurements also if the target is positioned far from the LDV scanning head, making laser vibrometry an idealtechnique for modal testing of light structures.
Although high resolution is obtained from the optical arrangement of the LDV, the use of a photodiode introduces an
integration of the signal. With the use of an spectrometer higher resolution can still be obtained cause by the separation
of wavelengths, which are responding to the different modes of vibration of the subject under measurement. This fact is
corroborated when comparing the plots within figures 6 and 7, where some superposed picks are found in one, while inthe other are not shown. This characteristics makes feasible the arrangement presented in this work to be employed to
detect crack nucleation, wear, and other phenomena that nowadays are detected once the phenomena is severely presented and already causing damage to the machine element.
Table 2. Theoretical frequencies of vibration for the rolling bearings.
Theoretical 11ST 11ST 16ST 16ST
frequency accelerometer optical accelerometer optical
Frequency of rolling elements 110.73 --- ok --- ok
Frequency of rolling elementson the upper surface 120.00 ----- ok ok ok
Frequency of rolling elementson the lower surface 191.78 mild ok mild ok
Surfacewavinessfrequency upper 207.76 mild ---- mild ok
Surfacewavinessfrequency lower 222.92 ---- ---- mild ok
In Table 2 are shown theoretical calculations of the frequencies of vibration for the particular rolling bearings employed
in this work. The term “ok” was used to signify that a pick is present at that particular frequency. The word “mild”
signifies that the pick is presented but the amplitude is small, and the dotted line means that the amplitude is too small to
be considered. It may be seen that in test 16ST must of the theoretical frequencies can be located. In comparison, the
optical arrangement can capture more frequencies than its piezoelectric counterpart.
.
5. CONCLUSIONS
In this work are presented the first results from the application of a Michelson interferometer array with and aspectrometer, to evaluate the dynamic behaviour of rolling bearing. Simultaneous measurements were taken from the
experimental rotor with a piezoelectric accelerometer and the optical set up. It was found from the analysis of the
Proc. of SPIE Vol. 6422 64220J-7

8/8/2019 Copia Proceedings of Spie
http://slidepdf.com/reader/full/copia-proceedings-of-spie 8/8
measurements that the use of the spectrometer at the end of the optical arrangement provides with a higher resolution
than the one obtained with the accelerometer. It was also found, that different wavelengths of the laser beam can catch
different vibration modes since and that might depend that the laser beam could reach the same frequency or harmonic of
the mode of vibration. Generally speaking, the optical arrangement shows better resolution and it is feasible to be
emplyed to further studies related to contact and surface problems in rolling bearings.
REFERENCES
1. IRD Mechanalysis, “Vibration Technology”, Columbus, Ohio, 1988, Cap. 6.
2. Harker R. G. Y. Sandy J. L., “Rolling Element Bearing Monitoring and Diagnostics Techniques”, Transaction of ASME; Journal of Engineering for Gas Turbines and Power, Vol. 111, April 1989, pp. 251-256 .
3. Steven Liang, Thomas Kurfess, Y. Steven Danyluk, “Dynamic metrology as a bearing wear diagnostic”, (Georgia
Tech).
4. Bhushan Bharat , Introduction to Tribology,: John Wiley & Sons, 2002
5. Martínez Pérez Francisco, LA TRIBOLOGIA: Ciencia y técnica para el mantenimiento, Editorial Limusa, 1997.
6. Singiresu S. Rao, Mechanical Vibrations, Addison-Wesley Publishing Company, 1995.
7. Barkov A. Y. Barkova N, www.vibanalysis.co.uk .
8. Wowk V, “Machinery vibration: measurement and Analysis”, McGraw-Hill, 1991.
9. José María Rodríguez Lelis, Eduardo Ramírez Flores, Jorge Colín Ocampo, DLC COATING OF ROLLINGBEARINGS BY TRIBOADHESION ADN ITS EFFECT ON THEIR DYNAMIC RESPONSE, Proceedings of
WTC2005 STLE/ASME, September 12-16, 2005, Washintong, D. C., USA.
10. M. Grigioni, C. Daniele, U. Morbiducci, C. Del Gaudio, G. D’Avenio, A. Balducci, D. Di Meo, V. Barbaro, Laser
Vibrometry as investigational tool for mechanical heart valves kinematics , preliminary investigation,.
11. Kourosh Tatar, Machine tool vibrations and violin sound fields studied using laser vibrometry, Ph.D Thesis, LuleåUniversity of Technology, 2006.
Proc. of SPIE Vol. 6422 64220J-8