Copernicus Climate Change...
22
Full Technical Report: Case Study Name Copernicus Climate Change Service Technical Report: Towards a climate proof brewery chain with Heineken Hasse Goosen Wageningen Environmental Research
Transcript of Copernicus Climate Change...

Full Technical Report: Case Study Name
Copernicus Climate Change Service
Technical Report:
Towards a climate proof brewery chain with Heineken
Hasse Goosen
Wageningen Environmental Research

Full Technical Report: Case Study Name
Copernicus Climate Change Service
Summary The Copernicus Climate Change Service (C3S) Sectorial Information Service (SIS) for Water is helping the largest brewery in Europe, Heineken, towards its goal to be climate neutral by 2020. Part of this is environmentally responsible water management.
The Heineken brewery based in Zoeterwoude, in the Netherlands, has joined forces with the University of Wageningen and the Provincial government of South Holland in a cooperative called Green Circles. Wageningen Environmental Research interpreted C3S SIS Water data to make projections on the future supply and quality of the water in this region used for brewing the famous Heineken beer. The local river water is stored and purified by the dunes in South Holland before it reaches the brewery. However, climate change could threaten the quality and supply of this water as heavy rainfall-induced flooding or dry periods could occur more frequently in future.
Within the project we used a range of data to create “story maps” comprising GIS maps and artist impressions. Using these, the Green Circles partners can plan a more responsible approach to business and environmental development.
Mapped graphically, these data help the wider community to understand climate change impacts at a pan-European level, and as such is a critical add-on to the local data, such as meteorological information. The agricultural sector, nature organisations, industry and companies that provide drinking water also benefit from this information. Water used for drinking or industrial processes in the Randstad area of the Netherlands depends on water flow in the catchment of the Meuse. The C3S SIS Water climate impact indicators were used to analyse water flows during the summer. Key issues are soil subsidence, salinization, maintaining a sustainable transport system, biodiversity and availability of sufficient clean drinking water in the future.
The workshops that were organized in the context of the Copernicus SWICCA project, have led to the identification of an icon project ‘Grote Polder’. The partners of the Grote Polder Industrial Zone, including the Heineken brewery, have the ambition to develop a climate proof industrial zone.
Copernicus Climate Change Service
Full Technical Report: Case Study Name
Contents Introduction............................................................................................... 1
Step 1: Identify dreams and establishing a joint ambition ............................... 2
Step 2: Data collection and Climate Impact Assessment .................................. 4
Step 3: Analysing and discussing the results with the stakeholders ................... 9
Step 4. Visualization using Story Maps ........................................................ 12
Step 5: Follow up ..................................................................................... 14
Conclusions ............................................................................................. 15
References .............................................................................................. 16
Annex I: Overview presentation of the climate impacts for the region .......... 17
Copernicus Climate Change Service
Full Technical Report: Future Proof Region and Brewery chain 1
Introduction The Heineken brewery based in Zoeterwoude, in the Netherlands, has joined forces with Wageningen Environmental Research and the Provincial government of South Holland in a cooperative called Green Circles. A climate-neutral Heineken brewery, a sustainable economy, and a pleasant living environment in the region of Zoeterwoude in the Netherlands are the ambitions to which Green Circles is dedicating its efforts. It does so by taking nature as its starting point and setting up programs based around the topics of energy, water, raw materials, mobility, and the environment.
The Green Circles initiative welcomed the partnership with Copernicus through the SWICCA project. The main purpose of the collaboration was to raise awareness of the issue of climate change. For the stakeholders in the project, climate change still is something unclear and far away. However, climate change will have a range of effects on the area. The current drinking water supply in the Randstad region of the Netherlands is dependent on river water. Climate change could threaten the water supply, as periods with extremely low discharges may occur more frequently in future. Drainage of surrounding agricultural land will further increase soil subsidence. This will have a negative impact on water quality and cause loss of biodiversity. The Green Circles case study seeks innovative solutions and will address these in an integrated, holistic way. Sustainable development and business development will go hand in hand.
The goal of the case study is to develop a sense of urgency and create awareness of the long term impacts of climate change on the region. We used the C3S indicators in addition to local data on climate change impacts. The impacts were visualized in a user friendly way. Three workshops were held to share and discuss our findings.
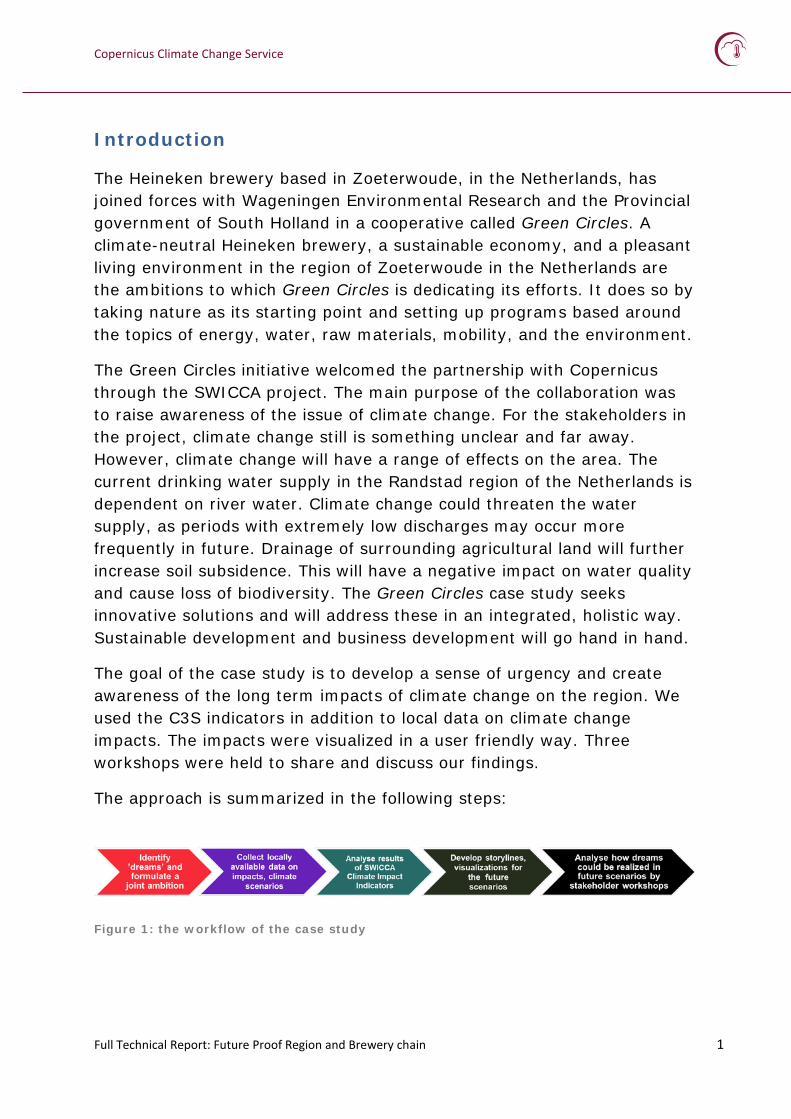
The approach is summarized in the following steps:
Figure 1: the workflow of the case study

Copernicus Climate Change Service
Full Technical Report: Future Proof Region and Brewery chain 2
Step 1: Identify dreams and establishing a joint ambition
The users are central in the case study. Before selecting Copernicus data and indicators, a first meeting was held to understand the ambitions and goals of the stakeholders involved. Stakeholders involved are: the Heineken brewery, the province of South Holland, the drinking water companies and the water authority (Hoogheemraadschap Rijnland).
A workshop was held where all stakeholder were invited to share their dreams. Questions addressed were: what do I want, why do I want that, what is the reason behind that, and so on. This resulted in the underlying objectives and those often reveal similarities between the different parties. The workshop approach used a technique to stimulate collaboration and to create a joint ambition. It also sets stakeholders in a positive frame of mind.
All partners in the Green Circles initiative share the ambition to work towards a sustainable, climate robust and healthy living environment. This requires water to be available and to be of sufficient water quality. Heineken’s production process requires water, farming in the area requires water and water is a key asset to the living environment. Water is thus a key resource.
After the first workshop a generic ambition was formulated:
Box 1: the key water ambitions for the Green Circles as formulated by the stakeholders
Ready for Climate Change
In 2030, the area is capable of dealing with the effects of drought, heat and heavy rainfall. There is water of good quality all year round. The whole year is sufficient good quality water available to consumers and businesses. We achieve this by moving the intake points for water from rivers upstream and create an additional intake from the Rhine. This makes our region is less dependent on the Meuse. We make efficient use of brackish and fresh groundwater, rainwater and water storage.
Flood proof
The area and all residents are safe from major flooding from the sea or rivers. We apply the multilayer security principle to: We seek security not only in high or wide dikes and dunes, but also in a spatial use of dikes and their slope. Centers where many people live and where there are major economic interests are protected separately.

Copernicus Climate Change Service
Full Technical Report: Future Proof Region and Brewery chain 3
Prevent urban flooding
Flooding is prevented or restricted. There are two large peak storage in our area, which can absorb water temporarily when needed.
Land subsidence
In the old peat-built cities, subsidence, with all its negative consequences, will be minimized through a combination of smart water management, adequate infrastructure and water storage.
Companies and water boards work together
The clean surface contributes to the development and maintenance of business in the area. Businesses have access to good quality water. With smart technologies, companies win back chemicals from their water, before discharging it. The 'water footprint' of enterprises and agriculture will be reduced. Heineken is now a water supplier: process water is purified in wetlands
Water brings city to life
The water is returned to the city and make the city climate proof. Ponds, tanks and rainwater backyards catch the heavy rain and provide coolness to the city. Nature is improved in the city.
Bathing water everywhere
The bathing water is clean and suitable for swimming. The sediments are clean. Rhine is significantly improved by minimizing inputs from agriculture and other causes of pollution such as pesticides, nitrogen, phosphate, medicinal and micro plastics. The fish stock is rich in species. Migratory fish can pass the pumping stations, sluices and pumping stations.

Copernicus Climate Change Service
Full Technical Report: Future Proof Region and Brewery chain 4
Step 2: Data collection and Climate Impact Assessment
In the Netherlands, an authorized set of climate scenarios is prepared by the met office (KNMI), which contains ensembles of downscaled regional climate models. Every 6-8 years the scenarios are updated. We collected existing climate data from the Dutch met office (KMNI scenarios 2014). Also the province of South Holland developed a regional Climate Impact Atlas using the climate scenarios for the Netherlands. All relevant impact information was gathered from this regional climate atlas. A summary of the key indicators was prepared (see annex I). In addition to the information at local level, the C3S SIS Water demonstrator was used to generate information about the supra-national consequences of climate change. We have analyzed the indicators on the demonstrator and selected a number of maps and graphs for a presentation that was given on the first stakeholder meeting about climate change in the area. We used data from this contract but also local data from the provincial Climate Impact Atlas. The C3S SIS Water proved to be especially useful to bring in the European perspective. For example, drinking water that is being used by the brewery is taken from an inlet point along the river Meuse. The river flow in the KNMI scenario’s was used to identify possible differences or consistencies in the crucial climate indicators (like tropical days, consecutive dry days, summer rainfall and river discharges).
The C3S SIS water indicators were used to analyze water flows during the summer period. Moreover, the EU perspective is also very relevant for the agriculture and also for the tourism sector. Mapped graphically, these data help to understand the impact at a pan-European level, and as such is a critical add-on to the local data, such as meteorological information. The agriculture sector, nature organizations, industry and companies that provide drinking water also benefit from this information.
Water used for drinking or industrial processes in the Randstad area of the Netherlands depends on water flow in the catchment of the Meuse. The C3S SIS water indicators were used to analyse water flows during the summer. Key issues are soil subsidence, salinization, maintaining a sustainable transport system, biodiversity and availability of sufficient clean drinking water in the future.
The C3S SIS for water gave an overview across Europe that was missing from the local climate atlas data. This yielded valuable insights into how regional fluctuations in water resources could influence local levels.
Some critical remarks were also raised about the provided indicators. At first the indicators seemed too general and not detailed enough to support local decision making processes. The Dutch climate scenario’s show more detail and have been
Copernicus Climate Change Service
Full Technical Report: Future Proof Region and Brewery chain 5
approved by policy makers. The regional climate atlas has also a more detailed scope than what the C3S SIS water service can provide.
A report was produced (in Dutch) summarizing what climate change means for the region of the Heineken Brewery in Zoeterwoude (http://www.groenecirkels.nl/upload_mm/4/e/7/4a24223c-c92e-4dc0-b0c6-df226e830953_Workshopverslag%20Klimaat%20Zoeterwoude%20Groene%20Cirkels-mrt2017.pdf). Moreover all indicators were presented in a powerpoint presentation that was discussed during the stakeholder meeting (Annex I).
The 10 warmest years ever measured have occurred in the past 12 years. Further to this, 2016 is on its way to becoming the warmest year since the start of global measurements (http://public.wmo.int/en/media/press-release/provisional-wmo-statement-status-of-global- climate-2016).
Climate change leads to different types of effects: changing precipitation intensities, drought and heat with related changes in risk, utilization and biodiversity. The frequency of days with more than 30mm rain has already doubled since the old reference period of 2006-2010 (STOWA, 2016). The precipitation statistics in the Netherlands have already been adapted to the new climate. We are already in the middle of the new climate. Damage caused by extreme weather has increased, and insurers are becoming increasingly alarmed by the increase in damage claims. The year 2016 suffered extreme damage suffered especially in the regions of Limburg and North Brabant in May / June (NB current estimated damage 675 mln Euro, https://www.verzekeraars.nl/verzekeringsbranche/ Figures / Documents / InsuredVanCounts / 2016 / Insured% 20of% 20Count% 202016% 20-% 20NL.pdf).
Copernicus Climate Change Service
Full Technical Report: Future Proof Region and Brewery chain 6
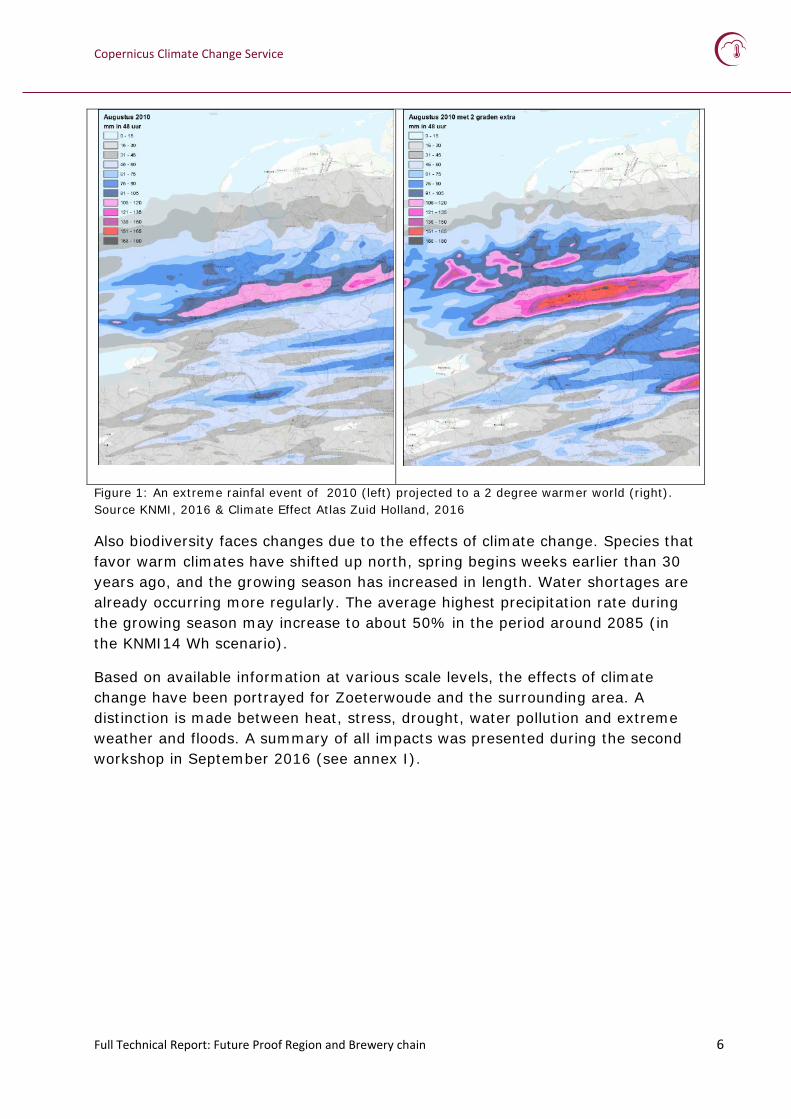
Figure 1: An extreme rainfal event of 2010 (left) projected to a 2 degree warmer world (right). Source KNMI, 2016 & Climate Effect Atlas Zuid Holland, 2016
Also biodiversity faces changes due to the effects of climate change. Species that favor warm climates have shifted up north, spring begins weeks earlier than 30 years ago, and the growing season has increased in length. Water shortages are already occurring more regularly. The average highest precipitation rate during the growing season may increase to about 50% in the period around 2085 (in the KNMI14 Wh scenario).
Based on available information at various scale levels, the effects of climate change have been portrayed for Zoeterwoude and the surrounding area. A distinction is made between heat, stress, drought, water pollution and extreme weather and floods. A summary of all impacts was presented during the second workshop in September 2016 (see annex I).

Copernicus Climate Change Service
Full Technical Report: Future Proof Region and Brewery chain 7
Figure 2: The changes in yearly precipitation shows how the south of Europee will become more drought prone (http://swicca.climate.copernicus.eu/)

Copernicus Climate Change Service
Full Technical Report: Future Proof Region and Brewery chain 8
Figure 3: Using the SWICCA climate service portal (http://swicca.climate.copernicus.eu/) we demonstrated how low flows in the river Meuse catchment are likely to drop under climate change (RCP8.5). A clear drop is predicted by the three models in the summer period.

Copernicus Climate Change Service
Full Technical Report: Future Proof Region and Brewery chain 9
Step 3: Analysing and discussing the results with the stakeholders During this step, the results from the impact assessment were confronted with the ambitions of the region. During the workshop we worked in parallel groups to discuss the potential consequences of climate change.
A matrix (on following page) was filled in that highlights how climate change interacts with the activities and land use functions in the area.

Copernicus Climate Change Service
Full Technical Report: Future Proof Region and Brewery chain 10
Heat Droughts Extreme rainfall River flooding
Risks Opportunities Risks Opportunities Risks Opportunities Risks Opportunities
Companies Working environment Labour productivity Energy demand in summer
Energy demand in winter Increasing beer consumption
Soil subsidence causing damage to houses, infrastructure and sewage systems Water shortages in the growing season
Floods Blue-green measures improve the quality of industrial zones
Value of assets decreases Energy supply, infrastructure
Farmers Soil subsidance Diseases Heat stress
Length of the growing season increases
Water availability and irrigation costs
New crops Competitive advantage over the south of Europe Water services (buffering)
Inundation and storm and hail damage
Nature organizations
Insufficient migration opportunities of species
Demand for nature areas for recreation will increase
Water quality Nature area scan provide water storage
Water quality issues
Ecosystem services
Urban environment
Heat stress and energy use Health
Energy demand in winter Blue green infrastructures improve the quality of the city Green roofs
Subsidance causes damages
Damage to houses
Blue green urban spaces
Damages to properties
Recreation Increased demand for outdoor recreation; Water quality issues
More warm days
Water quality Demand for ecxosystem services
Ecosystem services
Copernicus Climate Change Service
Full Technical Report: Future Proof Region and Brewery chain 11
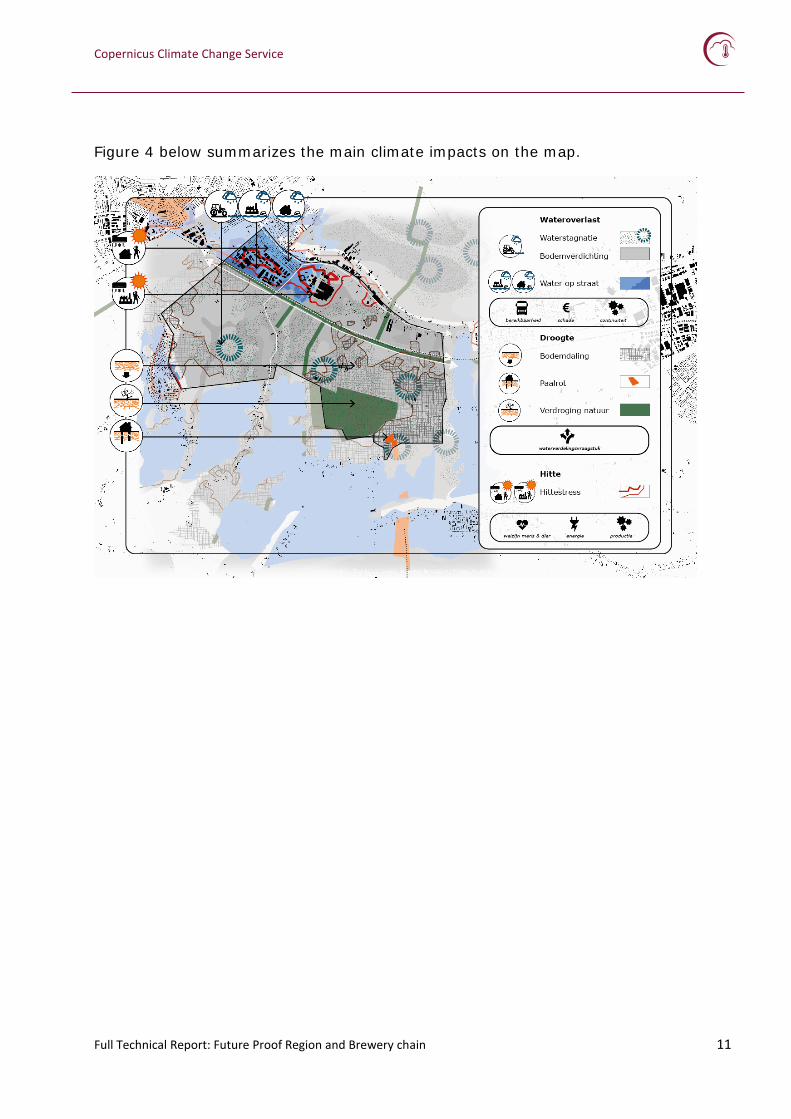
Figure 4 below summarizes the main climate impacts on the map.

Copernicus Climate Change Service
Full Technical Report: Future Proof Region and Brewery chain 12
Step 4. Visualization using Story Maps
The stakeholders involved indicated a clear preference for user friendly, easy to use information presentation of the outcomes of the case study. The main purpose of the case study activities was to raise awareness and a sense of urgency among all partners involved. This means that not so much the technical experts, but rather the broad group of non-climate experts needed to be reached.
We presented all results in ‘Story Maps’. The Story Map format is a new and appealing way to tell stories of climate change. Rather than presenting a report or map viewer where the users have to navigate themselves, the story map guides the user through the story in a natural way. It combines interactive climate content (maps, figures, videos) on one side, with short explanatory texts on the other side. Users can navigate step by step through the story in their web browser.
We used visualization tools such as the climate lens. The climate lens allows users to see impact of climate change in the lens (figure 1). Users can zoom and move the lens or slide the bar (figure 2) to see the effects for the area of their interest. These techniques can be used to visualize available climate indicators in the project.
1) The climate lens gives a sneak preview of the future climate 2) By sliding the bar; you see the effects of 2ᵒ C warming
Copernicus Climate Change Service
Full Technical Report: Future Proof Region and Brewery chain 13
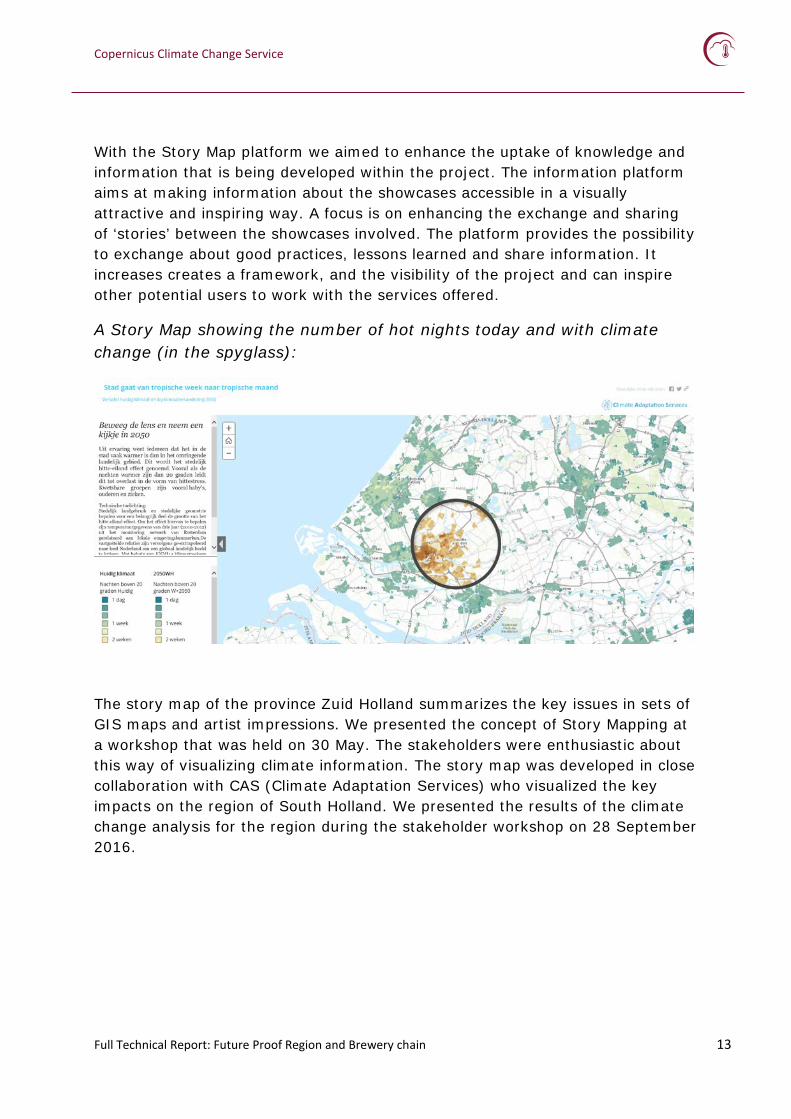
With the Story Map platform we aimed to enhance the uptake of knowledge and information that is being developed within the project. The information platform aims at making information about the showcases accessible in a visually attractive and inspiring way. A focus is on enhancing the exchange and sharing of ‘stories’ between the showcases involved. The platform provides the possibility to exchange about good practices, lessons learned and share information. It increases creates a framework, and the visibility of the project and can inspire other potential users to work with the services offered.
A Story Map showing the number of hot nights today and with climate change (in the spyglass):
The story map of the province Zuid Holland summarizes the key issues in sets of GIS maps and artist impressions. We presented the concept of Story Mapping at a workshop that was held on 30 May. The stakeholders were enthusiastic about this way of visualizing climate information. The story map was developed in close collaboration with CAS (Climate Adaptation Services) who visualized the key impacts on the region of South Holland. We presented the results of the climate change analysis for the region during the stakeholder workshop on 28 September 2016.
Copernicus Climate Change Service
Full Technical Report: Future Proof Region and Brewery chain 14
Step 5: Follow up
A final stakeholder workshop was organized on 24 January 2017. Wageningen Environmental Research prepared a report and a presentation to give an overview of climate impacts for the region, including some of the C3S SIS Water data (aridity, seasonal river flows, temperature). In groups we discussed with the stakeholders how the ’dreams’ that were identified during the earlier workshop are potentially being influenced by climate change under the various scenarios (expressed in the story maps). The focus of the workshop was to establish a joint ambition. Concrete ideas came out, such as a water storage facility that uses the roof area of the various buildings from the industrial zone. Ambassadors to carry the ideas forward were nominated.
One of the ideas coming out of the workshop was to develop a plan for a climate proof industrial area ‘Grote Polder’. This project is now being developed as an ‘icon project’ under the Green Circles initiative. Various designs of measures will be developed through a series of design sessions.

Copernicus Climate Change Service
Full Technical Report: Future Proof Region and Brewery chain 15
Conclusions
The C3S SIS Water contract contributed greatly to raising awareness and a sense of urgency to take climate change into account. The stakeholders in the Green Circles initiative, with Heineken as a key partner, have expressed their intentions to develop an icon project for the Grote Polder industrial area. Participants of both workshops expressed their appreciations on the in the climate visualizations which improved insight in local site specific consequences. In particular, the “story map” raised the interest of the partners. The work in this contract contributed to the development story maps, to translate the indicators to site specific consequences. We organized workshops where local stakeholders discussed potential site specific effects of the indicators. We involved a landscape architect to facilitate the workshop and to translate ideas into designs for the area. We learnt that the climate impact indicators need to be translated (interpreted) and visualized to understand the impacts at local level. The stakeholders involved appreciated the complete overview, covering the local and European perspective. As a result a new series of workshops will be organized, targeting specific target groups in the region (agriculture sector, nature organizations, industrial area, drinking water company). Based on all workshops we will finalize story lines for the various sectors. The results will be integrated in the report and highlights will be included in the story map of the Province of South Holland.

Copernicus Climate Change Service
Full Technical Report: Future Proof Region and Brewery chain 16
References
Story Map Climate Change Province South Holland: https://pzh.maps.arcgis.com/apps/MapSeries/index.html?appid=64c6ea0ab8944935afe44ea93d9739de
Report: Climate Change in Grote Polder and Polder Groenendijk (in Dutch): http://www.groenecirkels.nl/upload_mm/4/e/7/4a24223c-c92e-4dc0-b0c6-df226e830953_Workshopverslag%20Klimaat%20Zoeterwoude%20Groene%20Cirkels-mrt2017.pdf

Copernicus Climate Change Service
Full Technical Report: Future Proof Region and Brewery chain 17
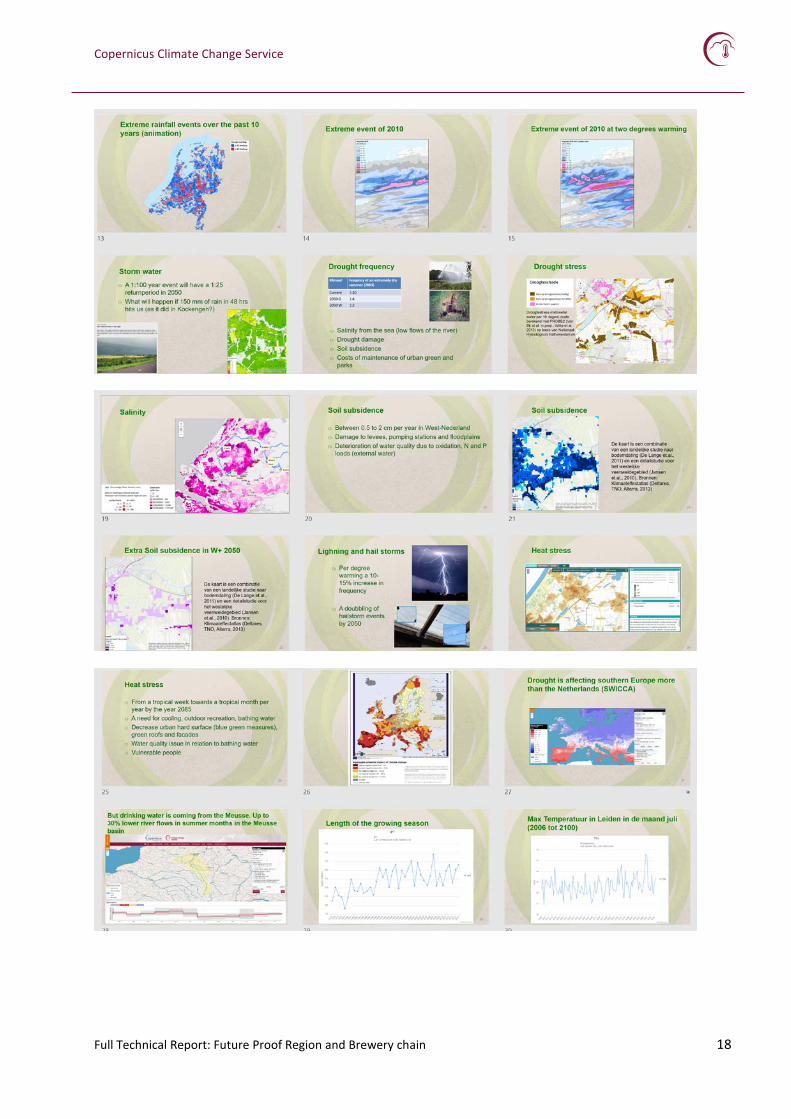
Annex I: Overview presentation of the climate impacts for the region
Copernicus Climate Change Service
Full Technical Report: Future Proof Region and Brewery chain 18

Copernicus Climate Change Service
Full Technical Report: Future Proof Region and Brewery chain 19